Smart Approach for the Design of Highly Selective Aptamer-Based Biosensors

 , ,
, ,  , and
, and
Abstract
:1. Introduction
2. Materials and Methods
2.1. The Smart-SELEX Approach
2.2. Machine Learning Model
2.2.1. Data Processing
2.2.2. Model Architecture—Machine Learning
2.2.3. Optimization of Hyperparameters
2.3. Preparing the Library File
2.4. Docking
2.5. Materials and Reagents
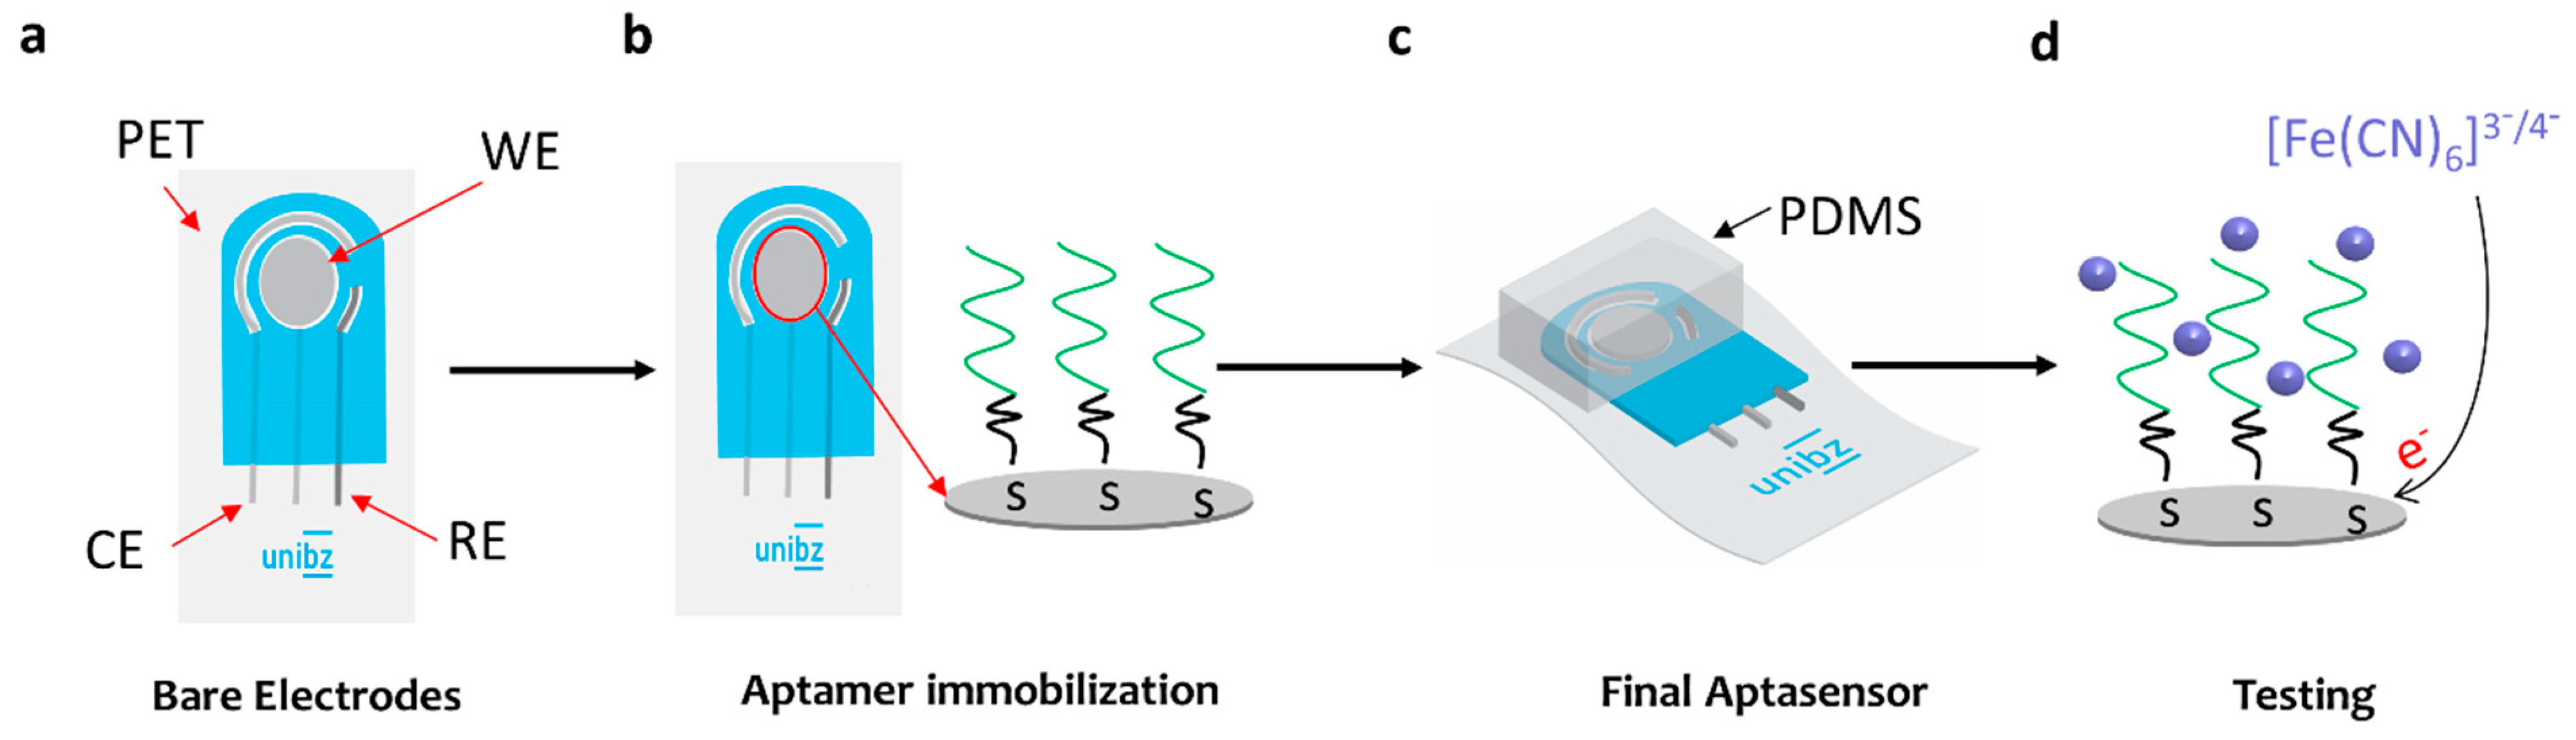
2.6. Fabrication of the Aptasensor
2.7. Electrochemical Measurements
2.8. Chemical Analysis
2.9. Molecular Dynamics Simulations
3. Results
3.1. Smart-Selex
3.2. Aptasensor Performance
3.3. Molecular Dynamic Simulation
3.4. Selectivity
4. Conclusions
Supplementary Materials
Author Contributions
Funding
Institutional Review Board Statement
Informed Consent Statement
Data Availability Statement
Acknowledgments
Conflicts of Interest
References
- Schreiber, S.L. A Chemical Biology View of Bioactive Small Molecules and a Binder-Based Approach to Connect Biology to Precision Medicines. Isr. J. Chem. 2019, 59, 52–59. [Google Scholar] [CrossRef] [PubMed]
- Alahi, M.E.E.; Mukhopadhyay, S.C. Detection Methodologies for Pathogen and Toxins: A Review. Sensors 2017, 17, 1885. [Google Scholar] [CrossRef] [PubMed] [Green Version]
- Pereira De Oliveira, L.; Rocha, D.P.; Reis De Araujo, W.; Abarza Muñoz, R.A.; Longo Cesar Paixão, T.R.; Oliveira Salles, M. Forensics in Hand: New Trends in Forensic Devices (2013–2017). Anal. Methods 2018, 10, 5135–5163. [Google Scholar] [CrossRef]
- Cesewski, E.; Johnson, B.N. Electrochemical Biosensors for Pathogen Detection. Biosens. Bioelectron. 2020, 159, 112214. [Google Scholar] [CrossRef] [PubMed]
- Rajapaksha, P.; Elbourne, A.; Gangadoo, S.; Brown, R.; Cozzolino, D.; Chapman, J. A Review of Methods for the Detection of Pathogenic Microorganisms. Analyst 2019, 144, 396–411. [Google Scholar] [CrossRef] [PubMed]
- Dai, B.; Yin, C.; Wu, J.; Li, W.; Zheng, L.; Lin, F.; Han, X.; Fu, Y.; Zhang, D.; Zhuang, S. A Flux-Adaptable Pump-Free Microfluidics-Based Self-Contained Platform for Multiplex Cancer Biomarker Detection. Lab Chip 2021, 21, 143–153. [Google Scholar] [CrossRef]
- Elledge, S.K.; Zhou, X.X.; Byrnes, J.R.; Martinko, A.J.; Lui, I.; Pance, K.; Lim, S.A.; Glasgow, J.E.; Glasgow, A.A.; Turcios, K.; et al. Engineering Luminescent Biosensors for Point-of-Care SARS-CoV-2 Antibody Detection. Nat. Biotechnol. 2021, 39, 928–935 . [Google Scholar] [CrossRef]
- Rezaei, M.; Razavi Bazaz, S.; Zhand, S.; Sayyadi, N.; Jin, D.; Stewart, M.P.; Ebrahimi Warkiani, M. Point of Care Diagnostics in the Age of COVID-19. Diagnostics 2020, 11, 9. [Google Scholar] [CrossRef]
- Jain, S.; Nehra, M.; Kumar, R.; Dilbaghi, N.; Hu, T.Y.; Kumar, S.; Kaushik, A.; Li, C.-Z. Internet of Medical Things (IoMT)-Integrated Biosensors for Point-of-Care Testing of Infectious Diseases. Biosens. Bioelectron. 2021, 179, 113074. [Google Scholar] [CrossRef]
- Cohen, J.; Kupferschmidt, K. Labs Scramble to Produce New Coronavirus Diagnostics. Science 2020, 367, 727. [Google Scholar] [CrossRef]
- Rodriguez-Manzano, J.; Malpartida-Cardenas, K.; Moser, N.; Pennisi, I.; Cavuto, M.; Miglietta, L.; Moniri, A.; Penn, R.; Satta, G.; Randell, P.; et al. Handheld Point-of-Care System for Rapid Detection of SARS-CoV-2 Extracted RNA in under 20 Min. ACS Cent. Sci. 2021, 7, 307–317. [Google Scholar] [CrossRef] [PubMed]
- Rosenthal, P.J. The Importance of Diagnostic Testing during a Viral Pandemic: Early Lessons from Novel Coronavirus Disease (COVID-19). Am. J. Trop. Med. Hyg. 2020, 102, 915–916. [Google Scholar] [CrossRef] [Green Version]
- Vandenberg, O.; Martiny, D.; Rochas, O.; van Belkum, A.; Kozlakidis, Z. Considerations for Diagnostic COVID-19 Tests. Nat. Rev. Microbiol. 2021, 19, 171–183. [Google Scholar] [CrossRef] [PubMed]
- Giovannini, G.; Haick, H.; Garoli, D. Detecting COVID-19 from Breath: A Game Changer for a Big Challenge. ACS Sens. 2021, 6, 1408–1417. [Google Scholar] [CrossRef]
- Zhang, Y.; Lai, B.S.; Juhas, M. Recent Advances in Aptamer Discovery and Applications. Molecules 2019, 24, 941. [Google Scholar] [CrossRef] [PubMed] [Green Version]
- Ellington, A.D.; Szostak, J.W. In Vitro Selection of RNA Molecules That Bind Specific Ligands. Nature 1990, 346, 818–822. [Google Scholar] [CrossRef]
- Kaur, H.; Bruno, J.G.; Kumar, A.; Sharma, T.K. Aptamers in the Therapeutics and Diagnostics Pipelines. Theranostics 2018, 8, 4016–4032. [Google Scholar] [CrossRef]
- Komarova, N.; Kuznetsov, A. Inside the Black Box: What Makes Selex Better? Molecules 2019, 24, 3598. [Google Scholar] [CrossRef] [PubMed] [Green Version]
- Khan, R.; ben Aissa, S.; Sherazi, T.A.; Catanante, G.; Hayat, A.; Marty, J.L. Development of an Impedimetric Aptasensor for Label Free Detection of Patulin in Apple Juice. Molecules 2019, 24, 1017. [Google Scholar] [CrossRef] [PubMed] [Green Version]
- Hassani, S.; Akmal, M.R.; Salek-Maghsoudi, A.; Rahmani, S.; Ganjali, M.R.; Norouzi, P.; Abdollahi, M. Novel Label-Free Electrochemical Aptasensor for Determination of Diazinon Using Gold Nanoparticles-Modified Screen-Printed Gold Electrode. Biosens. Bioelectron. 2018, 120, 122–128. [Google Scholar] [CrossRef]
- Toh, S.Y.; Citartan, M.; Gopinath, S.C.B.; Tang, T.H. Aptamers as a Replacement for Antibodies in Enzyme-Linked Immunosorbent Assay. Biosens. Bioelectron. 2015, 64, 392–403. [Google Scholar] [CrossRef]
- Lipfert, J.; Doniach, S.; Das, R.; Herschlag, D. Understanding Nucleic Acid-Ion Interactions. Annu. Rev. Biochem. 2014, 83, 813–841. [Google Scholar] [CrossRef] [Green Version]
- Gruenke, P.R.; Aneja, R.; Welbourn, S.; Ukah, O.B.; Sarafianos, S.G.; Burke, D.H.; Lange, M.J. Selection and Identification of an RNA Aptamer That Specifically Binds the HIV-1 Capsid Lattice and Inhibits Viral Replication. Nucleic Acids Res. 2022, 50, 1701–1717. [Google Scholar] [CrossRef]
- Freage, L.; Boykoff, N.; Mallikaratchy, P. Utility of Multivalent Aptamers to Develop Nanoscale DNA Devices against Surface Receptors. ACS Omega 2021, 6, 12382–12391. [Google Scholar] [CrossRef]
- Sala, L.; Zerolová, A.; Rodriguez, A.; Reimitz, D.; Davídková, M.; Ebel, K.; Bald, I.; Kočišek, J. Folding DNA into Origami Nanostructures Enhances Resistance to Ionizing Radiation. Nanoscale 2021, 13, 11197–11203. [Google Scholar] [CrossRef]
- Ren, Q.; Ga, L.; Lu, Z.; Ai, J.; Wang, T. Aptamer-Functionalized Nanomaterials for Biological Applications. Mater. Chem. Front. 2020, 4, 1569–1585. [Google Scholar] [CrossRef]
- Arjmandi-Tash, H.; Belyaeva, L.A.; Schneider, G.F. Single Molecule Detection with Graphene and Other Two-Dimensional Materials: Nanopores and Beyond. Chem. Soc. Rev. 2016, 45, 476–493. [Google Scholar] [CrossRef] [Green Version]
- Sze, J.Y.Y.; Ivanov, A.P.; Cass, A.E.G.; Edel, J.B. Single Molecule Multiplexed Nanopore Protein Screening in Human Serum Using Aptamer Modified DNA Carriers. Nat. Commun. 2017, 8, 1552. [Google Scholar] [CrossRef] [Green Version]
- Peinetti, A.S.; Lake, R.J.; Cong, W.; Cooper, L.; Wu, Y.; Ma, Y.; Pawel, G.T.; Toimil-Molares, M.E.; Trautmann, C.; Rong, L.; et al. Direct Detection of Human Adenovirus or SARS-CoV-2 with Ability to Inform Infectivity Using DNA Aptamer-Nanopore Sensors. Sci. Adv. 2021, 7, eabh2848. [Google Scholar] [CrossRef]
- Wang, H.; Wang, Y.; Liu, S.; Yu, J.; Xu, W.; Guo, Y.; Huang, J. An RNA Aptamer-Based Electro-chemical Biosensor for Sensitive Detection of Malachite Green. RSC Adv. 2014, 4, 60987–60994. [Google Scholar] [CrossRef]
- Inam, A.K.M.S.; Angeli, M.A.C.; Douaki, A.; Shkodra, B.; Lugli, P.; Petti, L. An Aptasensor Based on a Flexible Screen-Printed Silver Electrode for the Rapid Detection of Chlorpyrifos. Sensors 2022, 22, 2754. [Google Scholar] [CrossRef] [PubMed]
- Reynaud, L.; Bouchet-Spinelli, A.; Raillon, C.; Buhot, A.S. Sensing with Nanopores and Aptamers: A Way Forward. Sensors 2020, 20, 4495. [Google Scholar] [CrossRef] [PubMed]
- Raveendran, M.; Lee, A.J.; Sharma, R.; Wälti, C.; Actis, P. Rational Design of DNA Nanostructures for Single Molecule Biosensing. Nat. Commun. 2020, 11, 4384. [Google Scholar] [CrossRef] [PubMed]
- Ren, R.; Wang, X.; Cai, S.; Zhang, Y.; Korchev, Y.; Ivanov, A.P.; Edel, J.B. Selective Sensing of Proteins Using Aptamer Functionalized Nanopore Extended Field-Effect Transistors. Small Methods 2020, 4, 2000356. [Google Scholar] [CrossRef]
- Cai, S.; Sze, J.Y.Y.; Ivanov, A.P.; Edel, J.B. Small Molecule Electro-Optical Binding Assay Using Nanopores. Nat. Commun. 2019, 10, 1797. [Google Scholar] [CrossRef] [PubMed] [Green Version]
- McKeague, M.; McConnell, E.M.; Cruz-Toledo, J.; Bernard, E.D.; Pach, A.; Mastronardi, E.; Zhang, X.; Beking, M.; Francis, T.; Giamberardino, A.; et al. Analysis of In Vitro Aptamer Selection Parameters. J. Mol. Evol. 2015, 81, 150–161. [Google Scholar] [CrossRef] [PubMed]
- Zhuo, Z.; Yu, Y.; Wang, M.; Li, J.; Zhang, Z.; Liu, J.; Wu, X.; Lu, A.; Zhang, G.; Zhang, B. Recent Advances in SELEX Technology and Aptamer Applications in Biomedicine. Int. J. Mol. Sci. 2017, 18, 2142. [Google Scholar] [CrossRef] [PubMed] [Green Version]
- Osborne, S.E.; Ellington, A.D. Nucleic Acid Selection and the Challenge of Combinatorial Chemistry. Chem. Rev. 1997, 97, 349–370. [Google Scholar] [CrossRef]
- Zhou, J.; Rossi, J. Aptamers as Targeted Therapeutics: Current Potential and Challenges. Nat. Rev. Drug Discov. 2017, 16, 181–202. [Google Scholar] [CrossRef] [Green Version]
- Lyu, C.; Khan, I.M.; Wang, Z. Capture-SELEX for Aptamer Selection: A Short Review. Talanta 2021, 229, 122274. [Google Scholar] [CrossRef] [PubMed]
- Oshlack, A.; Wakefield, M.J. Transcript Length Bias in RNA-Seq Data Confounds Systems Biology. Biol. Direct 2009, 4, 14. [Google Scholar] [CrossRef] [Green Version]
- Roberts, A.; Trapnell, C.; Donaghey, J.; Rinn, J.L.; Pachter, L. Improving RNA-Seq Expression Estimates by Correcting for Fragment Bias. Genome Biol. 2011, 12, R22. [Google Scholar] [CrossRef] [Green Version]
- Young, M.D.; Wakefield, M.J.; Smyth, G.K.; Oshlack, A. Gene Ontology Analysis for RNA-Seq: Accounting for Selection Bias. Genome Biol. 2010, 11, R14. [Google Scholar] [CrossRef] [PubMed] [Green Version]
- Tuerk, C.; Gold, L. Systematic Evolution of Ligands by Exponential Enrichment: RNA Ligands to Bacteriophage T4 DNA Polymerase. Science 1990, 249, 505–510. [Google Scholar] [CrossRef] [PubMed]
- Song, J.; Zheng, Y.; Huang, M.; Wu, L.; Wang, W.; Zhu, Z.; Song, Y.; Yang, C. A Sequential Multidimensional Analysis Algorithm for Aptamer Identification Based on Structure Analysis and Machine Learning. Anal. Chem. 2020, 92, 3307–3314. [Google Scholar] [CrossRef]
- Wang, J.; Rudzinski, J.F.; Gong, Q.; Soh, H.T.; Atzberger, P.J. Influence of Target Concentration and Background Binding on In Vitro Selection of Affinity Reagents. PLoS ONE 2012, 7, e43940. [Google Scholar] [CrossRef]
- Lee, G.; Jang, G.H.; Kang, H.Y.; Song, G. Predicting Aptamer Sequences That Interact with Target Proteins Using an Aptamer-Protein Interaction Classifier and a Monte Carlo Tree Search Approach. PLoS ONE 2021, 16, e0253760. [Google Scholar] [CrossRef]
- Li, B.Q.; Zhang, Y.C.; Huang, G.H.; Cui, W.R.; Zhang, N.; Cai, Y.D. Prediction of Aptamer-Target Interacting Pairs with Pseudo-Amino Acid Composition. PLoS ONE 2014, 9, e86729. [Google Scholar] [CrossRef] [Green Version]
- Emami, N.; Ferdousi, R. AptaNet as a Deep Learning Approach for Aptamer–Protein Interaction Prediction. Sci. Rep. 2021, 11, 6074. [Google Scholar] [CrossRef]
- Ahmad, N.A.; Zulkifli, R.M.; Hussin, H.; Nadri, M.H. In Silico Approach for Post-SELEX DNA Aptamers: A Mini-Review. J. Mol. Graph. Model. 2021, 105, 107872. [Google Scholar] [CrossRef]
- Chen, Z.; Hu, L.; Zhang, B.T.; Lu, A.; Wang, Y.; Yu, Y.; Zhang, G. Artificial Intelligence in Aptamer–Target Binding Prediction. Int. J. Mol. Sci. 2021, 22, 3605. [Google Scholar] [CrossRef] [PubMed]
- Soon, S.; Nordin, N.A. In Silico Predictions and Optimization of Aptamers against Streptococcus Agalactiae Surface Protein Using Computational Docking. Mater. Today Proc. 2019, 16, 2096–2100. [Google Scholar] [CrossRef]
- Mousivand, M.; Anfossi, L.; Bagherzadeh, K.; Barbero, N.; Mirzadi-Gohari, A.; Javan-Nikkhah, M. In Silico Maturation of Affinity and Selectivity of DNA Aptamers against Aflatoxin B1 for Biosensor Development. Anal. Chim. Acta 2020, 1105, 178–186. [Google Scholar] [CrossRef] [PubMed]
- Eisold, A.; Labudde, D. Detailed Analysis of 17β-Estradiol-Aptamer Interactions: A Molecular Dynamics Simulation Study. Molecules 2018, 23, 1690. [Google Scholar] [CrossRef] [Green Version]
- Bavi, R.; Liu, Z.; Han, Z.; Zhang, H.; Gu, Y. In Silico Designed RNA Aptamer against Epithelial Cell Adhesion Molecule for Cancer Cell Imaging. Biochem. Biophys. Res. Commun. 2019, 509, 937–942. [Google Scholar] [CrossRef]
- Bell, D.R.; Weber, J.K.; Yin, W.; Huynh, T.; Duan, W.; Zhou, R. In Silico Design and Validation of High-Affinity RNA Aptamers Targeting Epithelial Cellular Adhesion Molecule Dimers. Proc. Natl. Acad. Sci. USA 2020, 117, 8486–8493. [Google Scholar] [CrossRef] [PubMed]
- Iwakiri, J.; Hamada, M.; Asai, K.; Kameda, T. Improved Accuracy in RNA-Protein Rigid Body Docking by Incorporating Force Field for Molecular Dynamics Simulation into the Scoring Function. J. Chem. Theory Comput. 2016, 12, 4688–4697. [Google Scholar] [CrossRef]
- Song, Y.; Song, J.; Wei, X.; Huang, M.; Sun, M.; Zhu, L.; Lin, B.; Shen, H.; Zhu, Z.; Yang, C. Discovery of Aptamers Targeting the Receptor-Binding Domain of the SARS-CoV-2 Spike Glycoprotein. Anal. Chem. 2020, 92, 9895–9900. [Google Scholar] [CrossRef]
- Bashir, A.; Yang, Q.; Wang, J.; Hoyer, S.; Chou, W.; McLean, C.; Davis, G.; Gong, Q.; Armstrong, Z.; Jang, J.; et al. Machine Learning Guided Aptamer Refinement and Discovery. Nat. Commun. 2021, 12, 2366. [Google Scholar] [CrossRef]
- Kuretake, T.; Kawahara, S.; Motooka, M.; Uno, S. An Electrochemical Gas Biosensor Based on Enzymes Immobilized on Chromatography Paper for Ethanol Vapor Detection. Sensors 2017, 17, 281. [Google Scholar] [CrossRef] [Green Version]
- Shkodra, B.; Abera, B.D.; Cantarella, G.; Douaki, A.; Avancini, E.; Petti, L.; Lugli, P. Flexible and Printed Electrochemical Immunosensor Coated with Oxygen Plasma Treated SWCNTs for Histamine Detection. Biosensors 2020, 10, 35. [Google Scholar] [CrossRef] [PubMed] [Green Version]
- Shkembi, X.; Svobodova, M.; Skouridou, V.; Bashammakh, A.S.; Alyoubi, A.O.; O’Sullivan, C.K. Aptasensors for Mycotoxin Detection: A Review. Anal. Biochem. 2021, 644, 114156. [Google Scholar] [CrossRef] [PubMed]
- Lee, E.-S.; Lee, J.M.; Kim, H.-J.; Kim, Y.-P. Fluorogenic Aptasensors with Small Molecules. Chemosensors 2021, 9, 54. [Google Scholar] [CrossRef]
- Douaki, A.; Abera, B.D.; Cantarella, G.; Shkodra, B.; Mushtaq, A.; Ibba, P.; Inam, A.K.M.S.; Petti, L.; Lugli, P. Flexible Screen Printed Aptasensor for Rapid Detection of Furaneol: A Comparison of CNTs and AgNPs Effect on Aptasensor Performance. Nanomaterials 2020, 10, 1167. [Google Scholar] [CrossRef] [PubMed]
- Zahra, Q.U.A.; Luo, Z.; Ali, R.; Khan, M.I.; Li, F.; Qiu, B. Advances in Gold Nanoparticles-based Colorimetric Aptasensors for the Detection of Antibiotics: An Overview of the Past Decade. Nanomaterials 2021, 11, 840. [Google Scholar] [CrossRef]
- Wang, Y.; Song, W.; Zhao, H.; Ma, X.; Yang, S.; Qiao, X.; Sheng, Q.; Yue, T. DNA Walker-Assisted Aptasensor for Highly Sensitive Determination of Ochratoxin A. Biosens. Bioelectron. 2021, 182, 113171. [Google Scholar] [CrossRef]
- Sun, H.; Qian, L.; Kong, J.; Zhang, X. Ultra-Sensitive Nucleic Acid Detection Based on Target Cycling of Triple Helix Molecular Switch and ATRP Double Signal Amplification. Sens. Actuators B Chem. 2021, 337, 129791. [Google Scholar] [CrossRef]
- Barandun, G.; Soprani, M.; Naficy, S.; Grell, M.; Kasimatis, M.; Chiu, K.L.; Ponzoni, A.; Güder, F. Cellulose Fibers Enable Near-Zero-Cost Electrical Sensing of Water-Soluble Gases. ACS Sens. 2019, 4, 1662–1669. [Google Scholar] [CrossRef]
- Gordon, C.K.L.; Wu, D.; Pusuluri, A.; Feagin, T.A.; Csordas, A.T.; Eisenstein, M.S.; Hawker, C.J.; Niu, J.; Soh, H.T. Click-Particle Display for Base-Modified Aptamer Discovery. ACS Chem. Biol. 2019, 14, 2652–2662. [Google Scholar] [CrossRef]
- Ma, X.; Wang, W.; Chen, X.; Xia, Y.; Wu, S.; Duan, N.; Wang, Z. Selection, Identification, and Application of Aflatoxin B1 Aptamer. Eur. Food Res. Technol. 2014, 238, 919–925. [Google Scholar] [CrossRef]
- Wilson, B.D.; Hariri, A.A.; Thompson, I.A.P.; Eisenstein, M.; Soh, H.T. Independent Control of the Thermodynamic and Kinetic Properties of Aptamer Switches. Nat. Commun. 2019, 10, 5079. [Google Scholar] [CrossRef] [PubMed] [Green Version]
- Malhotra, S.; Pandey, A.K.; Rajput, Y.S.; Sharma, R. Selection of Aptamers for Aflatoxin M1 and Their Characterization. J. Mol. Recognit. 2014, 27, 493–500. [Google Scholar] [CrossRef] [PubMed]
- Chushak, Y.; Stone, M.O. In Silico Selection of RNA Aptamers. Nucleic Acids Res. 2009, 37, e87. [Google Scholar] [CrossRef] [PubMed] [Green Version]
- Landrum, G.; Kelley, B.; Tosco, P.; sriniker; gedeck; NadineSchneider; Vianello, R.; Dalke, A.; AlexanderSavelyev; Turk, S.; et al. Rdkit: 2018_03_1 (Q1 2018) Release; Zenodo: Meyrin, Switzerland, 2018. [Google Scholar] [CrossRef]
- Zeng, H.; Edwards, M.D.; Liu, G.; Gifford, D.K. Convolutional Neural Network Architectures for Predicting DNA-Protein Binding. Bioinformatics 2016, 32, i121–i127. [Google Scholar] [CrossRef] [PubMed]
- Kresnakova, V.M.; Sarnovsky, M.; Butka, P. Deep Learning Methods for Fake News Detection. In Proceedings of the IEEE Joint 19th International Symposium on Computational Intelligence and Informatics and 7th International Conference on Recent Achievements in Mechatronics, Automation, Computer Sciences and Robotics, CINTI-MACRo 2019, Szeged, Hungary, 14–16 November 2019; pp. 143–148. [Google Scholar]
- Basha, S.H.S.; Dubey, S.R.; Pulabaigari, V.; Mukherjee, S. Impact of Fully Connected Layers on Performance of Convolutional Neural Networks for Image Classification. Neurocomputing 2020, 378, 112–119. [Google Scholar] [CrossRef] [Green Version]
- Kang, L.; Ye, P.; Li, Y.; Doermann, D. Convolutional Neural Networks for No-Reference Image Quality Assessment. In Proceedings of the IEEE Computer Society Conference on Computer Vision and Pattern Recognition, Columbus, OH, USA, 23–28 June 2014; pp. 1733–1740. [Google Scholar]
- Minaee, S.; Kalchbrenner, N.; Cambria, E.; Nikzad, N.; Chenaghlu, M.; Gao, J. Deep Learning Based Text Classification: A Comprehensive Review. arXiv 2020, arXiv:2004.03705. [Google Scholar] [CrossRef]
- Amin, M.Z.; Nadeem, N. Convolutional Neural Network: Text Classification Model for Open Domain Question Answering System. arXiv 2018, arXiv:1809.02479. [Google Scholar]
- Kiranyaz, S.; Avci, O.; Abdeljaber, O.; Ince, T.; Gabbouj, M.; Inman, D.J. 1D Convolutional Neural Networks and Applications—A Survey. arXiv 2019, arXiv:1905.03554. [Google Scholar] [CrossRef]
- Cicuttin, A.; Crespo, M.L.; Mannatunga, K.S.; Garcia, V.V.; Baldazzi, G.; Rignanese, L.P.; Ahangarianabhari, M.; Bertuccio, G.; Fabiani, S.; Rachevski, A.; et al. A Programmable System-on-Chip Based Digital Pulse Processing for High Resolution X-Ray Spectroscopy. In Proceedings of the 2016 International Conference on Advances in Electrical, Electronic and Systems Engineering, ICAEES, Putrajaya, Malaysia, 14–16 November 2016; Volume 15, pp. 520–525. [Google Scholar]
- Cao, Z.; Zhang, S. Simple Tricks of Convolutional Neural Network Architectures Improve DNA-Protein Binding Prediction. Bioinformatics 2019, 35, 1837–1843. [Google Scholar] [CrossRef]
- Kesler, V.; Murmann, B.; Soh, H.T. Going beyond the Debye Length: Overcoming Charge Screening Limitations in Next-Generation Bioelectronic Sensors. ACS Nano 2020, 14, 16194–16201. [Google Scholar] [CrossRef]
- Lorenz, R.; Bernhart, S.H.; Höner zu Siederdissen, C.; Tafer, H.; Flamm, C.; Stadler, P.F.; Hofacker, I.L. ViennaRNA Package 2.0. Algorithms Mol. Biol. 2011, 6, 26. [Google Scholar] [CrossRef]
- Trott, O.; Olson, A.J. Software News and Update AutoDock Vina: Improving the Speed and Accuracy of Docking with a New Scoring Function, Efficient Optimization, and Multithreading. J. Comput. Chem. 2012, 32, 174–182. [Google Scholar]
- Chushak, Y.G.; Martin, J.A.; Chávez, J.L.; Kelley-Loughnane, N.; Stone, M.O. Computational Design of RNA Libraries for in Vitro Selection of Aptamers. In Artificial Riboswitches; Methods in Molecular Biology Series; Humana Press: Totowa, NJ, USA, 2014; Volume 1111, pp. 1–15. [Google Scholar]
- Ellingson, S.R.; Smith, J.C.; Baudry, J. VinaMPI: Facilitating Multiple Receptor High-Throughput Virtual Docking on High-Performance Computers. J. Comput. Chem. 2013, 34, 2212–2221. [Google Scholar] [CrossRef]
- Nakatsuka, N.; Yang, K.A.; Abendroth, J.M.; Cheung, K.M.; Xu, X.; Yang, H.; Zhao, C.; Zhu, B.; Rim, Y.S.; Yang, Y.; et al. Aptamer-Field-Effect Transistors Overcome Debye Length Limitations for Small-Molecule Sensing. Science 2018, 362, 319–324. [Google Scholar] [CrossRef]
- Ogasawara, D.; Hachiya, N.S.; Kaneko, K.; Sode, K.; Ikebukuro, K. Detection System Based on the Conformational Change in an Aptamer and Its Application to Simple Bound/Free Separation. Biosens. Bioelectron. 2009, 24, 1372–1376. [Google Scholar] [CrossRef]
- Zhao, Z.; Chen, H.; Ma, L.; Liu, D.; Wang, Z. A Label-Free Electrochemical Impedance Aptasensor for Cylindrospermopsin Detection Based on Thionine-Graphene Nanocomposites. Analyst 2015, 140, 5570–5577. [Google Scholar] [CrossRef]
- Huang, L.; Tian, S.; Zhao, W.; Liu, K.; Ma, X.; Guo, J. Aptamer-Based Lateral Flow Assay on-Site Biosensors. Biosens. Bioelectron. 2021, 186, 113279. [Google Scholar] [CrossRef]
- Cui, X.; Song, M.; Liu, Y.; Yuan, Y.; Huang, Q.; Cao, Y.; Lu, F. Identifying Conformational Changes of Aptamer Binding to Theophylline: A Combined Biolayer Interferometry, Surface-Enhanced Raman Spectroscopy, and Molecular Dynamics Study. Talanta 2020, 217, 121073. [Google Scholar] [CrossRef]
- Chang, L.Y.; Chuang, M.Y.; Zan, H.W.; Meng, H.F.; Lu, C.J.; Yeh, P.H.; Chen, J.N. One-Minute Fish Freshness Evaluation by Testing the Volatile Amine Gas with an Ultrasensitive Porous-Electrode-Capped Organic Gas Sensor System. ACS Sens. 2017, 2, 531–539. [Google Scholar] [CrossRef]
- Niizeki, N.; Daikoku, T.; Hirata, T.; El-Shourbagy, I.; Song, X.; Sakaguchi, M. Mechanism of Biosynthesis of Trimethylamine Oxide in Tilapia Reared under Seawater Conditions. Fish. Sci. 2003, 69, 74–87. [Google Scholar] [CrossRef] [Green Version]
- Franke, C.; Beauchamp, J. Real-Time Detection of Volatiles Released During Meat Spoilage: A Case Study of Modified Atmosphere-Packaged Chicken Breast Fillets Inoculated with Br. Thermosphacta. Food Anal. Methods 2017, 10, 310–319. [Google Scholar] [CrossRef]
- Sander, R. Compilation of Henry’s Law Constants for Inorganic and Organic Species of Potential Importance in Environmental Chemistry. In Handbook of Property Estimation Methods for Chemicals: Environmental Health Sciences; CRC Press: Boca Raton, FL, USA, 1999. [Google Scholar]


| Rank | Candidate Sequences | Binding Energy (kcal/mol) NH4+ from MDS | Binding Energy (kcal/mol) DMA from MDS | Binding Energy (kcal/mol) TMA from MDS | Kd (mM) | Detection Range (mM) | Limit of Detection (mM) |
|---|---|---|---|---|---|---|---|
| Aptamer 1 | CCAUGUAAGCGCGGUACUCUUACGUGA | −9.85 | −3.8 | −3.21 | 36.59 | 1–1000 | 0.08 |
| Aptamer 2 | UCGCGUCUAGCCCAUUGAUAGGCCCGA | −9.67 | −4.46 | −3.53 | 16.11 | 1–500 | 0.37 |
| Aptamer 3 | UCCACGUGGUGCCAUACUCCGGCGUGG | −9.37 | −5.26 | −4.21 | 131 | 1–1000 | 0.61 |
| Aptamer 4 | CCUCUCAGGCUUGUACUGCCACGAGGA | −8.66 | −4.86 | −4.78 | 6,6 | 1–500 | 0.40 |
| Aptamer 5 | GCCCUGGGCCGCUCAUUCCCUCUGGCU | −8.31 | −5.02 | −5.43 | 50 | 1–500 | 0.16 |
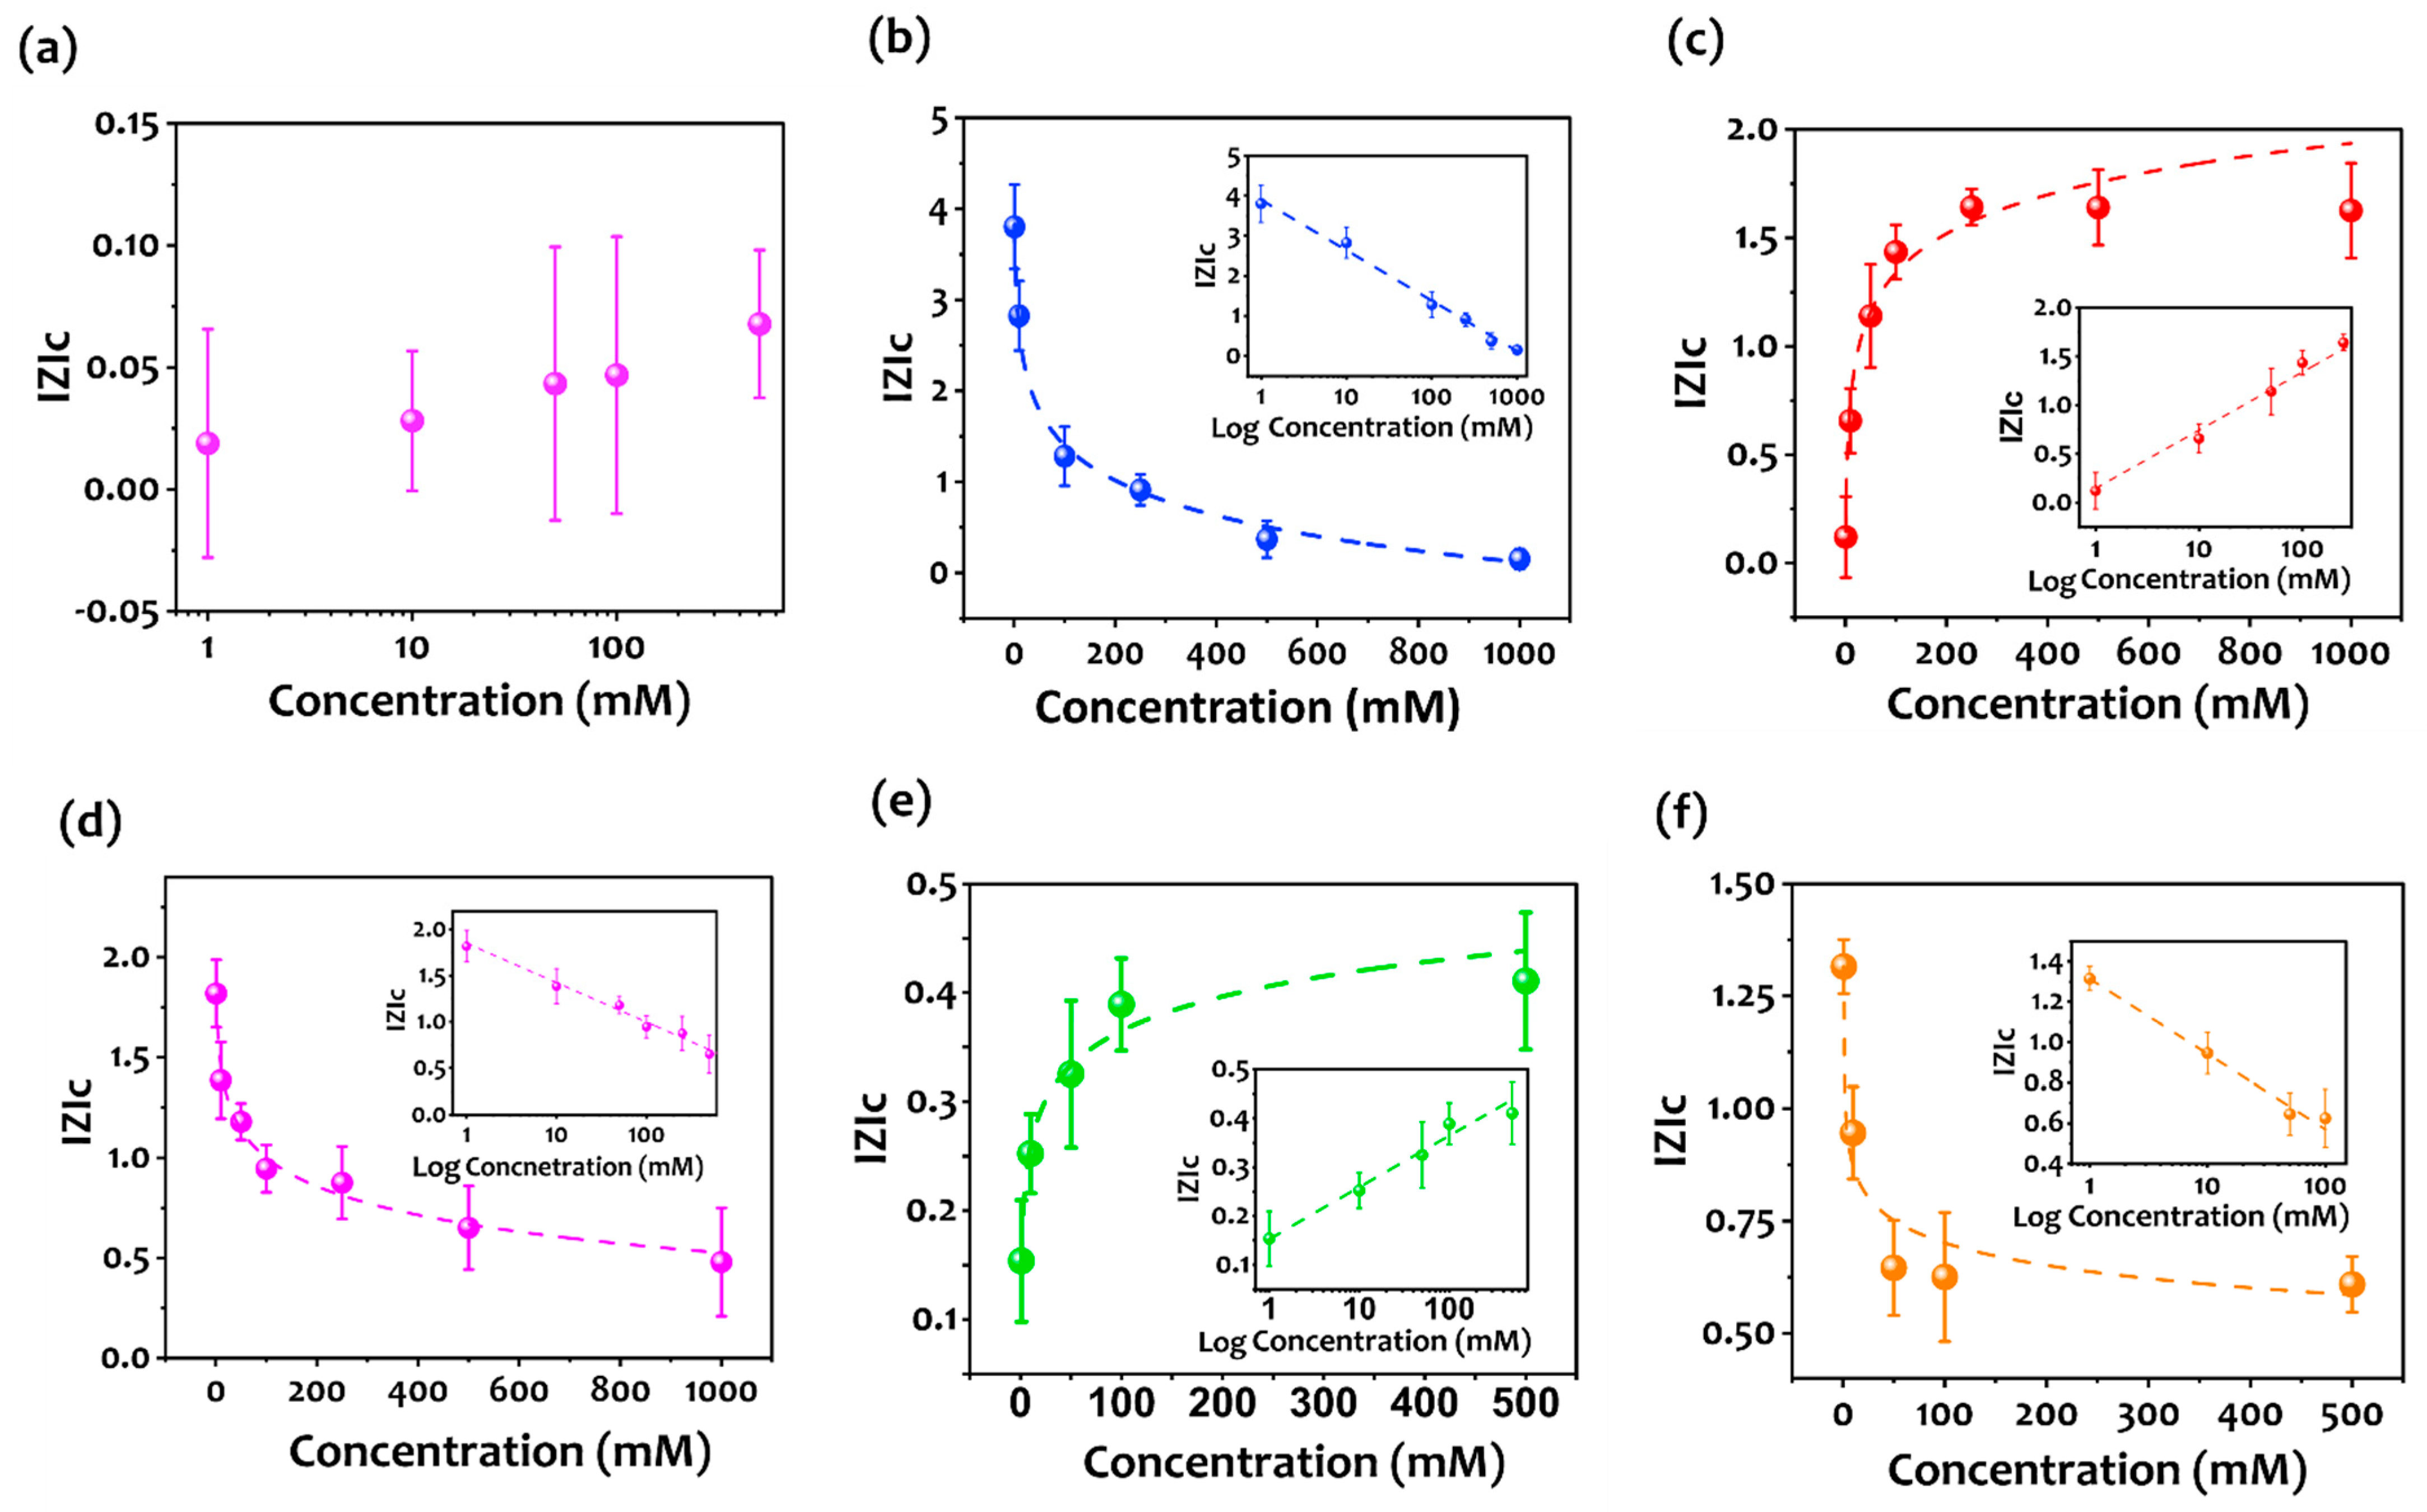
| Aptamer nr. | |Z|c | Paerson’s r |
|---|---|---|
| Control (Random sequence) | (−0.01) × logC + 0.01 | 0.978 |
| Aptamer 1 (Apt1) | (−1.30) × logC + 3.96 | 0.995 |
| Aptamer 2 (Apt2) | (0.632) × logC + 0.098 | 0.99 |
| Aptamer 3 (Apt3) | (−0.416) × logC + 1.838 | 0.987 |
| Aptamer 4 (Apt4) | (0.106) × logC + 0.151 | 0.983 |
| Aptamer 5 (Apt5) | (−0.26) × logC + 1.27 | 0.968 |
Publisher’s Note: MDPI stays neutral with regard to jurisdictional claims in published maps and institutional affiliations. |
© 2022 by the authors. Licensee MDPI, Basel, Switzerland. This article is an open access article distributed under the terms and conditions of the Creative Commons Attribution (CC BY) license (https://creativecommons.org/licenses/by/4.0/).
Share and Cite
Douaki, A.; Garoli, D.; Inam, A.K.M.S.; Angeli, M.A.C.; Cantarella, G.; Rocchia, W.; Wang, J.; Petti, L.; Lugli, P. Smart Approach for the Design of Highly Selective Aptamer-Based Biosensors. Biosensors 2022, 12, 574. https://doi.org/10.3390/bios12080574
Douaki A, Garoli D, Inam AKMS, Angeli MAC, Cantarella G, Rocchia W, Wang J, Petti L, Lugli P. Smart Approach for the Design of Highly Selective Aptamer-Based Biosensors. Biosensors. 2022; 12(8):574. https://doi.org/10.3390/bios12080574
Chicago/Turabian StyleDouaki, Ali, Denis Garoli, A. K. M. Sarwar Inam, Martina Aurora Costa Angeli, Giuseppe Cantarella, Walter Rocchia, Jiahai Wang, Luisa Petti, and Paolo Lugli. 2022. "Smart Approach for the Design of Highly Selective Aptamer-Based Biosensors" Biosensors 12, no. 8: 574. https://doi.org/10.3390/bios12080574