
Synchrotron-Radiation-Based Fourier Transform Infrared Microspectroscopy as a Tool for the Differentiation between Staphylococcal Small Colony Variants
 , , , , ,
Abstract
:1. Introduction
2. Results
2.1. Biochemical Characteristics of S. epidermidis SCV Strains
2.2. IR Spectral Features, Peak Assignments and Group Comparison
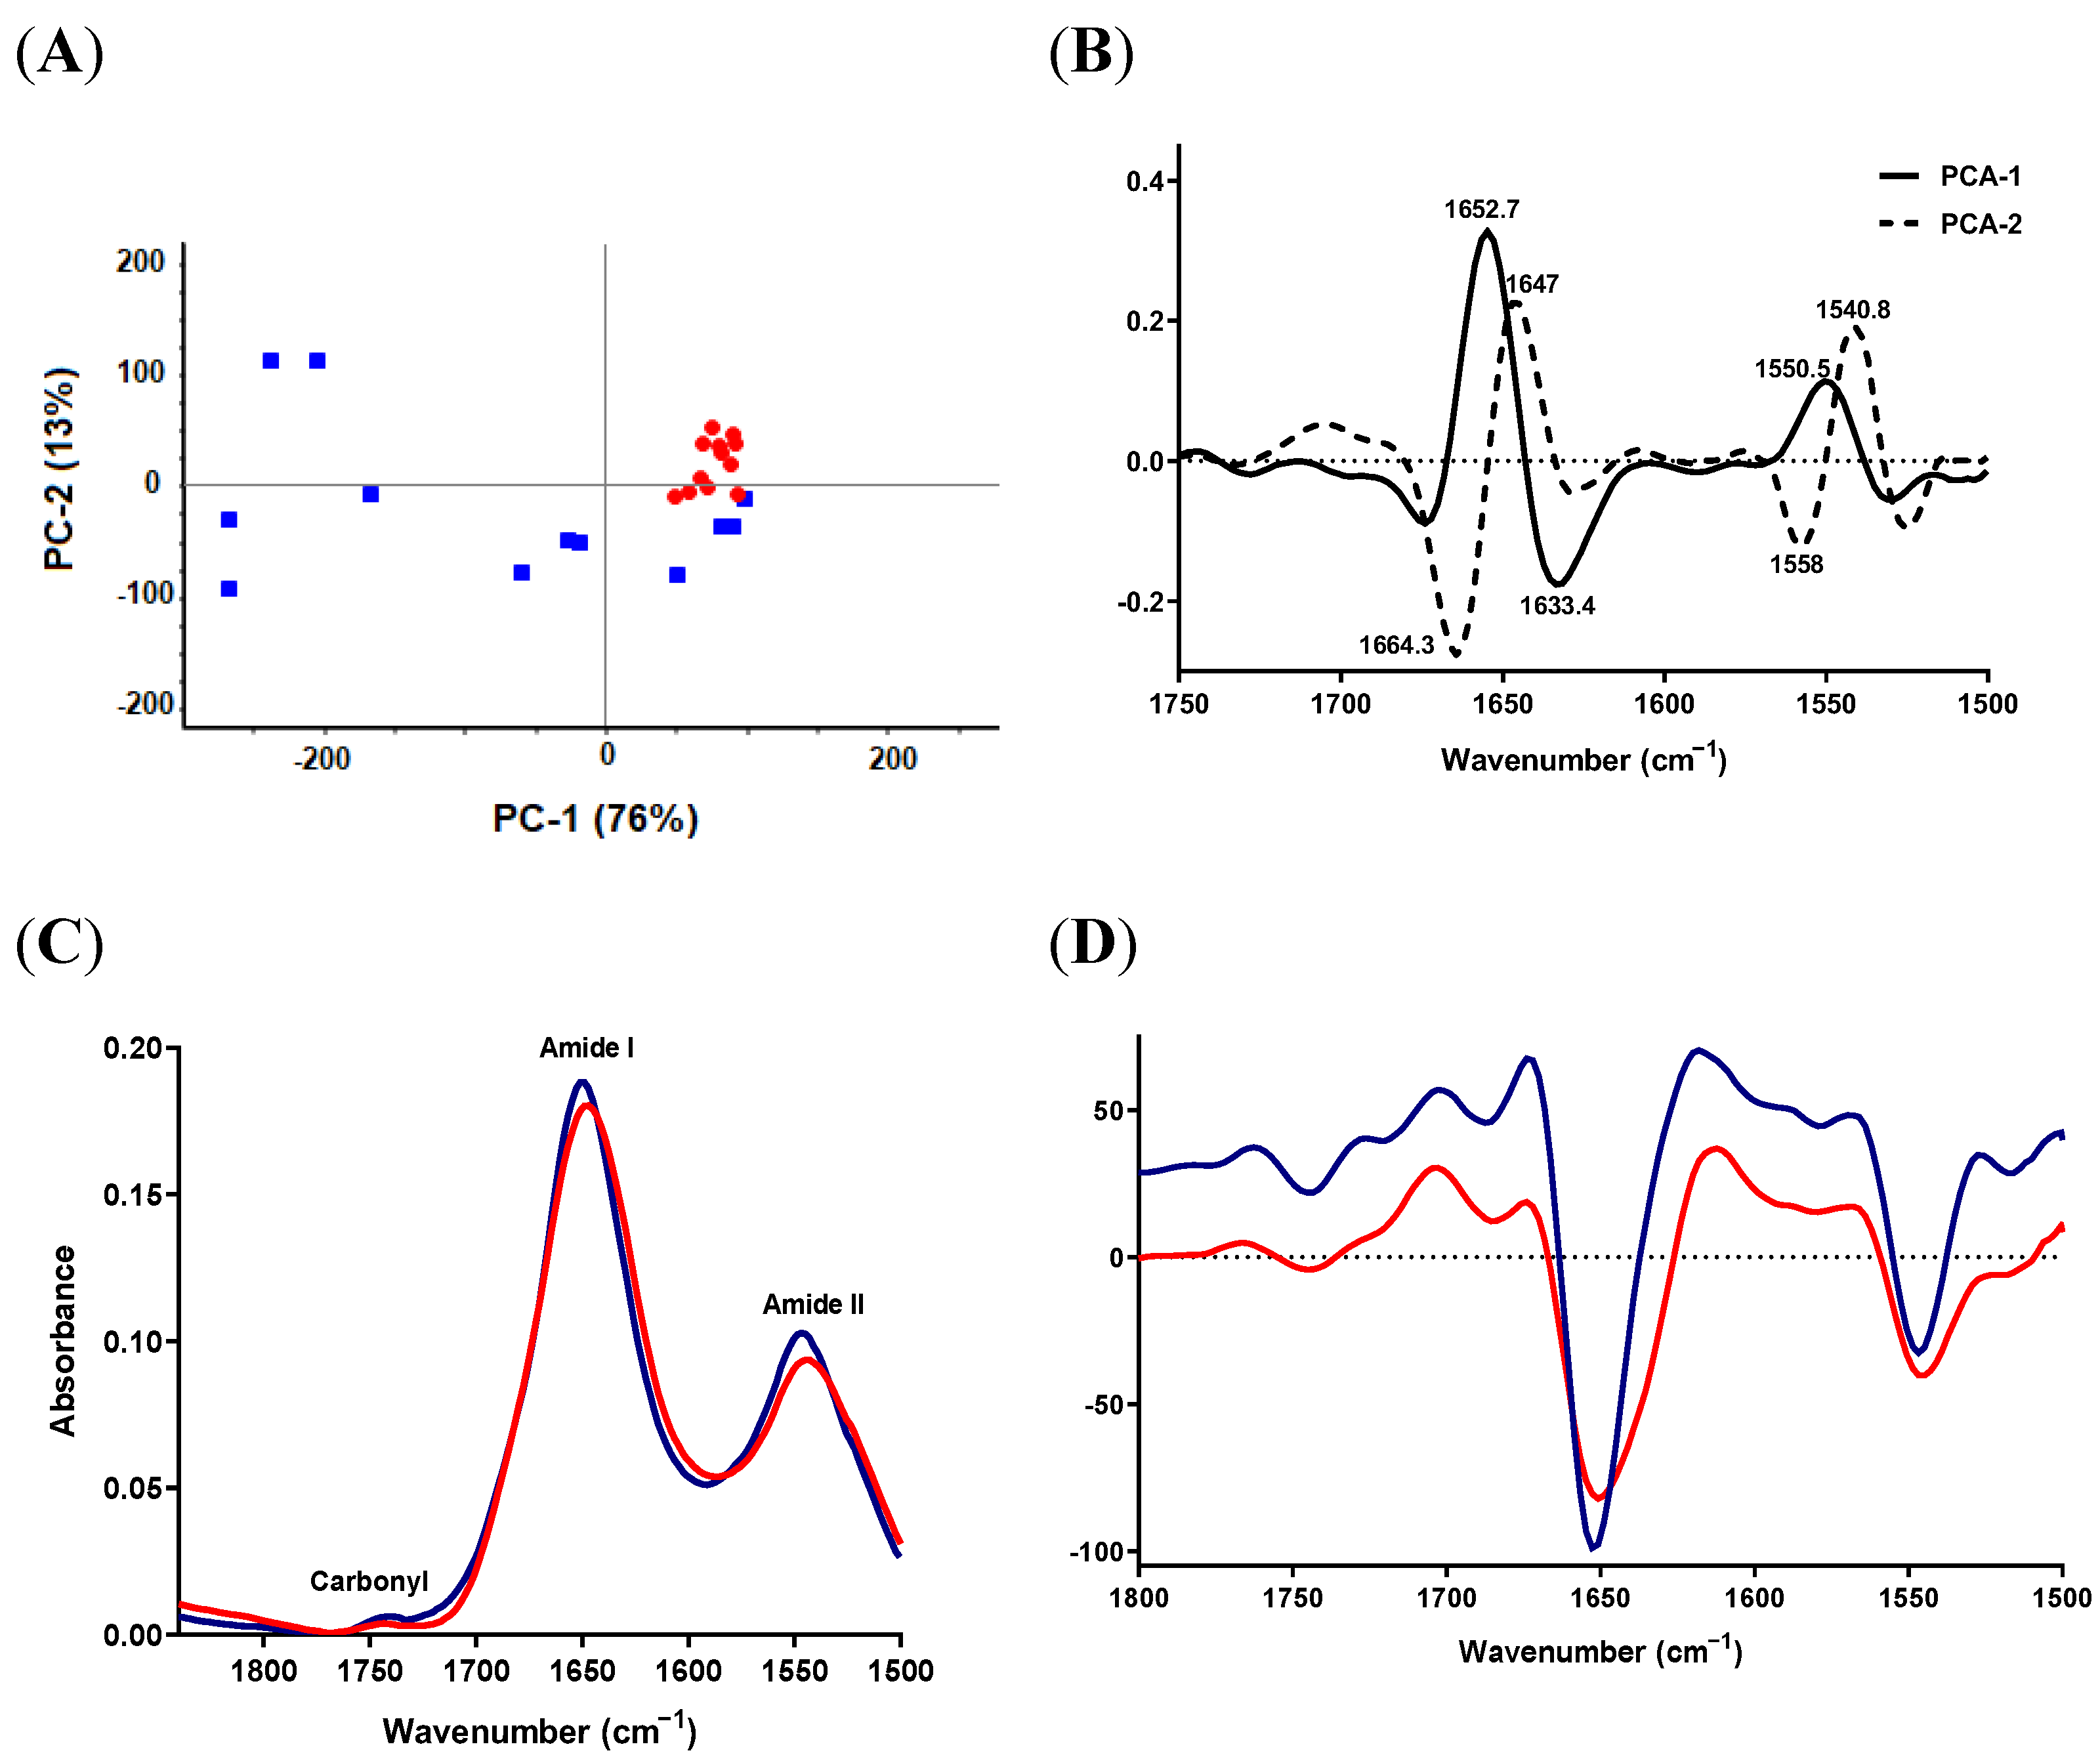
2.3. Lipid and Protein Alterations between Reference Strains of S. aureus and S. epidermidis
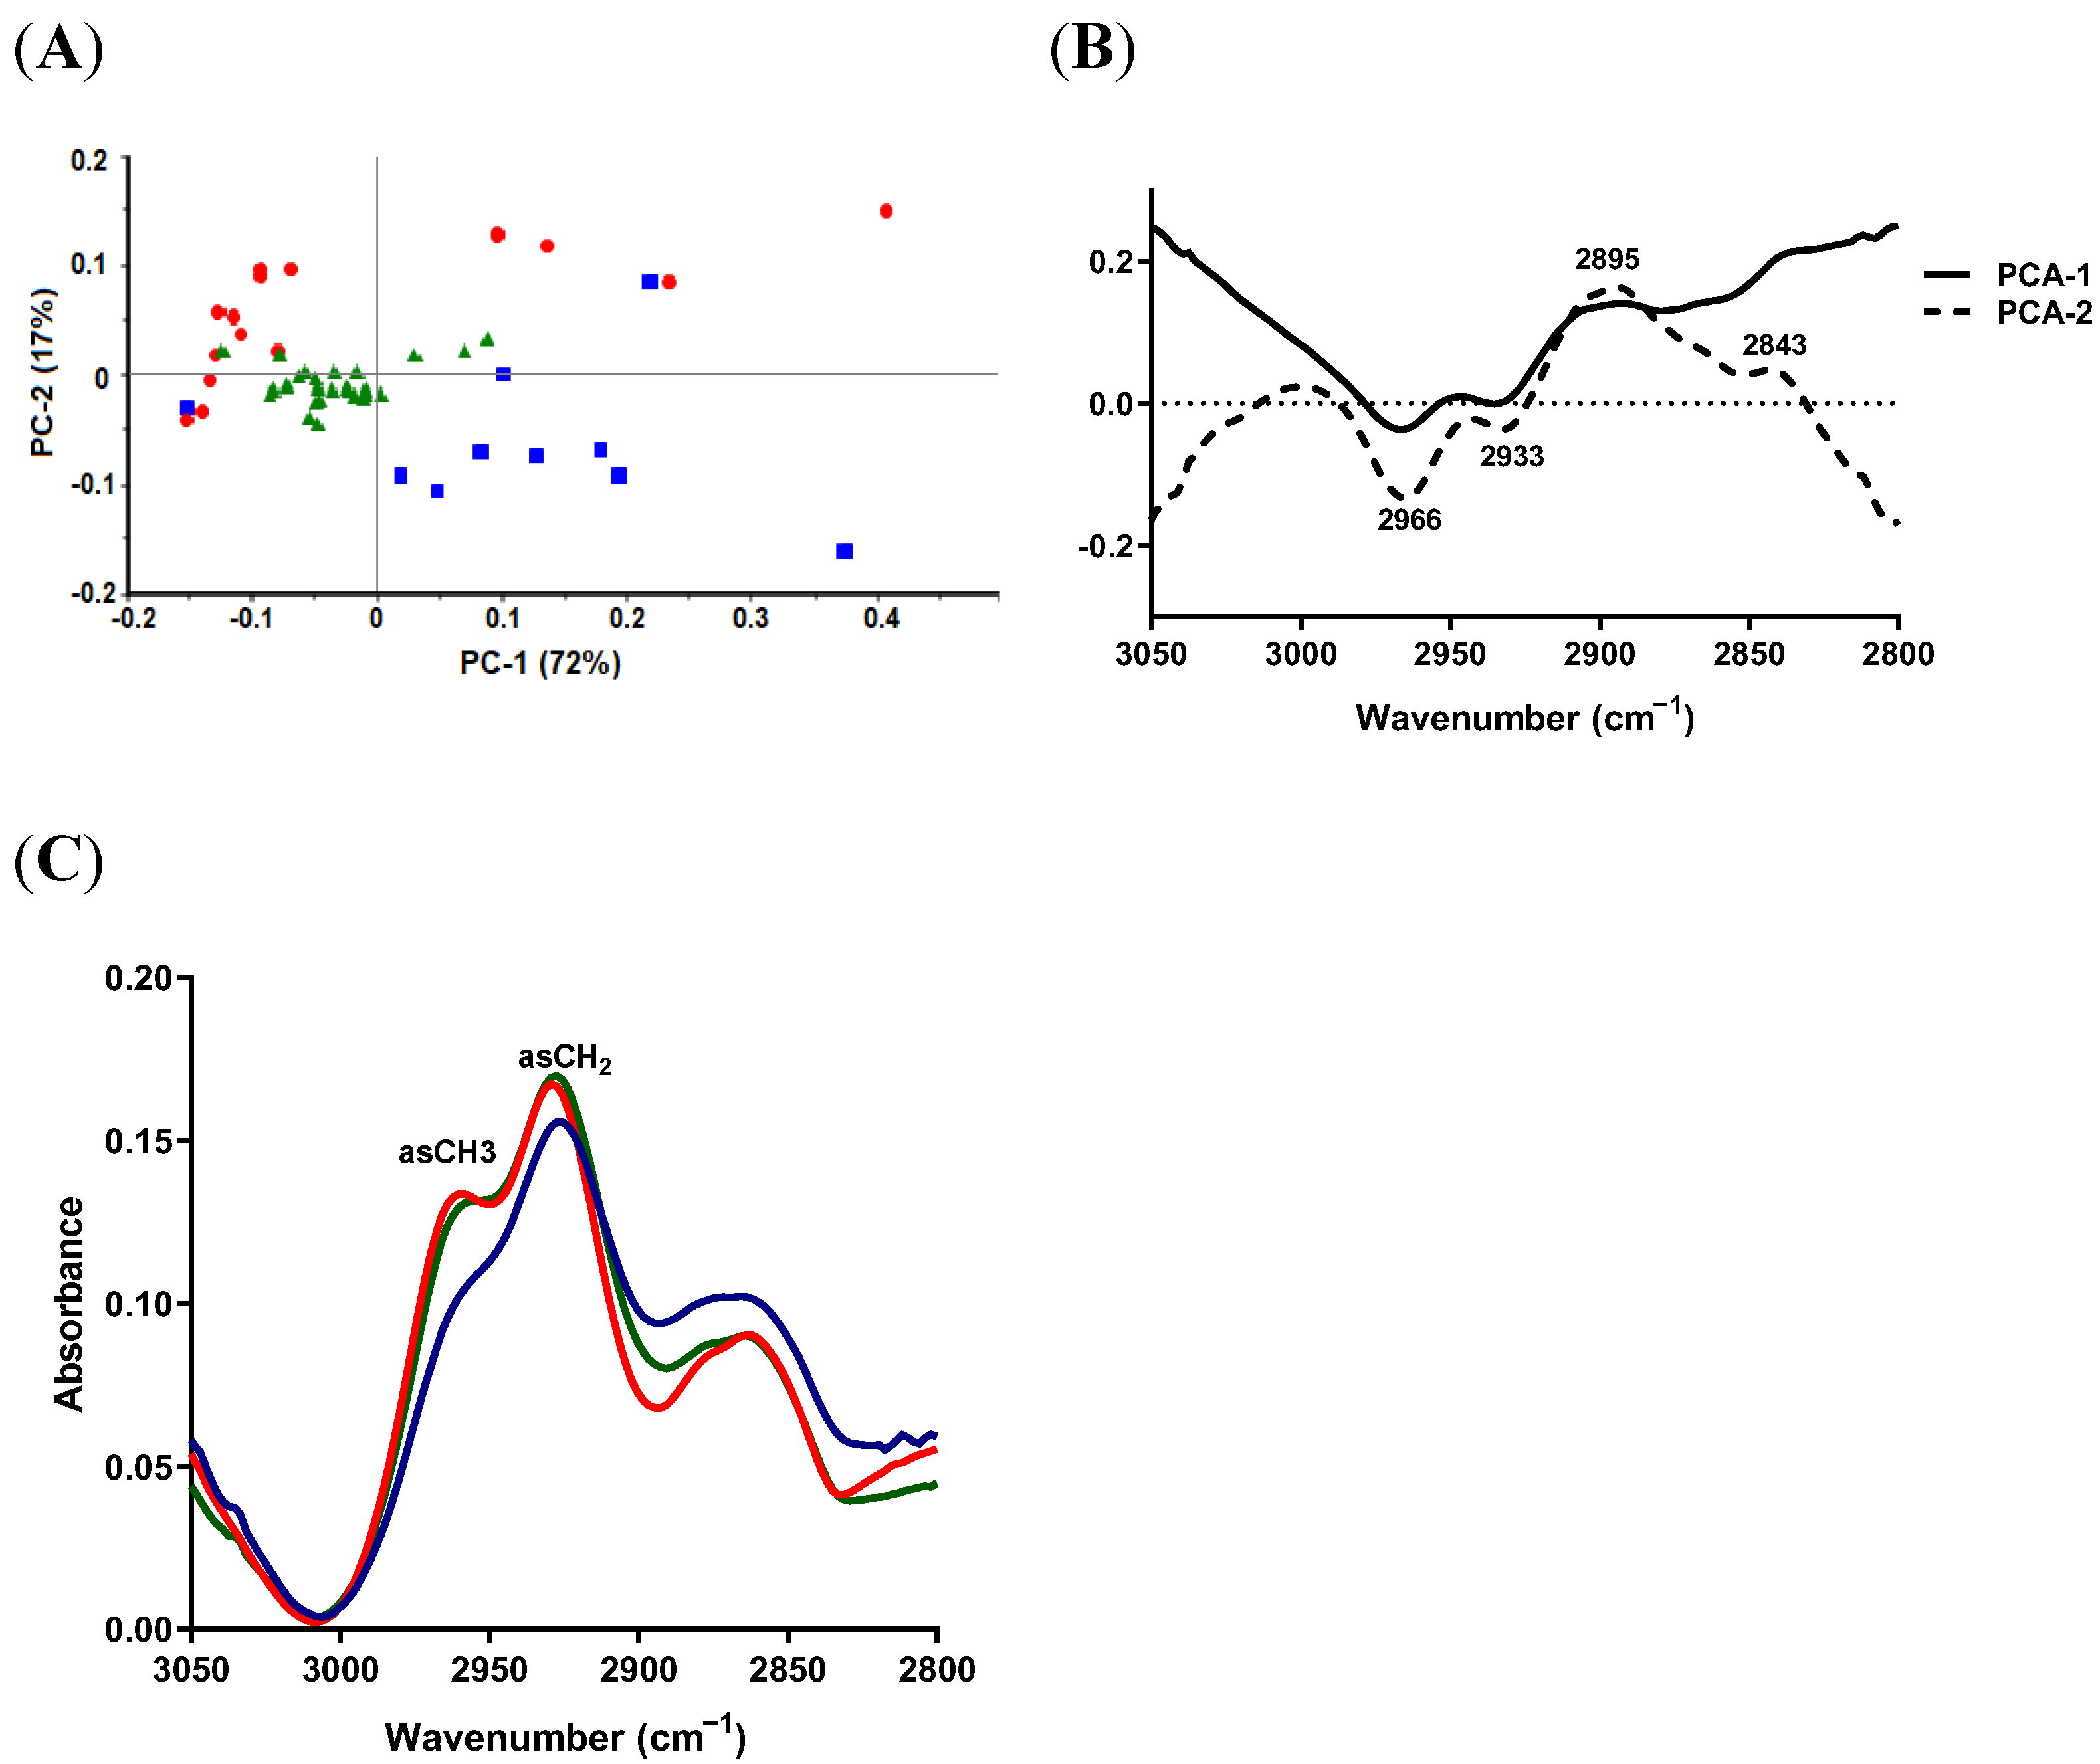
2.3.1. Lipid Region


| Peak Wavenumber (cm−1) | Structure | Alterations |
|---|---|---|
| 2958.3 | Asymmetric CH3: cholesterol esters, triglycerides | Shift to higher frequency (2958.2 cm−1 in SaW → 2960.2 cm−1 in SaCMu and SCVhMu) |
| 2927.4 | Asymmetric CH2: long-chain fatty acids, phospholipids | Shift to lower frequency (2927.4 cm−1 in S. aureus → 2923.6 cm−1 in S. epidermidis). Shift to higher frequency (2927.4 cm−1 in SaW → 2929.4 cm−1 in SaCMu and SCVhMu). |
| 1652.7 | Amide I, α-helix | Shift to lower frequency (1652.7 cm−1 in S. aureus → 1650.7 cm−1 in S. epidermidis) |
| 1639 | Amide I, β-sheets | Main protein secondary structures in SaCMu and SCVhMu |
| 1647 | Amide I, random coil | Main protein secondary structures in SaCMu and SCVhMu |
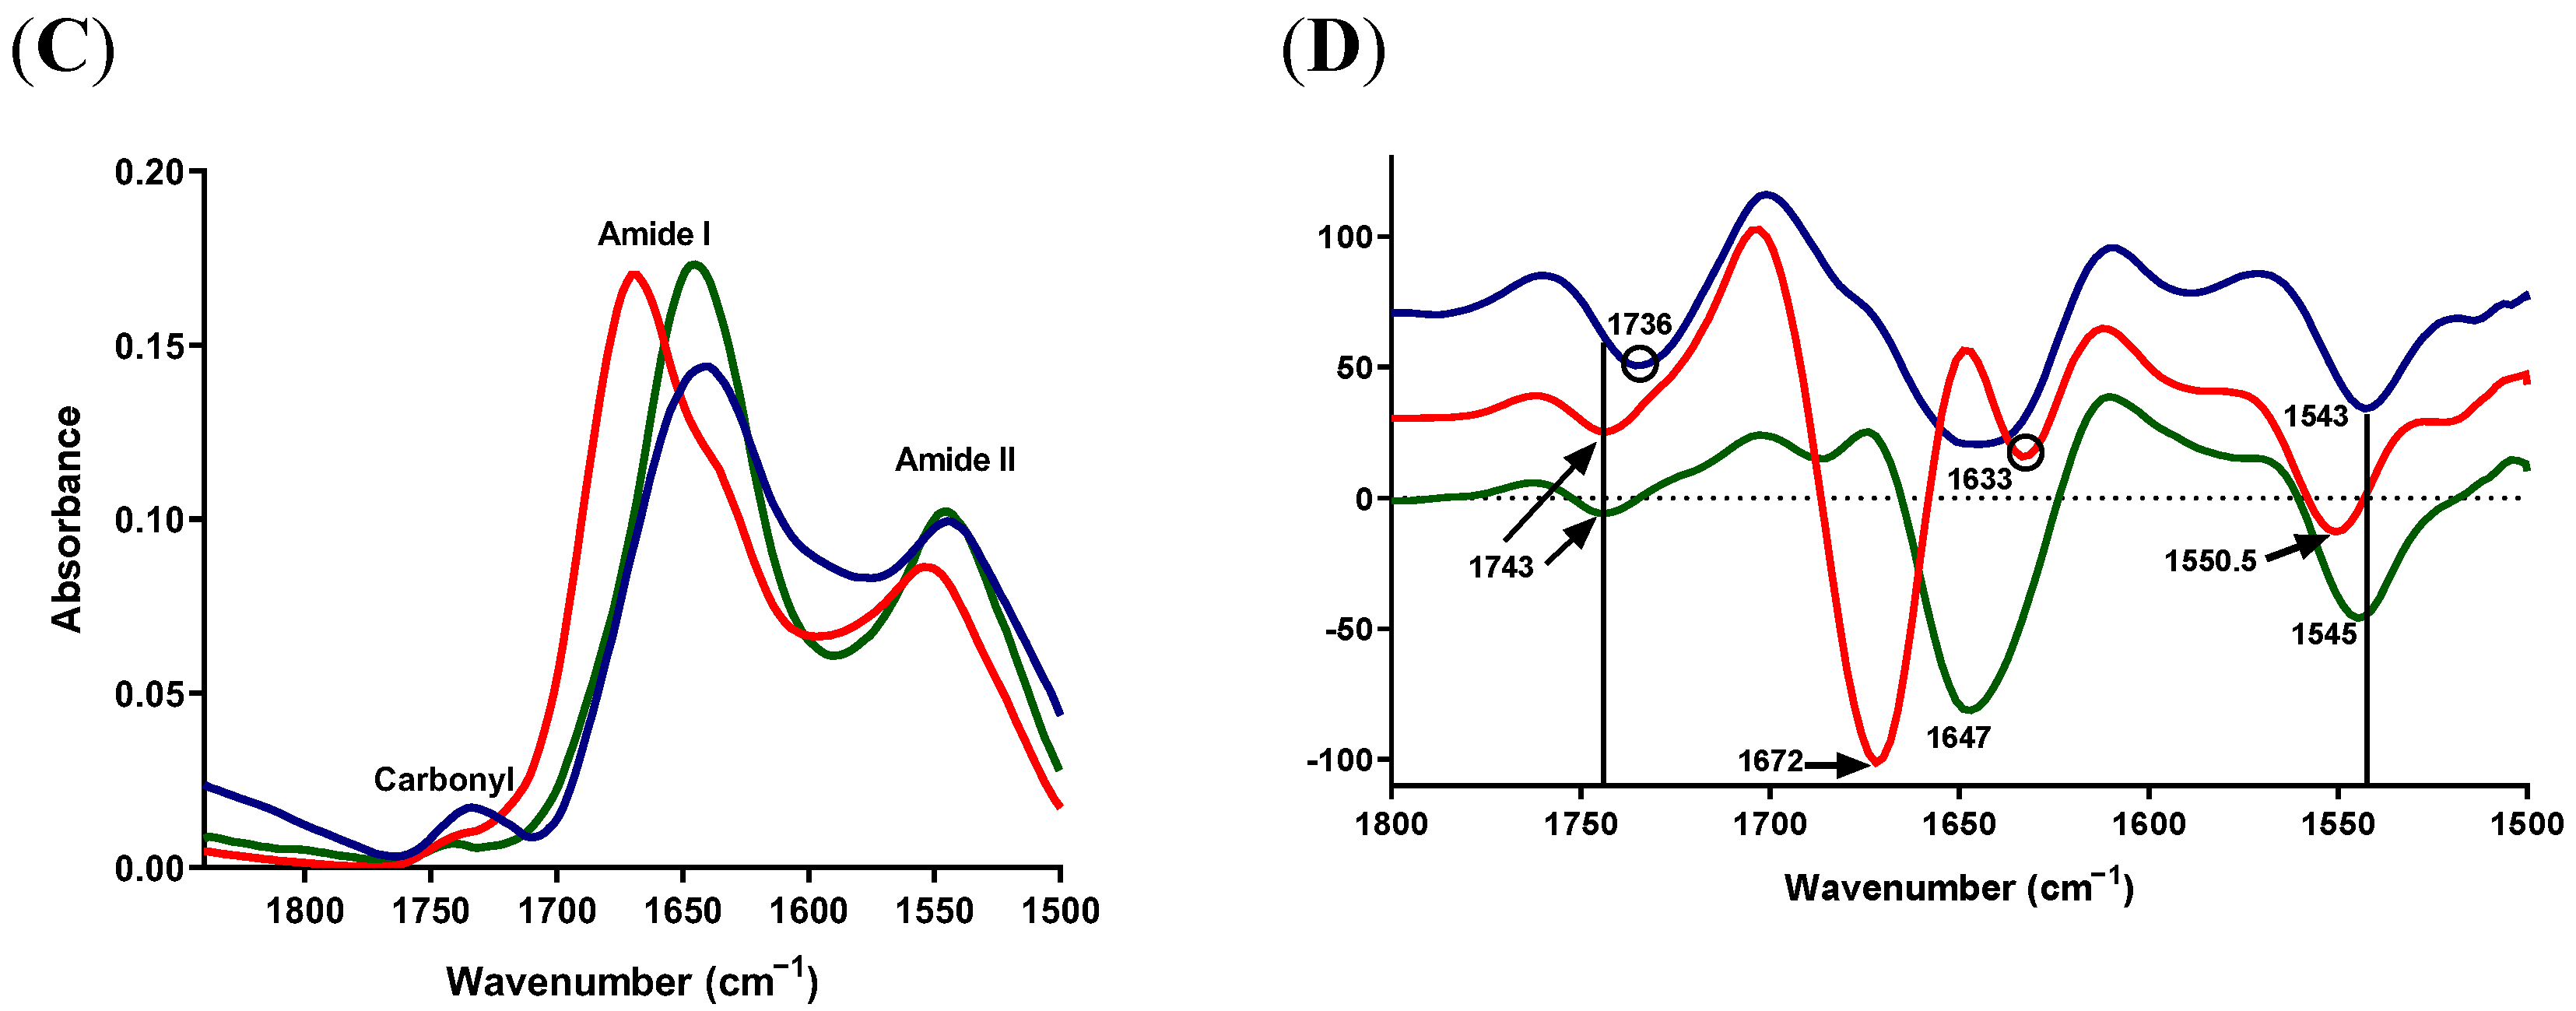
| 1672 | Amide I, random coil | Main protein secondary structures in SaW |
| 1743.4 | Lipid-carbonyl | Shift to lower frequency (1743 cm−1 in SaW and SCVhMu → 1736 cm−1 in SaCMu) |
2.3.2. Protein-Carbonyl Region
2.4. Lipid and Protein Alterations in S. aureus SCV Isolates
2.4.1. Lipid Region
2.4.2. Protein-Carbonyl Region

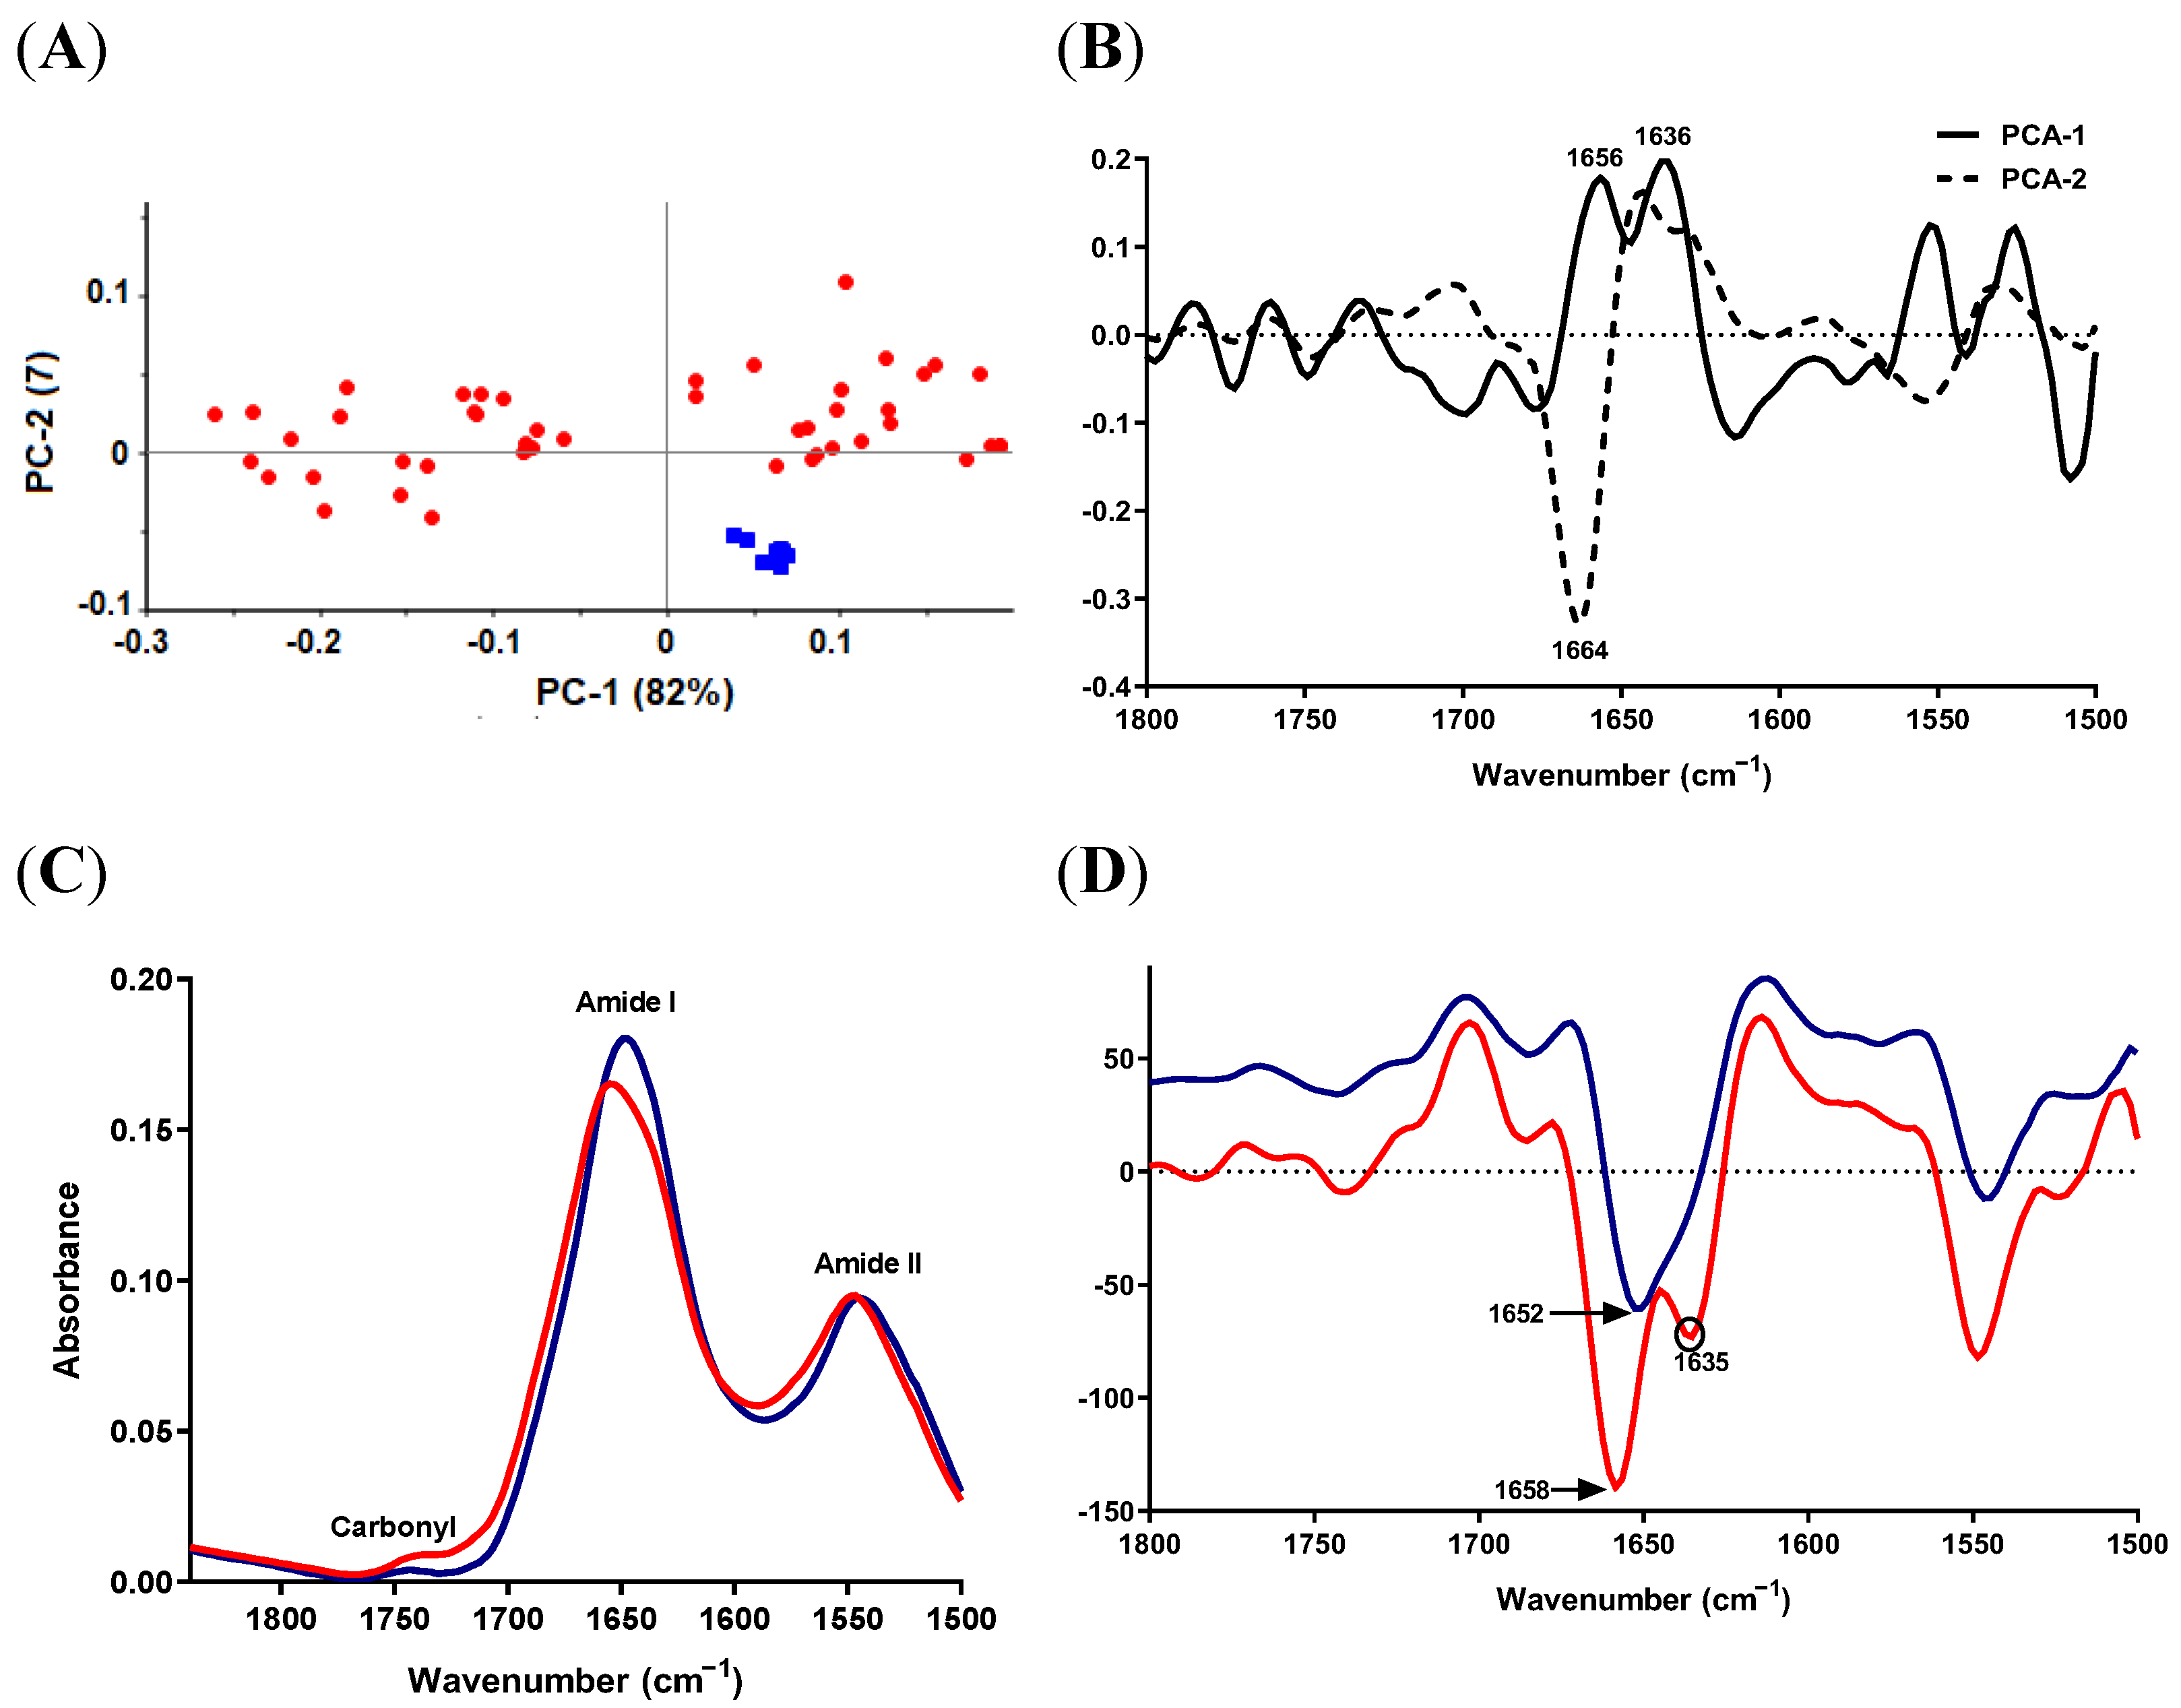
2.5. Lipid and Protein Alterations in S. epidermidis Isolates
2.5.1. Lipid Region

2.5.2. Protein-Carbonyl Region
3. Discussion
4. Materials and Methods
4.1. Bacterial Cultures
4.2. Sample Preparation for SR-FTIR Measurements
4.3. Synchrotron–Fourier Transform Infrared (SR-FTIR) Microscopic Measurements
4.4. SR-FTIR Data Treatment and Statistical Analysis
5. Conclusions
Supplementary Materials
Author Contributions
Funding
Institutional Review Board Statement
Informed Consent Statement
Data Availability Statement
Acknowledgments
Conflicts of Interest
References
- Proctor, R. Respiration and Small Colony Variants of Staphylococcus aureus. Microbiol. Spectr. 2019, 7. [Google Scholar] [CrossRef] [PubMed]
- Proctor, R.A.; von Eiff, C.; Kahl, B.C.; Becker, K.; McNamara, P.; Herrmann, M.; Peters, G. Small colony variants: A pathogenic form of bacteria that facilitates persistent and recurrent infections. Nat. Rev. Microbiol. 2006, 4, 295–305. [Google Scholar] [CrossRef] [PubMed]
- Kahl, B.C.; Becker, K.; Loffler, B. Clinical Significance and Pathogenesis of Staphylococcal Small Colony Variants in Persistent Infections. Clin. Microbiol. Rev. 2016, 29, 401–427. [Google Scholar] [CrossRef] [Green Version]
- Proctor, R.A.; Kriegeskorte, A.; Kahl, B.C.; Becker, K.; Loffler, B.; Peters, G. Staphylococcus aureus Small Colony Variants (SCVs): A road map for the metabolic pathways involved in persistent infections. Front. Cell. Infect. Microbiol. 2014, 4. [Google Scholar] [CrossRef] [PubMed]
- McNamara, P.J.; Proctor, R.A. Staphylococcus aureus small colony variants, electron transport and persistent infections. Int. J. Antimicrob. Agents 2000, 14, 117–122. [Google Scholar] [CrossRef]
- Tuchscherr, L.; Loffler, B.; Proctor, R.A. Persistence of Staphylococcus aureus: Multiple Metabolic Pathways Impact the Expression of Virulence Factors in Small-Colony Variants (SCVs). Front. Microbiol. 2020, 11, 1028. [Google Scholar] [CrossRef]
- Garcia, L.G.; Lemaire, S.; Kahl, B.C.; Becker, K.; Proctor, R.A.; Denis, O.; Tulkens, P.M.; Van Bambeke, F. Antibiotic activity against small-colony variants of Staphylococcus aureus: Review of in vitro, animal and clinical data. J. Antimicrob. Chemother. 2013, 68, 1455–1464. [Google Scholar] [CrossRef] [Green Version]
- Proctor, R.A.; Kahl, B.; von Eiff, C.; Vaudaux, P.E.; Lew, D.P.; Peters, G. Staphylococcal small colony variants have novel mechanisms for antibiotic resistance. Clin. Infect. Dis. 1998, 27, S68–S74. [Google Scholar] [CrossRef] [Green Version]
- Cervantes-García, E.; García-Gonzalez, R.; Reyes-Torres, A.; Resendiz-Albor, A.A.; Salazar-Schettino, P.M. Staphylococcus aureus small colony variants in diabetic foot infections. Diabet. Foot Ankle 2015, 17, 26431. [Google Scholar] [CrossRef] [Green Version]
- von Eiff, C.; Proctor, R.A.; Peters, G. Staphylococcus aureus small colony variants: Formation and clinical impact. Int. J. Clin. Pract. 2000, 44–49. [Google Scholar]
- Bogut, A.; Magrys, A. The road to success of coagulase-negative staphylococci: Clinical significance of small colony variants and their pathogenic role in persistent infections. Eur. J. Clin. Microbiol. Infect. Dis. 2021, 40, 2249–2270. [Google Scholar] [CrossRef] [PubMed]
- Evans, T.J. Small colony variants of Pseudomonas aeruginosa in chronic bacterial infection of the lung in cystic fibrosis. Future Microbiol. 2015, 10, 231–239. [Google Scholar] [CrossRef] [PubMed]
- Malone, J.G. Role of small colony variants in persistence of Pseudomonas aeruginosa infections in cystic fibrosis lungs. Infect. Drug Resist. 2015, 8, 237–247. [Google Scholar] [CrossRef] [PubMed] [Green Version]
- Santos, V.; Hirshfield, I. The Physiological and Molecular Characterization of a Small Colony Variant of Escherichia coli and Its Phenotypic Rescue. PLoS ONE 2016, 11. [Google Scholar] [CrossRef] [PubMed] [Green Version]
- Wang, X.M.; Zheng, X.; Huang, M.H.; Liu, L.L. A comparative genomic analysis of small-colony variant and wild-type Burkholderia pseudomallei in a patient with bacterial liver abscess. J. Glob. Antimicrob. Resist. 2020, 21, 16–21. [Google Scholar] [CrossRef]
- Kriegeskorte, A.; Grubmuller, S.; Huber, C.; Kahl, B.C.; von Eiff, C.; Proctor, R.A.; Peters, G.; Eisenreich, W.; Becker, K. Staphylococcus aureus small colony variants show common metabolic features in central metabolism irrespective of the underlying auxotrophism. Front. Cell. Infect. Microbiol. 2014, 4, 141. [Google Scholar] [CrossRef]
- Seggewiss, J.; Becker, K.; Kotte, O.; Eisenacher, M.; Yazdi, M.R.K.; Fischer, A.; McNamara, P.; Al Laham, N.; Proctor, R.; Peters, G.; et al. Reporter metabolite analysis of transcriptional profiles of a Staphylococcus aureus strain with normal phenotype and its isogenic hemB mutant displaying the small-colony-variant phenotype. J. Bacteriol. 2006, 188, 7765–7777. [Google Scholar] [CrossRef] [Green Version]
- Kohler, C.; Von Eiff, C.; Liebeke, M.; McNamara, P.J.; Lalk, M.; Proctor, R.A.; Hecker, M.; Engelmann, S. A defect in menadione biosynthesis induces global changes in gene expression in Staphylococcus aureus. J. Bacteriol. 2008, 190, 6351–6364. [Google Scholar] [CrossRef] [Green Version]
- Kohler, C.; von Eiff, C.; Peters, G.; Proctor, R.A.; Hecker, M.; Engelmann, S. Physiological characterization of a heme-deficient mutant of Staphylococcus aureus by a proteomic approach. J. Bacteriol. 2003, 185, 6928–6937. [Google Scholar] [CrossRef] [Green Version]
- Kriegeskorte, A.; Konig, S.; Sander, G.; Pirkl, A.; Mahabir, E.; Proctor, R.A.; von Eiff, C.; Peters, G.; Becker, K. Small colony variants of Staphylococcus aureus reveal distinct protein profiles. Proteomics 2011, 11, 2476–2490. [Google Scholar] [CrossRef]
- Becker, K.; Al Laham, N.; Fegeler, W.; Proctor, R.A.; Peters, G.; von Eiff, C. Fourier-Transform infrared spectroscopic analysis is a powerful tool for studying the dynamic changes in Staphylococcus aureus small-colony variants. J. Clin. Microbiol. 2006, 44, 3274–3278. [Google Scholar] [CrossRef] [PubMed]
- Zarnowiec, P.; Lechowicz, L.; Czerwonka, G.; Kaca, W. Fourier Transform Infrared Spectroscopy (FTIR) as a Tool for the Identification and Differentiation of Pathogenic Bacteria. Curr. Med. Chem. 2015, 22, 1710–1718. [Google Scholar] [CrossRef] [PubMed]
- Naumann, D.; Helm, D.; Labischinski, H. Microbiological characterizations by FT-IR spectroscopy. Nature 1991, 351, 81–82. [Google Scholar] [CrossRef] [PubMed]
- Yu, C.X.; Irudayaraj, J. Spectroscopic characterization of microorganisms by Fourier transform infrared microspectroscopy. Biopolymers 2005, 77, 368–377. [Google Scholar] [CrossRef] [PubMed]
- Johler, S.; Stephan, R.; Althaus, D.; Ehling-Schulz, M.; Grunert, T. High-resolution subtyping of Staphylococcus aureus strains by means of Fourier-transform infrared spectroscopy. Syst. Appl. Microbiol. 2016, 39, 189–194. [Google Scholar] [CrossRef] [Green Version]
- Salvado, N.; Buti, S.; Tobin, M.J.; Pantos, E.; Prag, A.; Pradell, T. Advantages of the use of SR-FT-IR microspectroscopy: Applications to cultural heritage. Anal. Chem. 2005, 77, 3444–3451. [Google Scholar] [CrossRef]
- Miller, L.M.; Dumas, P. Chemical imaging of biological tissue with synchrotron infrared light. Biochim. Et Biophys. Acta 2006, 1758, 846–857. [Google Scholar] [CrossRef] [Green Version]
- Jackson, M.; Mantsch, H.H. The use and misuse of FTIR spectroscopy in the determination of protein structure. Crit. Rev. Biochem. Mol. Biol. 1995, 30, 95–120. [Google Scholar] [CrossRef]
- Cerf, E.; Sarroukh, R.; Tamamizu-Kato, S.; Breydo, L.; Derclaye, S.; Dufrêne, Y.F.; Narayanaswami, V.; Goormaghtigh, E.; Ruysschaert, J.M.; Raussens, V. Antiparallel beta-sheet: A signature structure of the oligomeric amyloid beta-peptide. Biochem. J. 2009, 421, 415–423. [Google Scholar] [CrossRef] [Green Version]
- Sarroukh, R.; Cerf, E.; Derclaye, S.; Dufrêne, Y.F.; Goormaghtigh, E.; Ruysschaert, J.M.; Raussens, V. Transformation of amyloid β(1-40) oligomers into fibrils is characterized by a major change in secondary structure. Cell. Mol. Life Sci. 2011, 68, 1429–1438. [Google Scholar] [CrossRef]
- Wang, Y.-D.; Li, X.-L.; Liu, Z.-X.; Zhang, X.-X.; Hu, J.; Lü, J.-H. Discrimination of foodborne pathogenic bacteria using synchrotron FTIR microspectroscopy. Nucl. Sci. Tech. 2017, 28, 1–6. [Google Scholar] [CrossRef]
- Cheeseman, S.; Shaw, Z.L. Analysis of Pathogenic Bacterial and Yeast Biofilms Using the Combination of Synchrotron ATR-FTIR Microspectroscopy and Chemometric Approaches. Molecules 2021, 26, 3890. [Google Scholar] [CrossRef] [PubMed]
- Bogut, A.; Niedźwiadek, J.; Kozioł-Montewka, M.; Strzelec-Nowak, D.; Blacha, J.; Mazurkiewicz, T.; Marczyński, W.; Plewik, D. Characterization of Staphylococcus epidermidis and Staphyloccocus warneri small-colony variants associated with prosthetic-joint infections. J. Med. Microbiol. 2014, 63, 176–185. [Google Scholar] [CrossRef] [PubMed] [Green Version]
- Novais, A.; Freitas, A.R.; Rodrigues, C.; Peixe, L. Fourier transform infrared spectroscopy: Unlocking fundamentals and prospects for bacterial strain typing. Eur. J. Clin. Microbiol. Infect. Dis. 2019, 38, 427–448. [Google Scholar] [CrossRef] [PubMed]
- Brezillon, S.; Untereiner, V.; Lovergne, L.; Tadeo, I.; Noguera, R.; Maquart, F.X.; Wegrowski, Y.; Sockalingum, G.D. Glycosaminoglycan profiling in different cell types using infrared spectroscopy and imaging. Anal. Bioanal. Chem. 2014, 406, 5795–5803. [Google Scholar] [CrossRef]
- Raouf, G.A.; Al-Malki, A.R.L.; Mansouri, N.; Mahmoudi, R.M. Preliminary Study in diagnosis and early prediction of Preeclampsia by Using FTIR Spectroscopy Technique. Life Sci. J. 2011, 8, 453–464. [Google Scholar]
- Kong, J.; Yu, S. Fourier transform infrared spectroscopic analysis of protein secondary structures. Acta Biochim. Et Biophys. Sin. 2007, 39, 549–559. [Google Scholar] [CrossRef] [Green Version]
- Al-Bakri, A.G.; Bulatova, N.R.; Younes, N.A.; Othman, G.; Jaber, D.; Schleimer, N.; Kriegeskorte, A.; Becker, K. Characterization of staphylococci sampled from diabetic foot ulcer of Jordanian patients. J. Appl. Microbiol. 2021, 131, 2552–2566. [Google Scholar] [CrossRef]
- Du, F.; Ma, J.; Gong, H.; Bista, R.; Zha, P.; Ren, Y.; Gao, Y.; Wang, C. Microbial Infection and Antibiotic Susceptibility of Diabetic Foot Ulcer in China: Literature Review. Front. Endocrinol. 2022, 13, 881659. [Google Scholar] [CrossRef]
- Boschetti, G.; Sgarabotto, D.; Meloni, M. Antimicrobial Resistance Patterns in Diabetic Foot Infections, an Epidemiological Study in Northeastern Italy. Antibiotics 2021, 10, 1241. [Google Scholar] [CrossRef]
- Viswanathan, V.; Pendsey, S.; Radhakrishnan, C.; Rege, T.D.; Ahdal, J.; Jain, R. Methicillin-Resistant Staphylococcus aureus in Diabetic Foot Infection in India: A Growing Menace. Int. J. Low. Extrem. Wounds 2019, 18, 236–246. [Google Scholar] [CrossRef] [PubMed]
- Guliev, R.R.; Suntsova, A.Y.; Vostrikova, T.Y.; Shchegolikhin, A.N.; Popov, D.A.; Guseva, M.A.; Shevelev, A.B.; Kurochkin, I.N. Discrimination of Staphylococcus aureus Strains from Coagulase-Negative Staphylococci and Other Pathogens by Fourier Transform Infrared Spectroscopy. Anal. Chem. 2020, 92, 4943–4948. [Google Scholar] [CrossRef] [PubMed]
- Shapaval, V.; Afseth, N.K.; Vogt, G.; Kohler, A. Fourier transform infrared spectroscopy for the prediction of fatty acid profiles in Mucor fungi grown in media with different carbon sources. Microb. Cell Fact. 2014, 13. [Google Scholar] [CrossRef] [PubMed] [Green Version]
- Wei, Z.L.; Jiao, D.J.; Xu, J.X. Using Fourier Transform Infrared Spectroscopy to Study Effects of Magnetic Field Treatment on Wheat (Triticum aestivum L.) Seedlings. J. Spectrosc. 2015, 2015. [Google Scholar] [CrossRef] [Green Version]
- Brakstad, O.G.; Aasbakk, K.; Maeland, J.A. Detection of Staphylococcus aureus by polymerase chain reaction amplification of the nuc gene. J. Clin. Microbiol. 1992, 30, 1654–1660. [Google Scholar] [CrossRef] [Green Version]
- Martineau, F.; Picard, F.J.; Roy, P.H.; Ouellette, M.; Bergeron, M.G. Species-specific and ubiquitous DNA-based assays for rapid identification of Staphylococcus epidermidis. J. Clin. Microbiol. 1996, 34, 2888–2893. [Google Scholar] [CrossRef] [Green Version]
- von Eiff, C.; Bettin, D.; Proctor, R.A.; Rolauffs, B.; Lindner, N.; Winkelmann, W.; Peters, G. Recovery of small colony variants of Staphylococcus aureus following gentamicin bead placement for osteomyelitis. Clin. Infect. Dis. 1997, 25, 1250–1251. [Google Scholar] [CrossRef] [Green Version]
- Dahabiyeh, L.A.; Mansour, R.S.H.; Saleh, S.S.; Kamel, G. Investigating the molecular structure of placenta and plasma in pre-eclampsia by infrared microspectroscopy. J. Pharm. Biomed. Anal. 2020, 184. [Google Scholar] [CrossRef]
- Nimer, R.; Kamel, G.; Obeidat, M.A.; Dahabiyeh, L.A. Investigating the molecular structure of plasma in type 2 diabetes mellitus and diabetic nephropathy by synchrotron Fourier-transform infrared microspectroscopy. Spectrochim. Acta A Mol. Biomol. Spectrosc. 2022, 264. [Google Scholar] [CrossRef]
- Dahabiyeh, L.A.; Mansour, R.S.; Darwish, W.; Saleh, S.S.; Kamel, G. Plasma drop and thin-film revealed distinguished molecular structure in pre-eclampsia: An investigation using synchrotron Fourier-transform infrared microspectroscopy. J. Pharm. Biomed. Anal. 2022, 220, 114981. [Google Scholar] [CrossRef]
| Designation | Species and Phenotype | Reference |
|---|---|---|
| SaW 1 | S. aureus (wild type) | [33] |
| SaSCV 1 | S. aureus (natural SCV) | [33] |
| SaMu 1 | S. aureus (hemB mutant) | [21] |
| SaCMu 1 | S. aureus (complemented mutant) | [21] |
| ASa2 | S. aureus (control) ATCC 29213 | |
| ASe1 | S. epidermidis (control) ATCC 12228 | |
| NSCV | S. epidermidis (natural SCV) | Current work |
| ASCV | S. epidermidis (natural SCV) | Current work |
| LSCV | S. epidermidis (natural SCV) | Current work |
Publisher’s Note: MDPI stays neutral with regard to jurisdictional claims in published maps and institutional affiliations. |
© 2022 by the authors. Licensee MDPI, Basel, Switzerland. This article is an open access article distributed under the terms and conditions of the Creative Commons Attribution (CC BY) license (https://creativecommons.org/licenses/by/4.0/).
Share and Cite
Al-Bakri, A.G.; Dahabiyeh, L.A.; Khalil, E.; Jaber, D.; Kamel, G.; Schleimer, N.; Kohler, C.; Becker, K. Synchrotron-Radiation-Based Fourier Transform Infrared Microspectroscopy as a Tool for the Differentiation between Staphylococcal Small Colony Variants. Antibiotics 2022, 11, 1607. https://doi.org/10.3390/antibiotics11111607
Al-Bakri AG, Dahabiyeh LA, Khalil E, Jaber D, Kamel G, Schleimer N, Kohler C, Becker K. Synchrotron-Radiation-Based Fourier Transform Infrared Microspectroscopy as a Tool for the Differentiation between Staphylococcal Small Colony Variants. Antibiotics. 2022; 11(11):1607. https://doi.org/10.3390/antibiotics11111607
Chicago/Turabian StyleAl-Bakri, Amal G., Lina A. Dahabiyeh, Enam Khalil, Deema Jaber, Gihan Kamel, Nina Schleimer, Christian Kohler, and Karsten Becker. 2022. "Synchrotron-Radiation-Based Fourier Transform Infrared Microspectroscopy as a Tool for the Differentiation between Staphylococcal Small Colony Variants" Antibiotics 11, no. 11: 1607. https://doi.org/10.3390/antibiotics11111607