Surface Functionalization of a Polyurethane Surface via Radio-Frequency Cold Plasma Treatment Using Different Gases


Center for Advanced Materials, Qatar University, P.O. Box 2713 Doha, Qatar
*
Author to whom correspondence should be addressed.
Coatings 2020, 10(11), 1067; https://doi.org/10.3390/coatings10111067
Submission received: 15 October 2020
/
Revised: 30 October 2020
/
Accepted: 4 November 2020
/
Published: 6 November 2020
(This article belongs to the Section Plasma Coatings, Surfaces & Interfaces)
Abstract
:Herein, the surface treatment of polyurethane (PU) films via air, O2, N2, Ar, and their mixtures were tested. The treatment was performed to incorporate new polar functionalities on the polymer surface and achieve improved hydrophilic characteristics. The PU films were subjected to RF low-temperature plasma treatment. It was found that plasma treatment immensely enhanced the hydrophilic surface properties of the PU films in comparison with those of the pristine samples; the maximum plasma effect occurred for the PU sample in the presence of air plasma with treatment time of 180 s at nominal power of 80 W. The surface topography was also found to vary with plasma exposure time and the type of gas being used due to the reactivity of the gaseous media. Roughness analysis revealed that at higher treatment times, the etching/degradation of the surface became more pronounced. Surface chemistry studies revealed increased O2 and N2 elemental groups on the surface upon exposure to O2, N2, air, and Ar. Additionally, the aging study revealed that samples treated in the presence of air and Ar were more stable in comparison to those of the other gases for both the contact angle and peel test measurements.
1. Introduction
Polyurethanes (PUs) are polymers known for their good mechanical properties, abrasion resistance, durability, flexibility, and biocompatibility, along with ease of finishing and low weight [1]. Therefore, PUs is commonly used for industrial and medical applications as adhesive, coating, film, catheter, and orthopedic device [2]. However, despite its excellent properties, for some applications where good wettability and adhesion are required, the use of PUs is quite restricted. Most polymers are characterized by low surface energy values resulting in inherently poor adhesion [3,4]. The poor adhesion is mainly attributed to its chemical inertness due to a lack of polar functional groups on its surface. Therefore, further surface modification is mandatory for specific applications involving polymeric materials [2,5,6].
It was demonstrated in the literature that surface modification through inserting new functional groups, including carboxyls, hydroxyls, and amines, into the polymer surface has been shown to immensely enhance the inert surface properties of polymers [7,8]. Various modification procedures have been devised for this purpose. In the past, chemical wetting with reagents such as acids and oxidizers has been utilized to increase the adhesion strength by introducing new functional groups at the interface. However, such procedures are environmentally unfriendly due to the used of hazardous chemical substances. Therefore, for ecological requirements, different alternatives have been employed to alter the surface composition and topography of polymeric materials. Plasma techniques, specifically low-temperature plasma, have been demonstrated to be an efficient method for this purpose [9,10]. This technology has become more preferred over other techniques because it represents an effective, clean, fast, easy, economical, and environmentally friendly method. Its application has become one of the most widely used techniques for surface modification applied throughout various fields that include the food industry along with physics, chemistry, material science, and medicine [11]. Although plasma treatment is limited to only a few nanometers in-depth, it remarkably enhances the surface properties of polymeric materials, including adhesion, printability, hydrophilicity, and biocompatibility, without affecting their bulk properties [12,13,14,15]. During plasma treatment, gas molecules are disassociated into electrons, ions, free radicals, photons, and neutral species [16]. The modification proceeds by functionalizing the polymeric surface through an interaction with an active species along with inducing surface ablation, etching, crosslinking and chain scission, which results in a series of physical and chemical changes [17,18,19,20]. The latter results are achieved by breaking the existing chemical bonds and forming new ones, resulting in new groups at the surface, which then undergo further oxidation as the surface is exposed to air [21]. The active species from plasma are generated at an electrode through a radio-frequency (RF), microwave, or dielectric barrier discharge power source. In contrast to corona and dielectric barrier discharge treatments, the RF plasma system is not only confined to treating flat thin surfaces but can also be used for three-dimensional configurations [22].
In this paper, the possibilities and limitations of improving the surface properties of PUs by treatment with low-temperature RF plasma are studied. Plasma activation is typically performed using various gases (Ar, O2, He, CO2, N2, NH3, H2, CF4, SF4, C4F8, or air) and their choice depends on the expected effects of surface treatment. Fluoride plasmas are typically used if the purpose of activation is to reduce chemical activity or to induce release properties. The main goal of this work is to increase the surface hydrophilicity through introducing new functionalities on the polymeric surface during plasma activation including reactive groups including but not limited to hydroxyl (–OH), carboxylic (–COOH), an amine (–NH2). This requires the use of oxygen-containing gas media such as air, oxygen, and nitrogen. Ar gas, on the other hand, can be utilized to produce radicals that will react with oxygen or water in the air to form oxygen functionalities, which are able to enhance the surface hydrophilicity. Therefore, in this study O2, N2, air, and Ar discharges and their mixtures were used as plasma gases. The optimum treatment conditions were determined by varying the nominal power, exposure time, gas type, and gas mixtures. Particular attention was given to factors that critically alter the surface wettability, including surface energy, morphology, surface chemistry, and long-term aging studies were performed to analyze the stability of this surface treatment. The interrelations between these elements and the surface hydrophilicity were characterized by contact angle measurements. This paper provides a prerequisite study to properly quantify the effect of plasma treatment on the surface hydrophilicity and surface structural changes of polyurethane films at optimum operating conditions and to properly demonstrate the underlying causes of the aforementioned modifications applicable in various applications where improved wettability and adhesion is required.
2. Materials and Methods
2.1. Materials
Ethylene glycol (>98% FLUKA, Morris Plains, NJ, USA), formamide (>98% FLUKA, Merelbeke, Belgium), and ultra-pure water (prepared by Direct Q3 purification system, Molsheim, France), were used as testing liquids for the contact angle measurements. Films of polyether-based polyurethane (PU) approximately 0.21 mm thick were provided by American Polyfilm (American Polyfilm Inc., Branford, CT, USA). The films were immersed in ethanol (99.9% Merck, Darmstadt, Germany) to remove any specks of dust or possible contaminants from the production process that might affect the surface properties and were thoroughly dried. Small strips (5 × 1 cm2) were cut out and directly used for surface treatment and various analyses.
2.2. Plasma Treatment of PU Films
Plasma treatment of PU films was carried out at a low pressure using Venus75-HF RF-plasma equipment (Plasma Etch, Carson City, NV, USA) [23]. During plasma treatment, the ions and electrons in this system were generated by the means of a radio-frequency (RF) nominal power operating at a typical frequency of 13.56 MHz. This equipment generates capacitively coupled radio-frequency plasma (glow discharge) and it consisted of a cylindrical chamber made of aluminum (25 cm in diameter and 28 cm deep). A capacitive parallel plate design allowed generating nominal power with a maximum of 120 W. All the operational parameters were fully controllable by the PC software Plasma Etch (version 1.3.0), such as treatment time, nominal power, gas flow, gas mixture flow, for achieving an optimal plasma treatment process of the samples. Process parameters, including nominal power, exposure time, gas type, and gaseous mixtures, were varied to optimize the plasma treatment process for obtaining the maximum hydrophilicity. The working pressure was about 27 Pa, and the treatment time was applied from 10 s up to 240 s at 50–120 W of nominal power and 10 cm3 min−1 of gas flow. The film surface was treated by introducing air, O2, N2, and Ar along with their mixtures individually in different runs. The treatments involving gas mixtures were applied at different ratios (1:4, 1:2, and 3:4).
2.3. Surface Wettability Measurements
Static contact angle measurements were performed by the sessile drop method using a surface energy analysis system OCA35 (DataPhysics, Filderstadt, Germany) equipped with a CCD camera to study the effect of plasma treatment on the surface hydrophilicity of PU. At least five measurements were carried out on each substrate to minimize the error, and a representative value was calculated for each measurement using an average sum. Ultra-pure water, formamide, and ethylene glycol were used as contacting liquids. A droplet of approximately 3 µL from each testing liquid was dispensed on air-facing samples. The contact angle was calculated after approximately 3 s to ensure a thermodynamic equilibrium between the liquid and the sample interface. The conventional Owens–Wendt–Rabel–Kaelble method was used to evaluate the total surface free energy and the polar and dispersive components.
2.4. Surface Chemistry Characterization
The changes in the surface chemistry of plasma-treated PU films were examined using a Fourier transform infrared spectroscopy with an attenuated total reflectance mode (FTIR-ATR). The FTIR system Spectrum 400 (Perkin Elmer, Waltham, MA, USA) was equipped with a ZnSe crystal where the sample was fixed using a pressurized clamp. The spectra were obtained using an average of eight scans and a resolution of 4 cm−1 in a 4000–550 cm−1 wavenumbers interval.
The changes in the chemical composition of the plasma-treated PU surface were calculated by X-ray photoelectron spectroscopy (XPS). An AXIS XPS system (Kratos Analytical, Manchester, UK) was used for this analysis. The XPS system contains a spherical mirror analyzer and a delay-line detector for fast chemical composition screening and ensuring high spectral resolution and sensitivity. This system also allows for analyzing data from a sampling depth of 1–10 nm. The chemical composition was obtained from one measurement of each sample and therefore the chemical composition is within an error margin of the measurement.
2.5. Surface Morphology Analysis
The surface morphology of the PU films before and after plasma treatment was analyzed using an optical microscope system-profilometer Leica DCM8 (Leica microsystems, Wetzlar, Germany). The optical system was used to monitor the topological changes induced by plasma treatment on the treated surfaces. Images and the surface roughness calculated using the arithmetical mean height (Sa) over the entire measured area were obtained from approximately 29 × 22 µm2 area using a 100× magnification objective with 6× zooming. Different locations were first carefully analyzed and then the representative images of the samples were captured.
Detailed information about three-dimensional changes in the surface topography of the PU surface after plasma treatment was obtained using atomic force microscopy (AFM). The MFP-3D device (Asylum Research, Abingdon, Oxford, UK) was employed in these experiments. Scanning was carried out under ambient conditions by a silicon probe (Al reflex-coated Veeco model—OLTESPA, Olympus) in tapping mode in air (AC mode), allowing images with a surface area of 10 × 10 µm2 to be obtained. Moreover, the roughness parameter such as an arithmetic average of the roughness profile (Ra) was calculated from AFM images obtained from a Z-Sensor.
2.6. Peel Test
A peel adhesion test was performed to measure the adhesion properties of the PU in terms of the peel resistance using a standard testing machine Lloyd 1 K Lf plus-UTM (Lloyd instrument, West Sussex, UK). Samples with a width of 19 mm and a length of 6 cm were fixed on Scotch tape consisted of poly (2-ethylhexyl acrylate) adhesive deposited on polypropylene film. The test was performed using Scotch tape pressed on the top of the PU surface. The loose end of the testing tape was fixed by a clamp at a 90-degree angle from the sample base and peeled off at a crosshead speed of 10 mm/min. The test was stopped after 6 min when the tape was completely detached from the surface. At least six readings were performed allowing obtaining average values of peel resistance.
3. Results and Discussion
3.1. Surface Wettability Analysis
Changes in wettability induced by plasma treatment were analyzed through contact angle measurements. To study the impact of nominal power on the PU wetting properties, several treatments were carried out under different applied powers ranging from 50 to 120 W at 60 s, after which the optimum nominal power was selected. The contact angle and surface free energy with respect to the nominal power are presented in Figure 1. The highest surface energy and the lowest contact angle were achieved upon applying 80 W of nominal power. Therefore, further plasma treatments were carried out at a fixed nominal power of 80 W. The hydrophilic/hydrophobic character of the PU films treated using air, O2, N2, and Ar plasma was evaluated via contact angle of water measurements. The contact angle of the water as a function of treatment time using different gases is presented in Figure 2. The results showed that the contact angle of water was 96° for untreated PU, which was hydrophobic [24]. The latter results were expected given the chemically inert nature of PU due to a lack of active functional groups on its surface. Nevertheless, using 60 s plasma treatment the contact angle of water decreased to the range of 30°–61° using different gaseous media, out of which air was the most effective. This was caused by the incorporation of more hydrophilic functional groups on the PU surface confirmed by XPS later on. These findings have been further validated by calculating the surface free energy. An increase in the value of the polar component of the total surface free energy was observed, which confirms the functionalization of PU surfaces. It is important to mention that once the treatment time was extended above 180 s, the water contact angle was stabilized, indicating that PU was not receptive to any new polar groups on its surface as the plasma saturation state was achieved. The enhancement of the hydrophilicity characteristics of the PU films discussed above resulted from a sequence of effects. Plasma treatment promotes the formation of active oxygen- and nitrogen-containing functional groups that strengthen the binding energy between contacting substrates; as a result, the surface hydrophilicity is enhanced [21]. Moreover, upon exposing the samples to air immediately after plasma treatment, the PU surface is enriched in free radicals susceptible to atmospheric oxidation. This also results in the incorporation of new oxygen-containing polar groups, such as hydroxyl and carbonyl groups, which further contribute to increasing the surface wettability [22,25,26].
The effect of using gas mixtures in comparison to pure gases has also been studied at 80 W and 180 s. Three gas mixtures consisting of N2/O2, Ar/O2, and N2/Ar were used as activation media in the plasma reactor. The concentration of the gases was varied from 25% to 75%. The wetting behavior/hydrophilicity after N2/O2, Ar/O2, and N2/Ar plasma treatment are shown in Figure 3, Figure 4 and Figure 5. Using different concentration ratios of N2/O2 and N2/Ar did not impart any notable changes in the contact angle of water. However, in the case of Ar/O2, a slight decrease in the surface hydrophilicity was observed in comparison to that of pure O2, yet the effect is less noticeable when compared to that of pure Ar.
3.2. Adhesion Investigation
Peel testing was used to measure the adhesion properties of plasma treated surfaces. The peel resistance with respect to exposure time was measured immediately after plasma treatment, as shown in Figure 6. The peel resistance increased for all treated specimens regardless of the gas used during the plasma treatment. The highest peel resistance value was observed for samples treated in air. The latter is due to the formation of polar-containing groups, which resulted in the highest wettability and therefore the bonding strength between the contacting substrates (PU/Scotch tape) increased as well. Moreover, the highest surface roughness was observed for PU plasma treated in air, which also contributed to the peel resistance increase.
3.3. Hydrophobic Recovery Analysis
3.3.1. Wettability Aging
The contact angle of water was measured over a month-long period for samples in ambient air conditions to study the stability of the introduced polar groups. Figure 7 represent the evolution of the contact angle of water with respect to aging time for the PU treated with different gases. The aging effect was more pronounced during the first 6 h, where a steep increase in the contact angle of water was observed. The hydrophobic recovery for PU was stabilized from 50 h and onward. The hydrophobic/aging phenomenon can be explained in terms of the surface properties of post-plasma treatment. After plasma functionalization, the surface reached a non-equilibrium state due to the increase in surface energy, resulting in near-surface gradients. Therefore, the surface tends to return to its pre-plasma stage by reconstructing its surface to lower surface energy. The latter occurs by reorientation/migration of the polar groups, which are redirected back to the bulk of the polymer [27].
3.3.2. Adhesion Aging
To study the stability of the adhesion, the peel resistance was measured every 24 h for a period of 500 h. An aging study was carried out for samples stored in air (Figure 8). The peel resistance after the first 24 h of the plasma treatment decreased by approximately 25% for all gases except N2, where a slight jump in the peel resistance value occurred after 24 to 48 h oxygen- and nitrogen-treated PU samples exhibiting a great decrease in peel resistance and almost returned to that of the untreated sample (37 to 40 N/m). This was associated with the decrease inaction of the hydrophobic surface and is related to the reorientation of hydrophilic functionalities away from the surface and toward the bulk of the polymer. The above phenomenon is commonly referred to as the hydrophobic recovery of the polymer. After 168 h, the aging behavior started to stabilize with all gas-treated samples, and air-treated PU samples showed the highest stabilization with a 32% loss.
3.4. Surface Chemistry Analysis
Fourier transform infrared spectroscopy was mainly used to identify the main chemical functional groups of the PU samples and any additions or changes to the chemical composition after plasma treatment. Through the unique absorption of IR radiation by bonding vibrations, main groups or groups of branching chemical species can be recognized in compounds, complexes, or even polymers. The main goal of the FTIR measurements is to identify the fundamental groups that changed in the PU after exposure to plasma using different gases. The effect of each gas may vary based on the intensity of plasma initiation followed by that of the specific gas. Herein, the intensity was fixed, and the gases were varied with their concentration unchanged. The change in gas type can affect the types and concentration of new functional group formation or ablation. Figure 9 shows the IR spectra of PU before and after plasma treatment. The PU has aromatic and aliphatic double bond hydrocarbons (–C=C 1550–1650 cm−1) (=C–H ~3000 cm−1), carbonyl groups with different vibrations based on their conjugation (–N–C=O and O–C=O at 1725 and 1630 cm−1, respectively), ether group C–O–C at 1162 cm−1) and nitrogen-containing groups in the stretching and fingerprint region (–NH 3331, 1237 cm−1). After exposure to plasma using different gases, the carbonyl of the urethane group interestingly disappeared (1635 cm−1), suggesting either the breakage between the carbonyl carbon and nitrogen, so its vibration became stronger and overlapped with the main C=O at 1725 cm−1, or the breakage of the carbonyl bond to form ether groups of C–O–C, in which case the vibration shifted to a lower wavenumber [1]. Comparing the effect of gas variation showed no significant differences in the submicron level by IR absorption. A thorough study was performed to measure the exact concentration % of each element by XPS.
The atomic composition pre- and post-plasma treatment was measured using XPS. The chemical composition of the C 1s, O 1s, and N 1s components is summarized in Table 1. The quantification report of the spectra for untreated PU showed that carbon constituted approximately 81.1% of the total atomic composition, which was relatively high compared to that of nitrogen and oxygen (3.1% and 15.9%, respectively). The presence of oxygen and nitrogen groups in the untreated sample is explained by the presence of those elements in the structural backbone of polyurethane polymers. Plasma activation using air, O2, N2, and Ar led to the changes in the XPS spectra as a result of functionalization and ablation processes. The percentage of oxygen atoms noticeably increased after plasma treatment for all the gases used except N2 (slightly increase), which indicated that the number of oxygen-containing functional groups increased relative to that of the untreated sample. On the other hand, the nitrogen content increased only for the samples treated with N2 gas medium. Figure 10 shows the XPS spectra for the PU samples, where the oxygen and nitrogen peaks were observed in the range of 500–550 eV and 400 eV of binding energy, respectively. The XPS results correlate well with the contact angle measurements, where it was found that the lowest contact angle of water was obtained for PU films treated with air plasma. Similarly, the carbon content shown in Table 1 for the samples treated with air plasma was found to be the lowest. This indicates that the formation of new polar functional groups is higher in comparison with that of the other samples treated with O2, N2, and Ar.
3.5. Surface Morphology Analysis
An optical profilometer was performed to analyze the surface topological changes induced by plasma treatment. The surface topography images corresponding to the untreated and plasma treated PU films using air, O2, N2, and Ar and their mixtures are shown in Figure 11 and Figure 12. From the observations of the corresponding 3D images with a size of approximately 29 × 22 µm2 for untreated PU, small micro indentations could be seen on the film surfaces that were caused by industrial production. After plasma treatment, no remarkable morphological changes were observed for PU treated with O2 and Ar plasma or gaseous mixtures. However, the surface of PU treated with air and N2 plasma showed annular bulges, cavities, and micro-holes. The topographic changes are due to the striking interactions of the active species with the exposed surfaces during the plasma activation stage [28]. This results in a surface etching where the outermost top layer of the polymer is removed. The surface roughness parameter in terms of the arithmetical mean height (Sa) was calculated too. Figure 13 represents a summary of the surface roughness values for untreated and plasma treated PU with different gases and treatment times. It was expected that as the exposure time increased, the etching effect of the plasma would increase in return; however, the roughness values exhibited rather large fluctuations. Initially, in the time interval from 10–30 s, the roughness presented slight variations in terms of treatment time. However, the trend stabilized as the surface became more homogenous from 60–180 s. These results agree with the wettability studies discussed in the previous sections.
The effect of plasma treatment on the surface roughness of the PU films using gaseous mixtures was also examined with respect to gas concentration and the results presented in Figure 14. The PU films treated using a pure O2 atmosphere exhibited a Sa value of 20.2 nm, which were then exposed to different gas mixtures of N2/O2 and Ar/O2. Increasing the concentration of N2 and Ar during the treatment led to the increase in the surface roughness of the respective films until the Ar or N2 concentration reached 75%, after which the roughness started to decline. Accordingly, PU films were also treated using N2/Ar and had a similar trend to that of N2/O2 and Ar/O2, where the surface roughness was 24.2 nm under pure N2 atmosphere and increased to 33 nm at the 25% N2 concentration. Then, the roughness dropped to 15.9 nm for the pure Ar atmosphere. These observations strongly suggest that the treatment under gas mixtures results in a higher level of roughness compared to those of pure gases.
In comparison with the gases used, the surface roughness was more apparent in samples treated with air. On the other hand, Ar, when compared to that of the others, presented the least aggressive etching effects. The latter results demonstrate that the surface morphology is noticeably affected by plasma treatment. Given that surface wettability was substantially affected by the surface roughness/morphology, the interrelation between the contact angle values and the roughness values was observed. As discussed previously, the surface hydrophilicity changes were more pronounced on samples treated with air, which shows good agreement with the results discussed herein. This is due to the enhanced penetration of the liquid molecules within the microstructured domains in the plasma treated samples.
To further study the surface topographical changes of PU, AFM was used. This method also allows the quantification of surface roughness parameter in terms of the arithmetical mean height of a line (Ra), which characterizes the average height of irregularities relative to the sample surface in the perpendicular direction. The 3D height images and the Ra calculated from the Z-sensor of the untreated and plasma treated PU (180 s and 80 W) surfaces are shown in Figure 15 and Figure 16. The surface of the untreated samples was smooth with characteristic textures originating from the production process. The value of Ra for the untreated the PU film was relatively low (6.3 nm). Plasma treatment of the PU film led to prominent changes in the surface morphology as a result of etching or ablation reactions in the surface area, while the highest Ra (27.5 nm) value was achieved using air. The use of gas mixtures with a ratio of 1:1, such as N2/O2, Ar/O2, and N2/Ar, led to pronounced changes in surface roughness after 180 s of plasma treatment using Ar and air atmospheres, while the Ra increased to 23 nm and 27.5 nm for Ar and air, respectively. The use of an Ar/O2 gas mixture led to the most visible changes, as a result of strong etching or ablation processes, in the surface area of the PU relative to that of the other gas mixtures, such as N2/O2 or Ar/O2. Moreover, plasma treatment of the LDPE samples in each atmosphere and their mixtures led to the creation of regularly ordered structures, which could positively contribute to the wettability increase.
4. Conclusions
In summary, the PU film was treated using RF plasma treatment using air, O2, N2, Ar, and their mixtures. Changes in the surface properties were investigated using different characterization tools. It was observed that the plasma treated PU film exhibited a highly hydrophilic behavior due to the incorporation of new predominantly oxygen functional groups on the surface. Plasma treatment of PU using air was the most effective in comparison with that of the O2, N2, Ar, and their mixtures in terms of wettability and adhesion characteristics. The highest wettability was achieved with 180 s exposure time at an 80 W nominal power, while the contact angle of water decreased by approximately 69% relative to that of the pristine PU sample. This fact was supported by the highest oxygen content analyzed by XPS and the highest Sa and Ra roughness parameters in compare with other used gases. The plasma treatment led to surface morphological changes that featured notable textured structures on the outer layer of the PU film. The results revealed considerable changes in the surface roughness indicating the effect of etching due to ion bombardment on the film interface. Aging studies revealed that over time, the PU surface after plasma treatment underwent hydrophobic recovery, where the formed functional groups were reoriented to the bulk polymer. Nevertheless, the contact angle of water was still lower compared to that of the untreated PU surface indicating partial hydrophobic recovery.
Author Contributions
Conceptualization, A.P.; methodology, A.P.; validation, A.P., A.E.A., and S.H.; formal analysis, A.P., A.E.A., and S.H.; investigation, A.P., A.E.A., and S.H.; resources, A.P.; data curation, A.P.; writing—original draft preparation, A.E.A.; writing—review and editing, A.P.; visualization, A.E.A.; supervision, A.P.; project administration, A.P.; funding acquisition, A.P. All authors have read and agreed to the published version of the manuscript.
Funding
This publication was made possible by Award JSREP07-022-3-010 from the Qatar National Research Fund (a member of The Qatar Foundation). This publication was supported by the Qatar University Collaborative Grant No. QUCG-CAM-20/21-3. The statements made herein are solely the responsibility of the authors.
Acknowledgments
The authors gratefully acknowledge Gas Processing Center (GPC), Qatar University, for carrying out the XPS analysis.
Conflicts of Interest
The authors declare no conflict of interest.
References
- Fu, X.; Jenkins, M.J.; Sun, G.; Bertoti, I.; Dong, H. Characterization of active screen plasma modified polyurethane surfaces. Surf. Coat. Technol. 2012, 206, 4799–4807. [Google Scholar] [CrossRef]
- Thomson, T. Polyurethanes as Specialty Chemicals: Principles and Applications; CRC Press: Boca Raton, FL, USA, 2004. [Google Scholar]
- Bae, J.-S.; Seo, E.-J.; Kang, I.-K. Synthesis and characterization of heparinized polyurethanes using plasma glow discharge. Biomaterials 1999, 20, 529–537. [Google Scholar] [CrossRef]
- Lamba, N.K. Polyurethanes in Biomedical Applications; Routledge: Abingdon, UK, 2017. [Google Scholar]
- Chattopadhyay, D.K.; Raju, K. Structural engineering of polyurethane coatings for high performance applications. Prog. Polym. Sci. 2007, 32, 352–418. [Google Scholar] [CrossRef]
- Guelcher, S.A. Biodegradable polyurethanes: Synthesis and applications in regenerative medicine. Tissue Eng. Part B Rev. 2008, 14, 3–17. [Google Scholar] [CrossRef]
- Junkar, I.; Vesel, A.; Cvelbar, U.; Mozetič, M.; Strnad, S. Influence of oxygen and nitrogen plasma treatment on polyethylene terephthalate (PET) polymers. Vacuum 2009, 84, 83–85. [Google Scholar] [CrossRef]
- Hegemann, D.; Brunner, H.; Oehr, C. Plasma treatment of polymers for surface and adhesion improvement. Nucl. Instrum. Methods Phys. Res. Sect. B Beam Interact. Mater. At. 2003, 208, 281–286. [Google Scholar] [CrossRef]
- Švorčík, V.; Kolářová, K.; Slepička, P.; Macková, A.; Novotná, M.; Hnatowicz, V. Modification of surface properties of high and low density polyethylene by Ar plasma discharge. Polym. Degrad. Stab. 2006, 91, 1219–1225. [Google Scholar] [CrossRef]
- Pandiyaraj, K.N.; Ferraria, A.M.; do Rego, A.M.B.; Deshmukh, R.R.; Su, P.-G.; Halleluyah, J.M.; Halim, A.S. Low-pressure plasma enhanced immobilization of chitosan on low-density polyethylene for bio-medical applications. Appl. Surf. Sci. 2015, 328, 1–12. [Google Scholar] [CrossRef]
- Lee, T.; Puligundla, P.; Mok, C. Inactivation of foodborne pathogens on the surfaces of different packaging materials using low-pressure air plasma. Food Control 2015, 51, 149–155. [Google Scholar] [CrossRef]
- Ghasemi, M.; Minier, M.J.; Tatoulian, M.l.; Chehimi, M.M.; Arefi-Khonsari, F. Ammonia plasma treated polyethylene films for adsorption or covalent immobilization of trypsin: Quantitative correlation between X-ray photoelectron spectroscopy data and enzyme activity. J. Phys. Chem. B 2011, 115, 10228–10238. [Google Scholar] [CrossRef]
- Park, S.C.; Koh, S.K.; Pae, K.D. Effects of surface modification by Ar+ irradiation on wettability of surfaces of poly (ethylene terephthalate) films. Polym. Eng. Sci. 1998, 38, 1185–1192. [Google Scholar] [CrossRef]
- Yamamoto, T.; Newsome, J.R.; Ensor, D.S. Modification of surface energy, dry etching, and organic film removal using atmospheric-pressure pulsed-corona plasma. IEEE Trans. Ind. Appl. 1995, 31, 494–499. [Google Scholar] [CrossRef]
- Egitto, F.D.; Matienzo, L.J. Plasma modification of polymer surfaces for adhesion improvement. IBM J. Res. Dev. 1994, 38, 423–439. [Google Scholar] [CrossRef]
- Kusano, Y. Atmospheric pressure plasma processing for polymer adhesion: A review. J. Adhes. 2014, 90, 755–777. [Google Scholar] [CrossRef]
- Chvátalová, L.; Čermák, R.; Mráček, A.; Grulich, O.; Vesel, A.; Ponížil, P.; Minařík, A.; Cvelbar, U.; Beníček, L.; Sajdl, P. The effect of plasma treatment on structure and properties of poly (1-butene) surface. Eur. Polym. J. 2012, 48, 866–874. [Google Scholar] [CrossRef]
- Ataeefard, M.; Moradian, S.; Mirabedini, M.; Ebrahimi, M.; Asiaban, S. Investigating the effect of power/time in the wettability of Ar and O2 gas plasma-treated low-density polyethylene. Prog. Org. Coat. 2009, 64, 482–488. [Google Scholar] [CrossRef]
- López-Santos, C.; Yubero, F.; Cotrino, J.; González-Elipe, A.R. Nitrogen plasma functionalization of low density polyethylene. Surf. Coat. Technol. 2011, 205, 3356–3364. [Google Scholar] [CrossRef]
- Chaivan, P.; Pasaja, N.; Boonyawan, D.; Suanpoot, P.; Vilaithong, T. Low-temperature plasma treatment for hydrophobicity improvement of silk. Surf. Coat. Technol. 2005, 193, 356–360. [Google Scholar] [CrossRef]
- Liston, E.; Martinu, L.; Wertheimer, M. Plasma surface modification of polymers for improved adhesion: A critical review. J. Adhes. Sci. Technol. 1993, 7, 1091–1127. [Google Scholar] [CrossRef]
- Tajima, S.; Komvopoulos, K. Surface modification of low-density polyethylene by inductively coupled argon plasma. J. Phys. Chem. B 2005, 109, 17623–17629. [Google Scholar] [CrossRef]
- Abusrafa, A.E.; Habib, S.; Krupa, I.; Ouederni, M.; Popelka, A. Modification of polyethylene by RF plasma in different/mixture gases. Coatings 2019, 9, 145. [Google Scholar] [CrossRef] [Green Version]
- Jordá-Vilaplana, A.; Fombuena, V.; García-García, D.; Samper, M.; Sánchez-Nácher, L. Surface modification of polylactic acid (PLA) by air atmospheric plasma treatment. Eur. Polym. J. 2014, 58, 23–33. [Google Scholar] [CrossRef]
- Bhat, N.; Upadhyay, D. Plasma-induced surface modification and adhesion enhancement of polypropylene surface. J. Appl. Polym. Sci. 2002, 86, 925–936. [Google Scholar] [CrossRef]
- Øiseth, S.K.; Krozer, A.; Kasemo, B.; Lausmaa, J. Surface modification of spin-coated high-density polyethylene films by argon and oxygen glow discharge plasma treatments. Appl. Surf. Sci. 2002, 202, 92–103. [Google Scholar] [CrossRef]
- Fozza, A.; Klemberg-Sapieha, J.; Wertheimer, M.R. Vacuum ultraviolet irradiation of polymers. Plasmas Polym. 1999, 4, 183–206. [Google Scholar] [CrossRef]
- Nakaoka, R.; Yamakoshi, Y.; Isama, K.; Tsuchiya, T. Effects of surface chemistry prepared by self-assembled monolayers on osteoblast behavior. J. Biomed. Mater. Res. Part A 2010, 94, 524–532. [Google Scholar] [CrossRef]
Figure 1.
(a) Contact angle and (b) surface free energy as a function of nominal power for polyurethane (PU) treated using air plasma (60 s).
Figure 1.
(a) Contact angle and (b) surface free energy as a function of nominal power for polyurethane (PU) treated using air plasma (60 s).
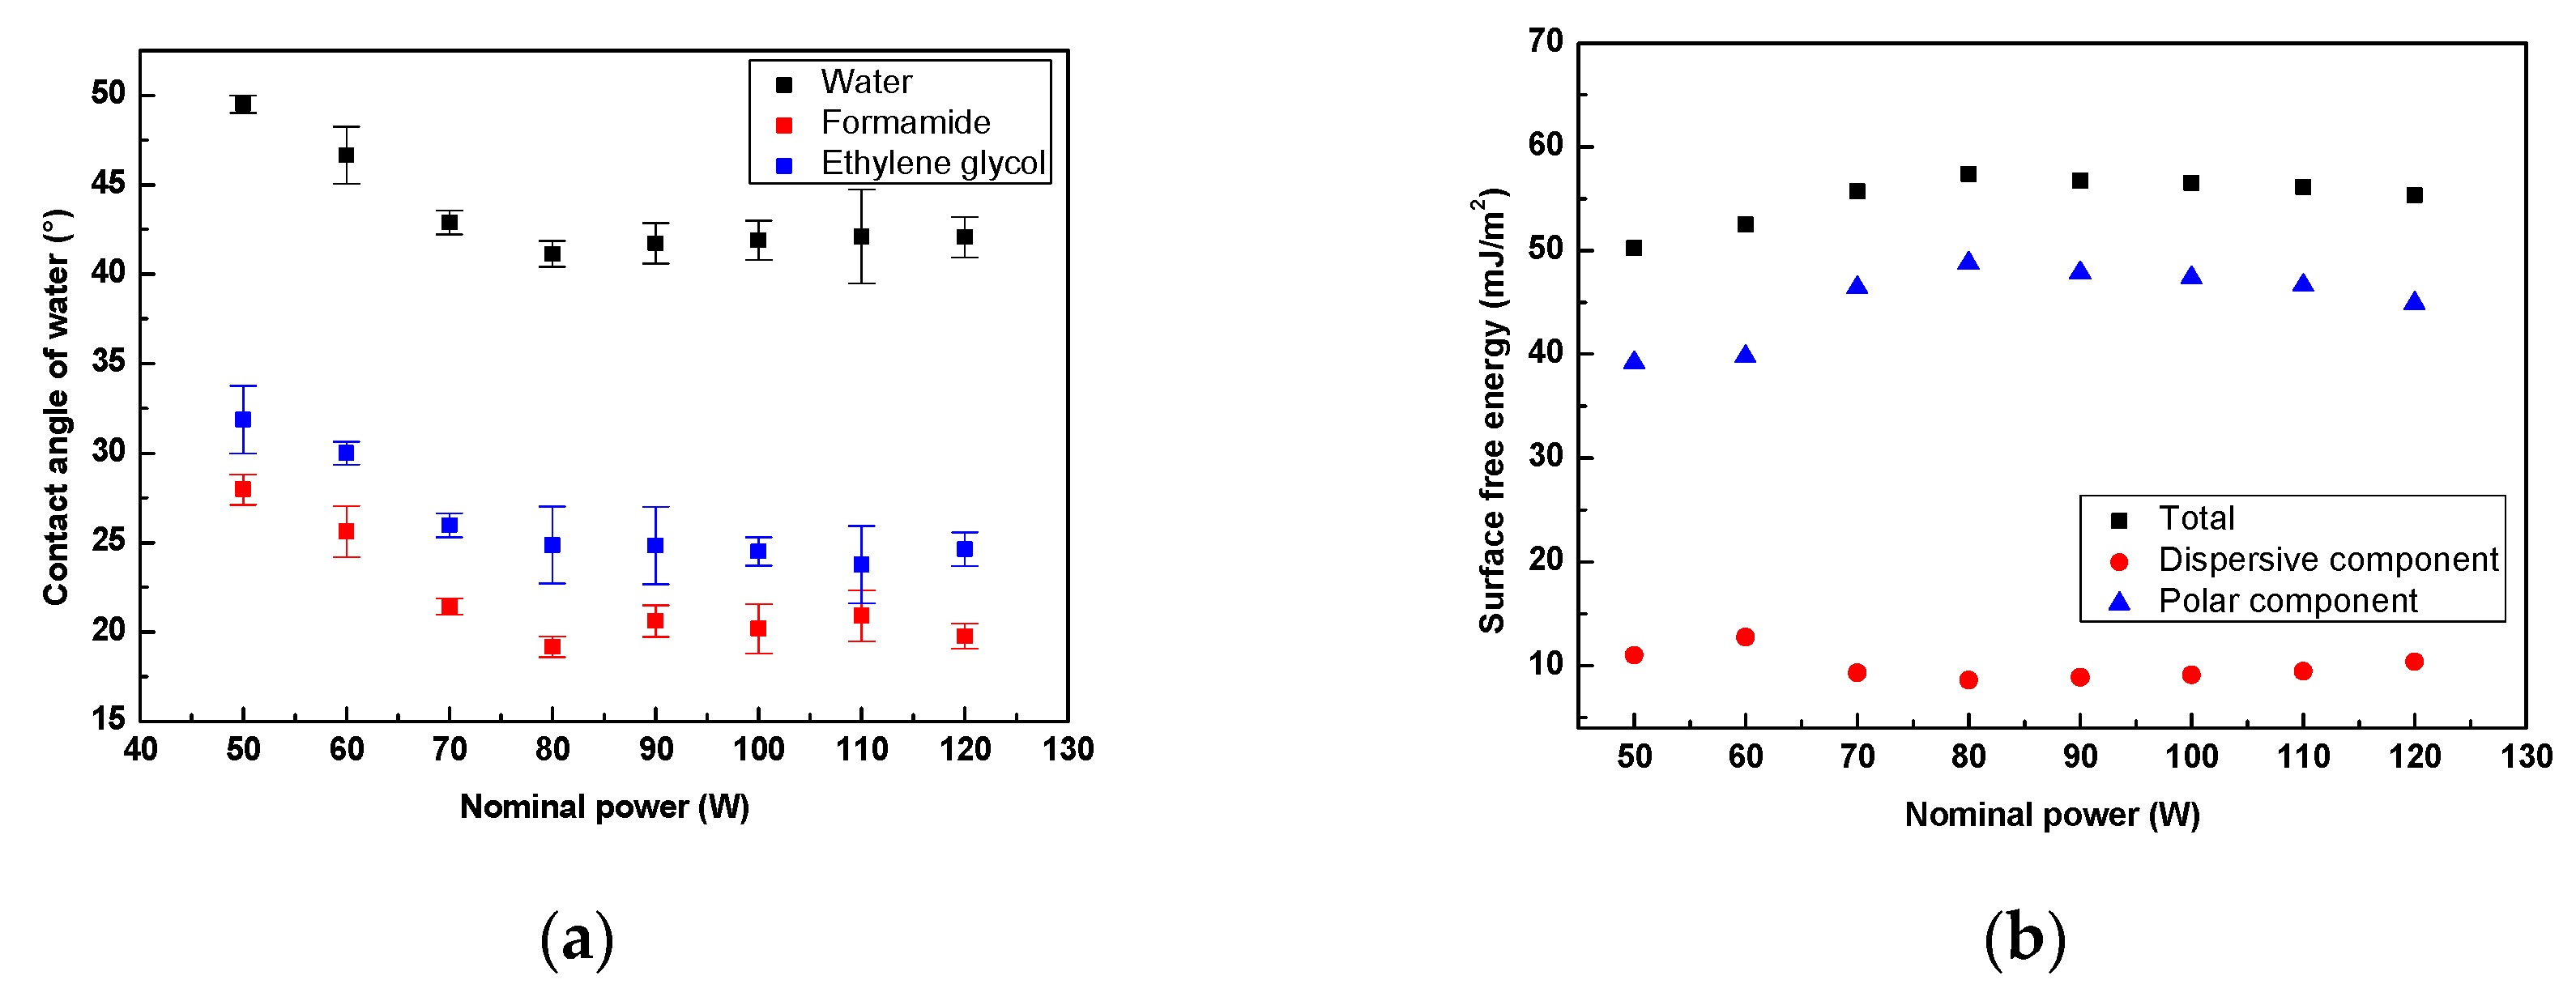
Figure 2.
(a) Contact angle of water and (b) the total surface free energy as a function of treatment time for PU treated using air, O2, N2, and Ar plasma.
Figure 2.
(a) Contact angle of water and (b) the total surface free energy as a function of treatment time for PU treated using air, O2, N2, and Ar plasma.
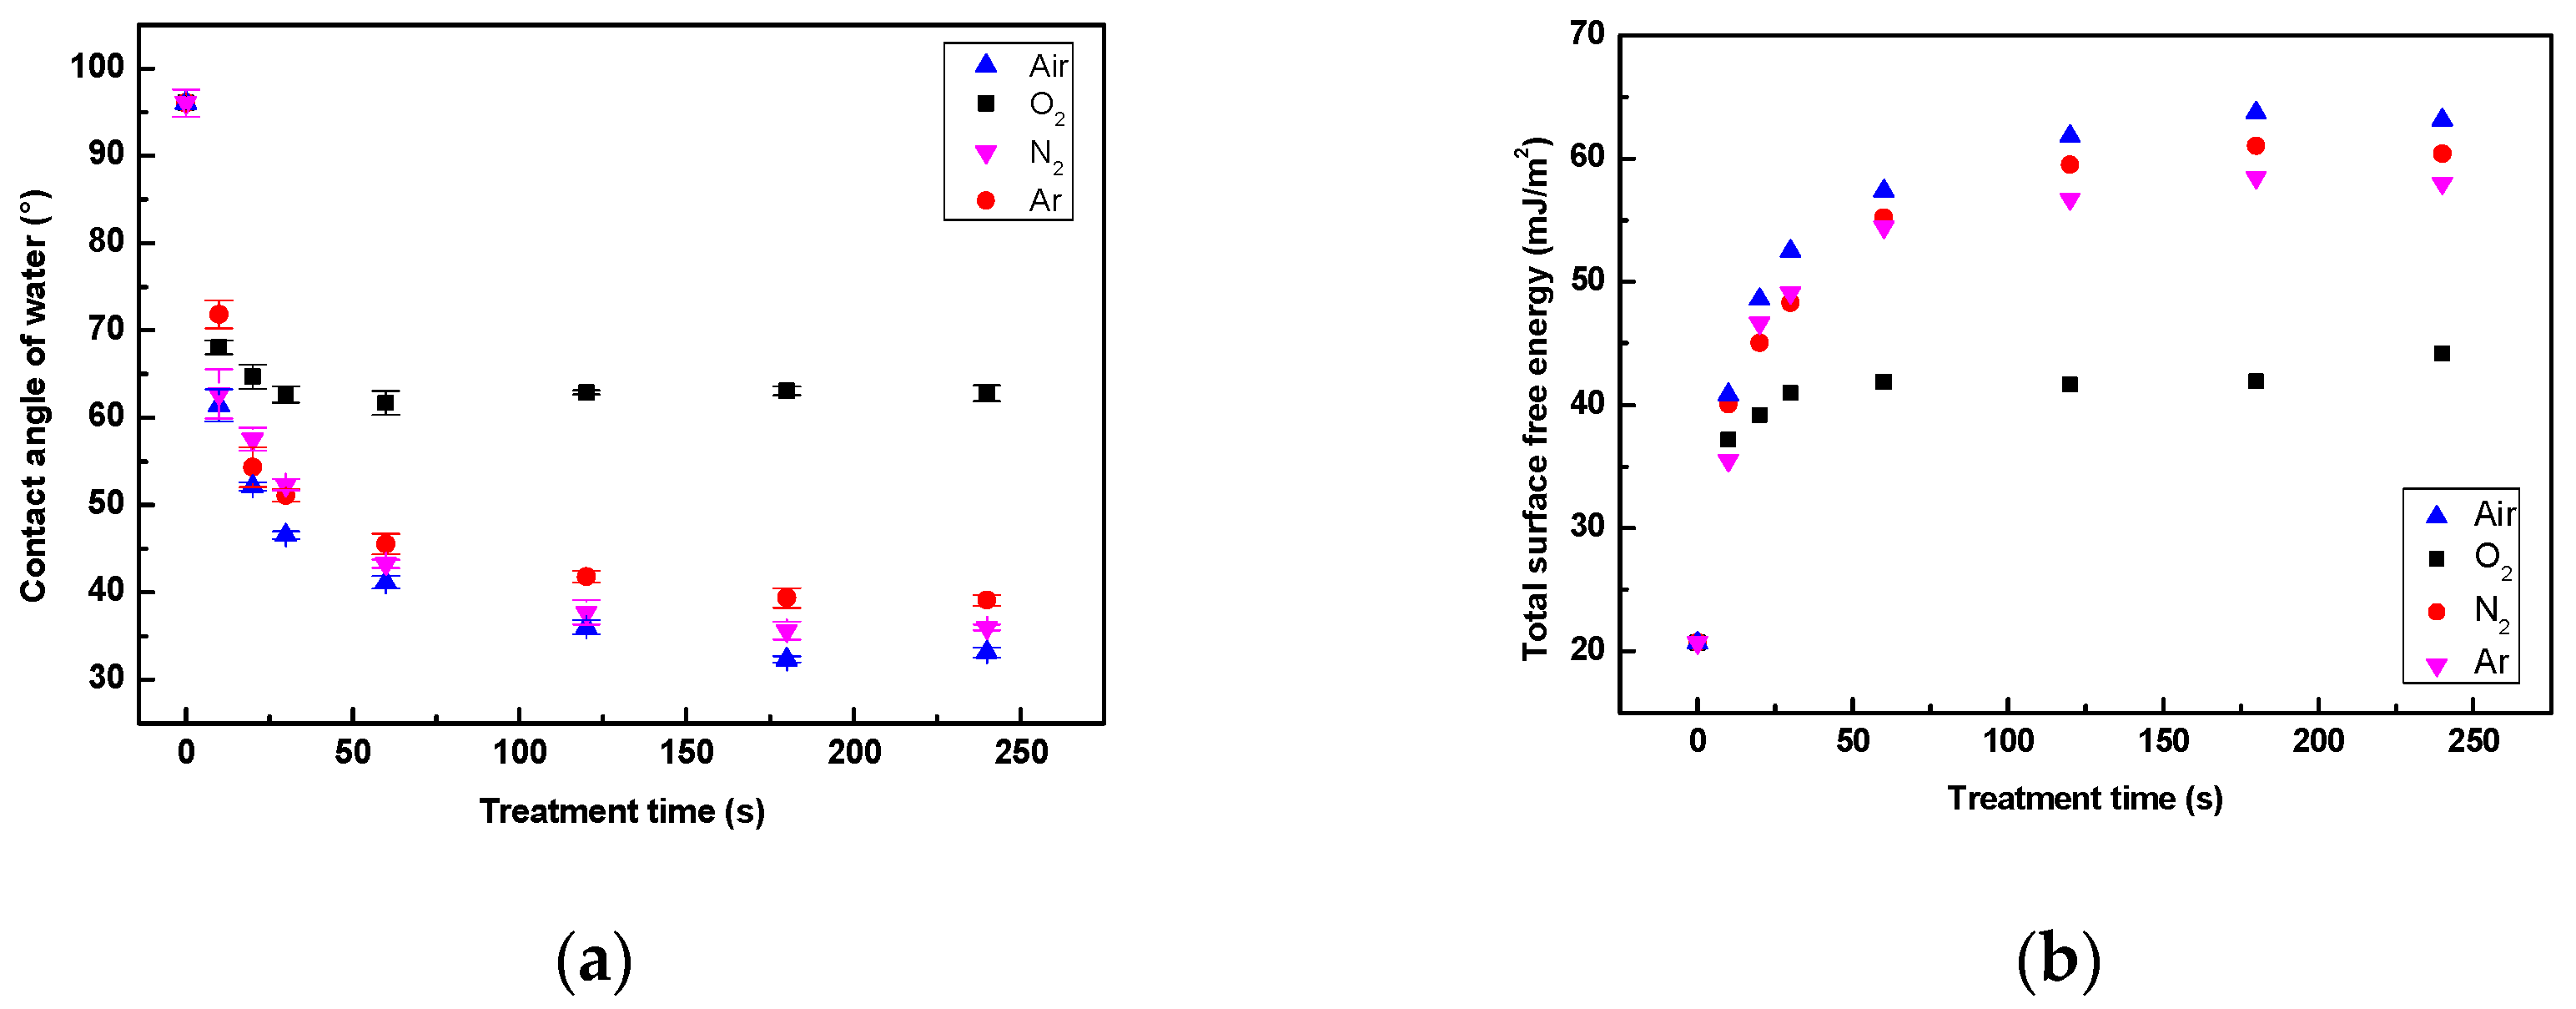
Figure 3.
(a) Contact angle of water and (b) the surface free energy as a function of gas concentration for PU treated using N2/O2 plasma for 180 s.
Figure 3.
(a) Contact angle of water and (b) the surface free energy as a function of gas concentration for PU treated using N2/O2 plasma for 180 s.
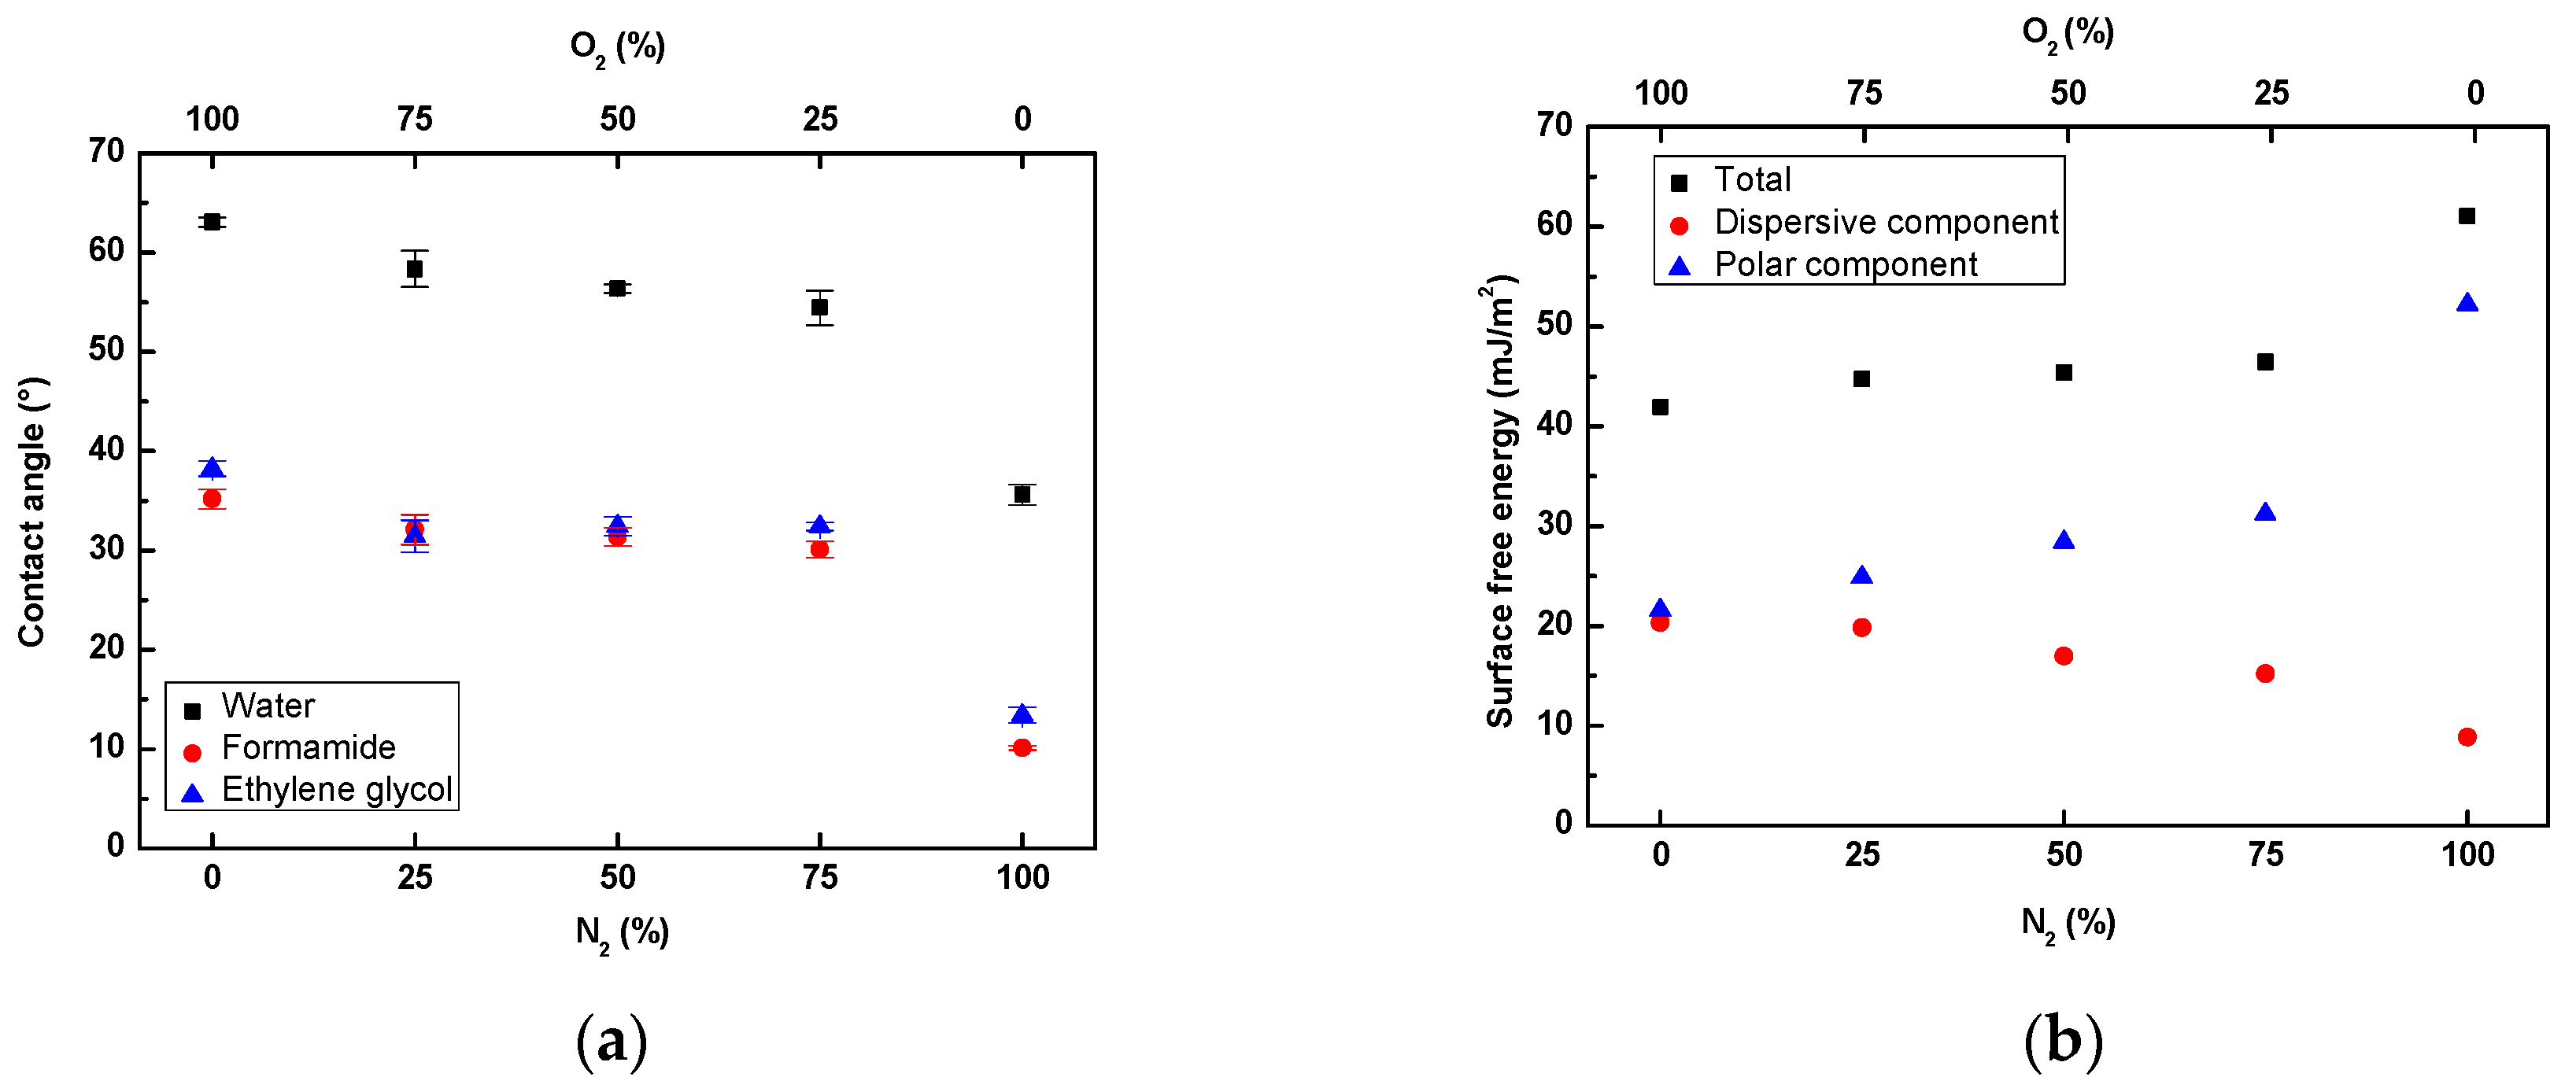
Figure 4.
(a) Contact angle and (b) the surface free energy as a function of gas concentration for PU treated using Ar/O2 plasma for 180 s.
Figure 4.
(a) Contact angle and (b) the surface free energy as a function of gas concentration for PU treated using Ar/O2 plasma for 180 s.
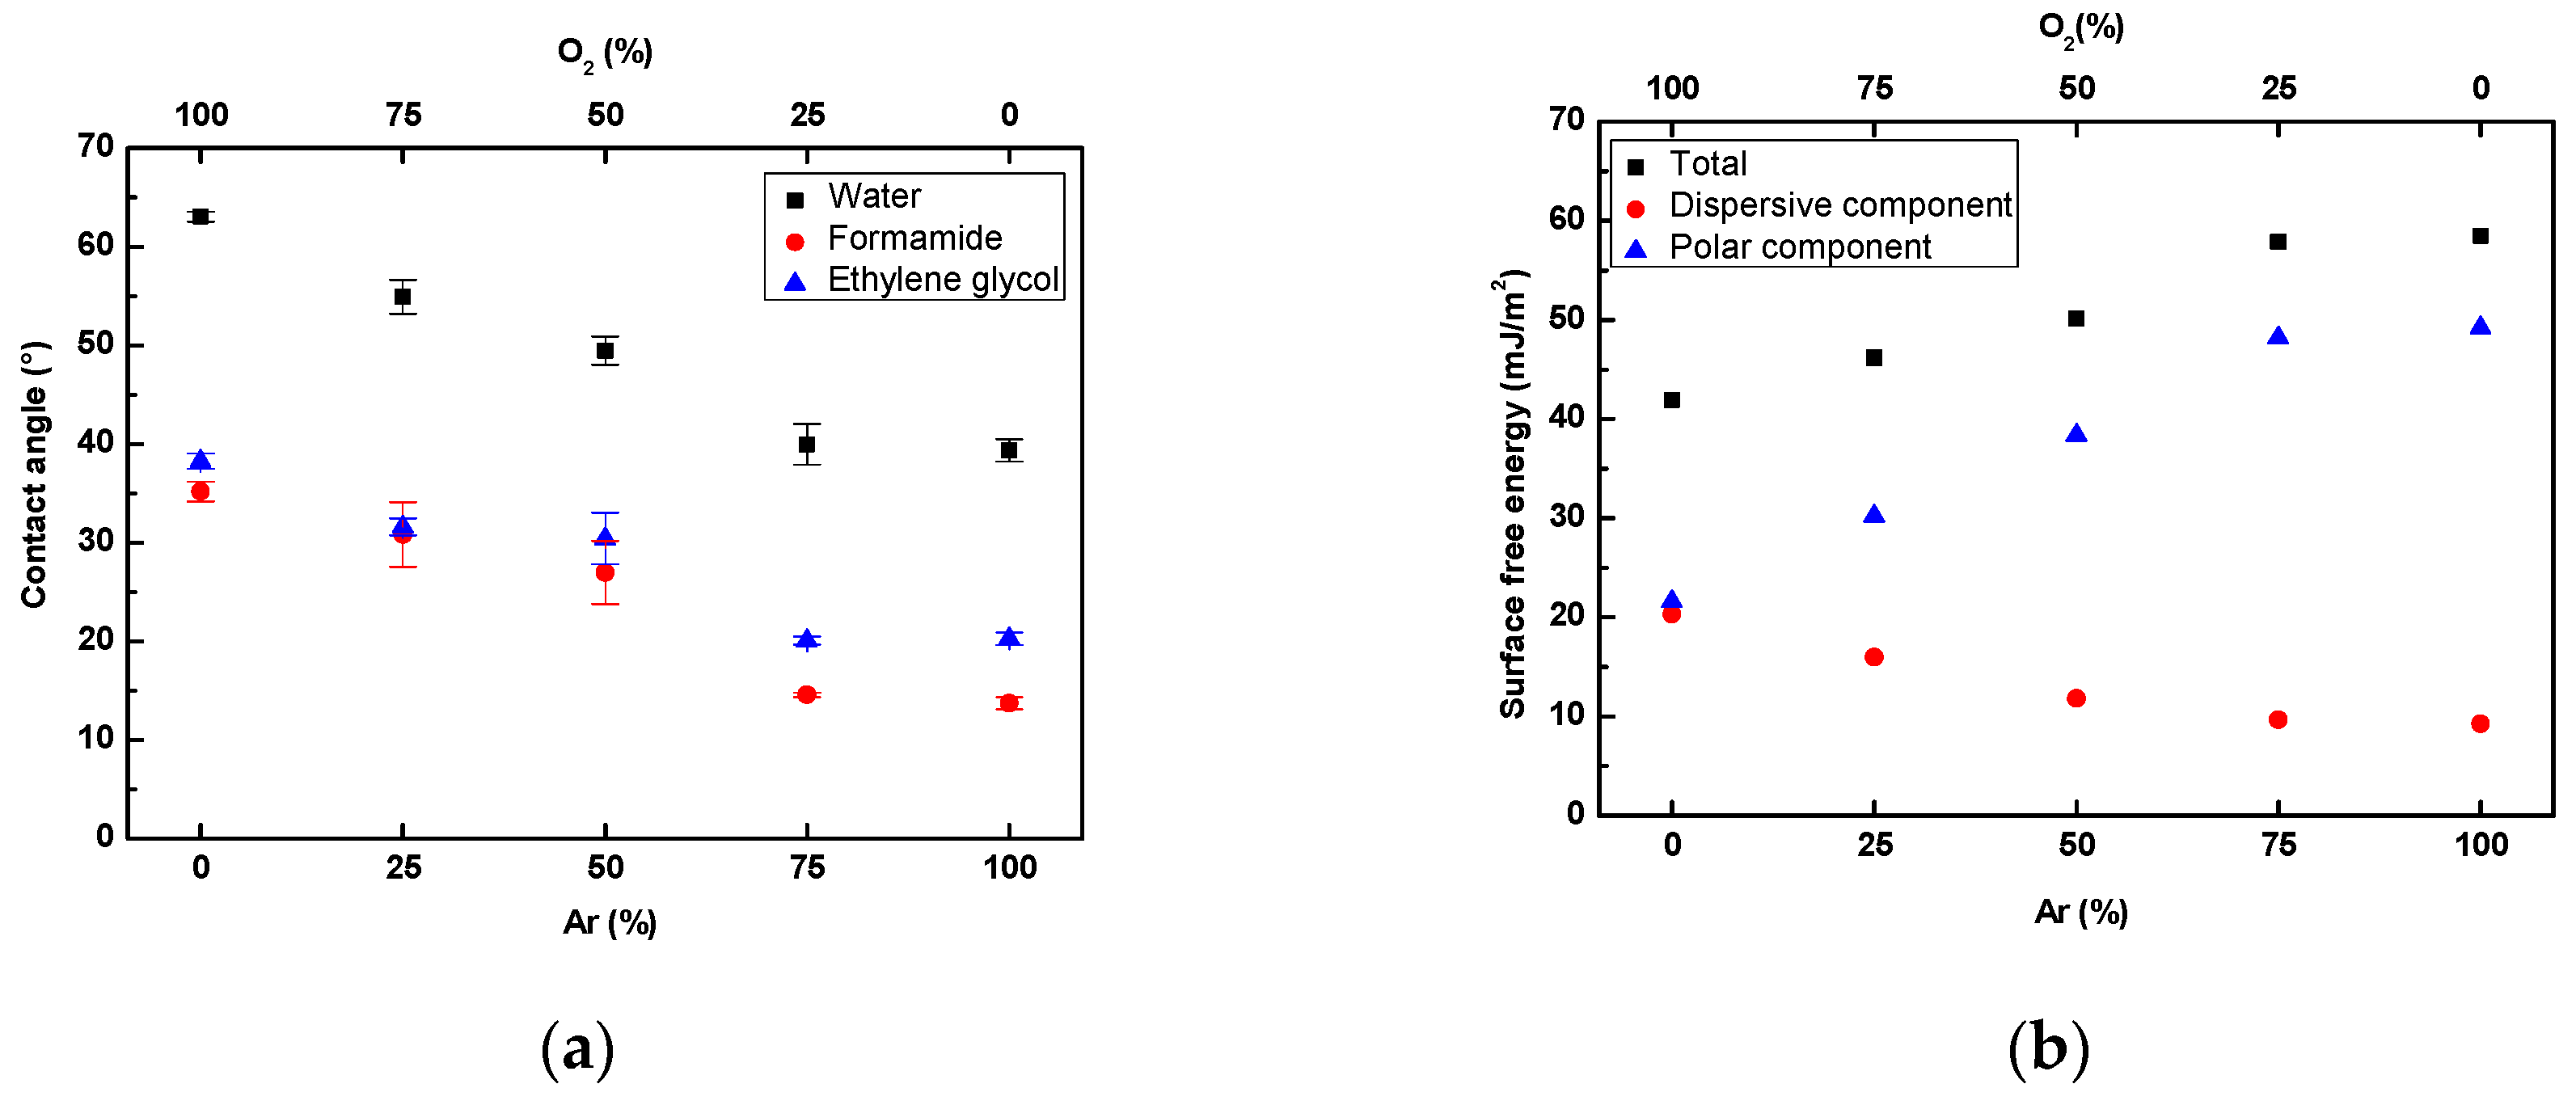
Figure 5.
(a) Contact angle of water and (b) the surface free energy as a function of gas concentration for PU treated using N2/Ar plasma for 180 s.
Figure 5.
(a) Contact angle of water and (b) the surface free energy as a function of gas concentration for PU treated using N2/Ar plasma for 180 s.
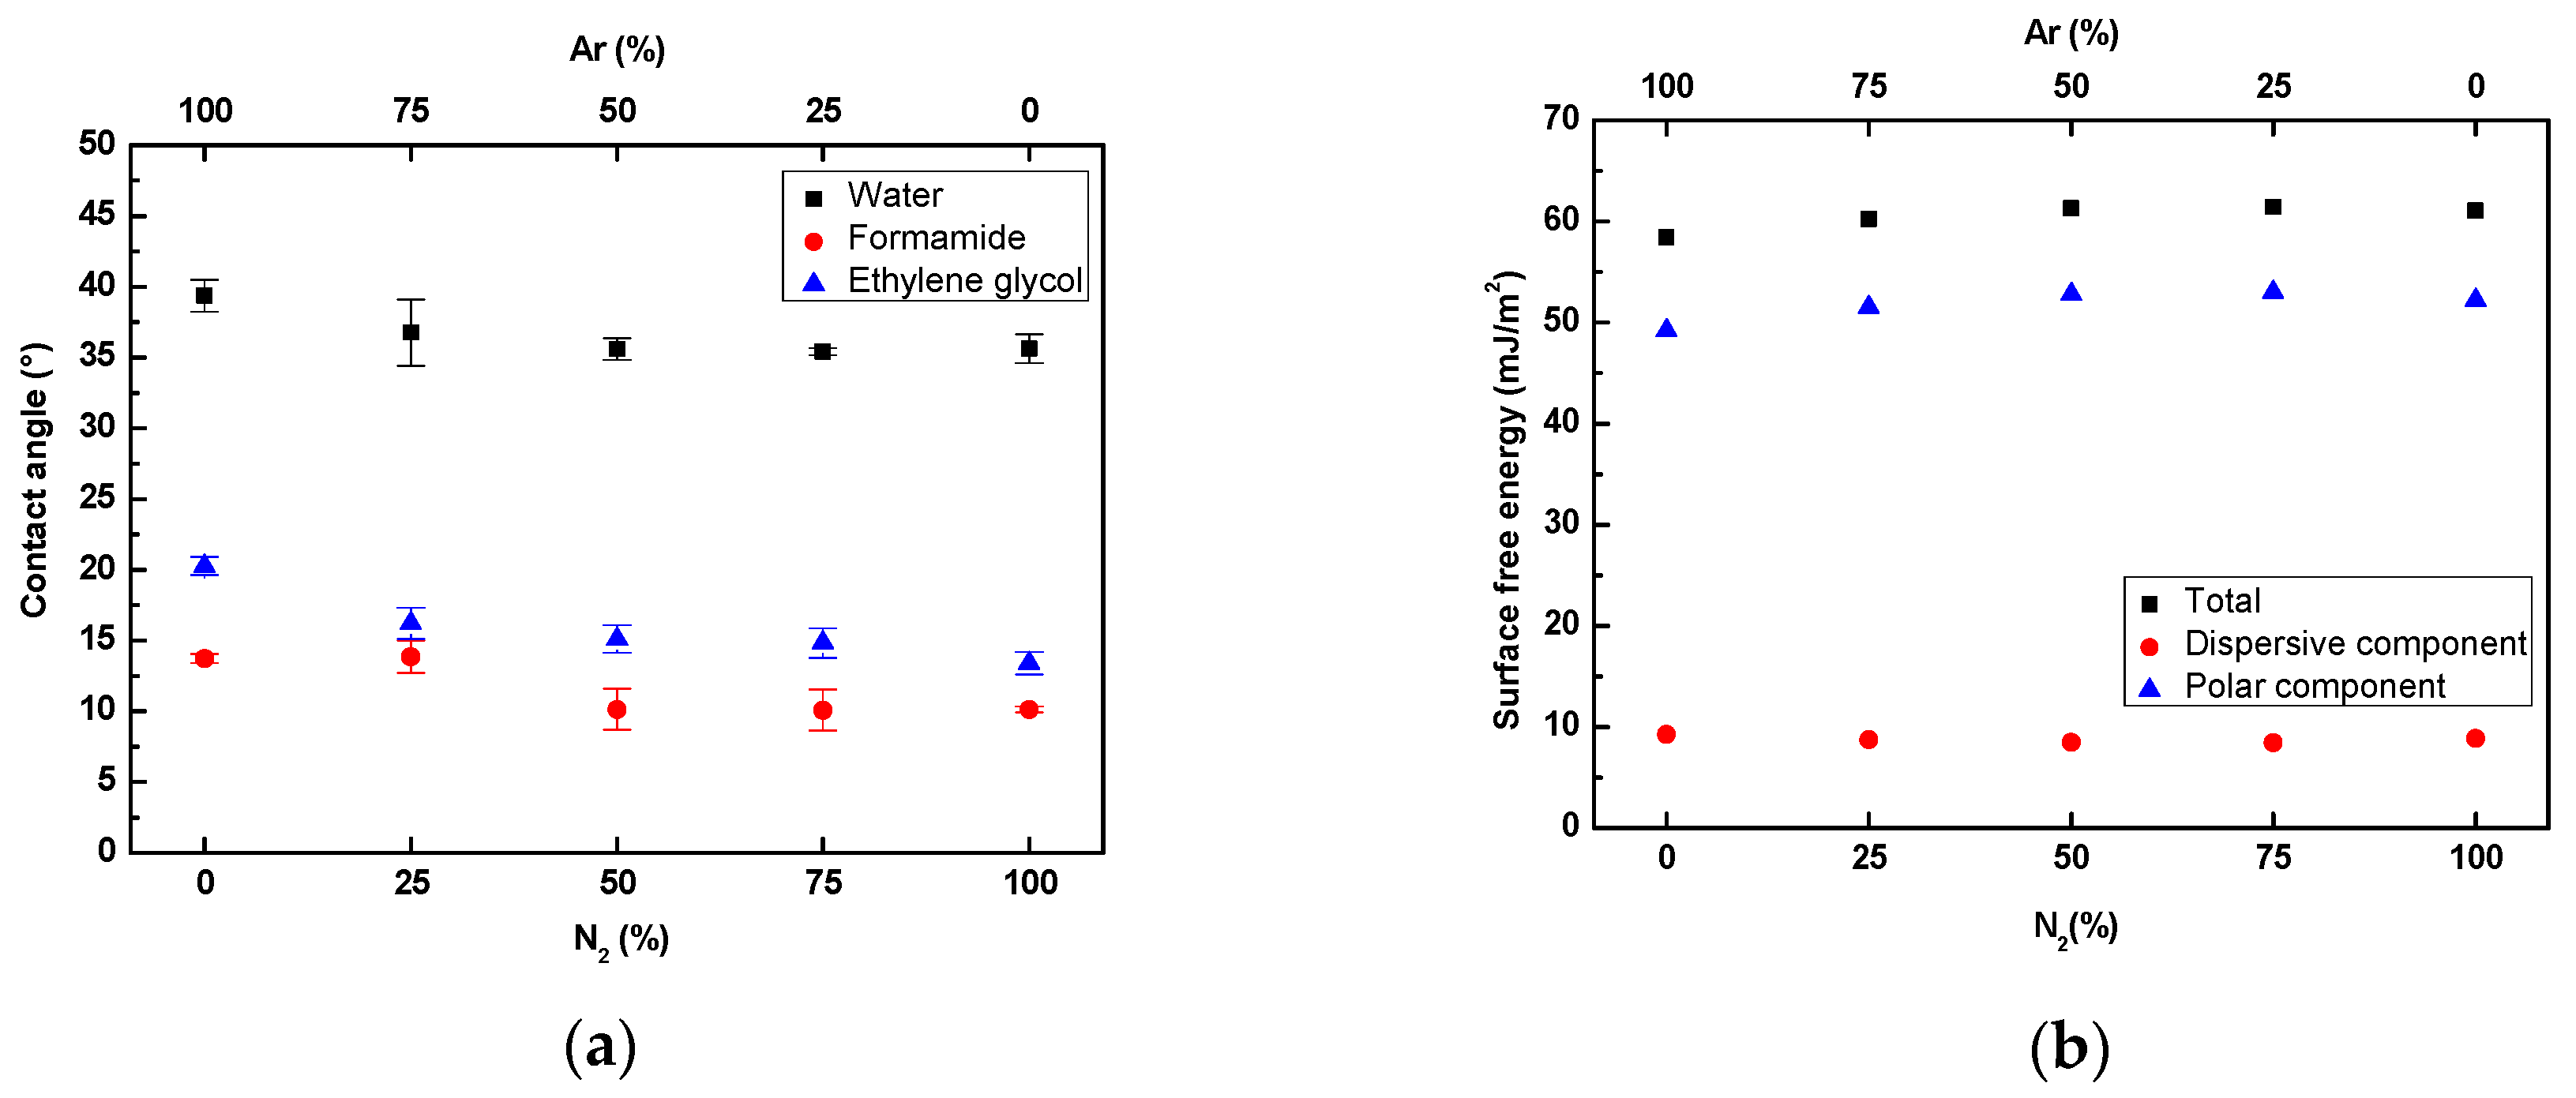
Figure 6.
Peel resistance values of treated PU samples with different gases.

Figure 7.
Evolution of the contact angle of (a) water and (b) surface free energy versus aging time for plasma treated PU using air, O2, N2, and Ar at 120 s.
Figure 7.
Evolution of the contact angle of (a) water and (b) surface free energy versus aging time for plasma treated PU using air, O2, N2, and Ar at 120 s.
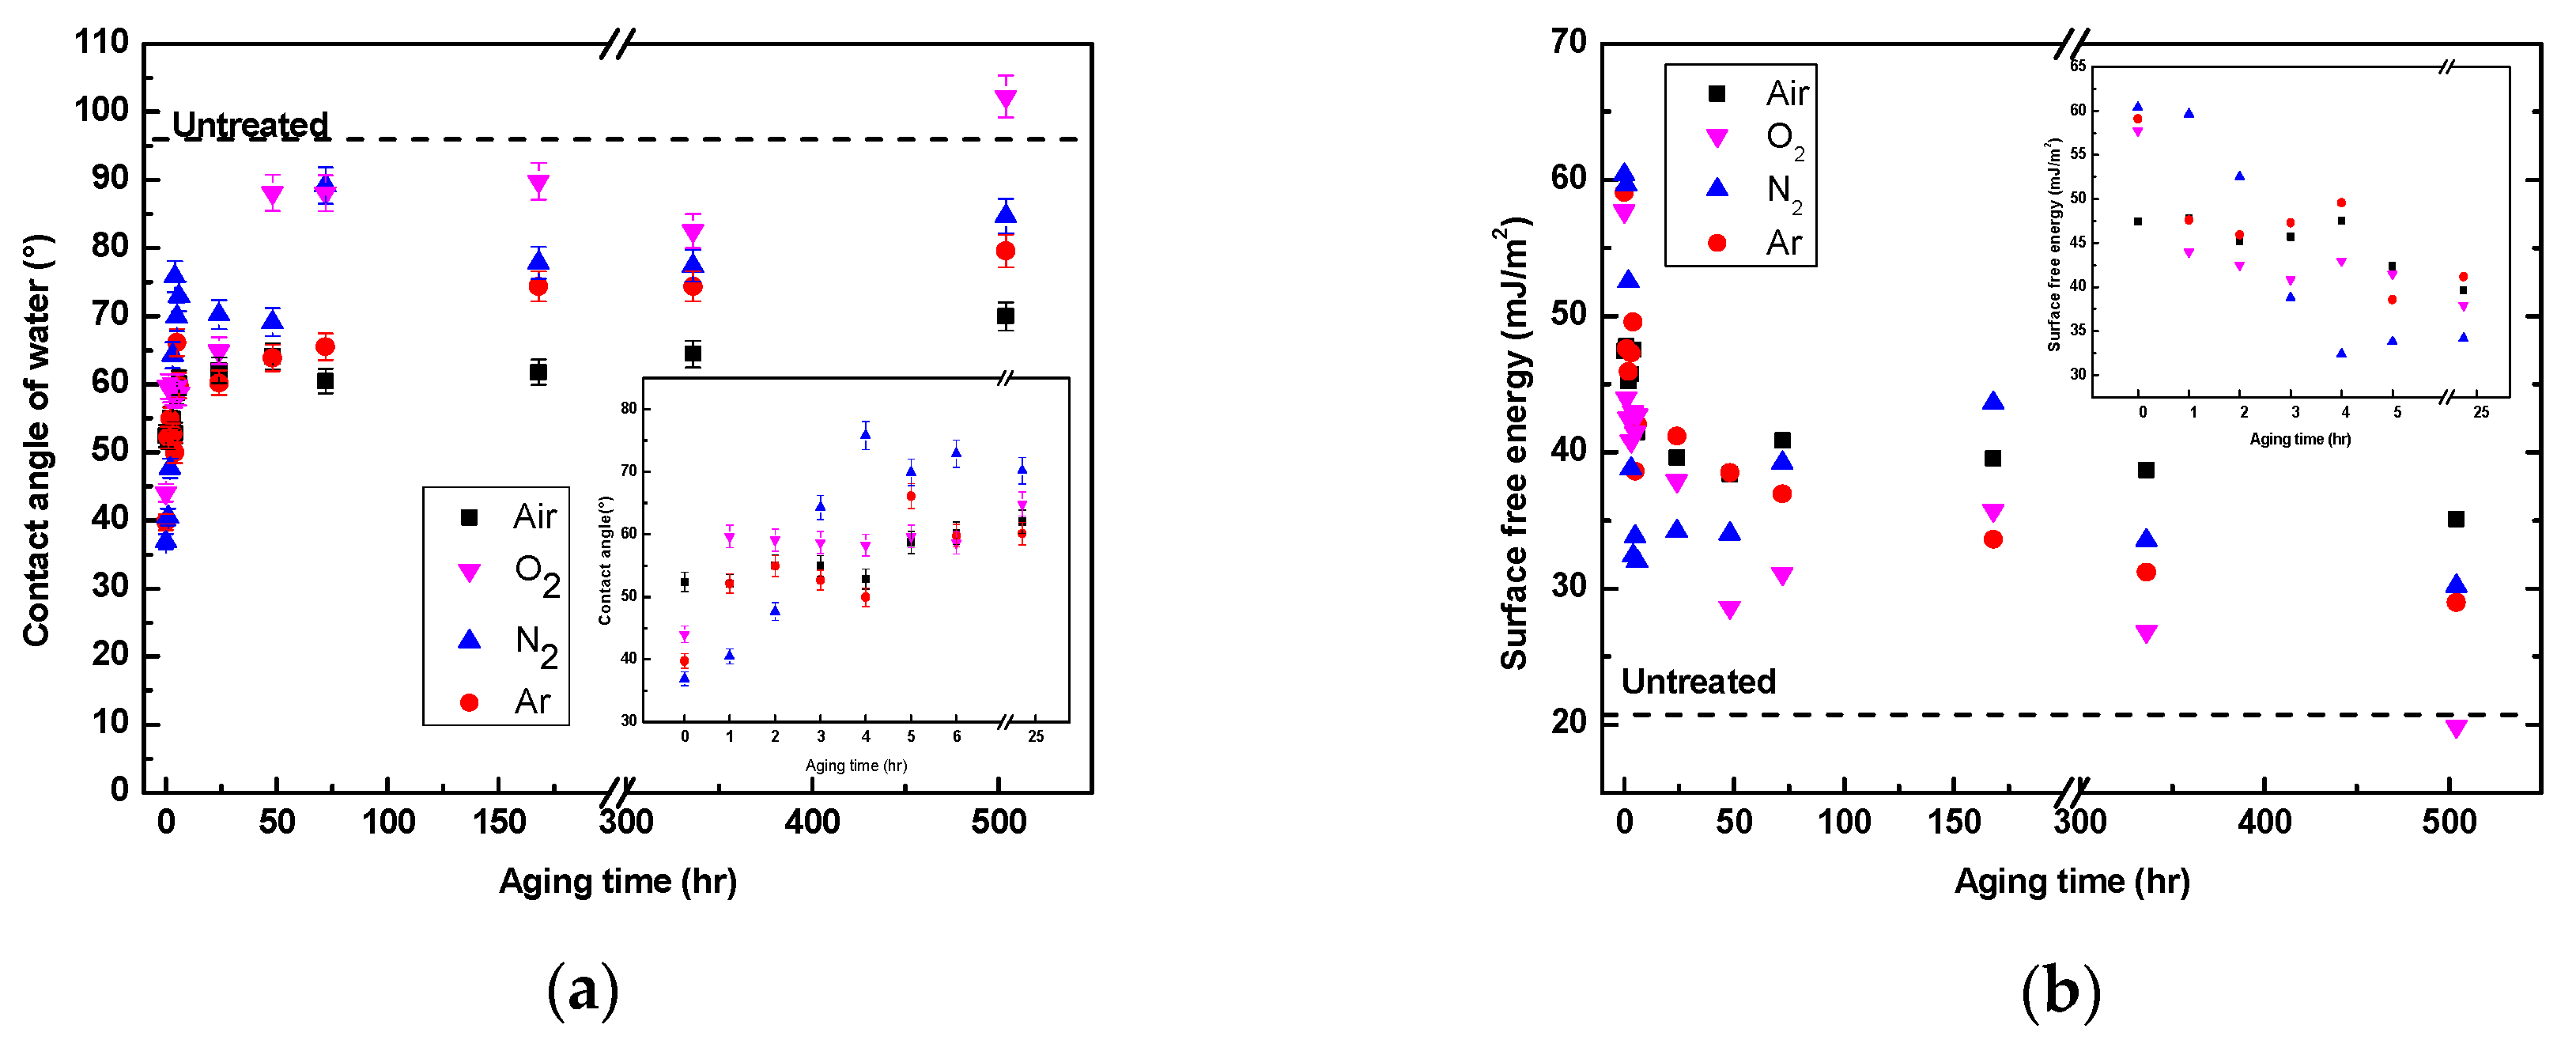
Figure 8.
Peel resistance values of treated PU samples with air, O2, N2, and Ar vs. aging time.
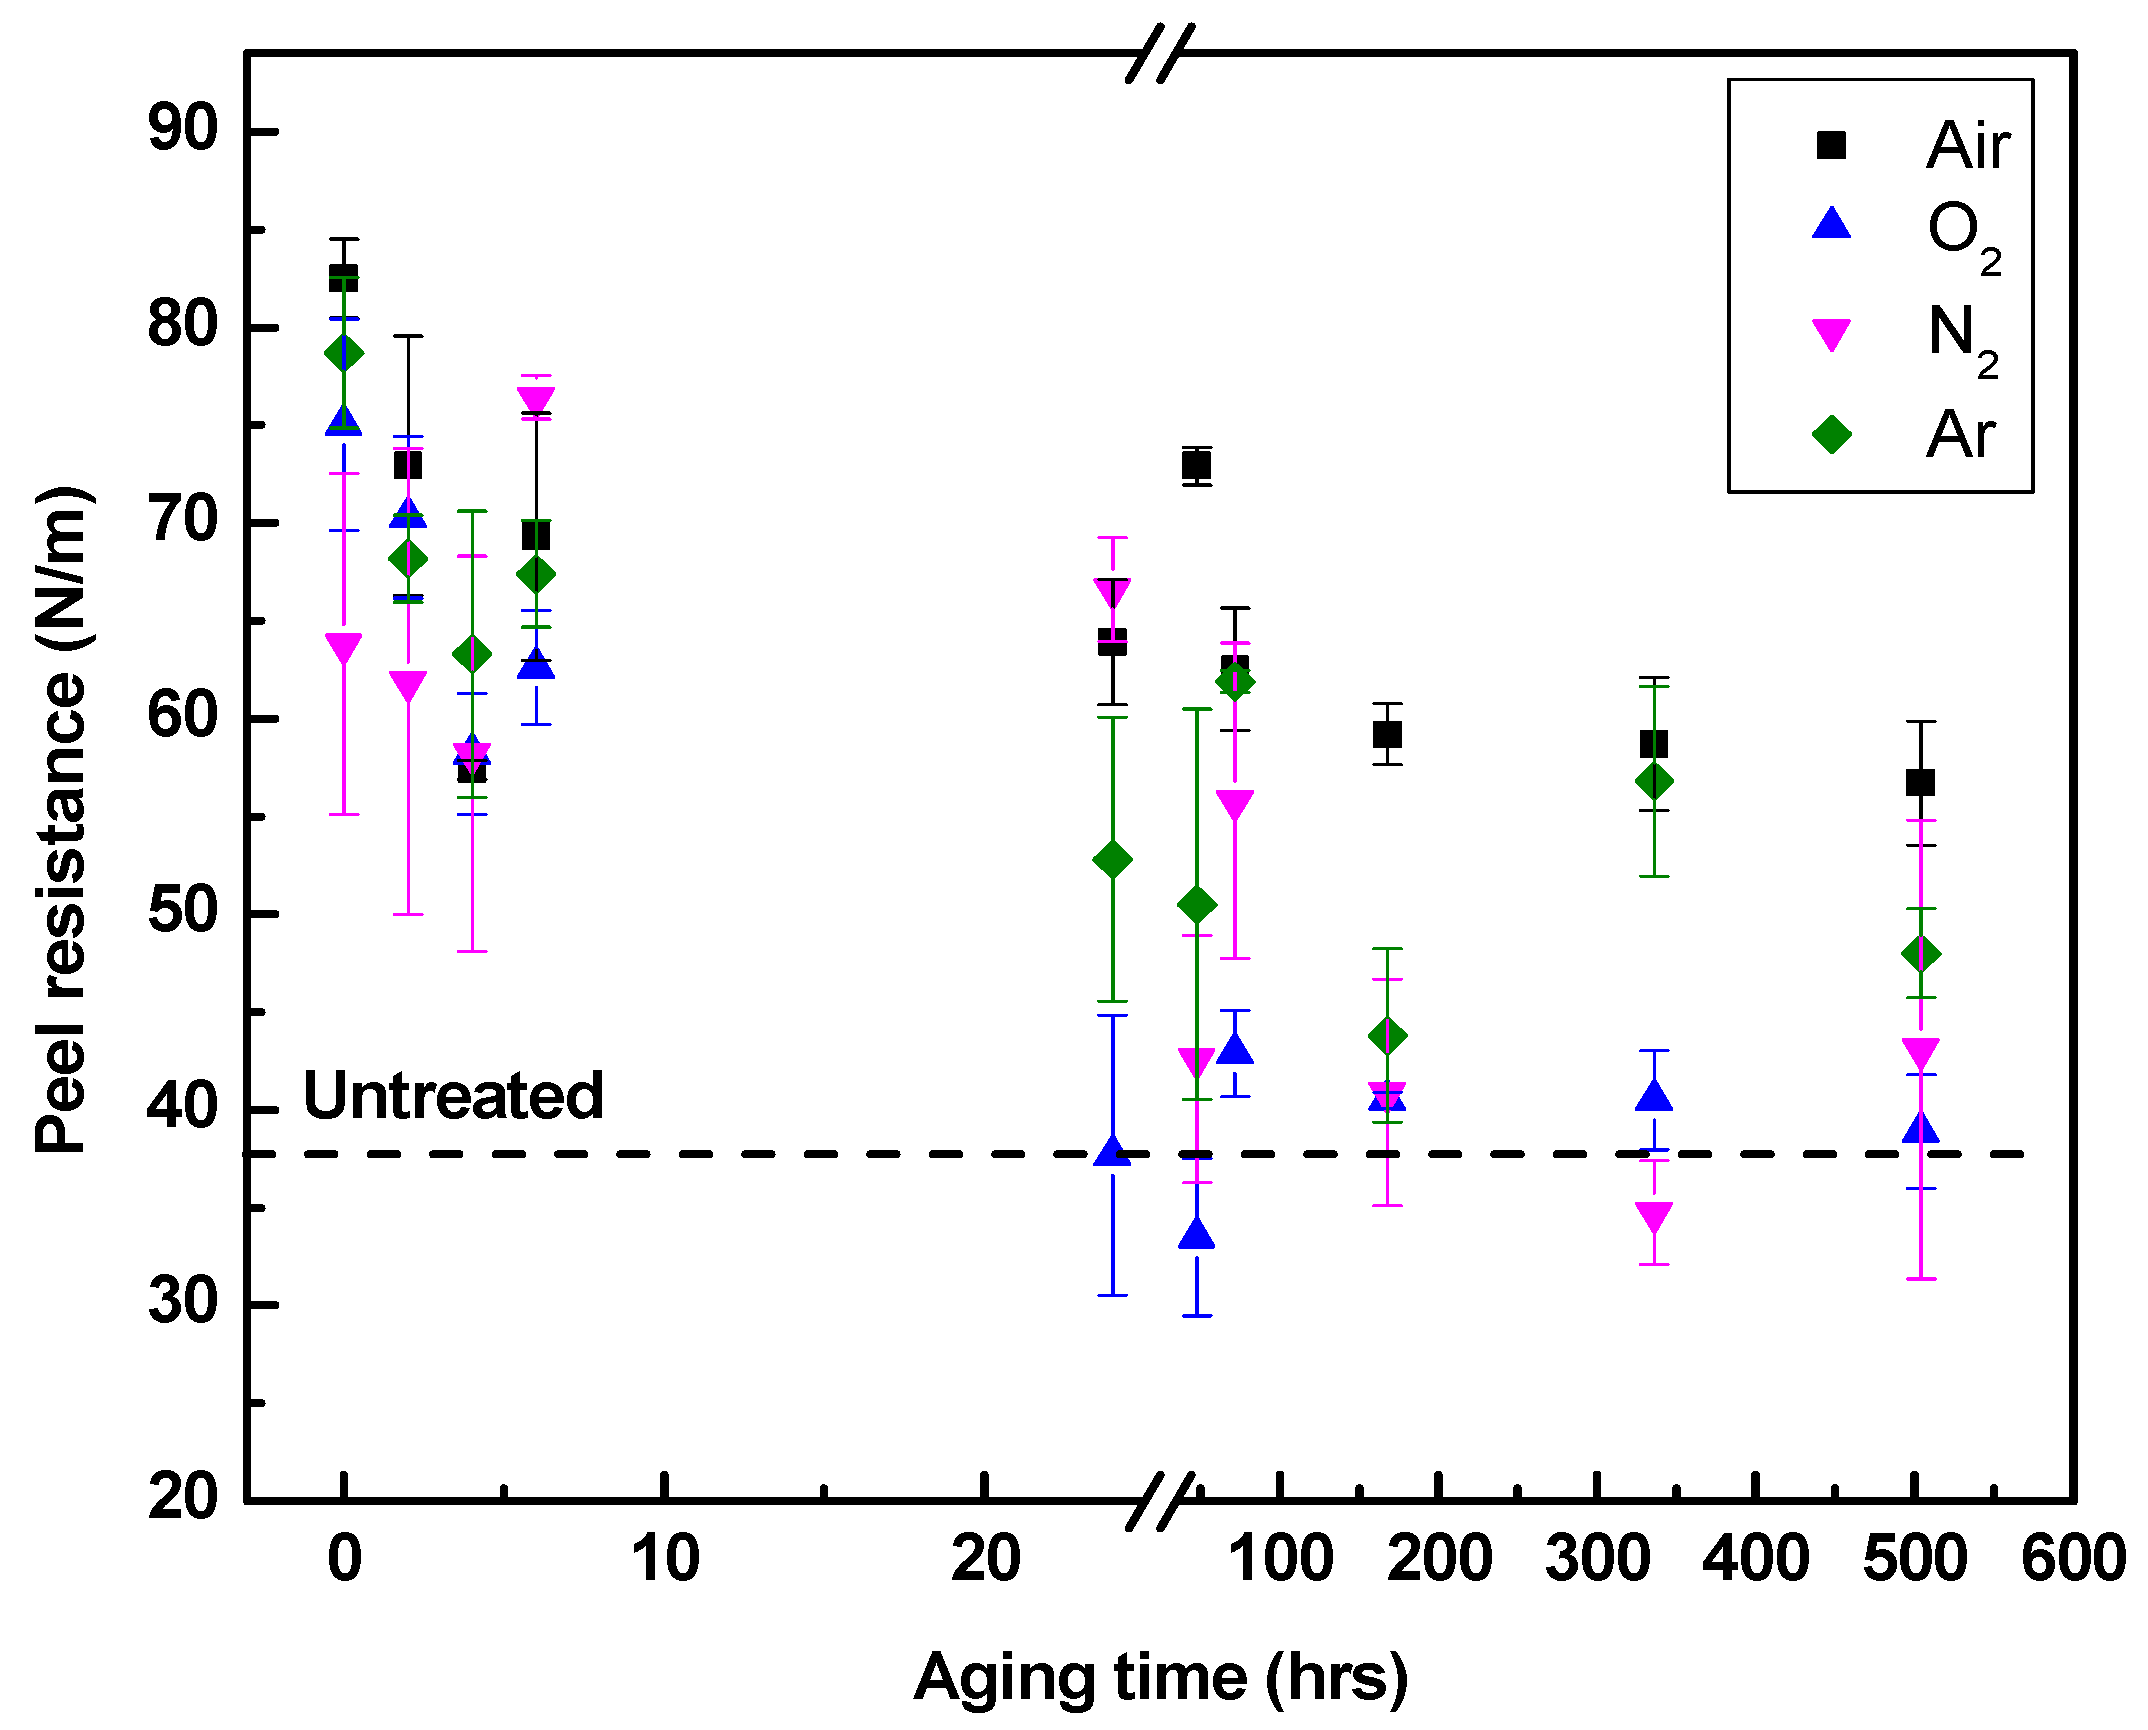
Figure 9.
FTIR spectra of plasma-treated PU using different gases.

Figure 10.
XPS survey spectra of plasma-treated PU using different gases.
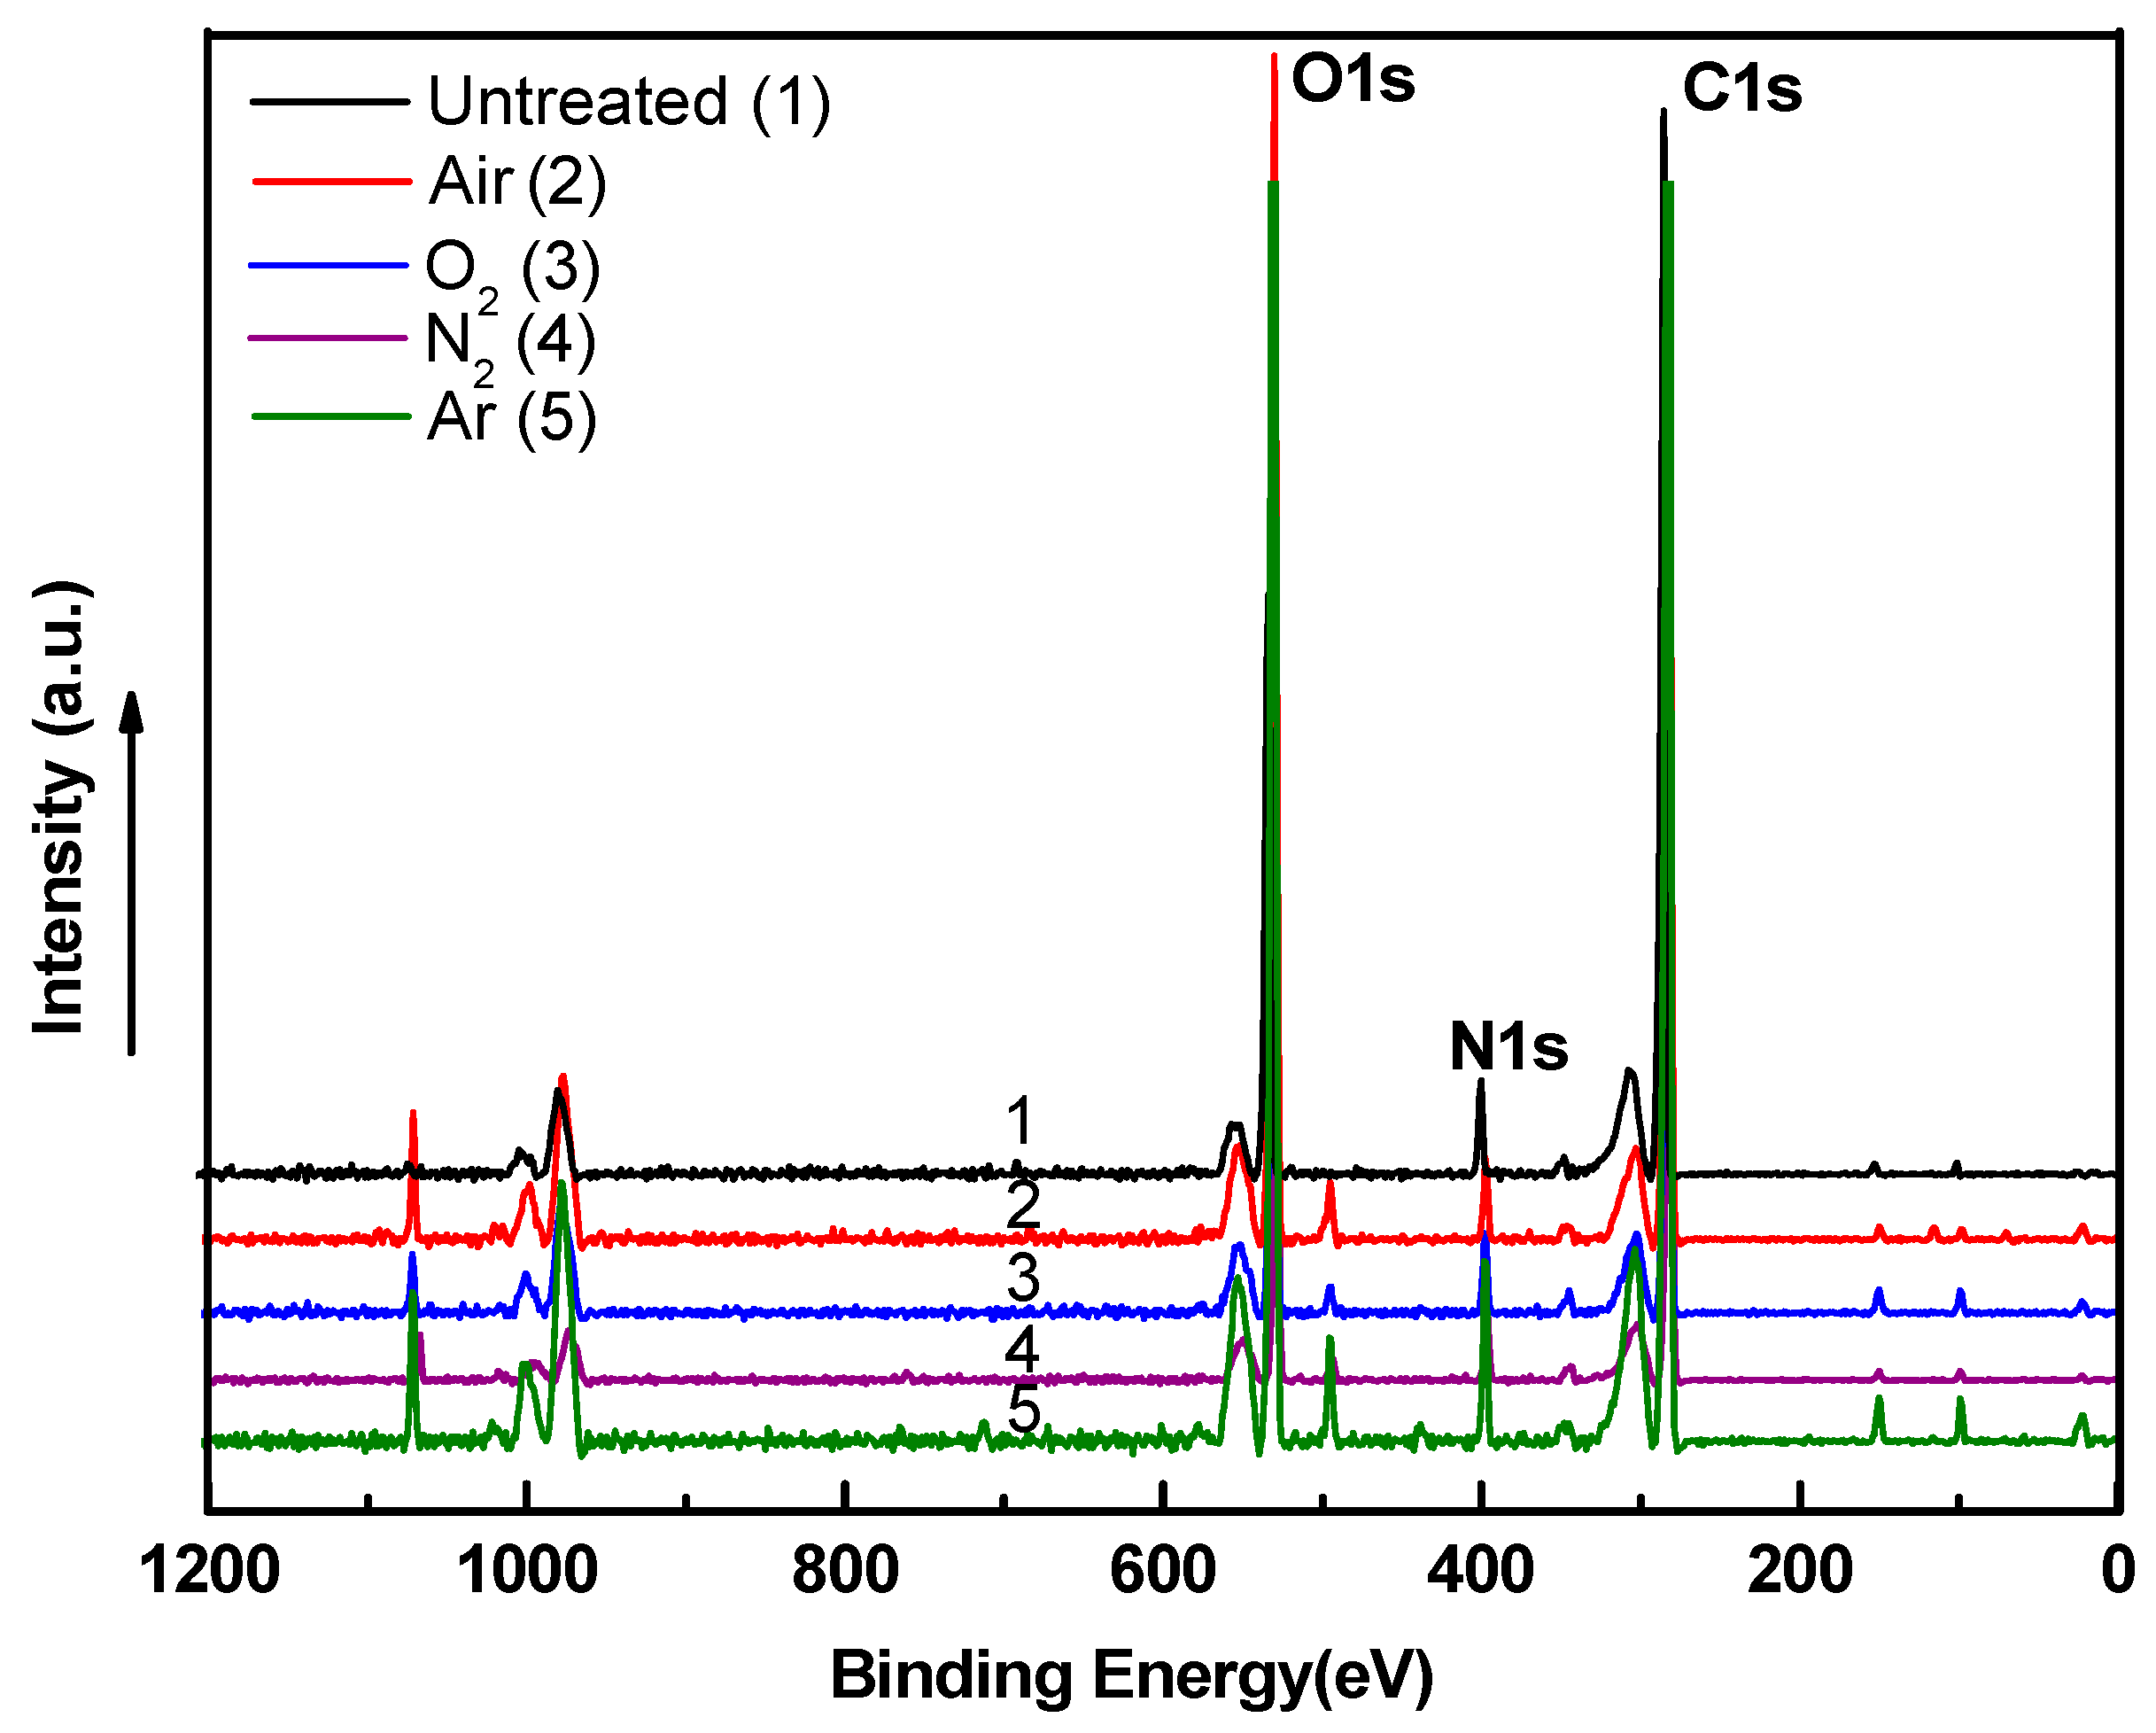
Figure 11.
Surface topographies of the PU films: (a) untreated; and plasma treated (180 s) in: (b) air, (c) O2, (d) N2, (e) Ar.
Figure 11.
Surface topographies of the PU films: (a) untreated; and plasma treated (180 s) in: (b) air, (c) O2, (d) N2, (e) Ar.

Figure 12.
Surface topographies of the PU films treated by plasma (180 s) in gas mixtures with a concentration of 50% of each gas: (a) N2/O2, (b) Ar/O2, and (c) N2/Ar.
Figure 12.
Surface topographies of the PU films treated by plasma (180 s) in gas mixtures with a concentration of 50% of each gas: (a) N2/O2, (b) Ar/O2, and (c) N2/Ar.

Figure 13.
Surface roughness as a function of plasma treatment time for PU treated using air, O2, N2, and Ar.
Figure 13.
Surface roughness as a function of plasma treatment time for PU treated using air, O2, N2, and Ar.
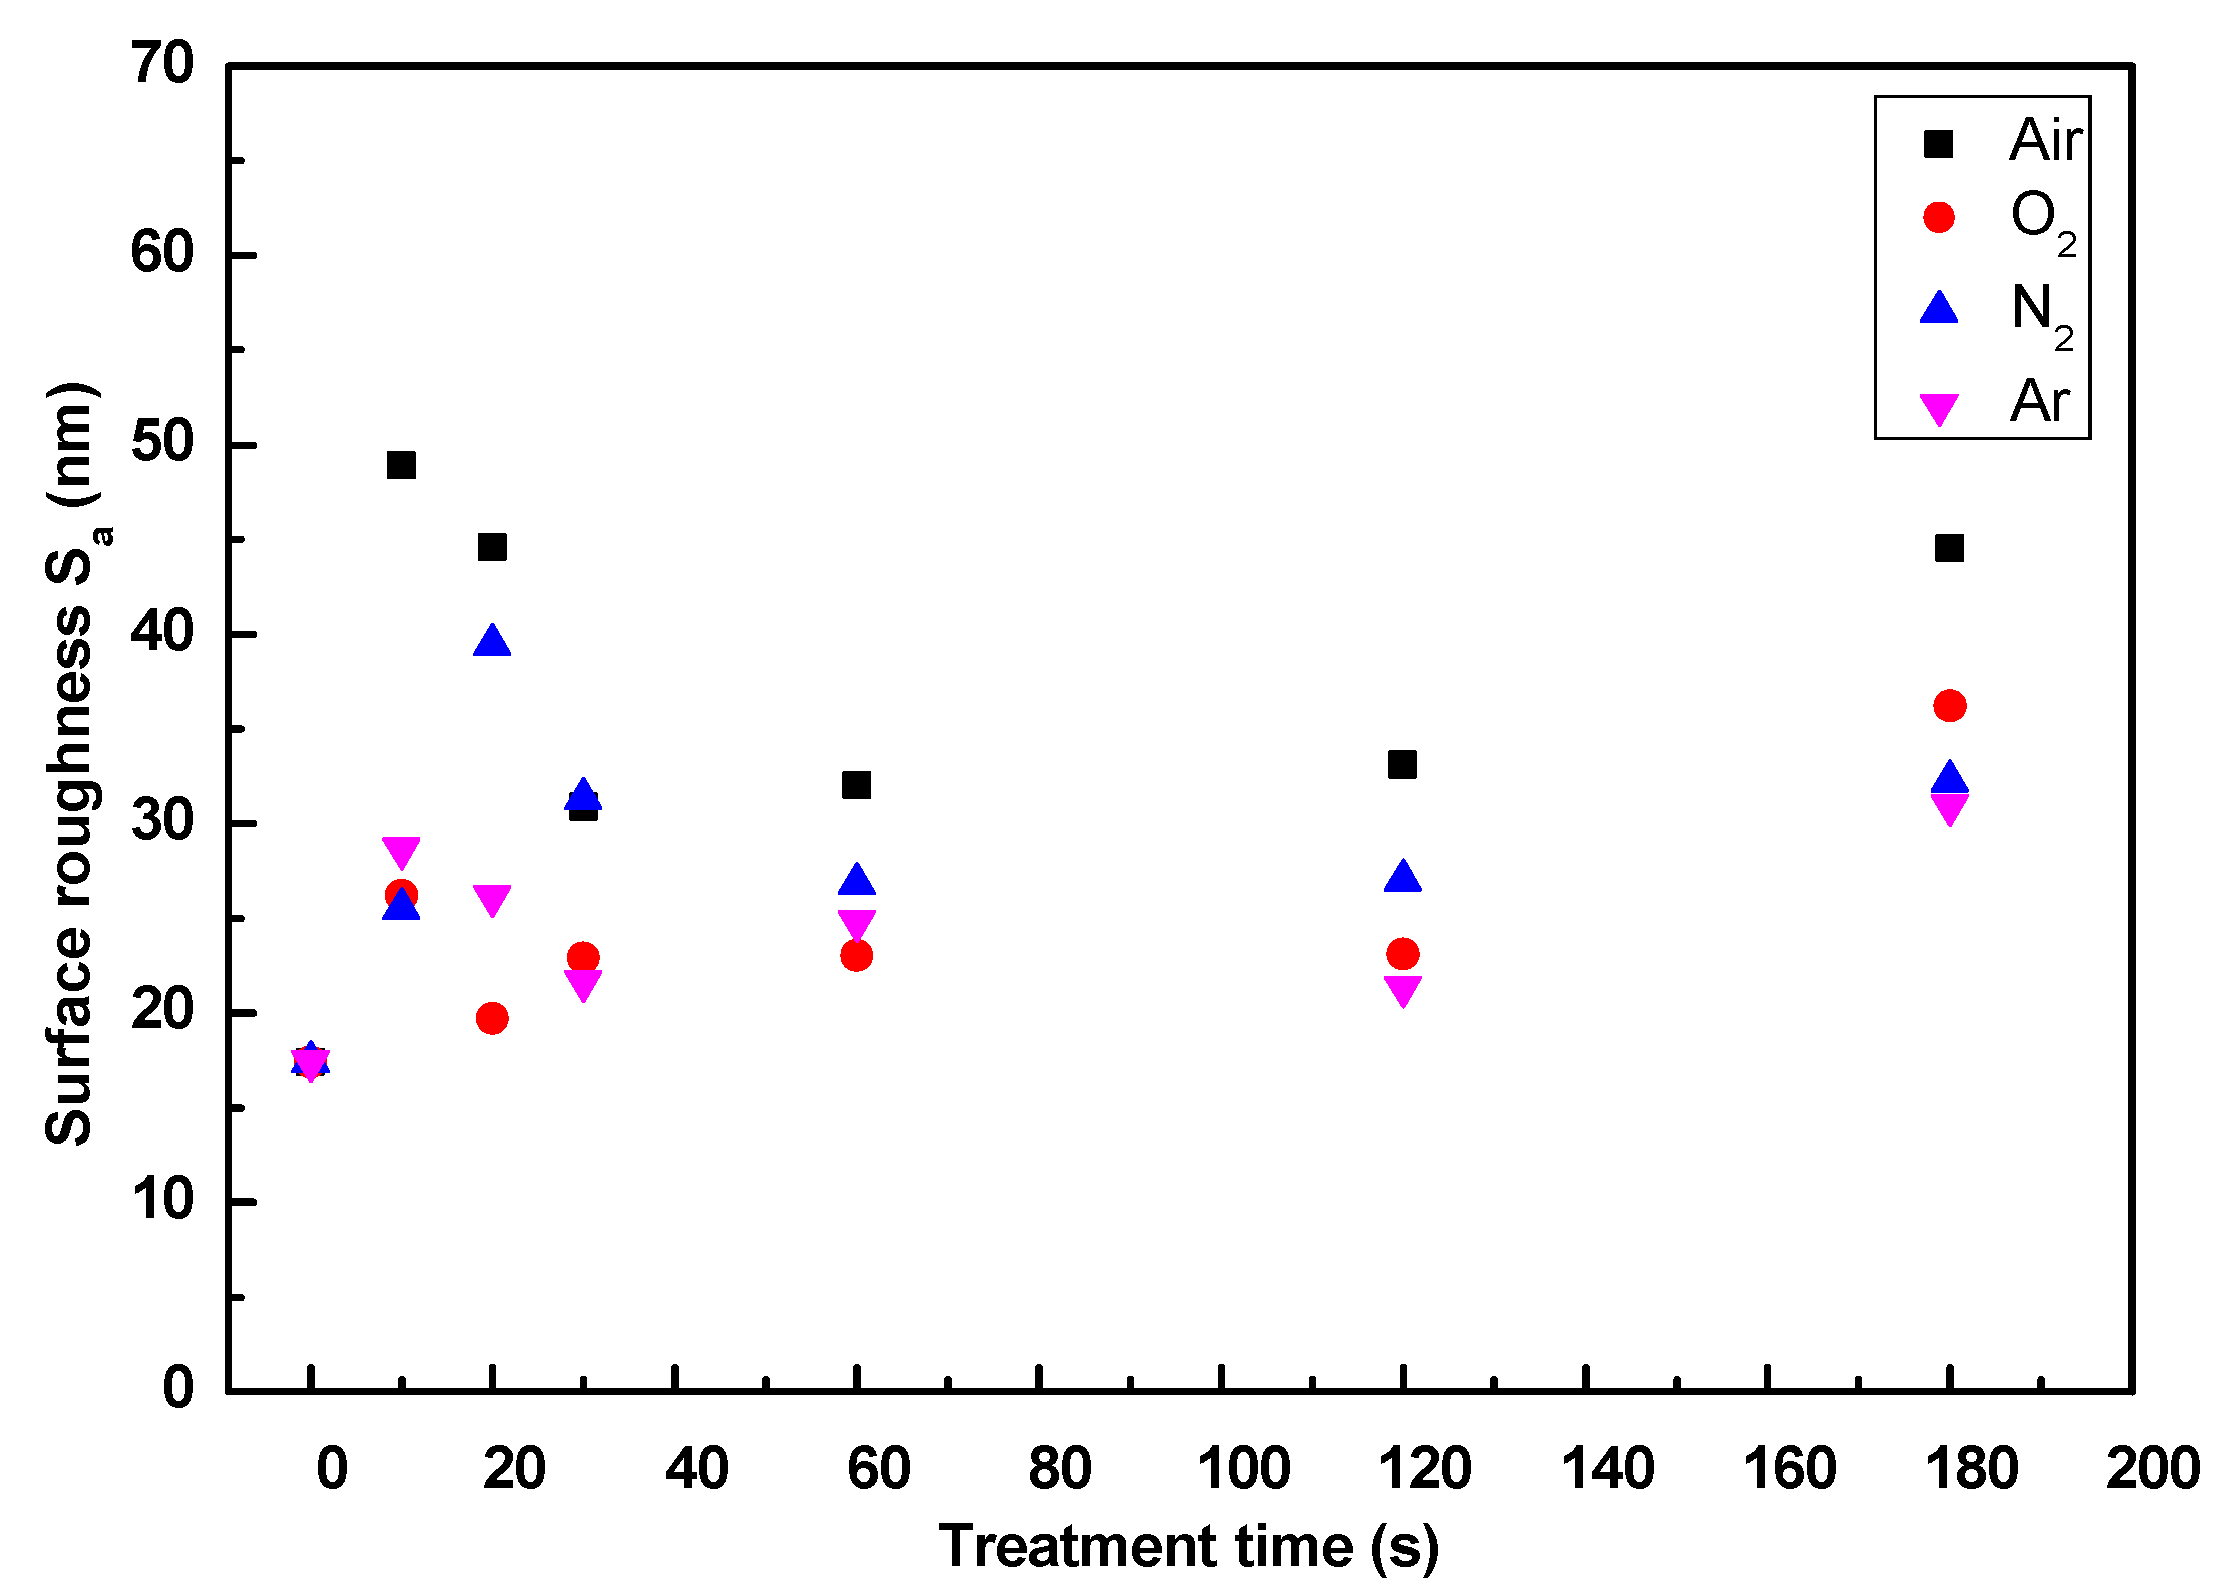
Figure 14.
Surface roughness as a function of plasma treatment time for PU treated using gas mixtures.
Figure 14.
Surface roughness as a function of plasma treatment time for PU treated using gas mixtures.
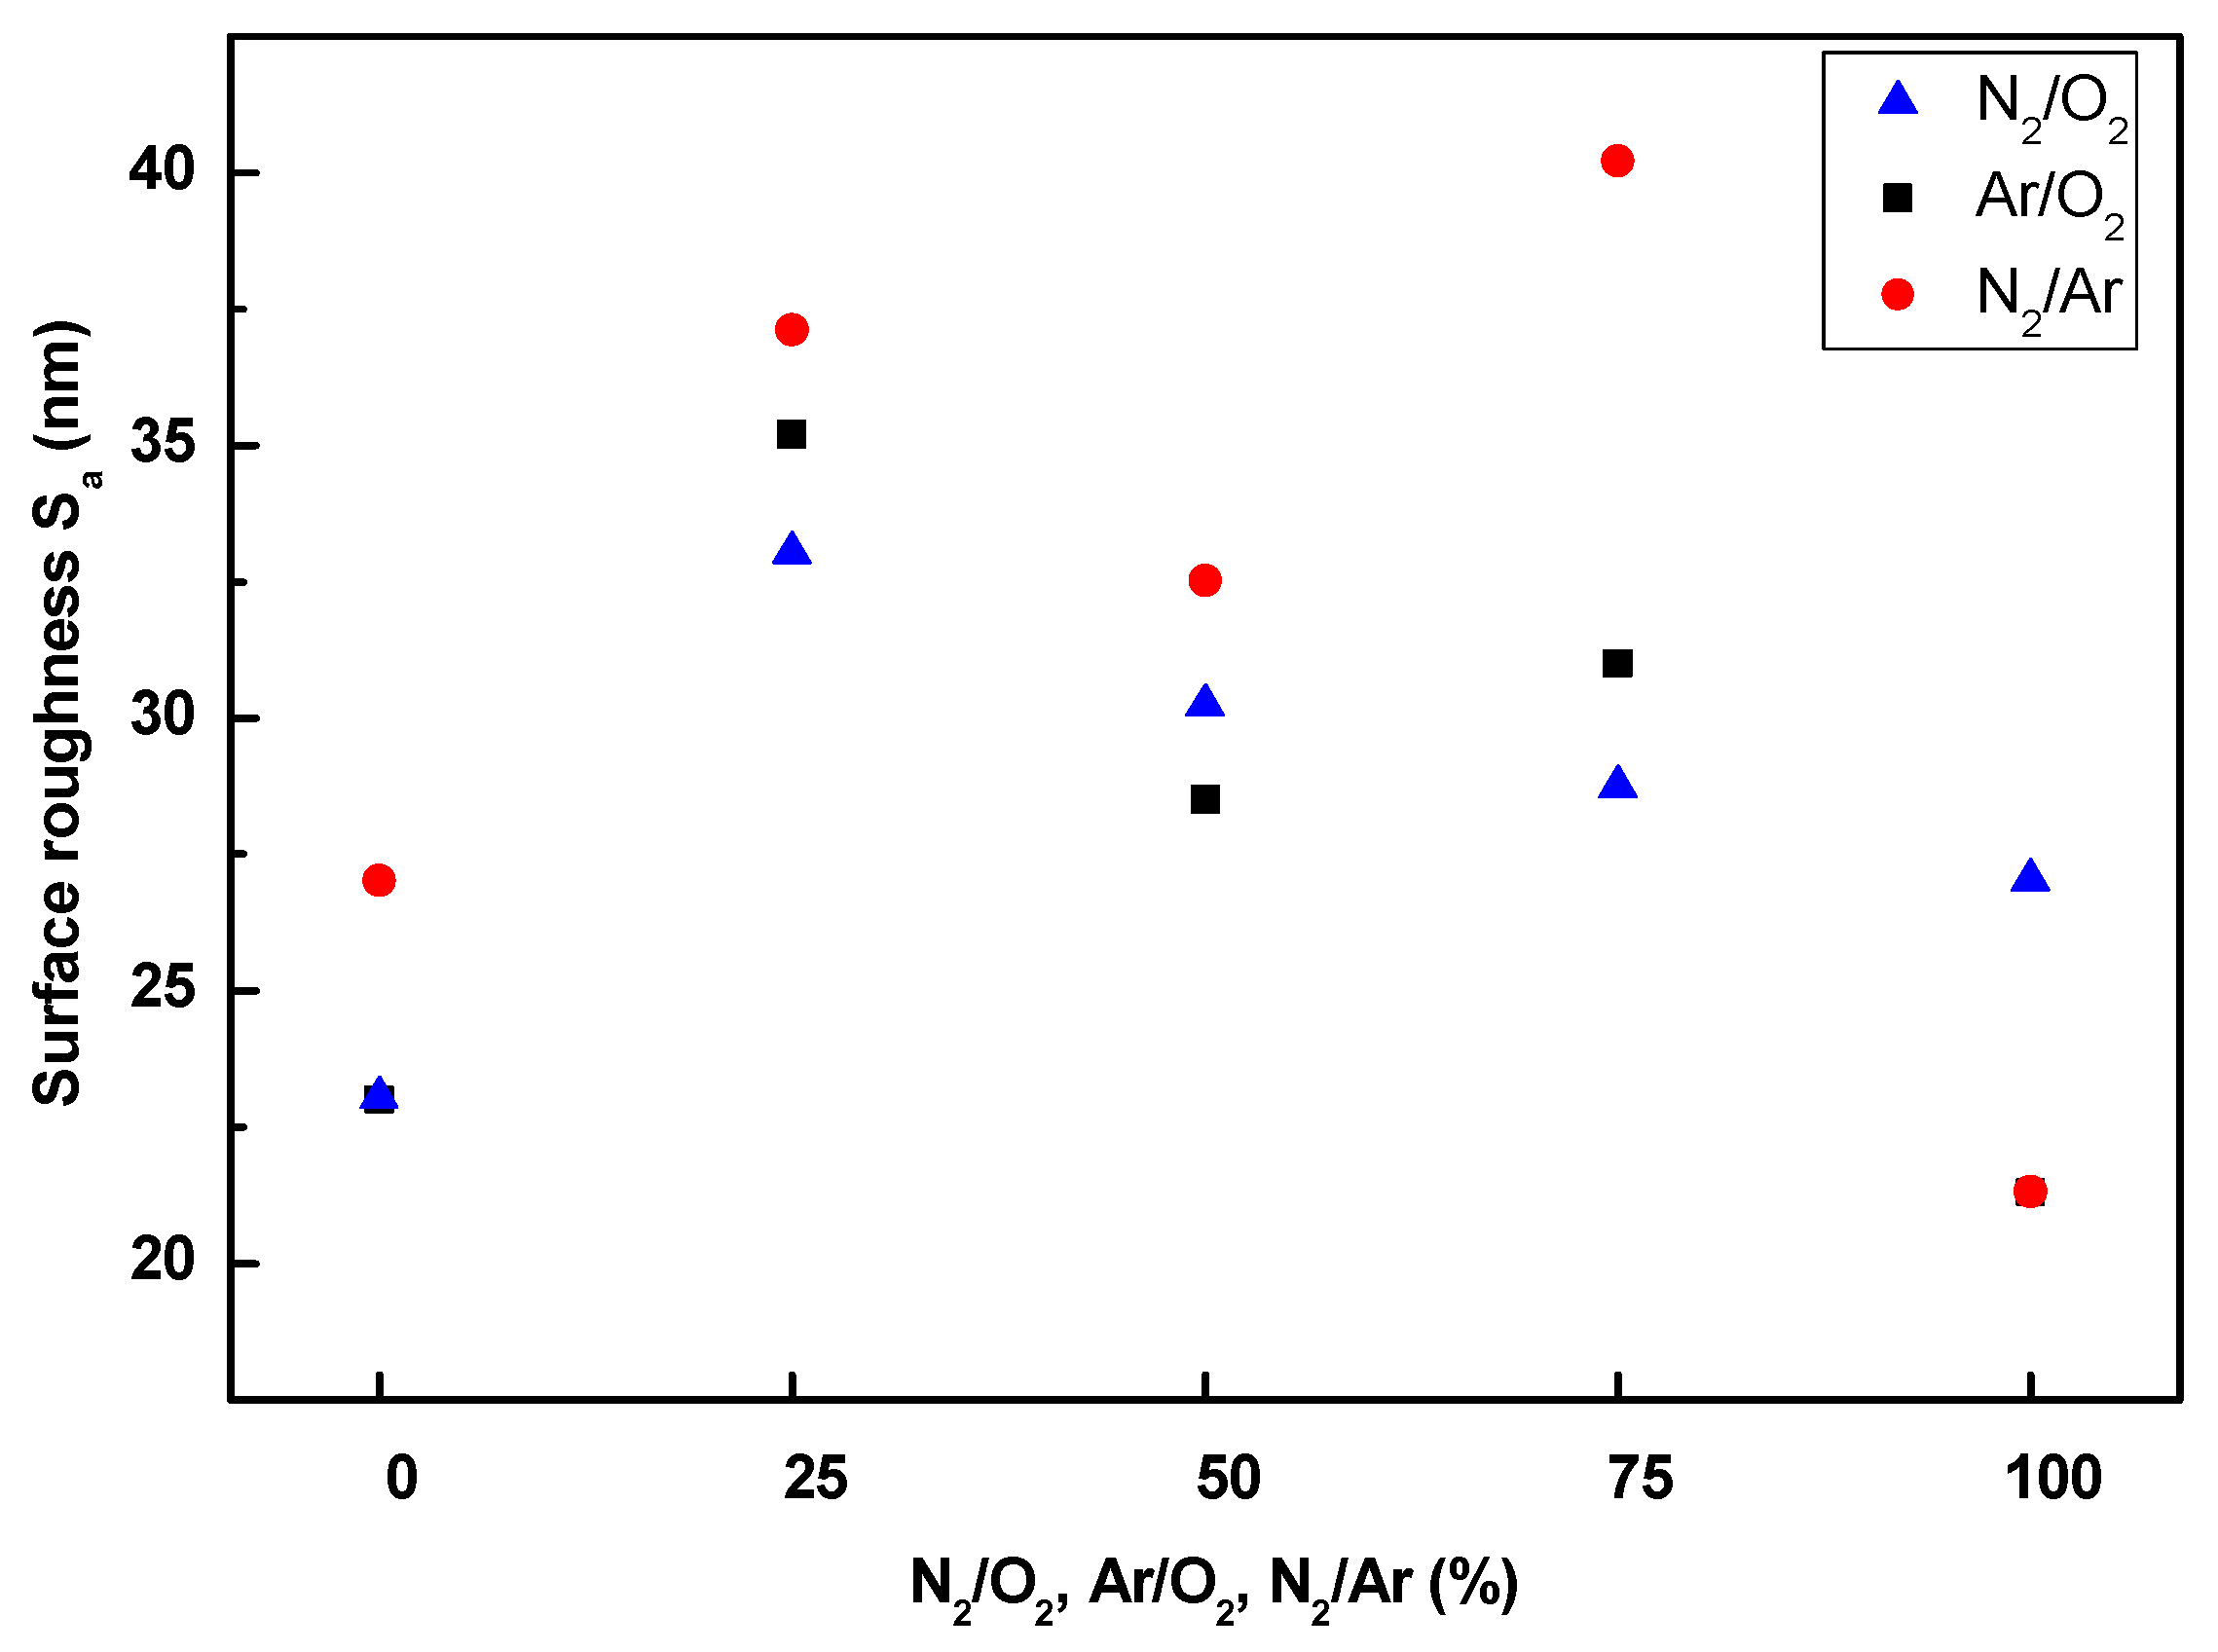
Figure 15.
Atomic force microscopy (AFM) height images of the PU films: (a) untreated (Ra = 6.3 nm), and plasma treated (180 s) using: (b) air (Ra = 27.5 nm), (c) O2 (Ra = 20.0 nm), (d) N2 (Ra = 24.7 nm), and (e) Ar (Ra = 23.0 nm).
Figure 15.
Atomic force microscopy (AFM) height images of the PU films: (a) untreated (Ra = 6.3 nm), and plasma treated (180 s) using: (b) air (Ra = 27.5 nm), (c) O2 (Ra = 20.0 nm), (d) N2 (Ra = 24.7 nm), and (e) Ar (Ra = 23.0 nm).
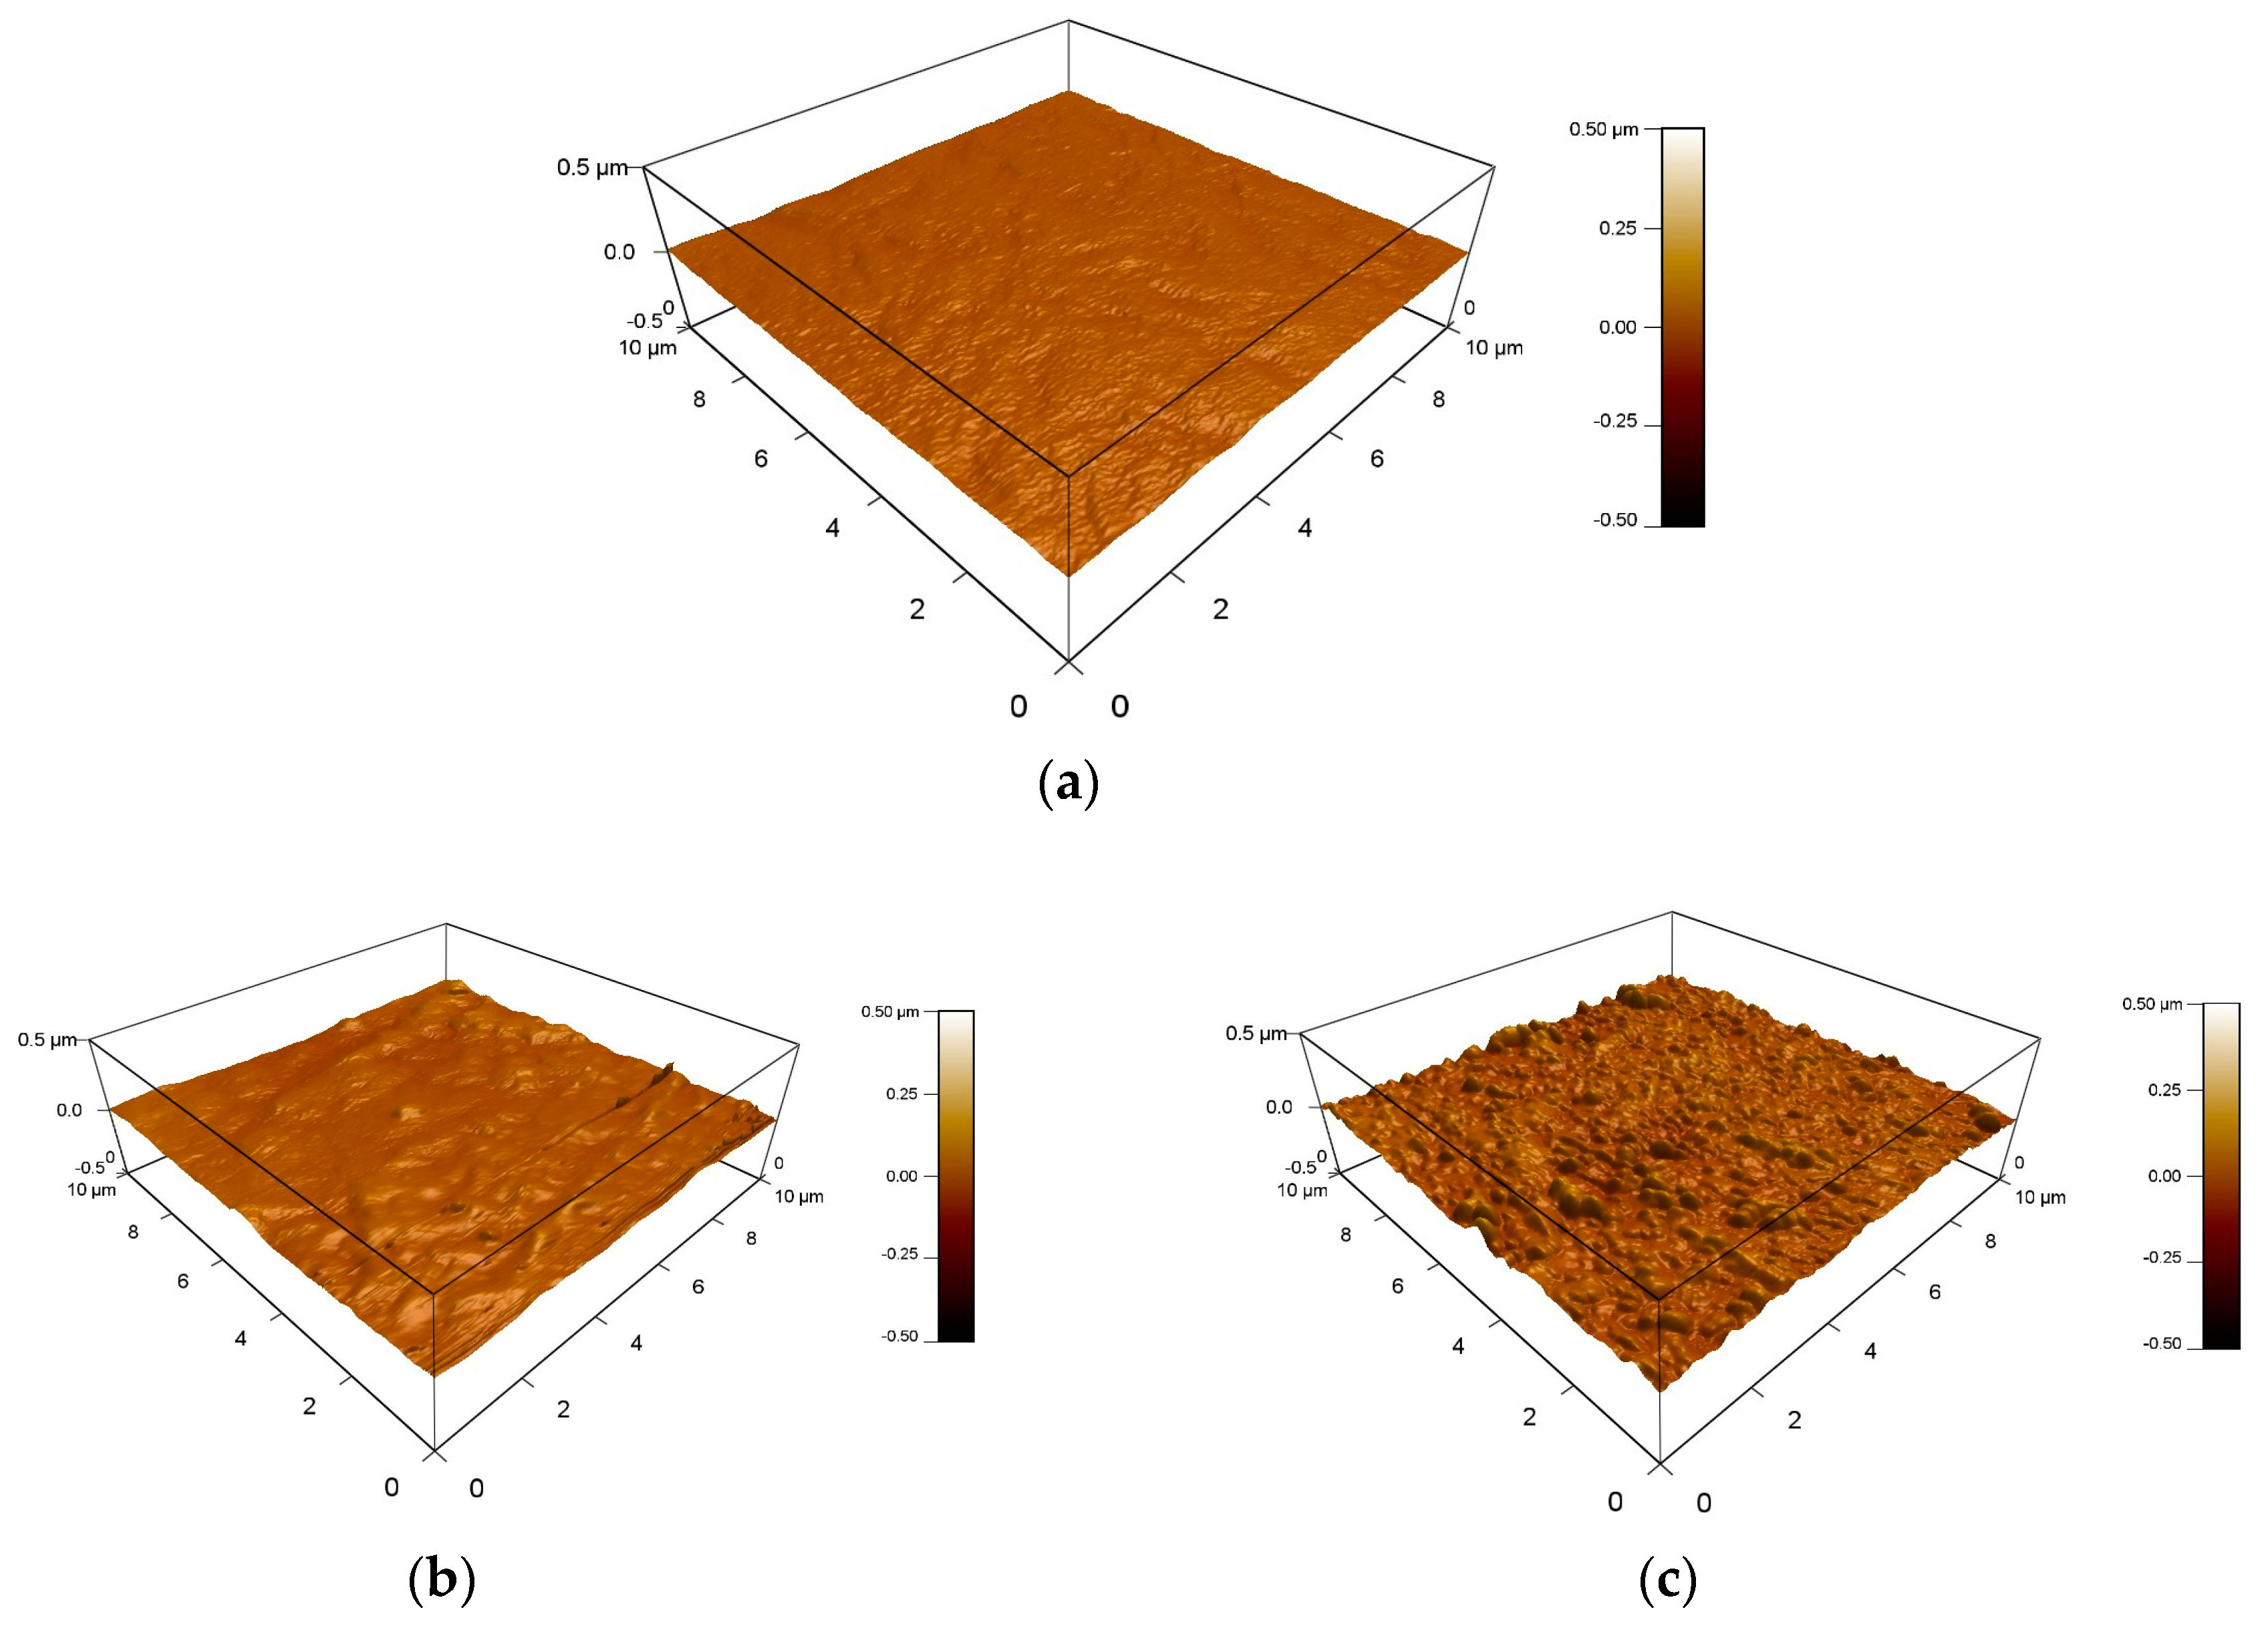
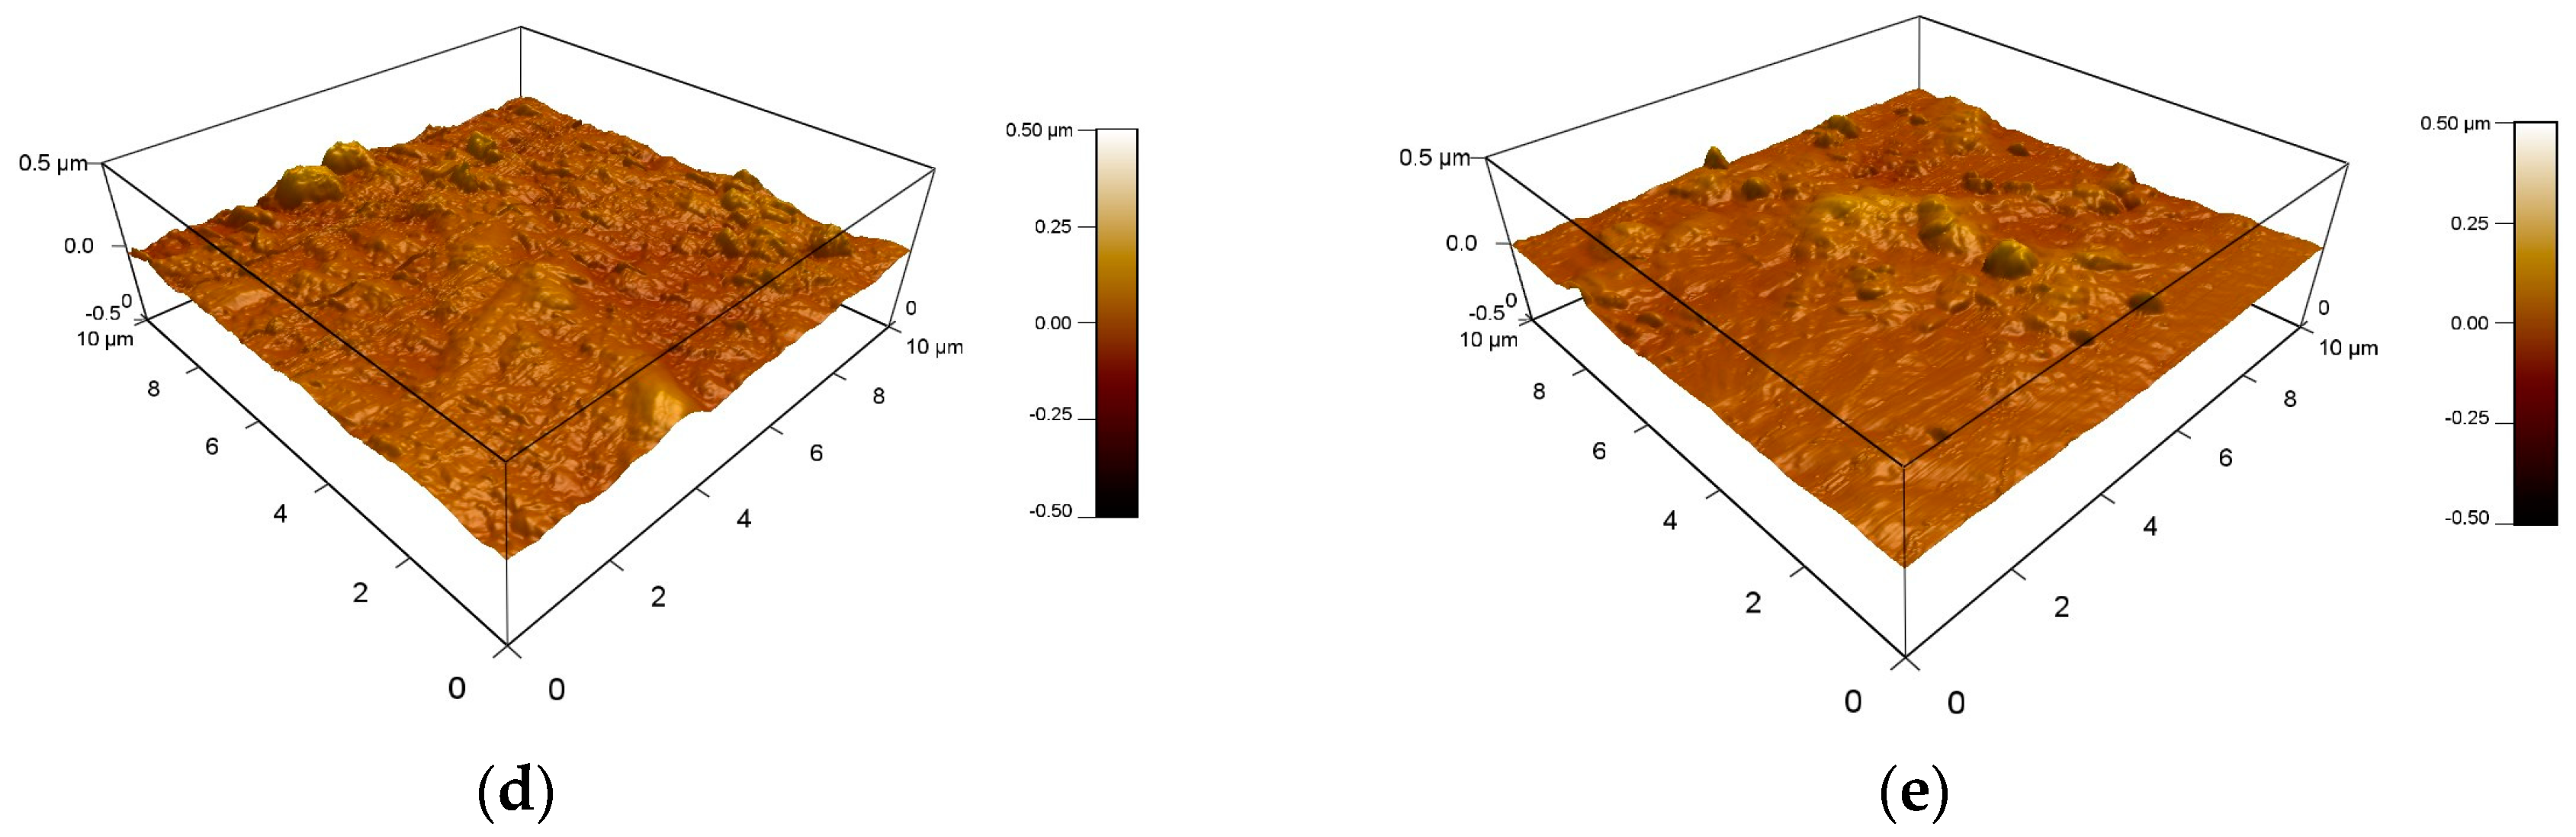
Figure 16.
AFM height images of the PU films treated by plasma (180 s) in gas mixtures with a concentration of 50% of each gas: (a) N2/O2 (Ra = 8.8 nm), (b) Ar/O2 (Ra = 13.5 nm), and (c) N2/Ar (Ra = 8.4 nm).
Figure 16.
AFM height images of the PU films treated by plasma (180 s) in gas mixtures with a concentration of 50% of each gas: (a) N2/O2 (Ra = 8.8 nm), (b) Ar/O2 (Ra = 13.5 nm), and (c) N2/Ar (Ra = 8.4 nm).


Table 1.
Surface elemental composition of PU plasma treated in different gases.
| Working Gas | C 1s | N 1s | O 1s |
|---|---|---|---|
| Untreated | 81.0% | 3.1% | 15.9% |
| Air | 73.0% | 2.3% | 24.7% |
| O2 | 75.0% | 3.0% | 22.0% |
| N2 | 79.8% | 3.6% | 16.6% |
| Ar | 75.4% | 2.8% | 21.8% |
Publisher’s Note: MDPI stays neutral with regard to jurisdictional claims in published maps and institutional affiliations. |
© 2020 by the authors. Licensee MDPI, Basel, Switzerland. This article is an open access article distributed under the terms and conditions of the Creative Commons Attribution (CC BY) license (http://creativecommons.org/licenses/by/4.0/).
Share and Cite
MDPI and ACS Style
E. Abusrafa, A.; Habib, S.; Popelka, A. Surface Functionalization of a Polyurethane Surface via Radio-Frequency Cold Plasma Treatment Using Different Gases. Coatings 2020, 10, 1067. https://doi.org/10.3390/coatings10111067
AMA Style
E. Abusrafa A, Habib S, Popelka A. Surface Functionalization of a Polyurethane Surface via Radio-Frequency Cold Plasma Treatment Using Different Gases. Coatings. 2020; 10(11):1067. https://doi.org/10.3390/coatings10111067
Chicago/Turabian StyleE. Abusrafa, Aya, Salma Habib, and Anton Popelka. 2020. "Surface Functionalization of a Polyurethane Surface via Radio-Frequency Cold Plasma Treatment Using Different Gases" Coatings 10, no. 11: 1067. https://doi.org/10.3390/coatings10111067
Note that from the first issue of 2016, this journal uses article numbers instead of page numbers. See further details here.