Influence of Process Conditions on the Growth and Texture of CVD Alpha-Alumina


SAR Consulting, Rua Maria Vieira da Silva, Lote 2, 3B, 8600-780 Lagos, Portugal
Coatings 2020, 10(2), 158; https://doi.org/10.3390/coatings10020158
Submission received: 21 December 2019
/
Revised: 5 February 2020
/
Accepted: 5 February 2020
/
Published: 9 February 2020
(This article belongs to the Special Issue Surface Engineering for Friction and Wear Reduction)
Abstract
:In the present study, the influence of experimental variables on the growth characteristics and texture development in chemically vapour deposited α-Al2O3 coatings was investigated. The emphasis was on the effects of H2S. The α-Al2O3 layers were deposited from the AlCl3-H2-CO2-HCl-H2S precursor system onto intermediate Ti(C,N) layers. The substrate was cemented carbide. The coatings were characterized with respect to microstructure and texture using X-ray diffraction, scanning electron microscopy and electron back-scattering diffraction. The observations were unpredictable, suggesting that in addition to the growth rate, H2S strongly affected the texture of the α-Al2O3 coatings. The uncatalyzed α-Al2O3 coatings (H2S = 0) developed (110) texture. With the increment of H2S concentration the texture changed from (110) texture through (100), (102) and (104) textures to (0001) texture. Growth regimes for (110), (100), (102), (104) and (0001) textures were depicted as a function of the H2S/CO2 ratio. Examples of grain-boundary and microstructural manipulation of CVD α-Al2O3 layers by applying texture control were presented.
1. Introduction
Alumina is uniquely suited for metal cutting tools due to its chemical inertness and high hot-hardness at the temperatures typically reached in these applications [1,2,3,4]. Ti(C,N)-Al2O3 coated cemented carbide tools are used, for example, in turning and milling of steels and cast irons. The Al2O3 coatings are typically obtained using chemical vapour deposition (CVD). CVD has been used for about 50 years for the industrial deposition of wear resistant coatings and is still today the only technique that can economically produce thick and uniform Al2O3 coatings on cemented carbide tools.
CVD of Al2O3 is usually performed from the AlCl3–H2–CO2 system based on hydrolysis of AlCl3 according the following generally accepted reactions:
2AlCl3(g)+3H2O(g) → Al2O3(s)+6HCl(g)
The amount of water needed for the reaction is formed in situ in the deposition chamber as a result of the water gas shift reaction:
The overall reaction is thus:
CO2 (g) + H2(g) → CO(g) + H2O(g)
2AlCl3(g) + 3CO2(g) + 3H2(g) → Al2O3 (s) + 3CO(g)+6HCl(g)
The reaction is complex and involves both homogenous gas-phase reactions and heterogeneous surface reactions [5,6,7,8,9,10,11,12,13,14,15]. The rate determining reaction is the slow homogeneous water gas shift reaction (2).
The heterogeneous surface reactions that may contribute to the growth of Al2O3 are probably direct surface reactions between aluminum halides and an oxygen donor. The relative contributions of homogenous and heterogeneous reactions to the growth of Al2O3 depend strongly on the free gas volume to surface ratio adjacent to the surface to be coated [5,6]. Long chains of reactions starting with the decomposition of AlCl3 (or Al2Cl6) in the presence of H2 (H2S = 0) have been suggested, together with different intermediate transition states such as AlCl2(OH) and AlClO [13,14,15]. According to the simulations by Tan et al. [15], the AlClO molecule could be a major intermediate Al-species catalyzing the slow water gas shift reaction at short residence times. A recent thermodynamic study [16] supports this hypothesis even though the authors emphasized that AlCl3 and AlCl2OH are thermodynamically more stable under CVD conditions.
The early Al2O3 coatings deposited from the system AlCl3-H2-CO2 exhibited a very low deposition rate and often consisted of a mixture of α-Al2O3 and κ-Al2O3. Typically, the first-generation alumina coatings were composed of coarse grained α-Al2O3 embedded in a matrix of fine-grained κ-Al2O3. Besides the fact that it was not possible to control the phase content, the overall growth rate was very low. Further, the early Al2O3 coatings also suffered from a pronounced “dog-bone” effect, i.e., the deposition rate was higher at the cutting edges than on the other surfaces of the insert. This phenomenon is commonly accepted to be a result from a higher gas volume relative to the surface area around the edges of the inserts. The introduction of H2S doping [17] enhanced not only the over-all deposition rate but also suppressed the dog-bone effect. The use of H2S as a catalyst facilitated thicker alumina layers with a good coating uniformity. It is emphasized that the α-Al2O3 found in these kinds of coatings as well as in early commercial α-Al2O3 coatings was mainly a result of the κ → α phase transformation [18].
The introduction of specific nucleation and oxidation steps enabled H2S-catalyzed deposition of Al2O3 coatings being composed of either as-grown κ-Al2O3 or α-Al2O3 phases [19,20]. Following this development, it was established that as-grown α-Al2O3 exhibited a superior wear resistance to κ-Al2O3 and earlier α-Al2O3 layers. Empowered by the nucleation control, it was soon discovered that not only the phase, but also the texture of the α-Al2O3 coatings could be determined by careful control of the process parameters, together with a proper nucleation step [20,21,22,23,24]. Consequently, it became possible to deposit α-Al2O3 coatings with, e.g., (102), (104), (0001) growth textures. Recently, the (0001) textured α-Al2O3 coatings were found to show a substantially enhanced cutting performance, in some applications by several hundreds of per cent over the other α-Al2O3 textures [20,21,23,24]. Introduction of the texture-control on an industrial scale [23,24], facilitating the commercial production of (0001) textured α-Al2O3 coatings on medium temperature MTCVD Ti(C,N) intermediate layers has thus been one of the most important recent advances in CVD tool coatings. These α-Al2O3 coatings have been considered state-of-the-art for more than ten years [25].
Although H2S has been used for about 30 years in industrial CVD processes as a catalyst, the underlying mechanisms have not yet been fully understood. The earlier experimental as well as thermo-dynamic studies have mainly dealt with deposition of α-Al2O3 from the AlCl3-H2-CO2 and AlCl3–H2–CO2–HCl systems [5,6,7,8,9,10,11,12,13,14,15] and there are only few studies which have tried to understand the role of H2S in the CVD process of α-Al2O3 [26,27]. According to these studies, H2S shifts the rate determining step from the gas phase to the surface. It has also been assumed that H2S acts as a true catalyst, dissociating and reforming via adsorption desorption reactions on the surface, these reactions being much faster than H2O adsorption explaining the much higher growth rates obtained in the presence of H2S. Slager and Amberg [28] suggested steps consisting of H2S adsorption on Al+- ions forming an Al–S surface bond H-bonding to neighboring O and OH-species followed by its decomposition with water formation. According to this mechanism, both S and O adsorption takes place and the presence of OH-groups is needed. Consequently, sulfur adatoms must be removed from the surface and this step could be rate limiting for the suggested mechanism. Recent work has suggested that H2S acts as true catalyst for the surface reaction [16] and that H2S will not solve in α-Al2O3 during deposition [29].
Even though advances in the nucleation and deposition technology have enabled the controlled deposition of strongly textured α-Al2O3 coatings, there are only a limited number of reports on deposition of such textured CVD α-Al2O3 layers [12,20,21]. Most importantly, there are no studies trying to elucidate the effects of H2S on the texture development in CVD α-Al2O3 coatings. This work addresses the above-described situation and elucidates the influence of process conditions, including H2S, on CVD of α-Al2O3.
2. Experimental
2.1. CVD Process
The α-Al2O3 coatings were deposited from the AlCl3–H2–CO2–H2S–HCl system at 1000 °C. The coatings were deposited in a computer-controlled, hot-wall CVD reactor. AlCl3 was generated in a separate generator by letting HCl pass over and react with aluminum chips (purity 99.999 %) at a temperature of about 380 °C. Approximately 22% of the total flow (H2, HCl) passed through the AlCl3 generator. The coatings were deposited as multilayers and single layers. The multilayer coatings were mainly used to investigate the growth rate as a function of H2S concentration at several levels of CO2, while the single layers were deposited to investigate the texture development in the α-Al2O3 layers.
The α-Al2O3 coatings were deposited onto (MTCVD) Ti(C,N) layers. The MTCVD Ti(C,N) layers were deposited onto cemented carbide substrates composed of 93.3 wt.% WC, 6.2 wt.% Co and 0.5 wt.% (Ta,Nb)C at a temperature of about 860 °C from the CH3CN-TiCl4-N2-H2 system. Before depositing the MTCVD Ti(C,N) layer, a thin TiN layer was first applied on the cemented carbide substrate from the TiCl4-N2-H2 precursor mixture. The MTCVD Ti(C,N) layer was deposited to a thickness of ~3 μm onto the TiN layer. After this, the process temperature was raised to 1000 °C and a high temperature Ti(C,N) layer was deposited on top of the MTCVD layer from the TiCl4-CH4-N2-H2 system. Onto this layer, an oxidizing deposition step was applied from the CO2-CO-H2 system to ensure the nucleation of α-Al2O3.
2.2. α-Al2O3 Coatings
2.2.1. Multilayer Coatings
The multilayer coatings were deposited to examine the effects of CO2 and H2S on the growth of α-Al2O3. The α-Al2O3 multilayers were composed of 8 individual layers of α-Al2O3, each layer being deposited at different process conditions. The individual α-Al2O3 layers of the of the multilayer coating were separated by thin Ti(C,N) layers combined with an oxidizing nucleation step to stabilize α-Al2O3. The deposition time for each single layer in a multilayer coating was 65 min. H2S was added into the process after a 5 min delay and the procedures were identical for all layers. The effect of H2S doping (0.1–1.6 vol %) was studied at three different CO2 levels of 3, 4 and 6 vol % (Table 1). By using the multi-layer approach, several α-Al2O3 coatings with different process parameters could be deposited in the same coating run and then inspected with respect to growth rate and, to a limited degree, with respect to the texture using EBSD. This approach has been previously used to investigate the deposition characteristics of κ-Al2O3 [10].
2.2.2. Coatings for Texture Analysis
Single α-Al2O3 layers were deposited to elucidate the texture development. The process parameters are summarized in Table 2. H2S concentration was varied from about 0.02 vol % to about 1.6 vol %. CO2 was varied from about 3 vol % to about 6.5 vol %. Consequently, H2S/CO2 ratios from ~0.004 to ~0.40 were applied. The α-Al2O3 coatings presented in Table 2 were deposited on MTCVD Ti(C,N) layers using identical bonding and oxidation steps.
The first 30 min of all the α-Al2O3 coatings was performed uncatalyzed (H2S = 0). After this period, H2S was introduced into the reactor at controlled H2S/CO2 ratios. The AlCl3/CO2 ratio was kept constant (as well as other process parameters) during the depositions and the deposition time was 480 min, resulting in the formation of 6–10 μm thick α-Al2O3 layers. The reference layer of α-Al2O3 was deposited without H2S (H2S = 0). In this case, due to the low deposition rate of non-catalyzed alumina [10], the deposition time of 1200 min was applied to achieve a sufficient thickness, Table 2. Coatings deposited at H2S = 0.03 vol % (CO2 = 6.25 vol %), H2S = 0.08 vol % (CO2 = 6.25 vol %), H2S = 0.2 vol % (CO2 = 3.25 vol %), H2S = 0.7 vol % (CO2 = 6.25 vol %) and at H2S = 0.7 vol % (CO2 = 3.25 vol %) referred to as Coatings a, b, c, d and e were selected to be analysed in more detail by XRD and SEM.
2.2.3. Manipulation of α-Al2O3 Microstructures
To reduce the process time a thin MTCVD layer (~ 3 µm) was used in the experiments described in Section 2.2.2. However, the MTCVD Ti(C,N) layer has an important function as a diffusion barrier for W and Co from the cemented carbide substrate to the α-Al2O3-Ti(C,N) interface. These elements may disturb the initial growth of α-Al2O3 [1,30]. The problem is well-known in cutting tool industry and confirmed in a recent TEM study [30]. Further, the texture of the MTCVD Ti(C,N) layer, which is more profound in thicker layers, may also affect nucleation and growth of the alumina layer. Consequently, additional α-Al2O3 layers were deposited on thicker and textured MTCVD Ti(C,N) layers using state-of-the-art nucleation and bonding layers. The aim of these experiments was to validate the obtained results and explore further possibilities of texture control.
The similar CVD process and the procedure as described in Section 2.1 was applied. The MTCVD Ti(C,N) layers were, in this case, deposited to a thickness of ~8 μm. Additionally, between the MTCVD and the high-temperature CVD Ti(C,N) layers, a thin N-rich Ti(C,N) layer was applied at 1000 °C. The MTCVD Ti(C,N) coating exhibited (211) texture. Three different α-Al2O3 layers referred to as Coatings f, g and h were deposited on these Ti(C,N) layers: Coating f (Table 3) was composed of an α-Al2O3 layer deposited at a constant H2S/CO2 ratio of 0.4 (after a period of 30 min at H2S = 0) to a thickness of about 8 µm (deposition time 480 min). Coating g comprised an α-Al2O3 layer deposited using the H2S/CO2 ratios 0.40 and <0.01 applied in sequences favoring the growth along the c-axis and perpendicular to it, i.e., along the <0001> and <110> directions, respectively. Deposition was started by applying (0001) process conditions (H2S/CO2 = 0.40) first (after a period of 5 min at H2S = 0), followed by (110) conditions (H2S/CO2 < 0.01). The combination of (0001) and (110) sequences was repeated 7 times, the uppermost sequence being thus deposited using (110) conditions. The resulting coating was consequently composed of 14 sub-layers: 7 layers with (0001) conditions and 7 layers with (110) conditions. The deposition time for the first (0001) sequence was 45 min and 30 min for the following sequences. H2S was added after 5 min delay in each step. The process parameters for α-Al2O3 were otherwise the same as those used for Coating f. The α-Al2O3 layer of Coating h (Table 4) was deposited using H2S/CO2 = 0.4 (after a period of 30 min at H2S = 0) to a thickness of about 7 µm (deposition time 420 min) and after this period, the process conditions were switched over to H2S/CO2 < 0.01 and applied for 60 min.
2.3. Analysis
The thicknesses of the individual α-Al2O3 layers in multilayers were determined with a scanning electron microscope (SEM) run preferably in backscattered electron imaging mode. The Ti(C,N) interlayers appeared as white lines in the darker alumina matrix (Figure 1a). The coating thickness was measured in the middle of the upper side of the insert (average of five measurements). The general morphology of the multilayers as well as the single layers was studied using secondary electrons. The Scanning Electron Microscopy (SEM) and Electron Back-Scattering Diffraction (EBSD) investigations were carried out using LEO Ultra 55 FEGSEM (equipped with Chanel 5 EBSD software) operating at 15–20 kV with a working distance of 15 mm.
The texture of the single layers was studied by means of X-ray diffraction (XRD) using a Bruker D8 Advance X-ray diffractometer with θ–2θ setup and CuKα radiation. The 2θ range used was from 20° to 70°. Texture coefficients (TC) for the α-Al2O3 coatings were calculated from the Harris equation [31]:
where I(hkil) are the measured intensities of the (hkil) reflection, I0(hkil) powder diffraction intensities according to the ICCD’s PDF card no 46-1212 and n is the number of reflections used in the calculation. It is noted that Miller-Bravais (hkil) indices for a hexagonal unit cell were applied. The following (hkil) reflections were used: (102), (110), (104), (0006), (113), (116) and (300). In this case, 7 reflections were used and therefore, the maximum value of was 7 for perfectly oriented material (referred later as TCmax). Additional analyses using a 2θ range of 20°–130° were performed for selected coatings and in this case, ICCD’s PDF card no 14-4268 was used to identify the reflexes. It is emphasised that we are here dealing with a fiber texture, meaning that in the (hkil) textured coating, the crystallographic planes {hkil} are preferentially oriented parallel to the substrate, while there is a rotational degree of freedom around the fiber axis which is perpendicular to this plane.
The EBSD studies were carried out on coating surfaces mechanically polished using colloidal silica as well as ion polished cross-sections. The specimens were ultrasonically cleaned before EBSD examination. The sample surface was tilted 70° to the incident beam and analysis was carried out at 20 kV. Data collection was performed at 80 Hz on a scan area of 30 µm × 15 µm. A step size of 0.05 um was used during the EBSD scans. EBSD inverse pole figure (IPF) maps, grain boundary (GB) statistics as well as Σ values were acquired and processed by using commercial integrated software. The constrained coincidence site lattice (CLS) model adapted for hexagonal symmetry by Grimmer was used [32]. Brandon criteria [33] was applied to account for the allowed deviation from the theoretical values. Special GBs corresponding to given Σ values were counted and expressed as a fraction of the total GBs. A confidence index (CI) ≥0.2 was applied [34]. In this context, only the Σ3 values were dealt with.
3. Results and Discussion
3.1. Influence of H2S on Growth Rate of α-Al2O3
The results presented below were obtained by depositing multilayers of α-Al2O3 as described in Section 2.2.1. The aim of this experiment was to obtain a general understanding of the effects of H2S and CO2 on the growth rate of α-Al2O3 as well as to elucidate the limits for the gas-phase nucleation. The detailed process data for the coatings are presented in Table 1.
SEM cross-section images (Figure 1a–c) show alumina multilayer coatings composed of 8 layers of α-Al2O3 deposited on the MTCVD Ti(C,N) layers described above. The layers were deposited at H2S contents of about 0.1 vol % (first layer), 0.2 vol % (second layer), 0.4 vol % (third layer), 0.6 vol % (fourth layer), 0.8 vol % (fifth layer),1.0 vol % (sixth layer), 1.4 vol % (seventh layer) and 1.6 vol % (eight layer). The CO2 content was 4 vol % for the coatings shown in Figure 1a and 6 vol % for the coating shown in Figure 1b. From the SEM image (Figure 1b), it is evident that the uppermost layer deposited using a high H2S (1.6 vol %) concentration showed gas phase nucleation. As is clear from Figure 1a, this was not the case when the same coating was deposited at CO2 = 4 vol %. Figure 1c shows an inverse pole figure map of ion polished cross-section of the coating shown in Figure 1b. It is interesting to note that the inverse pole figure map suggests that the preferred growth direction of α-Al2O3 changes from (110), as seen in the first and second layers, to (0001) with increasing H2S doping. The uppermost layer, however, which was affected by gas-phase nucleation was composed of more randomly oriented grains. It is emphasized that these experiments where the catalyzed growth period of each layer was only 50 min cannot be used to draw any conclusions of the effects of H2S on the texture development. Figure 1c gives only a clue that H2S concentration may affect the texture of α-Al2O3 and was a triggering factor to investigate the role of H2S concentration in more detail as described in Section 3.2.1.
The growth rates measured using cross-section SEM are presented in Figure 2 as a function of H2S content at CO2 levels of 3, 4 and 6 vol %. As shown in Figure 2, the growth rate of α-Al2O3 was strongly dependent on H2S concentration and the effect of H2S was more pronounced at higher CO2 levels. Consequently, at higher CO2 levels, very high growth rates could be reached at increased levels of H2S doping. This is in accordance with earlier studies for κ-Al2O3 [10]. The maximum in the growth rate occurred at about 0.3, 0.6 and 0.9 vol % H2S at CO2 levels of 3, 4 and 6 vol %, respectively. The maximum growth rate was about 2.2 μm/h at CO2 = 6 vol % and H2S ~0.9 vol %. Compared with deposition rates of less than 0.1 µm/h obtained without H2S doping (see Section 3.1), the growth rates could thus be increased by more than 20 fold. After having reached the maximum, the growth rates decreased with the H2S increment, as has also been reported previously for κ-Al2O3 [10]. This behavior was observed at all the studied CO2 levels and was more pronounced at the highest CO2 level, possibly due to the tendency for gas-phase nucleation, as also speculated in connection with κ-Al2O3 [10]. Even though these results give a general idea of the possibilities to manipulate the growth of α-Al2O3 by H2S and CO2, it is not relevant to compare the growth rates presented in Figure 2 with the growth rates of textured α-Al2O3 layers discussed later in connection with texture development.
3.2. Texture and Microstructure of α-Al2O3
The results presented below were obtained by depositing thick single layers of α-Al2O3 as described in Section 2.2.2. The detailed process data for the coatings is presented in Table 2. The aim of this part was to elucidate the influence of H2S on texture development.
3.2.1. Texture Development
The reference layer of α-Al2O3 (H2S = 0) showed a thickness of about 1.2 μm, despite a long deposition time of 1200 min exhibiting thus the average growth rate of only 0.06 µm/h. This coating showed a clear (110) texture with TC(110) = 4.5, which can be considered high as far as the coating thickness is considered. The measured TCs for this layer are presented in Table 5 and these values are used in Figure 3a,b at H2S = 0.
Figure 3a,b shows the developments of the TCs according to equation (4) for the reflections (102), (104), (0006), (110), (116) and (300) as a function of increasing the H2S concentration from about 0.03 vol % to about 1.25 vol %. The depositions were carried out at CO2 concentrations of about 3.25 vol % (Figure 3a) and CO2 6.25 vol % (Figure 3b), respectively. The coatings selected for this X-ray study were deposited at the following H2S concentrations: ~0.03, ~0.08, ~0.16, ~0.32, ~0.5, ~0.7, ~0.95 and ~1.25 vol %. Consequently, 8 layers were deposited at each CO2 level. The corresponding H2S/CO2 ratios were 0.004 < H2S/CO2 < 0.4. The deposition time for all the α-Al2O3 coatings was 480 min and the obtained coating thicknesses varied from about 6.5 µm to about 10 µm.
As shown in Figure 3a (CO2 = 3.25), the maximum values for TC(300), TC(102) and TC(104) appeared at about 0.08, 0.16 and 0.32 vol % H2S, respectively. At H2S levels exceeding ~0.6 vol %, a strong TC(0006) started to develop reaching TC(0006) > 6 at H2S levels from ~0.6 to ~1.1 vol %. The total absence of the (0006) reflection at H2S < 0.3 vol % should be noted. Further, it should be noted that very low TCs for (110) were detected in all experiments at CO2 = 3.25 as compared with the reference coating deposited at H2S = 0 exhibiting TC (110) ~4,5. The results also suggest that at the H2S concentrations exceeding ~0.9 vol %, the intensity of (0006) reflection started to decline with the re-appearance of TC(110). Figure 3b shows the development of TCs as a function of H2S concentrations at CO2 = 6.25 vol %. As compared with the results presented in Figure 3a, the differences are clear and surprisingly, a very high TC(110), was now detected at very low concentrations of H2S (H2S ~ 0.03 vol %). Furthermore, very strong TCs (> 5.5) for (100), (110) and (104) at H2S levels of about 0.08, 0.32 and 0.7 vol %, respectively, could be distinguished. At H2S concentrations exceeding ~1 vol % the TC(0006) started to dominate. The highest TC (0006) = 6.3 was obtained at H2S = 1.2 vol %. As compared with the results obtained at CO2 = 3.25 vol %, all TCs reached ~80% of TCmax and were clearly separated with respect to H2S concentration which was not the case at CO2 = 3.25 vol %.
Figure 4 is a summary of texture development (including the data presented in Figure 3a,b) where identified and verified textures (based on 2 repetitions) are plotted as a function of H2S/CO2 (0.004 < H2S/CO2 < 0.4). The CO2 concentrations used in the experiments were from about 3.25 vol % to about 6.50 vol %. As depicted on Figure 4, (110) texture could only be obtained when H2S/CO2 ≤ 0.01 (field a in Figure 4) and (100) texture existed when 0.01 < H2S/CO2 < 0.02 (field b in Figure 4). Thus, to facilitate deposition of (110) and (100) textures, very low H2S/CO2 ratios must be applied. Sufficiently low H2S/CO2 to deposit (110) texture could only be reached at higher CO2 levels used in these experiments.
The (110) and (100) reflections were absent at higher H2S/CO2 values and instead, TC(102) was found in the experiments when 0.02 ≤ H2S/CO2 < 0.1 (field c, Figure 4). When H2S/CO2 exceeded ~0.2 the (0001) texture dominated (field e, Figure 4). In between the (102) and (0001) windows, the results suggest the presence of (104) texture (field d, Figure 4). The process windows for (110), (100) and (104) textures appeared to be narrow as compared with the process windows for (102) and (0001) textures. As clear from Figure 4, the H2S/CO2 ratio is an important parameter, which can be used to control the texture of α-Al2O3.
It is emphasized that there are naturally no abrupt boarders separating the growth regimes (fields a, b, c, d and e) depicted in Figure 4. Further, the hypothetical process windows presented here can be affected by many other process parameters (which were not in scope of this study) e.g., total pressure, AlCl3/CO2 ratio, texture of the MTCVD Ti(C,N) layer as well as nucleation and bonding procedures, to name a few. In the experiments discussed above a thin (~3µm) layer of MTCVD Ti(C,N) without optimized texture was applied, which could have affected the alumina growth. In addition, the thin Ti(C,N) layer may have allowed diffusion of the substrate elements (Co, W) to the Ti(C,N)-Al2O3 interface disturbing the process [1,30]. However, the suggested process windows presented in Figure 4 are assumed to hold reasonably well for CO2 values higher than ~3 vol %. In the first commercial α-Al2O3 coatings, the most commonly found texture was (102) [22].
Figure 5a–e shows X-ray diffractograms of the coatings a, b, c, d, and e deposited at H2S = 0.03 vol % (CO2 = 6.25 vol %), H2S = 0.08 vol % (CO2 = 6.25 vol %), H2S = 0.2 vol % (CO2 = 3.25 vol %), H2S = 0.7 vol % (CO2 = 6.25 vol %) and at H2S = 0.7 vol % (CO2 = 3.25 vol %), respectively. Consequently, coatings a, b, c, d and e were deposited at H2S/CO2 ratios of the order of 0,005, 0.013, 0.06, 0.1 and 0.2, respectively. As clear from the X-ray diffractograms in Figure 5a–e, very profound textures could be obtained in all studied coatings. It should further be noted that the coatings which exhibited strong (104) and (0006) textures (Figure 5d,e, respectively) were both deposited using the same H2S concentration of about 0.7, vol %, but at different CO2 concentrations of 6.25 vol % (Figure 5d) and 3.25 vol % (Figure 5e) respectively. The H2S/CO2 ratios used to deposit Coatings d and e were consequently of the order of 0.1 and 0.2, respectively.
3.2.2. Microstructure
Figure 6A–E shows SEM cross-sections and surface morphologies of Coatings a, b, c, d and e deposited, as mentioned above, at H2S/CO2 ratios of the order of 0,005, 0.013, 0.06, 0.1 and 0.2, respectively (see Figure 5a–e). The growth rates for (110) textured α-Al2O3 (Coating a), (100) textured α-Al2O3 (Coating b), (102) textured α-Al2O3 (Coating c), (104) textured α-Al2O3 (Coating d) and (0001) textured α-Al2O3(Coating e) were 1.3, 1.1, 0.8, 0.8. and 1.1 µm/h, respectively (see Figure 6A–E). It is plausible that the identified textures may exhibit different growth rates related to this specific orientation. However, since the same texture can be deposited with very different process data within the specific H2S/CO2 regime, according to this work, it is not possible to define the typical growth rates for different preferred growth directions (textures) based on the present experiments. It should further be noticed that (110) and (100) textured layers showed higher or equal growth rates as compared with the (102), (104), and (0006) textured α-Al2O3 layers deposited at higher H2S concentrations but lower CO2 levels. It must be emphasized that the growth rates obtained in the first part of this work (presented in Figure 2) are not comparable with those obtained for strongly textured coatings.
All the α-Al2O3 layers were composed of columnar grains. The (102) textured coating was composed of slightly smaller and more uniform columnar grains terminated by sharp pyramidal-shaped grains (Coating c, Figure 6) as compared with the other textured layers. A clear tendency for widening of the columnar grains perpendicular to the growth direction and the formation of grains with flat surfaces instead of sharp, faceted grains was observed when deposition was carried at H2S/CO2 < 0.02. Consequently, (110) and (100) textured α-Al2O3 layers exhibited larger grain sizes as compared with the other textured α-Al2O3 layers.
The Σ3 CLS GB fractions and TCs for the (110), (100), (102) and (0006) α-Al2O3 coatings deposited at CO2 = 6.25 vol % are given in Table 6. The (0001) textured α-Al2O3 exhibited high Σ3 CLS GB fractions of about 50% compared with low values (5–12%) for the other textured coatings. Similar results have been published previously [35,36,37]. Volanthen and Grobety [38] measured Σ3 CLS GB fractions of about 15–16% for slightly textured sintered alumina and about 3% for non-textured sintered alumina. As concluded in [38], the high fraction of Σ3 CLS GBs in the (0001) textured α-Al2O3 is a result of crystallographic control and generally depends on the orientation of the CSL misorientation axis with respect to the [0001] axis. This is assumed to explain the high Σ3 CLS GB fractions also in the studied CVD (0001) textured α-Al2O3 layers.
3.2.3. Texture-Manipulated Structures
The results presented below were obtained by depositing α-Al2O3 as described in Section 2.2.3 and Table 3 and Table 4. The aim of the experiments was to deposit (0001) textured α-Al2O3 coatings first on thicker and textured MTCVD Ti(C,N) layers using state-of-the-art nucleation and bonding layers (Coating f) and then investigate the effects of changing the fibre axis (growth direction) during deposition by 90° degrees (Coatings g and h). It should be noted that directions <0001> and <110> as well as <0001> and <100> are perpendicular to each other. In this experiment the (0001)–(110) system was used. These types of process modifications could open interesting possibilities to manipulate the grain size and grain boundary structures of α-Al2O3 coatings.
A cross-section SEM micrograph and an EBSD IPF surface map of Coating f are shown in Figure 7a,b. The corresponding X-ray diffractogram is shown in Figure 7c. The interfacial part of the α-Al2O3 layer was composed of a fine-grained region, as can clearly be seen in Figure 7a. This region was deposited at H2S = 0 for 30 min and obviously grew having <110> as preferred growth direction (see Section 3.2.1). The addition of H2S to the process after 30 min changed abruptly the growth direction from <110> to <0001>. Hardly any region of evolutionary selection, i.e., competing growth of differently oriented crystals can be seen and the fiber axis had adopted the [0001] direction almost immediately. As shown in Figure 7a, the α-Al2O3 layer above the fine-grained region was composed of columnar crystals growing along [0001].
As clear from the EBSD IPF surface map (Figure 7b) and from the X-ray diffractogram (Figure 7c), the α-Al2O3 layer exhibits a pronounced (0001) texture (TC(0006) = 5.8). In the diffractogram shown in Figure 7c, the (0006) reflection and its second order reflection (000.12) at (2θ) angles of 41.71° and 90.74°, respectively, can be seen (JCPDF Card 14-4268). In addition, a TiN(422) reflection, which originates from the textured Ti(C,N) is present. Consequently, in this case, also the MTCVD Ti(C,N) layer is textured. This experiment demonstrates the importance of the MTCVD Ti(C,N) layer, together with optimized bonding and nucleation processes to fully utilize the texture control. A high density of Σ3 CLS GBs of the order 52% was detected in this α-Al2O3 layer.
Figure 8 shows a cross-section SEM micrograph and EBSD IPF surface map of Coating g deposited using the H2S/CO2 ratios 0.40 and <0.01 applied in sequences (see Section 2.2.3). The resulting coating was composed of 14 sub-layers: 7 layers deposited with (0001) conditions and 7 layers deposited with (110) conditions. The deposition time for the first (0001) sequence was 45 min and 30 min for the following sequences. H2S was added in the process after 5 min delay and consequently, the fine-grained α-Al2O3 at the α-Al2O3-Ti(C,N) interface, which can clearly be distinguished in Coatings f and h (Figure 7a and Figure 9a, respectively) is almost totally absent here.
This coating exhibited a—slightly unpredicted—strong (0001) texture TC(0006) = 5.78 having been determined by the first step, which, in this case, was (0001). The grains started to grow along the [0001] direction, which was also maintained during the subsequent steps deposited with (120) process conditions. During the sequences using (120) process conditions, the growth rate perpendicular to the growth direction [0001] was increased. During the next step using (0001) process conditions, the opposite effect occurred. Consequently, the variations of the growth rate perpendicular to the main grain growth direction of [0001] resulted in the formation of a “zigzag” grain boundaries, as clearly seen in Figure 8a. The wavelength of the “zigzag“ grain boundary remained constant, suggesting that the growth rate along the [0001] direction did not change markedly, even though a different process parameter were applied. The “zigzag” feature can also be obtained by applying the process conditions for (102) and (100) in combination with (0001) process conditions in sequence [39]. It remains to be seen if one can enhance the wear properties of α-Al2O3 layers by applying these types of processes.
In Coating h (Table 4), the α-Al2O3 coating was deposited at H2S/CO2 = 0.4 (after a period of 30 min at H2S = 0) to a thickness of about 7 µm and only after this period, the process conditions were switched over to H2S/CO2 < 0.01. These conditions were applied for one hour. From Figure 9a an abrupt change in the growth direction can be seen. Obviously, this effect can be preferably obtained in α-Al2O3 layers with the established preferred growth along the [0001] direction. This is due to availability of several sets of {110} growth facets parallel to the [0001] direction. Figure 9b shows the surface morphology of Coating h. The α-Al2O3 surface was dominated by (0001) facets, as confirmed by EBSD. As a result, the surface roughness was reduced considerably. This type of process could be used to increase surface quality of the coated cutting tool inserts and has already been applied in some commercial products [40].
3.2.4. Discussion
Only a few studies can be found in the literature on the influence of doping on texture development in CVD α-Al2O3 coatings. A strong (100) texture was observed to develop in α-Al2O3 as a result of ZrCl4 doping [41] and a strong (110) texture as a result of TiCl4 doping [42]. In the case of ZrCl4 doping, it was speculated that Zr-species were adsorbed on the growing α-Al2O3 surfaces blocking the growth the sites, which could lead in the formation of other growth textures, such as (102) and (104). The texture development observed in the present experiments will also be explained below by selective CVD growth on certain alumina facets or sets of alumina facets [43,44].
There has been much interest in understanding the behavior of alumina surfaces [45,46,47,48,49]. Using first-principles density functional theory, Hinneman et al. [45] found that the sulphur atom preferentially adsorbs to an oxygen. The effects of the environment on the Gibbs free energy of α-Al2O3 (0001) surfaces were studied in [46] and surface terminations as a function of oxygen partial pressure were discussed. The (0001), (102), (113), (110), (100) α-Al2O3 surfaces have been studied by Marmier and Parker [47], applying the ab initio method combined with thermodynamics. The authors found that at ambient conditions, only two types of surfaces—stoichiometric or fully hydroxylated—are thermodynamically stable, except at extremes of oxygen or hydrogen partial pressures. A recent ab-initio study of the α-Al2O3 (104) surface [48] discusses the possible surface terminations of and emphasizes the effect of temperature and O2-partial pressure. It has also been reported that H2O adsorbs much more rapidly on the α-Al2O3 (102) surface than on the α-Al2O3 (0001) surface [49]. However, in CVD, several Cl-containing species are present in the gas phase and this type of conditions have not been considered in the above-mentioned studies. A recent study [16] using thermodynamic modelling and density functional theory (DFT) discusses the behavior of H2S on (0001) alumina surfaces under more realistic CVD conditions. The oxygen terminated surface was found to be hydrogenated, in agreement with several previous studies and Al-terminated surfaces were found to be Cl-terminated. In accordance with the model of Slager and Amber [28], the authors suggest the following scenario to take place on the Cl-terminated (0001) surface:
H2S + Al2O3:Cl → Al2O3:SH + HCl
H2O + Al2O3:SH → Al2O3:OH + H2S
The proposed construction nicely describes the recycling of H2S on a Cl-terminated α-Al2O3 (0001) surface and explains why very small amounts of H2S (usually much less than 0.5 vol % of the total flow), are needed to achieve and maintain the high growth rate.
As clear from the above-cited literature and references therein, different α-Al2O3 crystal facets (surfaces) display very different reactivities for molecular (or dissociative) adsorption, adsorbate stability and desorption, depending on crystallography and termination of an individual facet. Obviously, there may exist several types of competing adsorption/desorption modes that are favored by certain α-Al2O3 surfaces and/or terminations. It is speculated that certain crystal facets together with related catalyzed reactions could be stabilized by H2S and especially by H2S/CO2. H2S acts on these facets as a mediator for the hydrolysis of Al-containing species. The understanding of the surface reactions is further complicated by the fact that the CVD environment most probably also affects the homogenous decomposition of AlClx and the resulting intermediate Al-species and their surface reactions on α-Al2O3 [13,14,15].
It is hypothesized that texture development in α-Al2O3 coatings could be a result of catalyzed reactions and growth occurring preferentially on specific growth facets of Al2O3 being determined by H2S partial pressure and the H2S/CO2 ratio. This hypothesis, however, requires that there exist specific equilibrium conditions for each set of growth facets, which is not contradicted by the present results. The fact that the growth direction could be rotated by 90° by altering the process condition supports the above discussed mechanisms. Deposition without H2S and with very low amount of H2S (especially together with relatively high amount of CO2) resulted in the (110) texture. This texture could be a result of same surface reactions on the same set of facets that occurred also in the absence H2S. With the increment of H2S, the surface reactions on these planes were retarded or blocked and growth shifted to next set of growth facets. Since we can see the effect of increased H2S on all textures at all levels of CO2, the limiting step could be desorption reactions related to the removal of sulfur adatoms or sulfur-containing species. This assumption is supported by fact that S is not found in CVD Al2O3 [10] and H2S does not dissolve in α-Al2O3 [29]. Furthermore, it is noted that the limiting steps as well as the surface reactions do not necessarily need to be same on all sets of facets. It should also be noted that it is not clearly established on which crystallographic surfaces (facets) the growth of different α-Al2O3 textures occurs.
This work shows that as a result of the H2S increment at constant CO2 concentrations, the texture of α-Al2O3 changed from (110) texture, which was obtained at very low H2S concentrations, through (100), (102) and (104) textures to (0001) texture, which was obtained at ~ 0.6 vol % H2S (at CO2 = 3.25 vol %) and ~ 1 vol % H2S (at CO2 = 6.25 vol %). Consequently, the process windows for the observed textures should preferably be expressed as a function of the H2S/CO2 ratio. The use of texture control to modify coating microstructures was demonstrated and validated. This type of processes could be used to further improve α-Al2O3 coatings. As demonstrated in Figure 2, the growth rate of α-Al2O3 can be increased considerably by applying high CO2 and H2S partial pressures. Application of high CO2 and H2S partial pressures, together with texture control (H2S/CO2 ratio) introduced in this work opens possibilities to deposit e.g., (0001) textured α-Al2O3 coatings at high growth rates. The importance of intermediate layers including bonding and oxidation steps for the texture development was emphasized.
4. Conclusions
This paper studied the influence H2S and CO2 on texture and microstructure of CVD α-Al2O3 deposited from the AlCl3-H2-CO2-HCl-H2S system. The main emphasis was on the texture development in CVD α-Al2O3. The following conclusions could be drawn:
- The experiments confirmed that the growth rate of α-Al2O3 could be increased considerably by applying high CO2 and H2S partial pressures.
- When deposited uncatalyzed (H2S = 0) and using very low H2S concentrations the resulting α-Al2O3 layer exhibited (110) texture.
- As a result of the increment of H2S at constant CO2 concentration the texture of α-Al2O3 changed from (110), which was obtained at very low H2S concentrations, through (100), (102) and (104) textures to (0001) texture. Consequently, the fiber axis of α-Al2O3 was rotated by 90° as a result of H2S increment.
- The H2S/CO2 ratio was identified as an important parameter to control the texture of α-Al2O3. Growth regimes for (110), (100), (102), (104) and (0001) textures were depicted as a function of the H2S/CO2 ratio. With the increment of H2S/CO2 ratio the texture of α-Al2O3 changed from (110), which was obtained at H2S/CO2 < 0.01 through the (100), (102) and (104) textures to the (0001) texture, which was obtained at the H2S/CO2 ratios exceeding ~0.2.
- Even though this work has focused on the effect of H2S concentration at constant CO2 levels, it should be noted that based on the present results is straightforward to conclude that the H2S/CO2 ratio can also be varied by varying the CO2 concentration at a constant H2S level.
- This work also unveiled new possibilities to manipulate the surface and grain boundary structures of the CVD α-Al2O3 coating by utilizing the texture-control.
- The work demonstrated that the properties of the MTCVD Ti(C,N) layer and especially the bonding, nucleation and oxidation procedures are of crucial importance for full utilization of the process windows according to this work.
5. Suggestions for the Further Work
The results of this work give rise to several fundamental questions concerning texture development and the basic mechanisms of H2S catalysis. A TEM study together with 3D-EBSD of the textured coatings as well as of the faceted grain boundaries shown in Figure 8 could give valuable information. Since α-Al2O3 single crystals are commercially available, it would also be advisable to study adsorption-desorption mechanisms of H2S on, e.g., [102], [110] and [0001] oriented single crystals and combine these studies with practical CVD deposition experiments. Deposition of α-Al2O3 using different H2S/CO2 ratios on the crystallographically controlled α-Al2O3 single crystal surfaces would contribute to enhanced understanding of this complex phenomena. Further, it would be of interest to study the influence of H2S on the growth and texture development in CVD κ-Al2O3.
Funding
This research received no external funding.
Conflicts of Interest
The author declares no conflict of interest.
References
- Lux, B.; Colombier, C.; Altena, H.; Stjernberg, K. Preparation of alumina coatings by chemical vapour deposition. Thin Solid Films 1986, 138, 49–64. [Google Scholar] [CrossRef]
- Kramer, B.M.; Suh, N.P. Tool wear by solution: A quantitative understanding. J. Eng. Ind. 1980, 102, 303–309. [Google Scholar] [CrossRef]
- Kramer, B.M.; Judd, P.K. Computational design of wear coatings. J. Vac. Sci. Technol. A 1985, 3, 2439–2444. [Google Scholar] [CrossRef]
- Ruppi, S. Advances in chemically vapour deposited wear resistant coatings. J. Phys. IV 2001, 11, Pr3-847–Pr3-859. [Google Scholar] [CrossRef]
- Lindström, J.; Schachner, H. Non-equilibrium conditions for CVD of alumina. In Proceedings of the 3rd European Conference on CVD, Neuchatel, Switzerland, 16–18 April 1980; Hinterman, H.E., Ed.; LSRH: Neuchatel, Switzerland, 1980; pp. 208–217. [Google Scholar]
- Lindström, J.; Stjernberg, K. Rate determining steps at CVD of Al2O3, TiC and TiN. In Proceedings of the 5th European Conference on CVD, Uppsala, Sweden, 17–20 June 1985; Carlsson, J.-O., Lindström, J.J., Eds.; Uppsala University: Uppsala, Sweden, 1985; pp. 169–182. [Google Scholar]
- Kim, J.G.; Park, C.S.; Chun, J.S. Effect of partial pressure of the reactant gas on the chemical vapour deposition of Al2O3. Thin Solid Films 1982, 97, 97–106. [Google Scholar] [CrossRef]
- Lhermitte-Sebire, I.; Colmet, R.; Naslain, R.; Bernard, C. The Chemical Vapour Deposition of alumina from AlCl3-H2-CO2 on Stoichiometric TiC substarte: A thermodynamic approach. J. Less Common Met. 1968, 118, 83–102. [Google Scholar] [CrossRef]
- Colmet, R.; Naslain, R. Chemical vapour deposition of alumina on cutting tool inserts from AlCl3-H2-CO2 mixtures: Influence of the chemical vapour deposition parameters and the nature of the inserts on the morphology and wear resistance of the coatings. Wear 1982, 80, 221–231. [Google Scholar] [CrossRef]
- Ruppi, S.; Larsson, A. Chemical vapour deposition of κ-Al2O3. Thin Solid Films 2001, 388, 50–61. [Google Scholar] [CrossRef]
- Fredriksson, E.; Carlsson, J.-O. Chemical vapour deposition of Al2O3 on TiO. Thin Solid Films 1995, 263, 28–36. [Google Scholar] [CrossRef]
- Park, C.S.; Kim, J.G.; Chun, J.S. Crystallographic Orientation and Surface Morphology of Chemical Vapor Deposited Al2O3. J. Electrochem. Soc. 1983, 130, 1607–1611. [Google Scholar] [CrossRef]
- Catoire, L.; Swihart, M.T. High-temperature kinetics of AlCl3 decomposition in the presence of additives for chemical vapor deposition. J. Electrochem. Soc. 2002, 149, C261–C267. [Google Scholar] [CrossRef]
- Swihart, M.T.; Catoire, L. Reactions in the Al-H-Cl system by ab initio molecular orbital and density functional methods. J. Phys. Chem. A 2001, 105, 264–273. [Google Scholar] [CrossRef] [Green Version]
- Tan, P.; Müller, J. Gas-phase kinetic modelling of the AlCl3 decomposition in the AlCl3-CO2 H2-HCl system for a hot-wall CVD reactor, D. Neuschütz. J. Electrochem. Soc. 2005, 152, C288–C293. [Google Scholar] [CrossRef]
- Blomqvist, A.; Arhammar, C.; Pedersen, H.; Silvearv, F.; Norgren, S.; Ahuja, R. Understanding the catalytic effects of H2S on CVD-growth of α-alumina: Thermodynamic gas-phase simulations and density functional theory. Surf. Coat. Technol. 2011, 206, 1771–1779. [Google Scholar] [CrossRef]
- Smith, U.K.; Lindstrom, J.N. Method of Making a Coated Cemented Carbide Body and Resulting Body. U.S. Patent 4,619,866 A, 2 April 1985. [Google Scholar]
- Vuorinen, S.; Karlsson, L. Phase transformation in chemically vapour deposited, κ-Al2O3. Thin Solid Films 1992, 214, 132–143. [Google Scholar] [CrossRef]
- Vuorinen, S.; Skogsmo, J. Characterization of α-Al2O3, κ-Al2O3 and α-κ multioxide coatings on cemented carbides. Thin Solid Films 1990, 536, 193–194. [Google Scholar] [CrossRef]
- Ruppi, S. Deposition, Microstructure and properties of texture-controlled CVD α-Al2O3 coatings. Int. J. Refract. Met. Hard Mater. 2005, 23, 306–316. [Google Scholar] [CrossRef]
- Ruppi, S. Enhanced performance of α-Al2O3 coatings by control of crystal orientation. Surf. Coat. Technol. 2008, 202, 4257–4269. [Google Scholar] [CrossRef]
- Ruppi, S. Enhanced Alpha Alumina Layer Produced by CVD. U.S. Patent 7,396,581 B2, 8 July 2008. [Google Scholar]
- Ruppi, S. Alumina Layer with Enhanced Texture. U.S. Patent 7,993,742 B2, 9 August 2011. [Google Scholar]
- Ruppi, S. Texture Hardened Alpha-Alumina Coated Tool. U.S. Patent 7,923,101 B2, 12 April 2011. [Google Scholar]
- Stylianou, R.; Tkadletz, M.; Schalk, N.; Penoy, M.; Czettl, C.; Mitterer, C. Effects of reference materials on texture coefficients determined for a CVD α-Al2O3coating. Surf. Coat. Technol. 2019, 359, 314–322. [Google Scholar] [CrossRef]
- Oshika, T.; Nishiyama, A.; Nakaso, K.; Shimada, M.; Okuyama, K. Unveiling the magic of H2S on CVD-Al2O3 coating. J. Phys. IV 1999, 9, 877–883. [Google Scholar] [CrossRef]
- Oshika, T.; Sato, M.; Nishiyama, A. Unveiling the magic of H2S on the CVD-Al2O3coating. Effect of H2S on the water gas concentration. J. Phys. IV 2002, 12, 113–120. [Google Scholar] [CrossRef]
- Slager, T.; Amberg, C. Infrared investigation of H2S adsorption and decomposition on alumina and alumina supported molybdenum sulfide. Can. J. Chem. 1972, 50, 3416–3423. [Google Scholar] [CrossRef]
- Arhammar, C.; Silvearv, F.; Bergman, A.; Norgren, S.; Pedersen, H.; Ahuja, R. A theoretical study of possible point defects incorporated into α-alumina deposited by chemical vapor deposition. Theor. Chem. Acc. 2014, 133, 1–11. [Google Scholar] [CrossRef] [Green Version]
- Shoja, S.; Mortazavi, N.; Lindahl, E.; Norgren, S.; Bäcke, O.; Halvarsson, M. Microstructural investigation of textured CVD alumina coatings. Int. J. Refract. Met. Hard Mater. 2020, 87, 105125. [Google Scholar] [CrossRef]
- Harris, G.B. Quantitative measurement of preferred orientation in rolled uranium bars. Data Commun. Natl. Phys. Lab. 1952, 43, 113–123. [Google Scholar] [CrossRef]
- Grimmer, H. Coincidence orientations of grains in rhombohedral materials. Acta Crytallogr. A 1989, 45, 505–523. [Google Scholar] [CrossRef]
- Brandon, D.G. Structure of high-angle grain boundaries. Acta Metall. 1966, 14, 1479–1484. [Google Scholar] [CrossRef]
- Engler, O.; Randle, V. Introduction to Texture Analysis: Macrotexture, Microtexture and Orientation Mapping, 2nd ed.; CRC Press: Boca Raton, FL, USA, 2010. [Google Scholar]
- Hishahi, H.; Osada, A.; Nakamura, E.; Takuya, H. Surface-Coated Cermet Cutting Tool with Hard Coating Layer Exhibiting Excellent Chipping Resistance in High-Speed Intermittent Cutting. U.S. Patent 7,442,433 B2, 28 October 2008. [Google Scholar]
- Stiens, D.; Ruppi, S. Grain Boundary Engineered Alpha-Alumina Coated Cutting Tool. U.S. Patent 9,206,510 B2, 8 December 2015. [Google Scholar]
- Ruppi, S.; Stiens, D.; Manns, T. Grain Boundary Engineered α-Al2O3 Coatings. ICMCTF, San Diego, CA. 2014. Available online: http://www.researchgate.net/publication/274192418 (accessed on 7 February 2020).
- Vonlanthen, P.; Grobety, B. CSL grain boundary distribution in alumina and zirconia ceramics. Ceram. Int. 2008, 34, 1459–1472. [Google Scholar] [CrossRef] [Green Version]
- Stiens, D.; Ruppi, S. Alumina Coated Cutting Tool with Zigzag Alumina Grain Boundaries. European Patent 2,902,528 B1, 29 June 2016. [Google Scholar]
- Ruppi, S.; Engström, H.; Lauridsen, J.; Alm, O.; Matsson, P.; Larsson, T.; Lindahl, E.; Engqvist, J.; Stiens, D. Alumina Coated Cutting Tool. WO Patent 2,015,114,049 A1, 6 August 2015. [Google Scholar]
- Mårtensson, P. Influence of the concentration of ZrCl4 on texture, morphology and growth rate of CVD grown α-Al2O3 coatings deposited by the AlCl3/ZrCl4/H2/CO2/H2S process. Surf. Coat. Technol. 2006, 200, 3626. [Google Scholar] [CrossRef]
- Kathrein, M.; Schintlmeister, W.; Wallgram, W.; Schleinkofer, U. Doped CVD Al2O3 coating for high performance cutting tools. Surf. Coat. Technol. 2003, 163, 181–188. [Google Scholar] [CrossRef]
- Kronberg, M.L. Plastic deformation of single crystals of sapphire: Basal slip and twinning. Acta Met. 1957, 5, 507–524. [Google Scholar] [CrossRef]
- Hartman, P. The attachment energy as a habit controlling factor III. Application to corundum. J. Cryst. Growth 1980, 29, 166–170. [Google Scholar] [CrossRef]
- Hinneman, B.; Carter, E. Adsorption of Al, O, Hf, Y, Pt, and S atoms on α-Al2O3 (0001). Phys. Chem. C 2007, 111, 7105–7126. [Google Scholar] [CrossRef]
- Wang, X.-G.; Chaga, A.; Scheffler, M. Effect of the environment on (0001) α-Al2O3 surface structures. Phys. Rev. Lett. 2000, 16, 3650–3653. [Google Scholar]
- Marmier, A.; Parker, S.C. Ab initio morphology and surface thermodynamics of α-Al2O3. Phys. Rev. B 2004, 69, 115409. [Google Scholar] [CrossRef]
- Liu, Y.; Ning, X.-S. Termination stability and electronic structures of α-Al2O3 (0114) surface: An ab initio study. Appl. Surf. Sci. 2014, 303, 210–216. [Google Scholar] [CrossRef]
- Ranea, V.A.; Schneider, W.F.; Carmichael, I. DFT characterization of coverage dependent molecular water adsorption modes on α-Al2O3 (0001). Surf. Sci. 2008, 602, 268–275. [Google Scholar] [CrossRef]
Figure 1.
Cross-section SEM micrographs of α-Al2O3 multilayer coatings. (a) Back-scatter SEM image of the coating deposited at CO2 = 4 vol %, (b) Bright-field SEM image of the coating deposited at CO2 = 6 vol % and (c) Cross-section EBSD IPF map of the coating deposited at CO2 = 6 vol %.
Figure 1.
Cross-section SEM micrographs of α-Al2O3 multilayer coatings. (a) Back-scatter SEM image of the coating deposited at CO2 = 4 vol %, (b) Bright-field SEM image of the coating deposited at CO2 = 6 vol % and (c) Cross-section EBSD IPF map of the coating deposited at CO2 = 6 vol %.

Figure 2.
Growth rates of α-Al2O3 coatings as a function of H2S at CO2 = 3, 4 and 6 vol %.
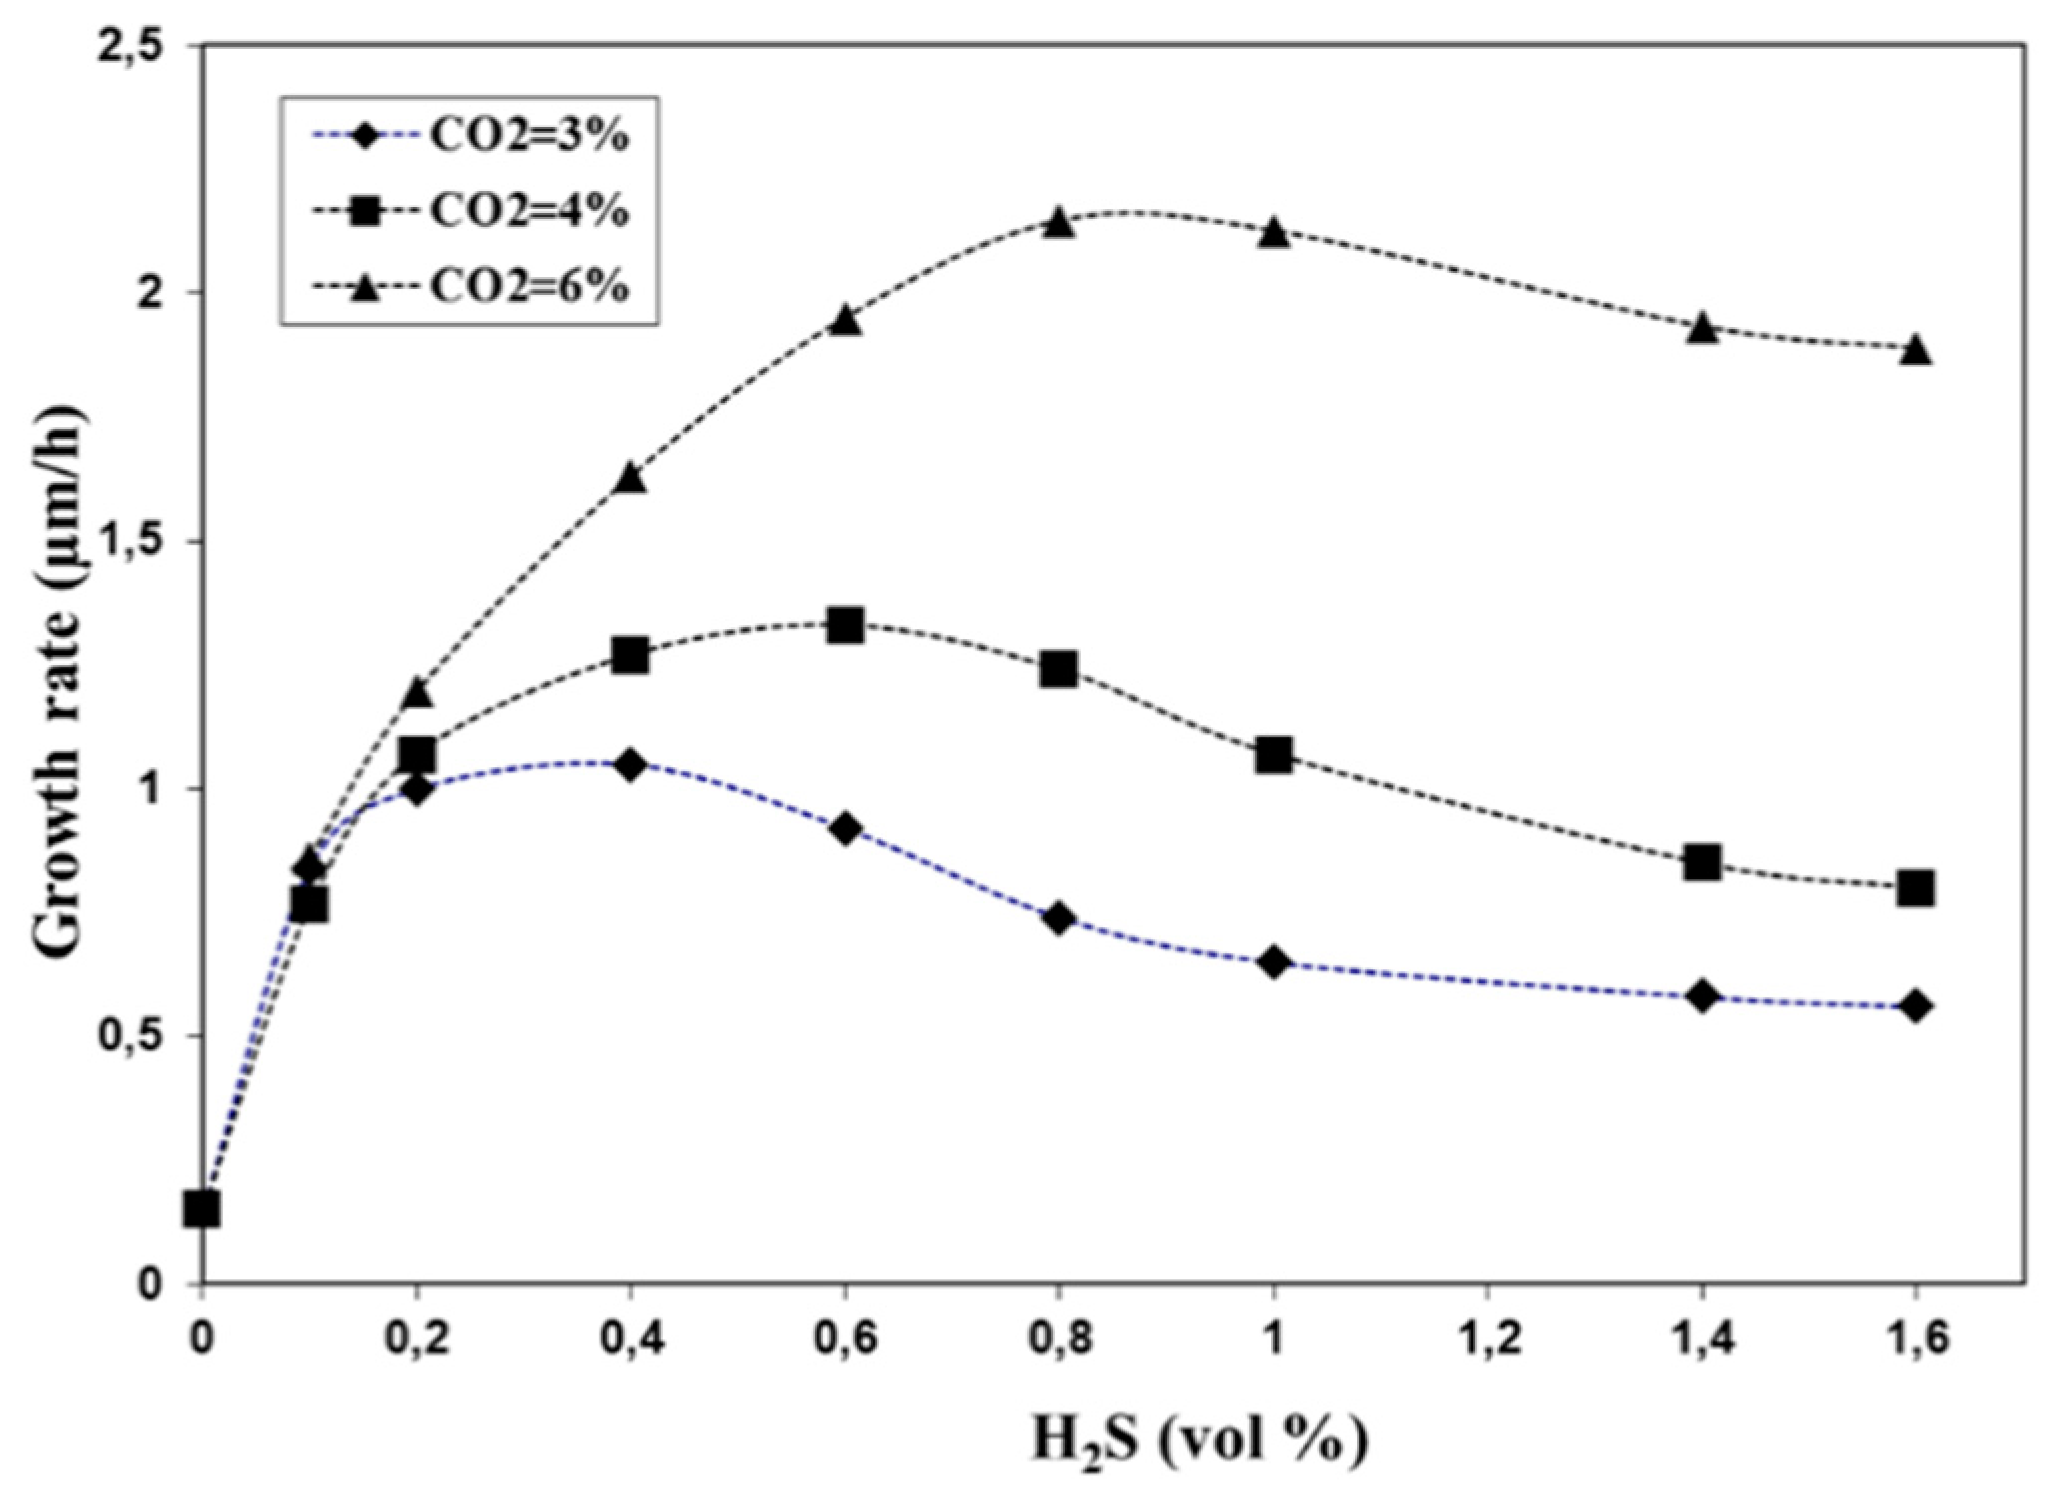
Figure 3.
Development of TCs for (102), (110), (104), (0006), (113), (116) and (300) in CVD α-Al2O3 layer as a function of H2S concentration, (a) CO2 = 3.25 vol % (b) CO2 = 6.25 vol %.
Figure 3.
Development of TCs for (102), (110), (104), (0006), (113), (116) and (300) in CVD α-Al2O3 layer as a function of H2S concentration, (a) CO2 = 3.25 vol % (b) CO2 = 6.25 vol %.

Figure 4.
XRD results α-Al2O3 showing the obtained textures plotted as a function of H2S/CO2 ratio and CO2 concentration (3.25 < CO2 < 6.25). Process windows for (110), (100), (110), (104) and (0006) textures, referred to as a, b, c, d and e, respectively, are depicted.
Figure 4.
XRD results α-Al2O3 showing the obtained textures plotted as a function of H2S/CO2 ratio and CO2 concentration (3.25 < CO2 < 6.25). Process windows for (110), (100), (110), (104) and (0006) textures, referred to as a, b, c, d and e, respectively, are depicted.

Figure 5.
X-ray diffragtograms of coatings a, b, c, d and e. Coating (a) H2S = 0.03 vol % and CO2 = 6.25 vol %. Coating (b) H2S = 0.08 vol % and CO2 = 6.25 vol %. Coating (c) H2S = 0.2 vol % and CO2 = 3.25 vol %. Coating (d) H2S = 0.7 vol % and CO2 = 6,25 vol %. Coating (e) H2S = 0.7 vol % and CO2 = 3.25 vol %.

Figure 6.
SEM cross sections (on the left) and surface images (on the right) of coatings deposited at H2S/CO2 ratios of the order of (A) 0.005, (B) 0.013, (C) 0.06, (D) 0.1 and (E) 0.2, respectively.
Figure 6.
SEM cross sections (on the left) and surface images (on the right) of coatings deposited at H2S/CO2 ratios of the order of (A) 0.005, (B) 0.013, (C) 0.06, (D) 0.1 and (E) 0.2, respectively.

Figure 7.
(a) Cross section SEM image α-Al2O3 coating (Coating f) deposited at H2S/CO2 = 0.4 onto (211)-textured MTCVD coating with optimized bonding and nucleation procedures. The uncatalyzed (H2S=0) time was 30 min, resulting in the formation of fine grained α-Al2O3 at the interface (arrowed). (b) EBSD IPF surface map. (c) X-ray diffractogram.


Figure 8.
(a) Cross-section SEM micrograph of α-Al2O3 coating (Coating g) deposited by alternating the (0001) and (120) process conditions. The formation of zigzag grain boundaries in the coating can clearly be seen. Some (0001)-(110) coating sequences are indicated on the micrograph. (b) EBSD IPF surface map of the α-Al2O3 coating.

Figure 9.
(a) Cross-section SEM micrograph of α-Al2O3 coating (Coating h) deposited at H2S/CO2 = 0.4 for 420 min and at H2S/CO2 < 0.01 for 60 min. An abrupt change in the growth direction (arrowed) occurred. (b) Surface morphology showing the coating surface being terminated by flat surfaces.
Figure 9.
(a) Cross-section SEM micrograph of α-Al2O3 coating (Coating h) deposited at H2S/CO2 = 0.4 for 420 min and at H2S/CO2 < 0.01 for 60 min. An abrupt change in the growth direction (arrowed) occurred. (b) Surface morphology showing the coating surface being terminated by flat surfaces.


Table 1.
Deposition parameters for multilayer experiments.
| H2S (vol %) | CO2 (vol %) | AlCl3 (vol %) | HCl (vol %) | H2 (vol %) | P (mbar) |
|---|---|---|---|---|---|
| 0.1–1.6 | 3 | 2.5 | 1 | Balance | 75 |
| 0.1–1.6 | 4 | 2.5 | 1 | Balance | 75 |
| 0.1–1.6 | 6 | 2.5 | 1 | Balance | 75 |
Table 2.
Deposition parameters for texture experiments.
| Texture Experiments | Reference Coating | |
|---|---|---|
| H2S (vol %) | 0.02–1.6 | 0 |
| CO2 (vol %) | 3.0–6.5 | 3.25 |
| H2S/CO2 ratio | 0.004-0.40 | 0 |
| AlCl3 (vol %) | 2.5 | 2.5 |
| HCl (vol %) | 1.0 | 1.0 |
| H2 (vol %) | Balance | Balance |
| P (mbar) | 75 | 75 |
| Time (min) | 480 | 1200 |
Table 3.
Deposition conditions for Coating f.
| Coating A | |
|---|---|
| H2S/CO2 ratio | 0.40 |
| AlCl3 (vol %) | 2.65 |
| HCl (vol %) | 1.1 |
| H2 (vol %) | Balance |
| P (mbar) | 75 |
| Time (min) | 480 |
Table 4.
Deposition conditions for Coating h.
| First Part | Second Part | |
|---|---|---|
| H2S/CO2 ratio | 0.40 | <0.01 |
| AlCl3 (vol %) | 2.65 | 2.65 |
| HCl (vol %) | 1.5 | 1.5 |
| H2 (vol %) | Balance | Balance |
| P (mbar) | 85 | 55 |
| Time (min) | 420 | 60 |
Table 5.
Texture coefficients for α-Al2O3 coating deposited at H2S = 0.
| (hkil) | TC |
|---|---|
| (102) | 0.67 |
| (104) | 0.65 |
| (110) | 4.50 |
| (0006) | 0 |
| (113) | 0.50 |
| (116) | 0.59 |
| (300) | 0.09 |
Table 6.
Fraction of Σ3 CSL GBs in textured α-Al2O3 coatings.
| Texture (hkil) | TC (hkil) | Fraction of Σ3 CSL GBs (%) |
|---|---|---|
| (110) | 5.9 | ~5 |
| (100) | 6.5 | ~5 |
| (102) | 5.9 | ~12 |
| (0001) | 6.2 | ~50 |
© 2020 by the author. Licensee MDPI, Basel, Switzerland. This article is an open access article distributed under the terms and conditions of the Creative Commons Attribution (CC BY) license (http://creativecommons.org/licenses/by/4.0/).
Share and Cite
MDPI and ACS Style
Ruppi, S. Influence of Process Conditions on the Growth and Texture of CVD Alpha-Alumina. Coatings 2020, 10, 158. https://doi.org/10.3390/coatings10020158
AMA Style
Ruppi S. Influence of Process Conditions on the Growth and Texture of CVD Alpha-Alumina. Coatings. 2020; 10(2):158. https://doi.org/10.3390/coatings10020158
Chicago/Turabian StyleRuppi, S. 2020. "Influence of Process Conditions on the Growth and Texture of CVD Alpha-Alumina" Coatings 10, no. 2: 158. https://doi.org/10.3390/coatings10020158
Note that from the first issue of 2016, this journal uses article numbers instead of page numbers. See further details here.