Article

Artificial Superhydrophobic and Antifungal Surface on Goose Down by Cold Plasma Treatment

1
Department of Molecular Engineering, Faculty of Process and Environmental Engineering, Lodz University of Technology, Wolczanska Str. 213, 90-924 Lodz, Poland
2
Research and Innovation Centre Pro-Akademia, Innowacyjna Str. 9/11, 95-050 Konstantynów Łódzki, Poland
3
Department of Biology and Parasitology, Medical University of Lodz, Zeligowski Str. 7/9, 90-752 Lodz, Poland
*
Author to whom correspondence should be addressed.
Coatings 2020, 10(9), 904; https://doi.org/10.3390/coatings10090904
Submission received: 14 August 2020 / Revised: 14 September 2020 / Accepted: 17 September 2020 / Published: 20 September 2020
(This article belongs to the Special Issue Water and Oil Repellent Surfaces)

Abstract

:
Plasma treatment, especially cold plasma generated under low pressure, is currently the subject of many studies. An important area using this technique is the deposition of thin layers (films) on the surfaces of different types of materials, e.g., textiles, polymers, metals. In this study, the goose down was coated with a thin layer, in a two-step plasma modification process, to create an artificial superhydrophobic surface similar to that observed on lotus leaves. This layer also exhibited antifungal properties. Two types of precursors for plasma enhanced chemical vapor deposition (PECVD) were applied: hexamethyldisiloxane (HMDSO) and hexamethyldisilazane (HMDSN). The changes in the contact angle, surface morphology, chemical structure, and composition in terms of the applied precursors and modification conditions were investigated based on goniometry (CA), scanning electron microscopy (SEM), Fourier-transform infrared spectroscopy in attenuated total reflectance mode (FTIR-ATR), and X-ray photoelectron spectroscopy (XPS). The microbiological analyses were also performed using various fungal strains. The obtained results showed that the surface of the goose down became superhydrophobic after the plasma process, with contact angles as high as 161° ± 2°, and revealed a very high resistance to fungi.

Graphical Abstract

1. Introduction

Plasma-enhanced chemical vapor deposition (PECVD) is a coating process widely used to produce thin layers on the surfaces of various types of materials from a broad range of precursors [1,2]. The wide application possibilities of such layers result from the fact that this method is environmentally clean, cost-effective, flexible, and the most insensitive to the shape and chemical composition of the substrate [3]. Particular attention should be paid to the layers plasma deposited from organosilicon precursors—which, due to their unique properties—have been applied in such areas as protective coatings [4,5], hydrophobic layers [6], optical coatings [7], or biocompatible films [8]. In the group of organosilicon precursors, hexamethyldisiloxane (HMDSO) and hexamethyldisilazane (HMDSN) are often preferred for the PECVD process due to their low cost, high vapor pressure, as well as obtaining stable and well-adherent layers.
There are many reports of hydrophobic or superhydrophobic layers formed on relatively flat surfaces using low-temperature non-equilibrium (cold) plasma and organosilicon precursors [9,10,11,12,13,14]. However, this type of plasma has only occasionally been reported for use in modifying natural, fluffy materials such as goose down [15,16]. Since the goose down is considered as the best filling material in textile products [17], due to the excellent thermal insulation and fill power (loft) [18,19,20], research has begun towards the elimination of the main drawbacks of down, i.e., moisture absorption and mold growth. These drawbacks lead to an almost complete loss of the thermal insulation properties of down with a loss of loft and a significant deterioration of its suitability, as well as environmental health risk by opening the way for the growth and development of allergenic (harmful) fungi [21,22,23]. This is due to the removal of waxes and oils from down in the purification process, which secures it naturally [24].
It seems that the best solution, in this case, would be to deposit a thin, highly hydrophobic layer on the down feathers, which would protect them against wettability. Presumably, such a coating could also be antifungal and antibacterial [25,26]. Recent reports show that the surface hydrophobicity for a given coating is crucial for these properties [27,28].
In this study, we have attempted to produce an effective superhydrophobic and antifungal coating on the surface of goose down feathers by the PECVD method using organosilicon precursors, such as HMDSO and HMDSN.

2. Materials and Methods

2.1. Materials

The base material for the research was the white goose down, designated as type: 90/10 (approx. 90% of plumes and the rest, approx. 10%, of down feathers), 750 CUIN (down elasticity, indicating the volume in cubic inches that one ounce of down occupies), and 1000 mm (translucency, i.e., the height of the water column in which an ounce of fluff was shaken, through which the bottom of the measuring vessel can be seen), provided by Animex Foods Comp. (Dobczyce, Poland). For investigations, the down was used in the native form or as pellets produced by its grinding in a mill (Vertical Laboratory Planetary Ball Mill model XQM-16A: 2.0 L jar, alumina balls with a diameter of 5–15 mm and a total weight of 0.5 kg, down load of 3 g per run; TENCAN, Changsha, China) followed by pressing in a hydraulic press (Atlas 15T model, SPECAC, Orpington, UK) using 0.17 g of ground down for each pellet and a pressure of 15 bar for 5 min at room temperature. In this way, down pellets with a diameter of 13.0 mm, a thickness of 2.0 mm, and a weight of 0.15 g were formed. Due to the much greater uniformity of the surface and therefore much easier measurement of the contact and tilt angles, the pellets were used as a reference substrate to optimize plasma processes in terms of obtaining the best hydrophobic properties of the down material surface. Figure 1 shows different forms of the tested down.
For study of the molecular structure of the plasma deposited layers and its influence on the hydrophobicity of the surface of these layers, while minimizing the contribution of the surface morphology in this effect, ultra-smooth silicon wafers (Institute of Electronic Materials Technology, Warsaw, Poland) were used as a substrate. The silicon wafers with thickness >2 mm and orientation <100> were characterized by a tolerance of thickness, flatness, and total thickness variation (TTV) <5 µm and surface roughness of <0.5 nm.

2.2. Thin Layer Deposition

A laboratory capacitively coupled RF glow discharge (13.56 MHz) plasma reactor was used to perform both surface activation of the samples and the deposition of thin layers. Two electrodes with an area of 64 cm2 each and a 3 cm gap between them were placed in parallel in the reactor chamber connected to a pumping system. The bottom powered electrode also supported the substrates in the form of pellets and silicon wafers. In the case of native down, to ensure complete and uniform coverage of all down elements, the material was stirred with a suitable agitator inside the plasma reactor. Reaction gases (in flow) were introduced through the upper perforated grounded electrode. First, the samples were activated with argon plasma generated in Ar (99.999% purity, Linde Gas, Cracow, Poland) with a flow of 4 sccm, which was stabilized by a mass flow controller SLA 5850 (Brooks Instrument BV, Veenendaal, The Netherlands). The initial pressure in the reactor chamber was approx. 8 Pa. Then, the deposition process was carried out with HMDSO (≥98% purity, Merck KGaA, Darmstadt, Germany) or HMDSN (≥98% purity, Merck KGaA, Darmstadt, Germany) as precursors. Their flow rates (approx. 0.35 sccm at the initial pressure in the chamber of 3.2 Pa) were controlled by thermal stabilization of precursor containers at 0 °C and precision leak valves. The applied discharge power was 25–80 W. The Ar plasma treatment time was 30–60 s, while the deposition time was 60–240 s. The selected parameters ensured stable plasma discharge conditions throughout the process. The layer thicknesses were determined for the layers deposited on the silicon wafers by the interference method using an interference microscope Nikon Eclipse LV 150N (Nikon, Tokyo, Japan).
Hereinafter, the plasma-deposited layers from HMDSO and HMDSN will be referred to as pp-HMDSO and pp-HMDSN layers, respectively.

2.3. Hydrophobicity Measurements

The hydrophobicity was determined by measuring the water contact angle (CA) at room temperature (25 °C) and using deionized water (Millipore Direct-Q 3 UV system, Millipore SAS, Molsheim, France). The analysis was carried out by an optical goniometer Theta 2000 (KSV Instruments Ltd., Helsinki, Finland) equipped with an automated table and liquid dispenser, ensuring high repeatability of measurements. A drop of water (4 µL) was placed on the surface of a given sample and the static contact angle was measured. The procedure was repeated for a minimum of 10 samples prepared under the same conditions to determine the average CA value. Figure 2 shows an example of photographs of water droplets placed on the surface of the down pellet and plume after coating by plasma-deposited HMDSN, with determined contact angles. The tilt angle was also determined by running at least 10 trials for a given sample using a 4 µL water drop.
For the visual analysis of the down hydrophobicity before and after the plasma deposition process, the water shake test was used [29]. The behavior of the down was observed after its vigorous shaking with water for 10 s.

2.4. Molecular Structure Analysis

Two spectroscopic techniques were employed to study the chemical structure of the plasma deposited layers, namely Fourier transform infrared-attenuated total reflectance spectroscopy (FTIR-ATR) and X-ray photoelectron spectroscopy (XPS).
A Jasco FTIR 4200 spectrometer equipped with an ATR sampling accessory (Multi-Reflection ATR PRO410-M, angle of incidence 45° and ZnSe prism) (Jasco Inter. Co., Ltd., Tokyo, Japan) was used for FTIR-ATR studies that were performed on the samples prepared on the silicon wafers. To eliminate disturbances caused by water vapor and carbon dioxide from the air, the measuring system was purged with dry nitrogen (99.999% purity; Linde Gas, Cracow, Poland). Spectra were recorded in the range of 4000–700 cm−1 with a resolution of 4 cm−1. The scanning rate was set at 1 cm/s. As standard, 50 scans for each spectrum were collected and averaged. As-recorded spectra were calibrated by subtraction of the substrate response and taking into account the thickness of the layers.
For XPS investigations, an AXIS Ultra DLD (Kratos Analytical Ltd., Manchester, UK) spectrometer was utilized, equipped with a monochromatic Al-Kα X-ray source (150 W, 1486.6 eV) with the spot size 300 × 700 μm. The base pressure in the analytical chamber was approx. 5 × 10⁻⁸ Pa; the pass energy and step size were set to 20 and 0.1 eV, respectively, for all high-resolution measurements. The XPS spectra were calibrated against the C 1s peak assigned to the C−C/C−H bonds and positioned at 284.8 eV. Due to the insulating nature of the deposited layers, which were prepared both on the native down and silicon wafers, charge neutralization was used when recording the XPS spectra.

2.5. Surface Morphology Studies

The surface morphology of the down pellets, plumes, and silicon wafers before and after the plasma deposition process was investigated by scanning electron microscopy (SEM) using an FEI Quanta 200F microscope (Thermo Fisher Scientific, Hillsboro, OR, USA), equipped with a field emission gun (FEG). Due to the insulating nature of samples, all SEM analyses were performed under a nitrogen atmosphere at a pressure of 100 Pa (low vacuum operating mode). This mode avoids coating the sample with a thin conductive layer, such as carbon or gold, which is important in order not to distort the surface topography. ImageJ software (U.S. National Institutes of Health, Bethesda, MD, USA) was used to determine the size of globular structures present on the surface of down pellets and plumes with deposited plasma layers.

2.6. Microbiological Testing

The microbiological tests consisted of two stages. In the first stage, the down obtained from worn and dirty down products (down jackets, sleeping bags) was investigated. The down was cultured on Sabouraud liquid and solid media with chloramphenicol and gentamicin (both from bioMérieux Polska, Warsaw, Poland) for isolation and cultivation of fungi. The tested material was incubated for 24 h at 35 °C, and then 7–14 days at 25 °C. In turn, single colonies were picked from the axenic strains of the isolated fungi and cultured on the Czapek-Dox medium (Sigma-Aldrich, Poznan, Poland) for the identification. The strains of isolated fungi were determined based on the macroscopic image of the grown colonies, as well as direct and colored microscopic preparations.
In the second stage, the possibility of fungal infection in fresh and clean goose down was tested. The down samples, both without plasma treatment and with the deposited layer from HMDSO or HMDSN, were placed on Petri dishes moistened with phosphate buffer solution (PBS) and the cells of the selected fungi—such as Aspergillus fumigatus, Aspergillus flavus, and Aspergillus niger—were introduced there in the form of a suspension in PBS solution with a concentration of 5 × 10⁷ cells/mL (densitometric evaluated). The infected down was incubated for 24 h at 35 °C, and then 7 days at 25 °C, maintaining a constant high humidity. The degree of infection was assessed by macroscopic observation scores.

3. Results and Discussion

3.1. Superhydrophobicity

To determine the most favorable parameters for the deposition of the layers in terms of their hydrophobicity, tests of the contact angle were carried out for the layers deposited on down pellets, as a reference substrate, under various conditions of the plasma process. Two types of precursors were used, i.e., HMDSO and HMDSN, and parameters such as discharge power and treatment time were changed for both the activation and deposition processes. The representative results are presented in Table 1. The most optimal parameters (red dots), regardless of the type of precursor, turned out to be the discharge power of 40 W and the treatment time of 30 s in the activation process and 25 W and 240 s in the deposition process, respectively, although the contact angle for the plasma deposit of HMDSN was slightly greater than that of HMDSO. The thickness of the layers produced from both HMDSO and HMDSN was 400–500 nm. The down pellets, which were plasma modified with these parameters, were visually indistinguishable from the unmodified ones. It should be noted, however, that the discharge power of 80 W in the activation process changes the color of the pellet surface. Also, a deposition time of 60 s is too short because water droplets on the pellet surface during CA measurements start to soak after about 90 s, even at initially high contact angles.
Taking the determined optimal parameters of the plasma process, the layers were deposited on the native down. The result of the water shake test is shown in Figure 3. It is evident that the plasma treatment made the down surface very hydrophobic. The untreated down is completely wetted, while the plasma coated down repels water effectively. The water shake test repeated many times does not completely change the properties of the plasma-treated down. The measured contact and tilt angles for this case and those for the down pellets treated with the same parameters of the plasma process (from Table 1) are compared in Table 2. As can be seen, the native down achieved even better hydrophobicity than down pellets. Besides the fact that the contact angles are higher, the tilt angles are close to zero. Water droplets placed on the surface of the down samples with plasma deposited layers roll down with the smallest inclination of the sample plane. The obtained results classify such a plasma-modified down as superhydrophobic. According to the currently accepted definition, superhydrophobic surfaces are those for which the water contact angle is ≥150°, and the tilt angle is ≤10° [30,31,32].
Table 2 also includes the results for the layers deposited on silicon wafers, which in turn exhibit a lower hydrophobicity than the native down and down pellets. The CA values measured for these samples showed good agreement with the literature reports for such materials obtained under similar conditions [33,34,35,36].

3.2. Surface Morphology

Based on Table 2, it can be concluded that despite the deposition of layers from the same material (the same precursor and the same parameters of the plasma process), differences in the hydrophobicity appear, which could be associated with a different surface morphology of the formed plasma layers. Indeed, as shown in Figure 4, the SEM investigations revealed a globular morphology in the case of the down pellets and the native down samples. On the other hand, the deposited layers on the silicon wafers are completely smooth at the nanoscale. The determined average size and its standard deviation for the globular structures occurring on the surface of the tested samples are given in Table 2. Generally, it can be stated that reducing the size of globular structures increases the hydrophobicity of the surface (taking into account both the contact and tilt angle). On the other hand, a significant reduction in contact angles and an increase in tilt angles, when there is a complete lack of surface globular morphology, as in the case of layers deposited on silicon wafers, indicates a very important role of the globular structure in creating superhydrophobicity of the native down surface. This observation is in line with an already well-established understanding of superhydrophobicity. Since the research on the lotus effect, it is known that two factors—namely micro- and nanoscale hierarchical surface morphology such as those found on lotus leaves, as well as the molecular structure of the surface—are critically important for this effect [37,38].

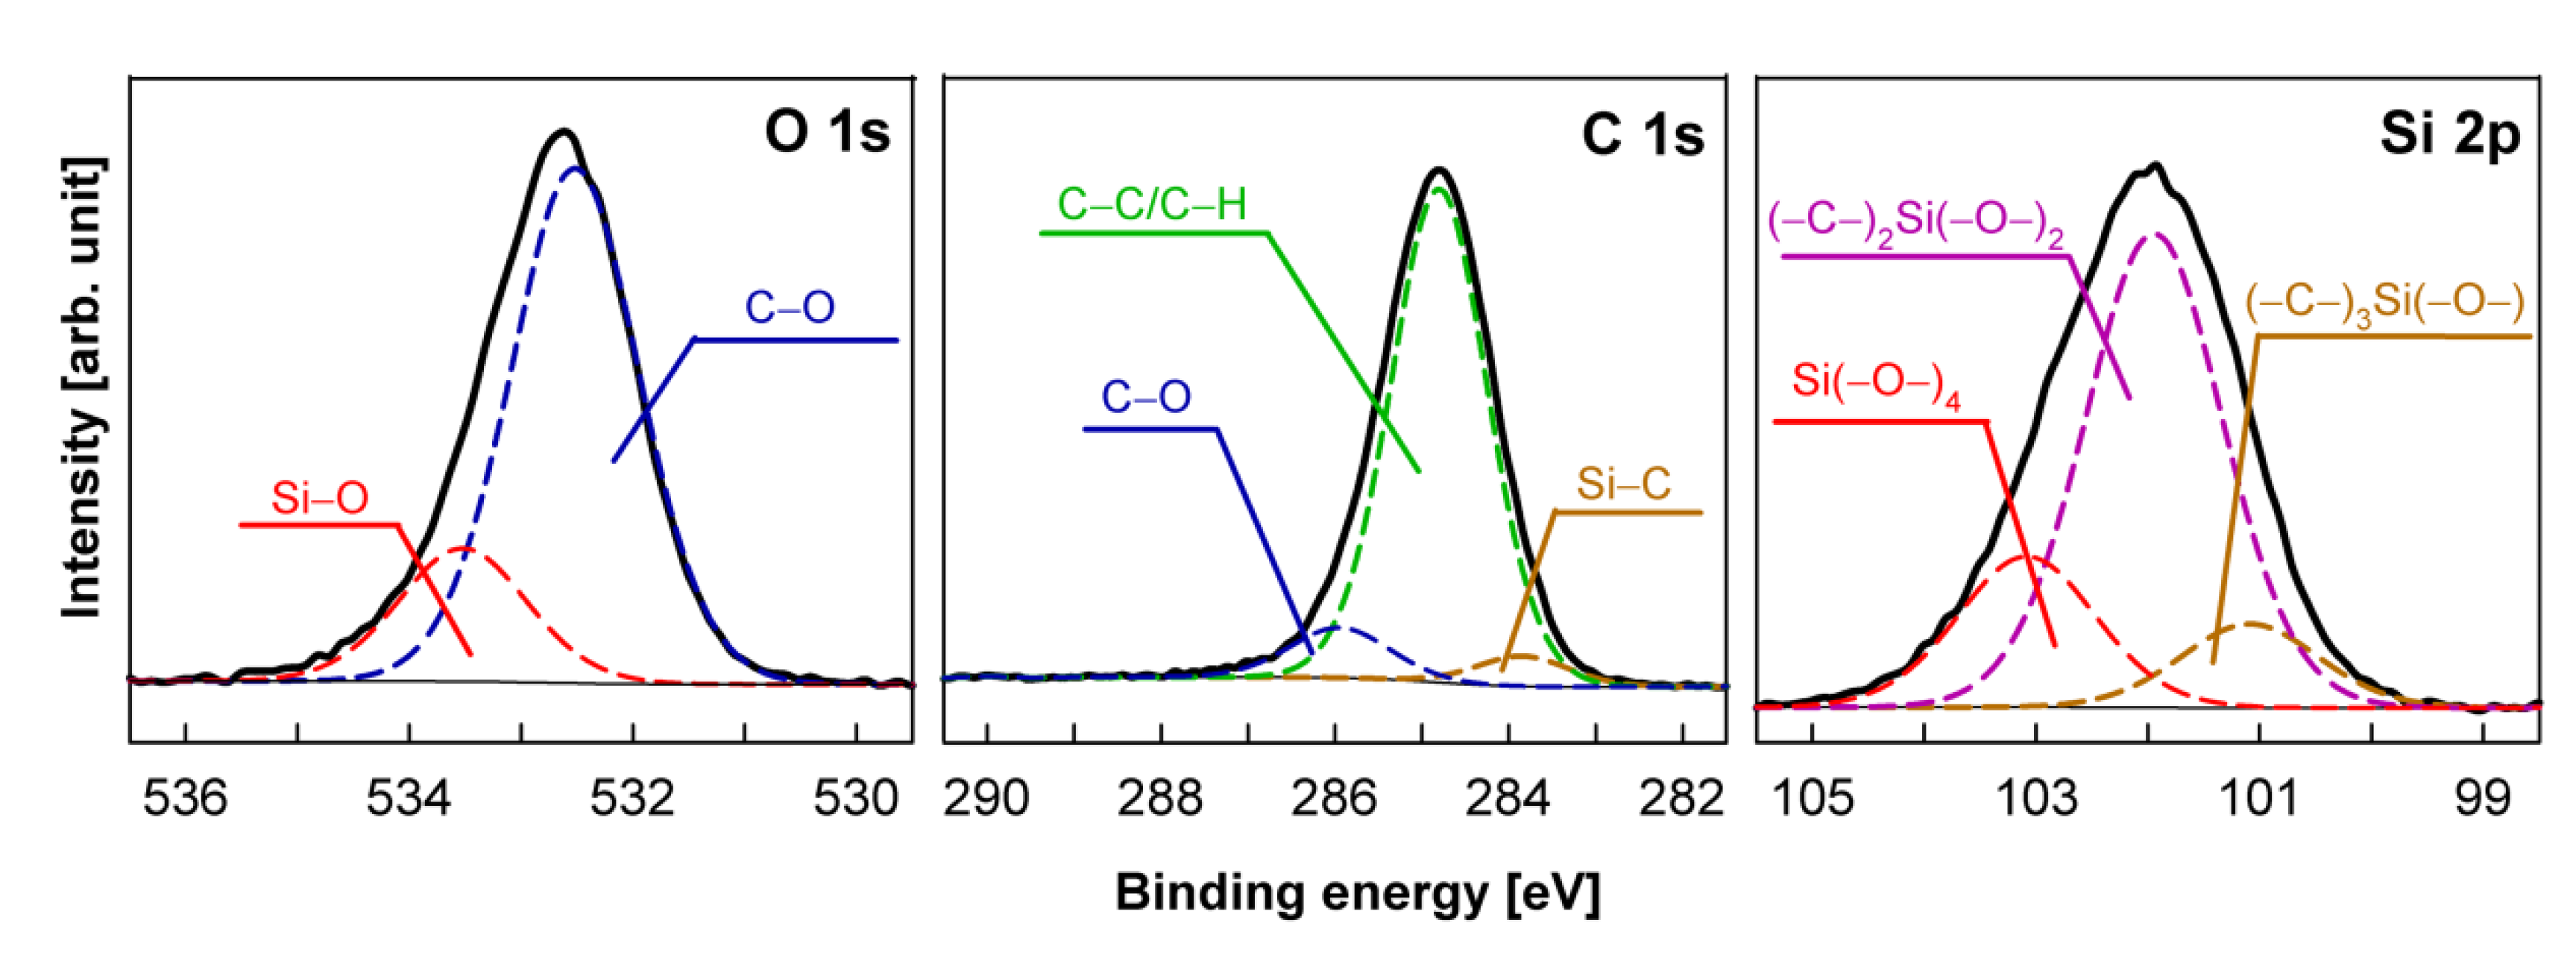
3.3. Molecular Structure

The comparison of the contact and tilt angles for the pp-HMDSO and pp-HMDSN layers deposited on silicon wafers—i.e., layers without a globular structure (Table 2)—shows that their molecular structure, as already mentioned above, also influences the hydrophobic properties of the surface. To determine the basic molecular structure of the layers, mainly by identifying the functional groups that are present there, studies by FTIR-ATR spectroscopy were performed. Figure 5 shows the FTIR-ATR spectra in the representative ranges of 700–1450 and 2750–4000 cm−1 for the plasma-deposited layers from HMDSO and HMDSN precursors. The assignment of individual IR absorption bands to the respective chemical bonds and vibration modes, referring to the cited literature, is given in Table 3.
The spectra show a clear similarity in the molecular structure of both layers, especially in the area of Si−C bonds. Small shifts in the position of the bands for the same functional groups in these layers probably result from the difference in the chemical structure of the precursors and, consequently, some differences in, for example, the layer density, molecular environment of these functional groups, and cross-linking structure [35,42,47]. It is worth noting that despite the lack of oxygen atoms in the HMDSN precursor molecule, the IR spectrum of the layer contains a band assigned to the Si-O-Si and Si-O-C groups. This is most likely due to the oxidation reactions that take place after removing the layer from the plasma reactor chamber and contacting with air [39,43,44,46].
What is particularly important, however, is the lack of hydroxyl groups in both cases, which should be visible in the range of 3400–3650 cm−1. The absence of these polar groups undoubtedly improves the hydrophobicity of the material surface. In turn, the presence of polar N-H groups in the pp-HMDSN layers, as indicated by the weak band at 1176 cm−1, should act towards hydrophilicity. According to the well-established view [34,36,48], the organic fraction in the form of methyl groups derived from precursor molecules, which are retained in the deposited layers, is essential for the hydrophobic properties of these layers. As shown in Figure 5, the content of methyl groups in both materials is similar. Thus, it is not surprising that the contact angles are also close to each other (Table 2), and the slight difference can be blamed on, for example, the presence of N-H groups in the pp-HMDSN layers. However, much higher values of the contact angle and a greater difference between them were obtained when the native down was used as the substrate (Table 2). This indicates that, in this case, the surface morphology of the layers plays a critical role in the hydrophobicity and makes it possible to achieve superhydrophobic properties.
The investigations carried out by FTIR-ATR spectroscopy provided information on the average molecular structure of the entire layer because this technique analyzes the sample with a penetration depth of about 2 μm [49]. However, for hydrophobic properties, only the real molecular structure of the surface itself is important, therefore investigations were carried out using XPS spectroscopy, for which the penetration depth does not exceed 10 nm. As samples, the pp-HMDSO and pp-HMDSN layers deposited on silicon wafers were used. Typical XPS survey (wide) scans for the samples are shown in Figure 6.
The main peaks of the spectra in Figure 6 are assigned, based on the binding energy, to the core levels of the O, N, C, and Si elements. On this basis, the elemental atomic composition was determined, which is presented in Table 4. What is particularly important is the fact that the XPS analysis confirmed the presence of oxygen in the pp-HMDSN layers; however, the oxygen content in this case is much higher than the FTIR investigations showed. From the XPS (Table 4), the ratio between the oxygen content in the layers from HMDSO and HMDSN is about 1.6 (0.34/0.21), whereas from the FTIR (taking the band assigned to the Si-O-Si and Si-O-C groups in Figure 5), it is higher than 3. This indicates that oxygen is present mainly on the surface of the layers from HMDSN, which confirms its origin from oxidation (aging) processes after the layers are removed from the plasma reactor chamber.
To accurately identify the chemical bonds present in the deposited layers, narrow scans of the O 1s, N 1s, C 1s, and Si 2p regions were analyzed. These core level spectra were fitted using a Gaussian convolution with a Shirley-type background. The revealed bands were assigned to the appropriate species based on the literature data concerning the XPS analysis of amorphous hydrogenated organosilicon layers deposited by the PECVD method [39,44,50,51,52]. Figure 7 and Figure 8 present the developed core level spectra for the pp-HMDSO and pp-HMDSN layers, respectively.
The O 1s spectra were deconvoluted into two bands, regardless of the type of precursor used. The first band at 532.5 eV is attributed to the C−O bonds, and the second band at 533.6 eV is assigned to Si−O bonds and a small amount of N−O bonds for the pp-HMDSN layers. These results once again fully confirm the significant presence of oxygen bonds on the surface of the layers deposited from HMDSN. In turn, the C 1s spectra were fitted with three components for the pp-HMDSO layer and five components for the pp-HMDSN layer. Bands at 283.9 and 284.8 eV are assigned to the C−Si and C−C/C−H groups, respectively, for both types of layers. The next band at 286.0 eV occurring for pp-HMDSO corresponds to C−O bonds, and in the case of pp-HMDSN, it can be assigned to both C−O and predicted C−N bonds. The last two very weak bands observed only for pp-HMDSN, at 287.7 and 289.6 eV, can be attributed sequentially to the C=O and O=C−O moieties, which are the result of the aforementioned oxidation (aging) processes taking place on the surface of the pp-HMDSN layers [39,44].
In the case of the Si 2p spectra, three-component bands were applied to fit it regardless of the precursor used. For the pp-HMDSN layer (Figure 8), the main band at 101.9 eV is assigned to the Si−N groups [44]. However, at the same binding energy, the (-C-)2Si(-O-)2 configuration can also be present [50,52]. The second band at 103.1 eV is associated with Si atoms bonded to four adjacent oxygen atoms (Si(-O-)4), and the last band at 100.9 eV comes from silicon bonded to three carbon atoms and one oxygen atom, denoted as (-C-)3Si(-O-). In the case of the pp-HMDSO layer (Figure 7), all three bands correspond to silicon oxycarbide species [53]. The band centered at 101.1 eV is related to (-C-)3Si(-O-). The next band at 102.1 eV is assigned to (-C-)2Si(-O-)2, and the last band (103.1 eV) is attributed to the Si(-O-)4 chemical structure, which is originated from silica in the form of SiO2. Based on the Si 2p spectra, it can be concluded that for both types of layers, cross-linking structures in the form of Si-O and Si-C were formed, which play an important role in the superhydrophobic nature of the layer surfaces. It should be added that, in the case of pp-HMDSN, some of the cross-linking structures are also created with the participation of nitrogen atoms. The N 1s spectrum (Figure 8), fitted by three bands, complements the results presented above. The most intense band at 398.1 eV is attributed to the Si−N bond and confirms that nitrogen is mainly bonded to the Si-containing cross-linked structure. The second band associated with the C−N groups, located at 399.3 eV, shows the bond not present in the precursor molecule, indicating a high degree of fragmentation despite the low power of plasma discharge [44]. The weakest band assigned to N-O bonds (at 400.4 eV) should naturally be associated with the oxidation (aging) processes already discussed above, which occur after the sample comes into contact with air.
The XPS investigations were also carried out on samples of pp-HMDSO and pp-HMDSN layers prepared on the native down with the optimal plasma process parameters. The surface molecular structure of the samples produced in this way was practically the same as for the layers deposited on silicon wafers. An interesting conclusion, however, can be drawn from these studies when we compare the XPS wide scan spectra for plasma untreated down and down covered with the pp-HMDSO layer (Figure 9). A small amount of silicon on the uncoated surface of the down is most likely related to the contamination remaining after cleaning in the manufacturing process. What is important, however, is that the N 1s band associated with the chemical structure of down is completely absent in the sample with the pp-HMDSO layer. This indicates a homogeneous and uniform coverage of the down surface by the plasma-deposited layer.

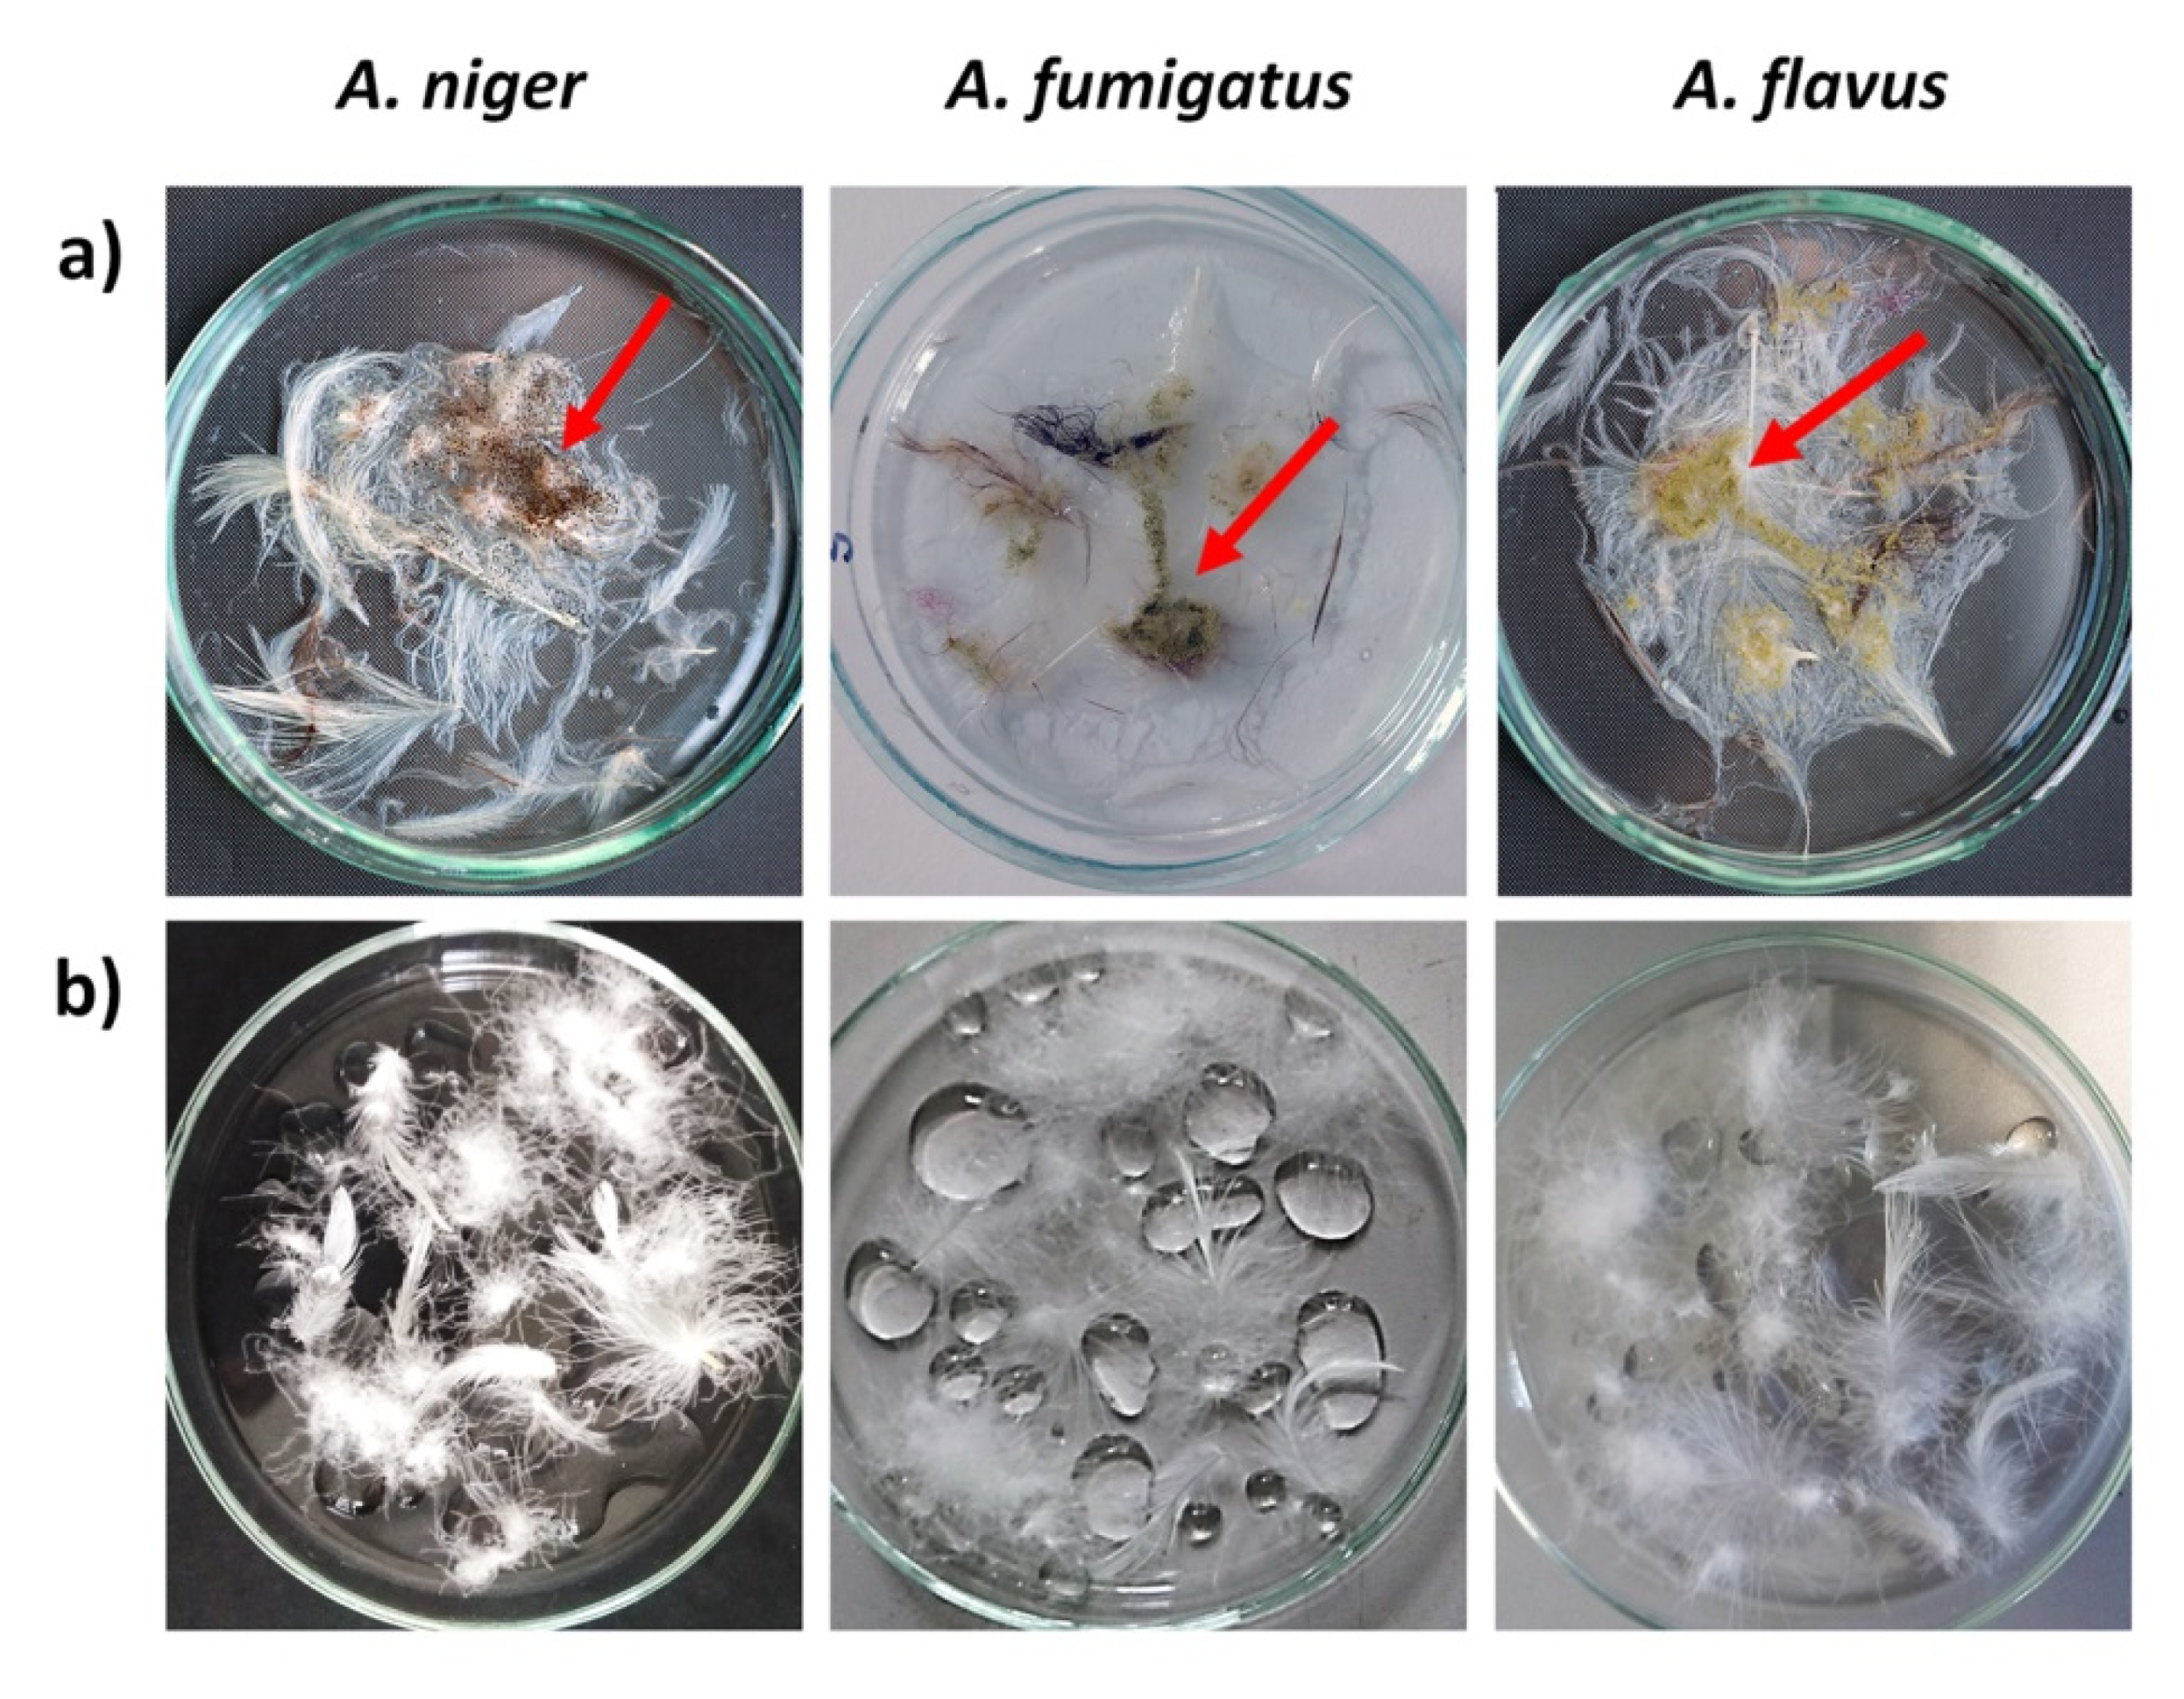
3.4. Antifungal Properties

To determine the usefulness of down covered with the plasma-produced layer, apart from its superhydrophobicity, the influence of this layer on the antifungal properties was also examined. For this purpose, first, the down obtained from worn and dirty down products (down jackets, sleeping bags) was tested to assess the scale of the fungal problem. It was found, like Woodcock et al. [23], who had studied fungal contamination of synthetic and feather pillows, that the main strains isolated were Aspergillus fumigatus, Aspergillus flavus, and Aspergillus niger. Besides, we also isolated Alternaria chlamydospora, Alternaria tenuissima, as well as Penicillium chryzogenum, Penicillium brevicompactum, and Chaetomium spp.
Then, the susceptibility to fungal infection of fresh and clean native down, which was the subject of this paper, was investigated. The three most common strains isolated by us were selected as model fungi, namely A. fumigatus, A. flavus, and A. niger. Down samples, both without plasma coating and with the deposited layer from HMDSO or HMDSN, were contaminated with these fungi. Figure 10 shows, as an example, the growth of the selected fungi on samples of native down and covered with the pp-HMDSO layer. The same results were obtained for the pp-HMDSN coating. As can be seen, the uncovered down is susceptible to fungal attacks, while the down with plasma coating shows considerable resistance to fungi. More detailed studies have shown that damage spots on down feathers are particularly susceptible to fungal growth. The finely cut feathers are much more likely to be attacked by the tested fungi than the undamaged ones. Thus, the deposition of the plasma layer protects them against such infection. The second important factor is the superhydrophobicity obtained as a result of plasma layer deposition. Water repulsion and maintaining the feathers in a non-wetted state also effectively prevents the development of fungi.

4. Conclusions

The results obtained in this work have proved that cold plasma is an excellent tool in modern technology. The use of this method in a two-step process consisting of plasma activation of a surface, followed by depositing a thin layer from precursors such as HMDSO or HMDSN, has allowed creating artificial superhydrophobicity on the surface of goose down. Very high contact angles (up to 161°) and very low tilt angles (close to 0°) have been achieved. This means that the down becomes completely waterproof and repels water effectively. The superhydrophobic surface also reveals very high resistance to fungi. The deposited layers are homogeneous and uniformly cover the entire surface of the down, at the same time showing high stability, which is a consequence of the chemical bonding of the layer to the down surface as a result of the plasma process. It should also be added that the measurements of the wettability repeated several times after longer periods of time (months) did not show any changes in the hydrophobic properties of the plasma treated down.
The studies conducted on the plasma-deposited layers from HMDSO and HMDSN confirm that both the molecular structure and the surface morphology have a significant influence on superhydrophobicity. Both of these factors can be controlled in a wide range by choice of precursors and parameters of plasma processes, which strengthens the view of high usefulness of the PECVD method and should ensure its permanent strong position among the methods used to create superhydrophobic surfaces [54].
The superhydrophobic down produced in the two-stage plasma process has great potential for practical application. This is confirmed by successful tests, for example, conducted by the K2 − Polish National Winter Expedition in 2017/18, which used down equipment made of our superhydrophobic down.

5. Patents

Some parts of the technology for producing a superhydrophobic and antifungal artificial surface on goose down presented in this paper have already been patented [16].

Author Contributions

R.K. writing the manuscript and contribution to the thin layers deposition; J.M. contribution to the hydrophobicity measurements; E.T.-S. contribution to the microbiological tests; M.F. contribution to the FTIR-ATR analysis; J.B. contribution to the XPS studies; J.S. contribution to the surface morphology studies; J.T. conceptualization, supervision, writing and editing the manuscript. All authors have read and agreed to the published version of the manuscript.

Funding

This work was financially supported by the Polish National Centre for Research and Development (NCBiR), project number PBS1/B9/16/2012, and by the Ministry of Science and Higher Education (MNiSW) based on an agreement number MNISW/2017/DIR/32.

Acknowledgments

The authors would like to thank K. Skalska and K. Wrześniewska-Tosik for their technical assistance.

Conflicts of Interest

The authors declare no conflict of interest.

References

  1. Wrobel, A.M.; Wertheimer, M.R. Plasma-polymerized organosilicones and organometallics. In Plasma Deposition, Treatment, and Etching of Polymers; d’Agostino, R., Ed.; Academic Press: New York, NY, USA, 1990; pp. 163–268. [Google Scholar]
  2. Biederman, H. (Ed.) Plasma Polymer Films; Imperial College Press: London, UK, 2004. [Google Scholar]
  3. Liu, K.; Tian, Y.; Jiang, L. Bio-inspired superoleophobic and smart materials: Design, fabrication, and application. Prog. Mater. Sci. 2013, 58, 503–564. [Google Scholar] [CrossRef]
  4. Zajickova, L.; Bursikova, V.; Kucerova, Z.; Franta, D.; Dvorak, P.; Smid, R.; Perina, V.; Mackova, A. Deposition of protective coatings in rf organosilicon discharges. Plasma Sources Sci. Technol. 2007, 16, S123–S132. [Google Scholar] [CrossRef]
  5. Fracassi, F.; d’Agostino, R.; Palumbo, F.; Angelini, E.; Grassini, S.; Rosalbino, F. Application of plasma deposited organosilicon thin films for the corrosion protection of metals. Surf. Coat. Technol. 2003, 174–175, 107–111. [Google Scholar] [CrossRef]
  6. Behnisch, J.; Tyczkowski, J.; Pela, I.; Hollander, A.; Ledzion, R. Formation of hydrophobic layers on biologically degradable polymeric foils by plasma polymerization. Surf. Coat. Technol. 1998, 98, 872–874. [Google Scholar] [CrossRef]
  7. Martinu, L.; Poitras, D. Plasma deposition of optical films and coatings: A review. J. Vac. Sci. Technol. A 2000, 18, 2619–2645. [Google Scholar] [CrossRef]
  8. Favia, P.; d’Agostino, R. Plasma treatments and plasma deposition of polymers for biomedical applications. Surf. Coat. Technol. 1998, 98, 1102–1106. [Google Scholar] [CrossRef]
  9. Hirotsu, T.; Tagaki, C.; Partridge, A. Plasma copolymerization of acrylic acid with hexamethyldisilazane. Plasmas Polym. 2002, 7, 353–366. [Google Scholar] [CrossRef]
  10. Azioune, A.; Marcozzi, M.; Revello, V.; Pireaux, J.-J. Deposition of polysiloxane-like nanofilms onto an aluminium alloy by plasma polymerized hexamethyldisiloxane: Characterization by XPS and contact angle measurements. Surf. Interface Anal. 2007, 39, 615–623. [Google Scholar] [CrossRef]
  11. Twardowski, A.; Makowski, P.; Małachowski, A.; Hrynyk, R.; Pietrowski, P.; Tyczkowski, J. Plasma treatment of thermoactive membrane textiles for superhydrophobicity. Mater. Sci. Medzg. 2012, 18, 163–166. [Google Scholar] [CrossRef] [Green Version]
  12. Mahlberg, R.; Niemi, H.E.-M.; Denes, F.; Rowell, R.M. Effect of oxygen and hexamethyldisiloxane plasma on morphology, wettability and adhesion properties of polypropylene and lignocellulosic. Int. J. Adhes. Adhes. 1998, 18, 283–297. [Google Scholar] [CrossRef]
  13. Mobarakeh, L.F.; Jafari, R.; Farzaneh, M. The ice repellency of plasma polymerized hexamethyldisiloxane coating. Appl. Surf. Sci. 2013, 459–463. [Google Scholar] [CrossRef]
  14. Asadollahi, S.; Profili, J.; Farzaneh, M.; Stafford, L. Development of organosilicon-based superhydrophobic coatings through atmospheric pressure plasma polymerization of HMDSO in nitrogen plasma. Materials 2019, 12, 219. [Google Scholar] [CrossRef] [PubMed] [Green Version]
  15. Pavlos, C.M.; Harke-Bus, R.P.; Ward, K.; Owens, D.E.; Harwood, R.; O’Hare, T.; Ferguson, D.C. Method for Producing Improved Feathers and Improved Feather Thereto. Patent WO 2011/143488, 17 November 2011. [Google Scholar]
  16. Tyczkowski, J.; Kapica, R.; Markiewicz, J.; Malachowski, A.; Malachowski, B. Method for Producing Durable Water-Repellent Layer on the Surface of Natural Down. Patent PL 228924, 19 December 2017. [Google Scholar]
  17. Gao, J.; Yu, W.; Pan, N. Structures and properties of the goose down as a material for thermal insulation. Text. Res. J. 2007, 77, 617–626. [Google Scholar] [CrossRef]
  18. Bonser, R.H.C.; Dawson, C. The structural mechanical properties of down feathers and biomimicking natural insulation materials. J. Mater. Sci. Lett. 1999, 18, 1769–1770. [Google Scholar] [CrossRef]
  19. Yildiz, D.; Bozkur, E.U.; Akturks, S.H. Determination of goose feather morphology by using SEM. J. Anim. Vet. Adv. 2009, 8, 2650–2654. [Google Scholar] [CrossRef]
  20. Stettenheim, P.R. The integumentary morphology of modern birds: An overview. Amer. Zool. 2000, 40, 461–477. [Google Scholar] [CrossRef] [Green Version]
  21. Webb, D.R.; King, J.R. Effects of wetting on insulation of bird and mammal coats. J. Therm. Biol. 1984, 9, 189–191. [Google Scholar] [CrossRef]
  22. Bakken, G.S. Wind speed dependence of the overall thermal conductance of fur and feather insulation. J. Therm. Biol. 1991, 16, 121–126. [Google Scholar] [CrossRef]
  23. Woodcock, A.A.; Steel, N.; Moore, C.B.; Howard, S.J.; Custovic, A.; Denning, D.W. Fungal contamination of bedding. Allergy 2006, 61, 140–142. [Google Scholar] [CrossRef]
  24. Liu, Y.; Chen, X.; Xin, J.H. Hydrophobic duck feathers and their simulation on textile substrates for water repellent treatment. Bioinsp. Biomim. 2008, 3, 046007. [Google Scholar] [CrossRef] [Green Version]
  25. Benkovicova, M.; Kisova, Z.; Buckova, M.; Majkova, E.; Siffalovic, P.; Pangallo, D. The antifungal properties of super-hydrophobic nanoparticles and essential oils on different material surfaces. Coatings 2019, 9, 176. [Google Scholar] [CrossRef] [Green Version]
  26. Shin, S.; Seo, J.; Han, H.; Kang, S.; Kim, H.; Lee, T. Bio-inspired extreme wetting surfaces for biomedical applications. Materials 2016, 9, 116. [Google Scholar] [CrossRef] [Green Version]
  27. Kim, Y.; Hwang, W. Wettability modified aluminum surface for a potential antifungal surface. Mater. Lett. 2015, 161, 234–239. [Google Scholar] [CrossRef]
  28. Fan, H.; Guo, Z. Bioinspired surfaces with wettability: Biomolecule adhesion behaviors. Biomater. Sci. 2020, 8, 1502–1535. [Google Scholar] [CrossRef] [PubMed]
  29. Hydrophobic Shake Test in IDFB Testing Regulations 2020, Version June 2015, Part 18-A. Available online: http://www.cfd.com.cn/upload/contents/2020/08/Testing_Regulations_v202006.pdf (accessed on 10 September 2020).
  30. Wang, S.; Jiang, L. Definition of superhydrophobic states. Adv. Mater. 2007, 19, 3423–3424. [Google Scholar] [CrossRef]
  31. Zhang, X.; Shi, F.; Niu, J.; Jiang, Y.; Wang, Z. Superhydrophobic surfaces: From structural control to functional application. J. Mater. Chem. 2008, 18, 621–633. [Google Scholar] [CrossRef]
  32. Dorrer, C.; Rühe, J. Some thoughts on superhydrophobic wetting. Soft Matter 2009, 5, 51–61. [Google Scholar] [CrossRef]
  33. Kurosawa, S.; Choi, B.G.; Park, J.W.; Aizawa, H.; Shim, K.B.; Yamamoto, K. Synthesis and characterization of plasma-polymerized hexamethyldisiloxane films. Thin Solid Films 2006, 506–507, 176–179. [Google Scholar] [CrossRef]
  34. Grimoldi, E.; Zanini, S.; Siliprandi, R.A.; Riccardi, C. AFM and contact angle investigation of growth and structure of pp-HMDSO thin films. Eur. Phys. J. D 2009, 54, 165–172. [Google Scholar] [CrossRef]
  35. Kraus, F.; Cruz, S.; Muller, J. Plasmapolymerized silicon organic thin films from HMDSN for capacitive humidity sensors. Sens. Actuators B Chem. 2003, 88, 300–311. [Google Scholar] [CrossRef]
  36. de Carvalho, A.T.; Carvalho, R.A.M.; da Silva, M.L.P.; Demarquette, N.R. Hydrophobic plasma polymerized hexamethyldisilazane thin films: Characterization and uses. Mater. Res. 2006, 9, 9–13. [Google Scholar] [CrossRef]
  37. Wang, J.; Chen, H.; Sui, T.; Li, A.; Chen, D. Investigation on hydrophobicity of lotus leaf: Experiment and theory. Plant. Sci. 2009, 176, 687–695. [Google Scholar] [CrossRef]
  38. Koch, K.; Bhushan, B.; Jung, Y.C.; Barthlott, W. Fabrication of artificial Lotus leaves and significance of hierarchical structure for superhydrophobicity and low adhesion. Soft Matter 2009, 5, 1386–1393. [Google Scholar] [CrossRef]
  39. Gengenbach, T.R.; Griesser, H.J. Post-deposition ageing reactions differ markedly between plasma polymers deposited from siloxane and silazane monomers. Polymer 1999, 40, 5079–5094. [Google Scholar] [CrossRef]
  40. Benitez, F.; Martinez, E.; Esteve, J. Improvement of hardness in plasma polymerized hexamethyldisiloxane coatings by silica-like surface modification. Thin Solid Films 2000, 377–378, 109–114. [Google Scholar] [CrossRef]
  41. Kashiwagi, K.; Yoshida, Y.; Murayama, Y. Hybrid films formed from hexamethyldisiloxane and SiO by plasma process. Jpn. J. Appl. Phys. 1991, 30, 1803–1807. [Google Scholar] [CrossRef]
  42. Choudhury, A.J.; Chutia, J.; Kakati, H.; Barve, S.A.; Pal, A.R.; Sarma, N.S.; Chowdhury, D.; Patil, D.S. Studies of radiofrequency plasma deposition of hexamethyldisiloxane films and their thermal stability and corrosion resistance behavior. Vacuum 2010, 84, 1327–1333. [Google Scholar] [CrossRef]
  43. Park, S.Y.; Kim, N.; Kim, U.Y.; Hong, S.I.; Sasabe, H. Plasma polymerization of hexamethyldisilazane. Polym. J. 1990, 22, 242–249. [Google Scholar] [CrossRef] [Green Version]
  44. Vassallo, E.; Cremona, A.; Ghezzi, F.; Dellera, F.; Laguardia, L.; Ambrosone, G.; Coscia, U. Structural and optical properties of amorphous hydrogenated silicon carbonitride films produced by PECVD. Appl. Surf. Sci. 2006, 252, 7993–8000. [Google Scholar] [CrossRef]
  45. Kim, M.T.; Lee, J. Characterization of amorphous SiC:H films deposited from hexamethyldisilazane. Thin Solid Films 1997, 303, 173–179. [Google Scholar] [CrossRef]
  46. Fracassi, F.; Lamendola, R. PECVD of SiOXNYCZHW thin films from hexamethyldisilazane containing feed. Investigation on chemical characteristics and aging behavior. Plasmas Polym. 1997, 2, 25–40. [Google Scholar] [CrossRef]
  47. Li, K.; Gabriel, O.; Meichsner, J. Fourier transform infrared spectroscopy study of molecular structure formation in thin films during hexamethyldisiloxane decomposition in low pressure rf discharge. J. Phys. D Appl. Phys. 2004, 37, 588–594. [Google Scholar] [CrossRef] [Green Version]
  48. Nouicer, I.; Sahli, S.; Kihel, M.; Ziari, Z. Superhydrophobic surface produced on polyimide and silicon by plasma enhanced chemical vapour deposition from hexamethyldisiloxane precursor. Int. J. Nanotechnol. 2015, 12, 597–607. [Google Scholar] [CrossRef]
  49. Kazarian, S.G.; Chan, K.L.A. ATR-FTIR spectroscopic imaging: Recent advances and applications to biological systems. Analyst 2013, 138, 1940–1951. [Google Scholar] [CrossRef] [PubMed]
  50. Alexander, M.R.; Short, R.D.; Jones, F.R.; Michaeli, W.; Blomfield, C.J. A study of HMDSO/O2 plasma deposits using a high-sensitivity and -energy resolution XPS instrument: Curve fitting of the Si 2p core level. Appl. Surf. Sci. 1999, 137, 179–183. [Google Scholar] [CrossRef]
  51. Chaiwong, C.; Rachtanapun, P.; Sarapirom, S.; Boonyawan, D. Plasma polymerization of hexamethyldisiloxane: Investigation of the effect of carrier gas related to the film properties. Surf. Coat. Technol. 2013, 229, 12–17. [Google Scholar] [CrossRef]
  52. Grüniger, A.; Bieder, A.; Sonnenfeld, A.; Von Rohr, P.R.; Muller, U.; Hauert, R. Influence of film structure and composition on diffusion barrier performance of SiOX thin films deposited by PECVD. Surf. Coat. Technol. 2006, 200, 4564–4571. [Google Scholar] [CrossRef]
  53. Uznanski, P.; Glebocki, B.; Walkiewicz-Pietrzykowska, A.; Zakrzewska, J.; Wrobel, A.M.; Balcerzak, J.; Tyczkowski, J. Surface modification of silicon ocycarbide films produced be remote hydrogen microwave plasma chemical vapour deposition from tetramethyldisiloxane precursor. Surf. Coat. Technol. 2019, 350, 686–698. [Google Scholar] [CrossRef]
  54. Sahoo, B.; Yoon, K.; Seo, J.; Lee, T. Chemical and physical pathways for fabricating flexible superamphiphobic surfaces with high transparency. Coatings 2018, 8, 47. [Google Scholar] [CrossRef] [Green Version]
Figure 1. Forms of the tested down: (a) plume; (b) down feather; (c) pellet.
Coatings 10 00904 g001
Figure 2. Photographs of water droplets on surfaces covered with pp-HMDSN, with designated contact angles: (a) down pellet; (b) plume.
Coatings 10 00904 g002
Figure 3. Photographs of down feathers after the water shake test: (a) without plasm treatment; (b) with thin layer of pp-HMDSN.
Coatings 10 00904 g003
Figure 4. SEM images of the surface of various samples before and after the plasma deposition of thin layers from HMDSO and HMDSN.
Coatings 10 00904 g004
Figure 5. FTIR-ATR spectra for the pp-HMDSO and pp-HMDSN deposited on silicon wafers.
Coatings 10 00904 g005
Figure 6. XPS wide scan spectra for the pp-HMDSO and pp-HMDSN deposited on silicon wafers.
Coatings 10 00904 g006
Figure 7. XPS core-level spectra of O 1s, C 1s, and Si 2p for the pp-HMDSO layer.
Coatings 10 00904 g007
Figure 8. XPS core-level spectra of O 1s, C 1s, Si 2p, and N 1s for the pp-HMDSN layer.
Coatings 10 00904 g008
Figure 9. XPS wide scan spectra for the native down and the pp-HMDSO layer deposited on this down.
Coatings 10 00904 g009
Figure 10. Microbiological examination of goose down with selected strains of fungi: (a) native down without plasma treatment (red arrows indicate places of fungal growth); (b) down coated with pp-HMDSO (no fungal growth).
Coatings 10 00904 g010
Table 1. Optimization of plasma process parameters in search of the best surface hydrophobicity on down pellets.
Sample No.Plasma ActivationPlasma DepositionContact Angle
PowerTimePowerTime
(W)(s)(W)(s)(deg)
pp-HMDSO
1803040120138 ± 1
2806040120133 ± 2
3403040120142 ± 2
4406040120139 ± 3
5253040120136 ± 4
6256040120138 ± 3
740304060137 ± 5
8403040240143 ± 2
940302560141 ± 4
10403025120143 ± 3
11403025240144 ± 5
pp-HMDSN
1240302560143 ± 5
13403025120147 ± 1
14403025240152 ± 3
Table 2. Contact angles, tilt angles, and the average size of globular structures on the deposited layers surface for the plasma process optimal parameters
Sample NameContact Angle
(deg)
Tilt Angle
(deg)
Globules
(nm)
pellet pp-HMDSO No. 11144 ± 59 ± 1400 ± 100
pellet pp-HMDSN No. 14152 ± 3 6.5 ± 0.5190 ± 70
down pp-HMDSO150 ± 2≈070 ± 20
down pp-HMDSN161 ± 2≈050 ± 20
Si wafer pp-HMDSO100 ± 220 ± 10
Si wafer pp-HMDSN95 ± 425 ± 10
Table 3. Assignments of bands detected in FTIR-ATR spectra of pp-HMDSO and pp-HMDSN thin layers.
Layer Band (cm−1)Vibrational ModeReferences
pp-HMDSO1399CH3 asymmetric bending in Si–(CH3)x, (x = 1, 2, 3)[34,38,39]
1350CH2 scissor vibration in Si–CH2–Si[40]
1253CH3 symmetric bending in Si–(CH3)x, (x = 1, 2, 3)[33,34,39,40,41,42]
1022Si–O–Si asymmetric stretching; Si–O–C stretching[33,34,39,40,41,42]
896CH3 rocking in Si–(CH3)2[40]
834CH3 rocking in Si–(CH3)3[33,34,39,40,41]
781CH3 rocking in Si–(CH3)2, Si–O–Si bending[33,34,39,40,41,42]
720CH3 rocking in Si–(CH3)3[40,41]
pp-HMDSN1405CH3 asymmetric bending in Si–(CH3)x, (x = 1, 2, 3)[39,43,44]
1352CH2 asymmetric bending in Si–CH2–Si[43]
1251CH3 symmetric bending in Si–(CH3)x, (x = 1, 2, 3)[39,43,44,45,46]
1176N–H bending[35,44]
1031Si–O–Si asymmetric stretching; Si–O–C stretching[43,44,46]
908Si–N asymmetric stretching in Si–NH–Si[39,43,44,45,46]
835CH3 rocking in Si–(CH3)3[39,43,44,45,46]
763Si-C stretching in Si–(CH3)x, (x = 1, 2, 3)[43,44,45]
Table 4. Elemental atomic composition of the pp-HMDSO and pp-HMDSN determined based on XPS analysis
Sample NumberSurface Composition (at %)O/(Si + C)
SiCNO
Si wafer pp-HMDSO22.2052.19025.610.34
Si wafer pp-HMDSN21.5354.078.4515.950.21

