
Turbulence Intensity Characteristics of a Magnetoliquid Seal Interface in a Liquid Environment
by
Wangxu Li
1,2, 
Zhenggui Li
1,2,*,
Ziyue Wang
1,2,
Feng Wu
1,2,
Lianchen Xu
1,2 and
Shengyang Peng
3 1
Key Laboratory of Fluid and Power Machinery, Ministry of Education, Xihua University, Chengdu 610039, China
2
Key Laboratory of Fluid Machinery and Engineering of Sichuan Province, Xihua University, Chengdu 610039, China
3
Huaneng Mingtai Electric Power Co., Ltd., Mianyang 621100, China
*
Author to whom correspondence should be addressed.
Coatings 2021, 11(11), 1333; https://doi.org/10.3390/coatings11111333
Submission received: 23 September 2021
/
Revised: 26 October 2021
/
Accepted: 27 October 2021
/
Published: 30 October 2021
(This article belongs to the Special Issue New Advances in Interfacial Mass Transfer)
Abstract
:In a liquid environment, the turbulence intensity of the interfacial layer between the magnetic and sealing medium fluids in magnetic liquid seals directly affects the layer stability. Reducing the maximum turbulence intensity of the fluid interface layer effectively improves the stability of the magnetic fluid rotary seal. In this study, we simulated magnetic fluid sealing devices with different structures in liquid environments using the FLUENT software. The simulation results were verified through experimental analyses of the turbulence intensity at the sealing interface. The maximum turbulence intensity of the liquid interface layer increased with increasing shaft speed. At the same speed, the turbulence intensity was maximized at the shaft interface before gradually decreasing in a multistage linear pattern along the radial direction. A magnetic liquid seal with an optimized structure (OS) in the liquid environment was designed based on these results. The maximum turbulence intensity of the liquid interface layer in the OS was independent of the rotation speed and was more than 20% lower than that that in the traditional structure. These results provide a reference for designing magnetic liquid sealing devices.
1. Introduction
Magnetic liquid seals offer several advantages over traditional mechanical seals, including zero leakage [1,2], easy maintenance [3], no pollution, and high reliability [4,5], thereby attracting the attention of many researchers. Although the sealing of magnetic liquids against gases has significantly advanced [6], there are still several unsolved problems related to sealing liquids [7]. He et al. proposed problems of incompatibility between the magnetic and sealed liquids, and issues of liquid–liquid stability when magnetic liquid is used to seal liquids [8]. Van der Wal et al. reported that when the sealing and magnetic liquid interfaces are unstable, the liquids emulsify, leading to seal failure [7]. Szczech and Horak noted that different speeds of two liquids cause Kelvin–Helmholtz (KH) instability at the two-phase interface, which also caused seal failure [9]. Qian proposed an approximate treatment method for liquid interface stability analysis and reported that interface instability is the main cause of seal failure [10]. These reports confirmed that seal failure is mainly caused by the instability of the fluid medium interface layer. Therefore, it is necessary to study the factors that cause such instability when magnetic fluid seals a liquid.
When the interface of two liquids with different densities is subjected to an external force, the interface is disturbed and instability occurs. Interface instability can be categorized as Rayleigh–Taylor, Richmyer–Meshkov, or KH instability, which are caused by gravity fields [11], shock waves [12,13], and speed differences [14], respectively. When the magnetic liquid rotates and seals, the rotation of the main shaft drives the rotation of the liquid in the sealed cavity; the speed difference between the magnetic liquid and liquid in the sealed cavity causes KH instability. In static sealing, there is no speed difference between the magnetic and sealing liquids, thereby inhibiting KH instability and resulting in a superior sealing effect. As the rotation speed increases, the nature of the flow between the magnetic liquid and sealing medium changes from laminar to turbulent, and the interfacial layer of the fluid medium becomes unstable, immersed, and permeated, thereby damaging the O-shaped sealing ring formed by the magnetic fluid under the action of the magnetic field, resulting in seal failure. The sealing ring is first damaged near the main shaft, where the maximum turbulence intensity of the fluid medium interface layer occurs. Therefore, reducing the maximum turbulence intensity of the interface layer can effectively improve the sealing effect of the magnetic liquid. At present, research on the magnetic fluid seal is mostly based on the design and improvement of the magnetic circuit device. Further, there are few studies on the flow field of liquid in sealed media through a single research method, which is mainly through theoretical derivation. The influence of the sealing flow field on the stability of the magnetic fluid seal should be considered and discussed from different angles through expanded research methods.
In this study, a combination of practical experiments and numerical simulations was used to investigate the traditional magnetic fluid seal structure and obtain the trend in the turbulence intensity at the interface layer of the fluid medium as a function of the rotation speed. Additionally, the traditional seal structure (TS) was optimized, and an optimized structure (OS) was acquired. The turbulence intensities at the fluid medium interface layers of the TS and OS at different speeds were compared and the simulation results were verified experimentally. Finally, magnetic field simulations were performed on the TS and OS to verify the viability of the magnetic circuit of the OS.
2. Materials and Methods
The internal flow of the sealed liquid is approximated as a three-dimensional incompressible flow, in which the flow field should satisfy the mass and momentum conservation equation [15]. Mass conservation can be described as the equality of the mass of the fluid flowing out of the control body to that reduced by the density change in the control body in the same time interval. The mass conservation equation, or continuity equation, is as follows:
where is the fluid density; , , and are the velocity of the fluid along the x, y, and z directions, respectively; and t is the unit time.
Momentum conservation is defined as the equality of the rate of change of the momentum of the control body with respect to time to the sum of various external forces acting on the control body, as follows:
where u is the fluid velocity, P is the fluid pressure, is the viscous shear stress of the fluid, and F is the volumetric force acting on the fluid.
Turbulence intensity is important for determining the microscopic pulsation characteristics of the flow field, as described by [16]:
where is the fluid pulsation velocity and is the average fluid velocity.
In the process of magnetoliquid sealing, the sealing capacity generated by the magnetic field gradient is significantly greater than the sum of the sealing pressure generated by the magnetoliquid magnetization and centrifugal force. In addition, as magnetic fluid gravity and velocity have minimal influence on the sealing ability, the magnetic fluid dynamic sealing formula can be simplified as [17]:
where is the sealing pressure, is the vacuum permeability, M is the magnetization of the magnetic liquid, and H is the magnetic field intensity at the sealing gap.
Turbulence intensity significantly affects the stability of the interface layer of the fluid medium [10]. Considering the complex shape of the interface between the magnetic and sealing liquids, and to better determine the relationship of the turbulence intensity of the fluid medium interface layer with the shaft speed, we assumed that the magnetic liquid is well sealed and that the shape of the interface between the magnetic and sealing liquids is regular. The two-phase interface can then be simplified as a wall surface, thereby allowing the relationship to be extracted.
Figure 1 shows the fluid computational domain model of the sealed cavity with a shaft diameter (RD) of 200 mm, sealing clearance height of 1 mm, and cavity height (HS) of 40 mm. The OS is slotted on the shaft surface with the starting end of the slot position flushed with the end of the pole piece. The tested slot depths (SDs) are 1, 2, and 3 times the sealing clearance (1SD, 2SD, and 3SD), and the slot lengths (SLs) are 8, 16, and 32 times the sealing clearance (8SL, 16SL, and 32SL). Figure 2 shows the difference between the TS and OS.
Figure 3 presents the computational fluid domain grid model, which adopts the hexahedral structure grid drawn by the ICEM software (16.0, 2016, ANSYS, Cannonsburg, Pennsylvania, just south of Pittsburgh, PA, USA). The comprehensive quality of the grid is above 0.9, and the grid angle is 87°–94°. In the same model, the number of grids in the high-speed flow is generally larger than that in the low-speed flow. Therefore, this study conducted a grid independence calculation for each model when the shaft speed is 1000 rpm. When the number of grids in all models is greater than 238,531, the physical quantity monitored in the flow field does not vary significantly with the increase in the grid number (less than 3%), indicating that these grid numbers meet the calculation requirements. Thus, the number of grids in the subsequent calculations under all working conditions was set to be greater than 238,531.
The flow field simulation inside the sealed cavity is performed using the FLUENT software (16.0, 2016, ANSYS, Cannonsburg, Pennsylvania, just south of Pittsburgh, PA, USA). The sealing liquid medium was water, and the shaft speeds were set at 100, 300, 500, and 1000 rpm. The interface between the magnetic and sealing liquids was set as the wall surface. Pressure–velocity coupling was employed in the coupled method. The turbulence model was a k-e realizable model. Least-squares cell-based scheme was used for the gradient dispersion, and PRESTO! was used for the pressure dispersion, whereas other dispersions were used as the second-order upwind scheme.
3. Results
3.1. Analysis of the Turbulence Intensity at the TS Interfaces
When the magnetic liquid rotates in the seal, the liquid in the seal cavity rotates under the action of the shear force due to the rotation of the main shaft, forming the flow field shown in Figure 4. As the rotation speed increases, the flow field in the sealing cavity changes from laminar to turbulent flow. Under turbulent flow, the magnetic liquid is constantly eroded by the sealing liquid, facilitating emulsification and mixing, resulting in sealing failure. To explore the relationship between the turbulence intensity distribution at the interface layer of the fluid medium at the seal gap and rotational speed, the flow fields at speeds ranging from 100–1000 rpm were simulated. The flow field characteristics at the interface layer of the fluid medium when the magnetic liquid with the TS enters the mobile seal were analyzed quantitatively.
The maximum turbulence intensity at the interface layer of the fluid medium is noted at the spindle interface in the TS under different rotating speeds (Figure 5). From the radial direction of the main shaft to 0.2 times the sealing gap, the turbulence intensity at the interface layer of the fluid medium decreases rapidly and then tends to stabilize. At 0.8 times the gap, the turbulence intensity is further reduced and reaches the minimum value at the wall. The turbulence intensity distribution law shows that the multisegment linear pattern of the main shaft decreases along the radial direction. Therefore, sealing failure is most likely to occur at the interface of the spindle, which has the highest turbulence intensity. Reducing the maximum turbulence intensity at the interface layer of the fluid medium at the seal gap is one of the most effective methods to improve sealing stability. The distribution law of turbulence intensity shows that the multisegment linear pattern of the main shaft decreases along the radial direction.
To further explore the relationship between the turbulence intensity at the spindle interface and rotational speed, the turbulence intensity at the spindle interface was analyzed at the rotational speed range of 100–1000 rpm (Figure 6). With increasing rotational speed, the turbulence intensity at the spindle interface increases approximately linearly. Linear function fitting using the highly reliable Origin software yields the following equation:
where y represents the turbulence intensity at the axis surface and x represents the rotational speed of the axis. This equation represents the relationship between the turbulence intensity and rotational speed at the interface of the axis with a diameter of 200 mm.
3.2. Influence of the Slotting Depth on the Turbulence Intensity at the Sealing Interface
Section 3.1 reveals that the maximum turbulence intensity in the TS occurs at the axial interface, primarily because the maximum liquid velocity gradient at the spindle interface leads to the maximum liquid shear stress, thereby generating turbulence. Reducing the velocity gradient is one of the most effective methods to reduce turbulence intensity. The velocity gradient at the seal clearance can be effectively reduced and the flow pattern can be improved by opening a groove in the TS axis. To simplify the experimental variables, the sealed liquid material, sealing clearance, and shaft speed were kept constant while observing the influence of the slotted depth on the turbulence intensity of the sealed liquid interface layer.
The slotted structure significantly reduced the turbulence intensity of the sealing liquid interface layer at the sealing interface (Figure 7). When the slotting length is fixed at 32SL, the reduction of the turbulence intensity due to the slotting effect slightly differed at different rotational speeds. At 100 rpm, slot depths of 2SD and 3SD reduce the turbulence intensity at the axis interface to a greater extent than with a slot depth of 1SD. In addition, the reduction ratio of the turbulence intensity (effect value) of 2SD and 3SD shows no significant difference (approximately 27%). The calculation formula of the effect value is as follows:
where is the turbulence intensity at the interface of the axis of the OS, is the turbulence intensity at the interface of the axis of the TS, and is the effect value. At rotational speeds of 300, 500, and 1000 rpm, are 25.8%, 22.1% and 22%, respectively, indicating that the slotting depth had minimal effect on the turbulence intensity at the axis interface.
When the spindle speed is 100, 300, 500, and 1000 rpm, the 2SD and 3SD obtained values above 22%. Although the turbulence intensity at the axial interface is reduced, the eddy current of the sealed liquid caused fluid-induced vibration, which is not conducive to the stability of the magnetoliquid interface. Moreover, the larger the slotting scale, the stronger the eddy effect. The 2SD has a larger value than 1SD and smaller vortex effect than 3SD; thus, after comprehensive consideration, the optimal slot depth is determined to be 2SD.
3.3. Influence of the Slotting Length on the Turbulence Intensity at the Sealing Interface
At a fixed slotting depth of 2SD, the slotting length has no obvious effect on the turbulence intensity at the axial interface (Figure 8). This is because the shear force caused by the circumferential movement of the sealing fluid increases the turbulence intensity at the sealing interface. Thus, the shear force of the sealing liquid exhibits a strong response to the groove depth at the front of the sealing interface, but no obvious response to the groove length was observed. However, SL has a significant effect on the location of the sealed liquid vortex due to the slot structure.
Figure 9 shows the vorticity distribution cloud diagram with different structures at 1000 rpm. When the slot length is 8SL, the sealing fluid vortex occurs near the sealing interface. The magnetoliquid seal interface is subjected to the pulsating force caused by the eddy motion of the sealing liquid, and the magnetoliquid seal depends on the magnetic field gradient at the bottom of the pole tooth. Both the magnetic field gradient of the position of the magnetic fluid and its sealing ability are different, resulting in the fluctuations of the magnetoliquid seal interface with the fluctuations in the external sealing pressure. Under the influence of the pulsating force, the sealing interface moves at the same frequency as the pulsating force, which significantly affects the sealing stability. With the increase in the groove length, the position of the eddy current movement moves farther from the sealing interface along the axial direction, thereby gradually weakening the pulsating force of the eddy current movement at the sealing interface. When the grooving length is 16SL and 32SL, the vorticity distribution at the sealing clearance is similar, and the grooving length is too long, which affects the spindle rigidity. Thus, the optimal slotting length was determined to be 16SL.
3.4. Relationship between the Turbulence Intensity and Rotational Speed at the Interface Layer of the OS
In the OS (SL = 16 mm, SD = 2 mm), the relationship between and rotational speed is shown in Figure 10. At all calculated rotational speeds, are all above 20%, indicating that the reduction in the turbulence intensity of the sealing liquid interface layer at the seal clearance owing to the OS is not affected by the rotational speed. In addition, the OS can significantly reduce the maximum turbulence intensity of the liquid interface layer at the seal clearance and reduce the washout effect of the sealing liquid on the O-ring, which is formed by the magnetic field in the magnetic liquid, thereby improving the stability of the magnetic fluid rotary seal.
3.5. Difference between the Magnetic Fields of OS and TS
The sealing ability of the magnetic liquid primarily depends on the magnetic field strength at the sealing gap and saturation magnetization of the magnetic liquid [17]. The magnetic liquid responds to the magnetic field by forming an O-type sealing ring [18]. The magnetic circuit is formed by the permanent magnet, pole shoe, magnetic liquid, and spindle [19,20]. The design of this magnetic circuit directly affects the sealing ability of the magnetic liquid. Compared with the TS, the turbulence intensity of the liquid interface layer is significantly reduced by the magnetic liquid seal of the OS. However, whether the OS exhibits the magnetic leakage phenomenon, which can reduce the magnetic induction intensity at the seal clearance and reduce the seal pressure difference, requires further study.
The calculation of the magnetic field is performed using the Maxwell software. The pole piece and shaft were made of AISI 1008 steel. The magnetic flux–magnetizing force (B–H) curve of this material is shown in Figure 11. The permanent magnet used was NdFe30. Its residual magnetic flux density Br was 1.2 T and the coercivity Hc was 8.38 × 10⁵ A/m. As the magnetic liquid sealing structure is rotating, a two-dimensional (2D) axisymmetric model can be employed. The remaining structural parameters are presented in Table 1. In addition, as the relative permeability of the magnetic liquid is equal to that of air, the magnetic liquid can be treated as air [21].
The SL and SD are 16 and 2 times the length of the sealing gap, respectively, which are suitable for the magnetic liquid sealing structures at all speeds. The magnetic field at the sealing gap of the OS with these parameters was compared with that of the TS to verify the accuracy of the design of the magnetic circuit design in the OS.
The magnetic induction intensity distributions at the sealing gap of the OS and TS are generally similar (Figure 12), indicating the correct design of the magnetic circuit. After the slots are introduced, the resistance of the magnetic field in the main shaft part is reduced, thereby enhancing the magnetic induction intensity at the sealing gap. The maximum magnetic induction intensity at the sealing gap of the OS is increased by 3.7% compared to that of the TS.
3.6. Test Validation
To validate the simulation results, a flow field test experiment was performed in the Key Laboratory of Xihua University. The experimental device adopted a 2D particle image velocimetry (PIV) system purchased by Xihua University from TSI, St. Paul, Minnesota, America. The PIV system is suitable for non-contact probing of the 2D velocity field on a plane of the fluid. The main function parameters are shown in Table 2.
The PIV system consists of a dual-cavity dual-pulse laser (LPS PIV200), guarding light arm, sheet–light–source lens group, high-speed camera (ILA.PIV.sCMOS), synchronizer, tracer particle generator, PIV image analysis software, and a computer. The test device comprises the PIV system, generator, rotating shaft, and sealed cavity constructed using transparent acrylic material. Figure 13 shows a schematic of the test device. The pulsed laser beam passes through the lens group and forms part of the light source and illuminates the measurement area in the flow field, which is an extremely thin (≤1 mm) layer of the field. The camera is aligned perpendicular to the direction of the light. The built-in algorithm of the PIV system divides the photographed area into several equidistant query areas of equal dimensions (Figure 14). The velocity of the query area is represented by the average velocity of the tracer particles in the query area, as calculated by the cross-correlation algorithm. The sum of the velocity vectors of the query areas constitutes the velocity vector of the flow field in the calculation area.
The laser intensity is important during the charge-coupled device (CCD) camera shooting. If the intensity is too low, the test area cannot be illuminated, thereby affecting the calculation results. The intensity of the pulse laser has a parabolic relationship with time (Figure 15). At 180–210 μs, the laser has high intensity, which meets the laser intensity required for measurement. is defined as the time interval between two laser pulses in the PIV system. In the PIV test, Lamp 1 controls the first group of lasers and initiates Q. Switch 1 triggers the first group of lasers at 180 μs. At after the first laser pulse from Lamp 1, Lamp 2 activates the second laser. At after Q, Switch 2 triggers the second group of lasers. The CCD camera exposure time is 180 + μs, which ensures that the first laser is triggered within the first exposure of the CCD camera, while the second laser is triggered after the first exposure. At the rotation speeds of 100, 300, 500, and 1000 rpm, is 60, 70, 80, and 90 μs respectively.
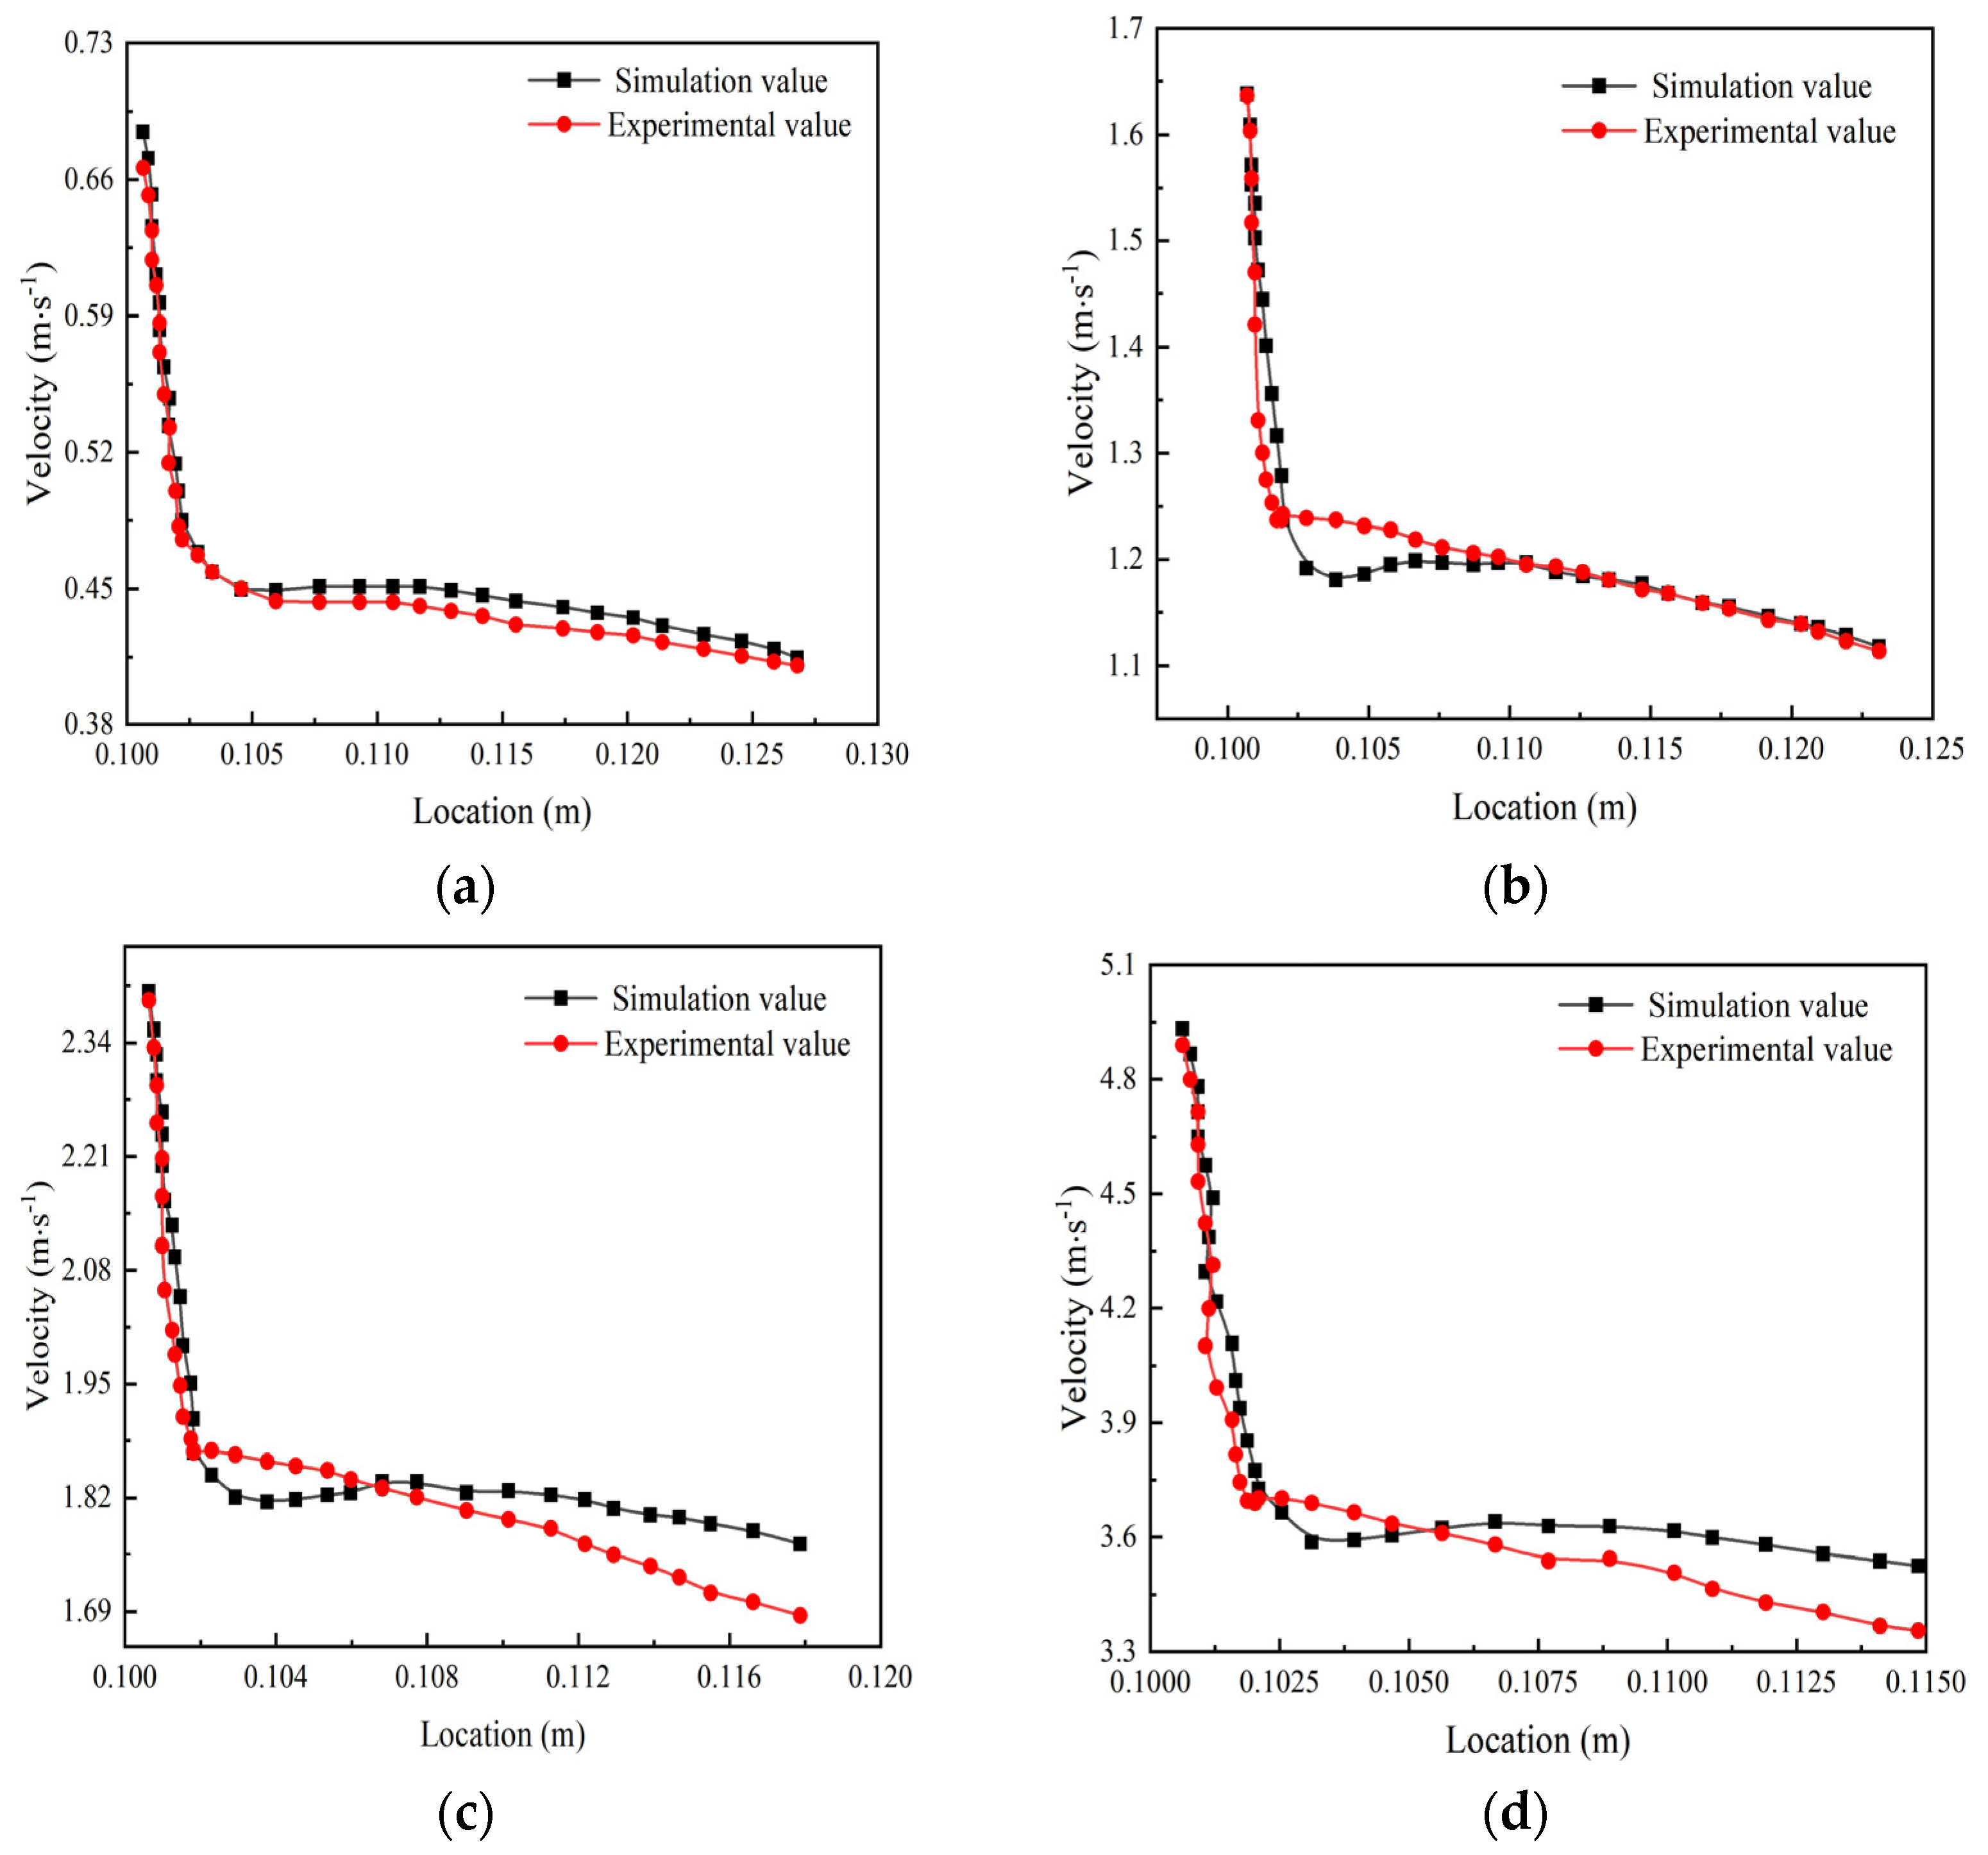
Due to the narrow sealing clearance, it is difficult to obtain accurate measurements of the velocity distribution of the fluid at the sealing clearance and rendering to measure the turbulence intensity at the sealing gap using the PIV test. In this study, we measured the velocity distributions along a horizontal line in the sealed cavity at different spindle speeds and compared these with the calculated values to verify the accuracy of the calculated flow field. Figure 16 shows the PIV flow field test experiment in the Key Laboratory of Fluid and Power Machinery, Ministry of Education, Xihua University. After removing the invalid test data and smoothing the curve, the experimental and simulation data exhibited the same general trend; however, the following differences were observed (Figure 17):
- (1)
- The vibration of the motor during the experimental test affects the fluid flow in the sealed cavity, thereby influencing the test results.
- (2)
- The surface roughness of the main shaft sealed cavity is not consistent with the parameters describing them in the simulation.
- (3)
- The machining problems during shaft design caused a slight eccentricity to the shaft.
- (4)
- As the sealed cavity interior is a circular wall, refraction occurs when the cavity is irradiated with the laser, which affects the images recorded by the camera.
- (5)
- To simplify the calculations, several programs were made on the software program during the simulation.
Nonetheless, the test and simulation values exhibit the same general trend, indicating that the simulation results are a reasonable approximation of the experimental conditions.
4. Conclusions
In the magnetic fluid rotary seal, the turbulent intensity at the magnetic fluid seal interface linearly decreases from the main axis in the radial direction. Assuming an axis diameter of 200 mm and rotation speed of less than 1000 rpm, the relationship between the maximum turbulence intensity and rotational speed at the sealing interface is given by y = 5.089 + 0.043x.
Structure slotting has an obvious effect on the maximum turbulence intensity at the sealing interface. The simulation shows that the optimal structure size has a groove length and depth 16 and 2 times the sealing clearance, respectively.
At rotation speeds ranging from 100–1000 rpm, the optimal groove structure reduces the maximum turbulence intensity at the sealing interface by more than 20%.
Compared to the TS, the OS increased the maximum magnetic induction intensity at the seal clearance (by 3.7%) and sealing capacity.
The flow state of the magnetoliquid sealing device itself is not fully considered owing to its small and opaque clearance. Future work will investigate the mechanism of the magnetic fluid movement during the rotary sealing by mixing the magnetic fluid with fluorescent agents of various colors to indirectly observe the motion of the magnetic fluid through the color change.
These current results provide a theoretical reference for the design and operation of magnetic liquid seals in liquid environments.
Author Contributions
Conceptualization, W.L. and Z.L.; methodology, W.L. and F.W.; software, W.L. and Z.W.; validation, Z.W., S.P. and L.X.; formal analysis, Z.W.; investigation, F.W.; resources, W.L.; data curation, W.L.; writing—original draft preparation, Z.W. and L.X.; writing—review and editing, W.L. and L.X.; visualization, W.L. and S.P.; supervision, W.L. and F.W.; project administration, W.L.; funding acquisition, Z.L. All authors have read and agreed to the published version of the manuscript.
Funding
The authors would like to acknowledge the support of the National Natural Science Foundation of China (Grant No.: 52079118), and the Science and Technology Department of Sichuan Province (Grant No.: 2020YFH0135).
Institutional Review Board Statement
Not applicable.
Informed Consent Statement
Not applicable.
Data Availability Statement
Not applicable.
Conflicts of Interest
The authors declare no conflict of interest.
References
- Yang, X.; Sun, P.; Hao, F. Magnetic field finite element analysis of diverging stepped ferrofluid seal with a large gap and two magnetic sources. Int. J. Appl. Electromagn. Mech. 2020, 63, 31–44. [Google Scholar] [CrossRef]
- Merklein, M.; Rösel, S. Characterization of a magnetorheological fluid with respect to its suitability for hydroforming. Int. J. Mater. Form. 2010, 3, 283–286. [Google Scholar] [CrossRef]
- Biao, X.; Yiping, L.; Hongjuan, R. Review on magnetorheological fluid and its application. Am. J. Nanosci. Nanotechnol. 2014, 2, 70–74. [Google Scholar] [CrossRef]
- Moskowitz, R. Dynamic sealing with magnetic fluids. ASLE Trans. 1975, 18, 135–143. [Google Scholar] [CrossRef]
- Zhou, H.; Zhao, W.; Zhang, H.; Wang, Y.; Wu, X.; Sun, Z. Magnetorheological seal: A review. Int. J. Appl. Electromagn. Mech. 2020, 62, 763–786. [Google Scholar] [CrossRef]
- Liu, T.; Cheng, Y.; Yang, Z. Design optimization of seal structure for sealing liquid by magnetic fluids. J. Magn. Mater. 2005, 289, 411–414. [Google Scholar] [CrossRef]
- van der Wal, K.; van Ostayen, R.A.J.; Lampaert, S.G.E. Ferrofluid rotary seal with replenishment system for sealing liquids. Tribol. Int. 2020, 150, 106372. [Google Scholar] [CrossRef]
- He, X.; Miao, Y.; Li, W.; Li, D. Latest development in sealing of liquid medium with magnetic fluid. Chin. J. Vac. Sci. Technol. 2019, 39, 361–366. [Google Scholar]
- Szczech, M.; Horak, W. Tightness testing of rotary ferromagnetic fluid seal working in water environment. Ind. Lubr. Tribol. 2015, 67, 455–459. [Google Scholar] [CrossRef]
- Qian, J. Study on Stability of Dynamic Interface in Magnetic Fluid Seal Liquid. Ph.D. Thesis, China University of Mining and Technology, Xuzhou, China, 2009. [Google Scholar]
- Raj, N.; Karthick, S. Characterization of Rayleigh–Taylor instability at the fluid–fluid interface. Trends. Mech. Biomed. Des. 2021, 401–415. [Google Scholar] [CrossRef]
- Zhang, H.H.; Zheng, C.; Aubry, N.; Wu, W.T.; Chen, Z.H. Numerical analysis of Richtmyer-Meshkov instability of circular density interface in presence of transverse magnetic field. Phys. Fluids 2020, 32, 116104. [Google Scholar] [CrossRef]
- Cao, J.; Wu, Z.; Ren, H.; Li, D. Effects of shear flow and transverse magnetic field on Richtmyer-Meshkov instability. Phys. Plasmas. 2008, 15, 042102. [Google Scholar] [CrossRef]
- Völkel, A.; Kögel, A.; Richter, R. Measuring the Kelvin-Helmholtz instability, stabilized by a tangential magnetic field. J. Magn. Mater. 2020, 505. [Google Scholar] [CrossRef]
- Foroutan, H.; Yavuzkurt, S. Partially averaged Navier-Stokes modeling of turbulent swirling flow. In Proceedings of the APS Division of Fluid Dynamics Meeting Abstracts, Pittsburgh, PA, USA, 24–26 November 2013; p. 1A-039. [Google Scholar]
- Deng, W.Q.; Pan, S.Y.; Li, Z.G.; Huang, M. Experimental study on flow characteristics of natural gas pipelines based on PIV. J. Eng. Thermal. Energy Power 2020, 35, 171–177. [Google Scholar]
- Meng, Z.; Jibin, Z.; Jianhui, H. An analysis on the magnetic fluid seal capacity. J. Magn. Mater. 2006, 303, e428–e431. [Google Scholar] [CrossRef]
- Szczęch, M. Magnetic fluid seal critical pressure calculation based on numerical simulations. Simulation 2020, 96, 403–413. [Google Scholar] [CrossRef]
- Qian, J.G.; Yang, Z.Y. Characteristics of a magnetic fluid seal and its motion in an axial variable seal gap. J. China Univ. Min. Technol. 2008, 18, 634–636. [Google Scholar] [CrossRef]
- Yang, X.; Wang, G.; Zhang, R. Magnetic circuit design and magnetic field finite element analysis of converging stepped magnetofluid seal with small clearance. Adv. Mater. Sci. Eng. 2020, 2020, 4201891. [Google Scholar] [CrossRef]
- Yang, X.L.; Li, D.C.; He, X.Z.; Zhang, H.T. Numerical and experimental studies of alternative combined magnetic fluid and labyrinth seal with large gap. J. Mech. Eng. 2014, 50, 175–179. [Google Scholar] [CrossRef]
Figure 1.
Model parameters.

Figure 2.
Schematic of the magnetic fluid sealing devices ((a): Traditional structure. (b): Optimization structure.).
Figure 2.
Schematic of the magnetic fluid sealing devices ((a): Traditional structure. (b): Optimization structure.).

Figure 3.
Grid model.
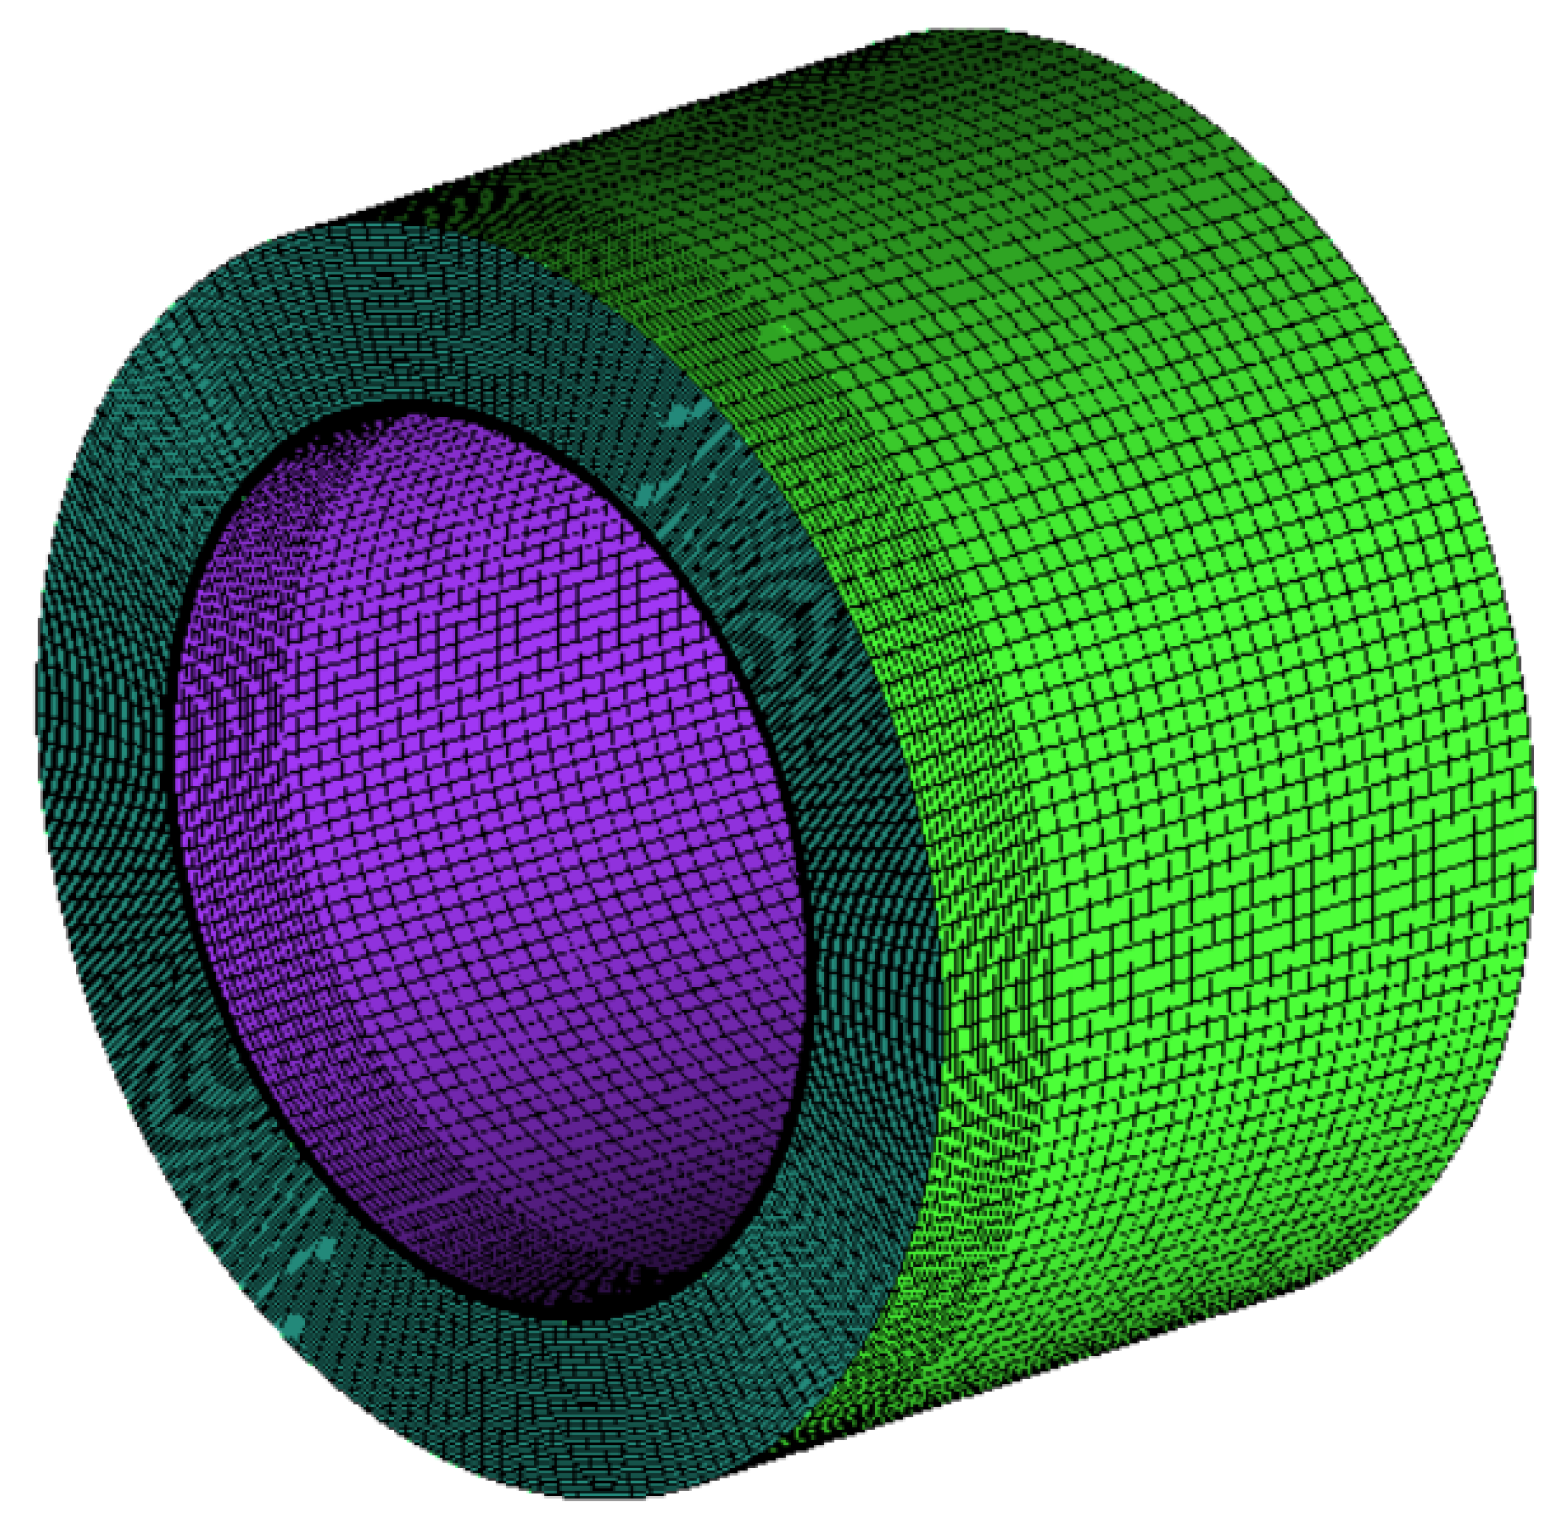
Figure 4.
Flow field diagram in the sealed cavity at 1000 rpm.
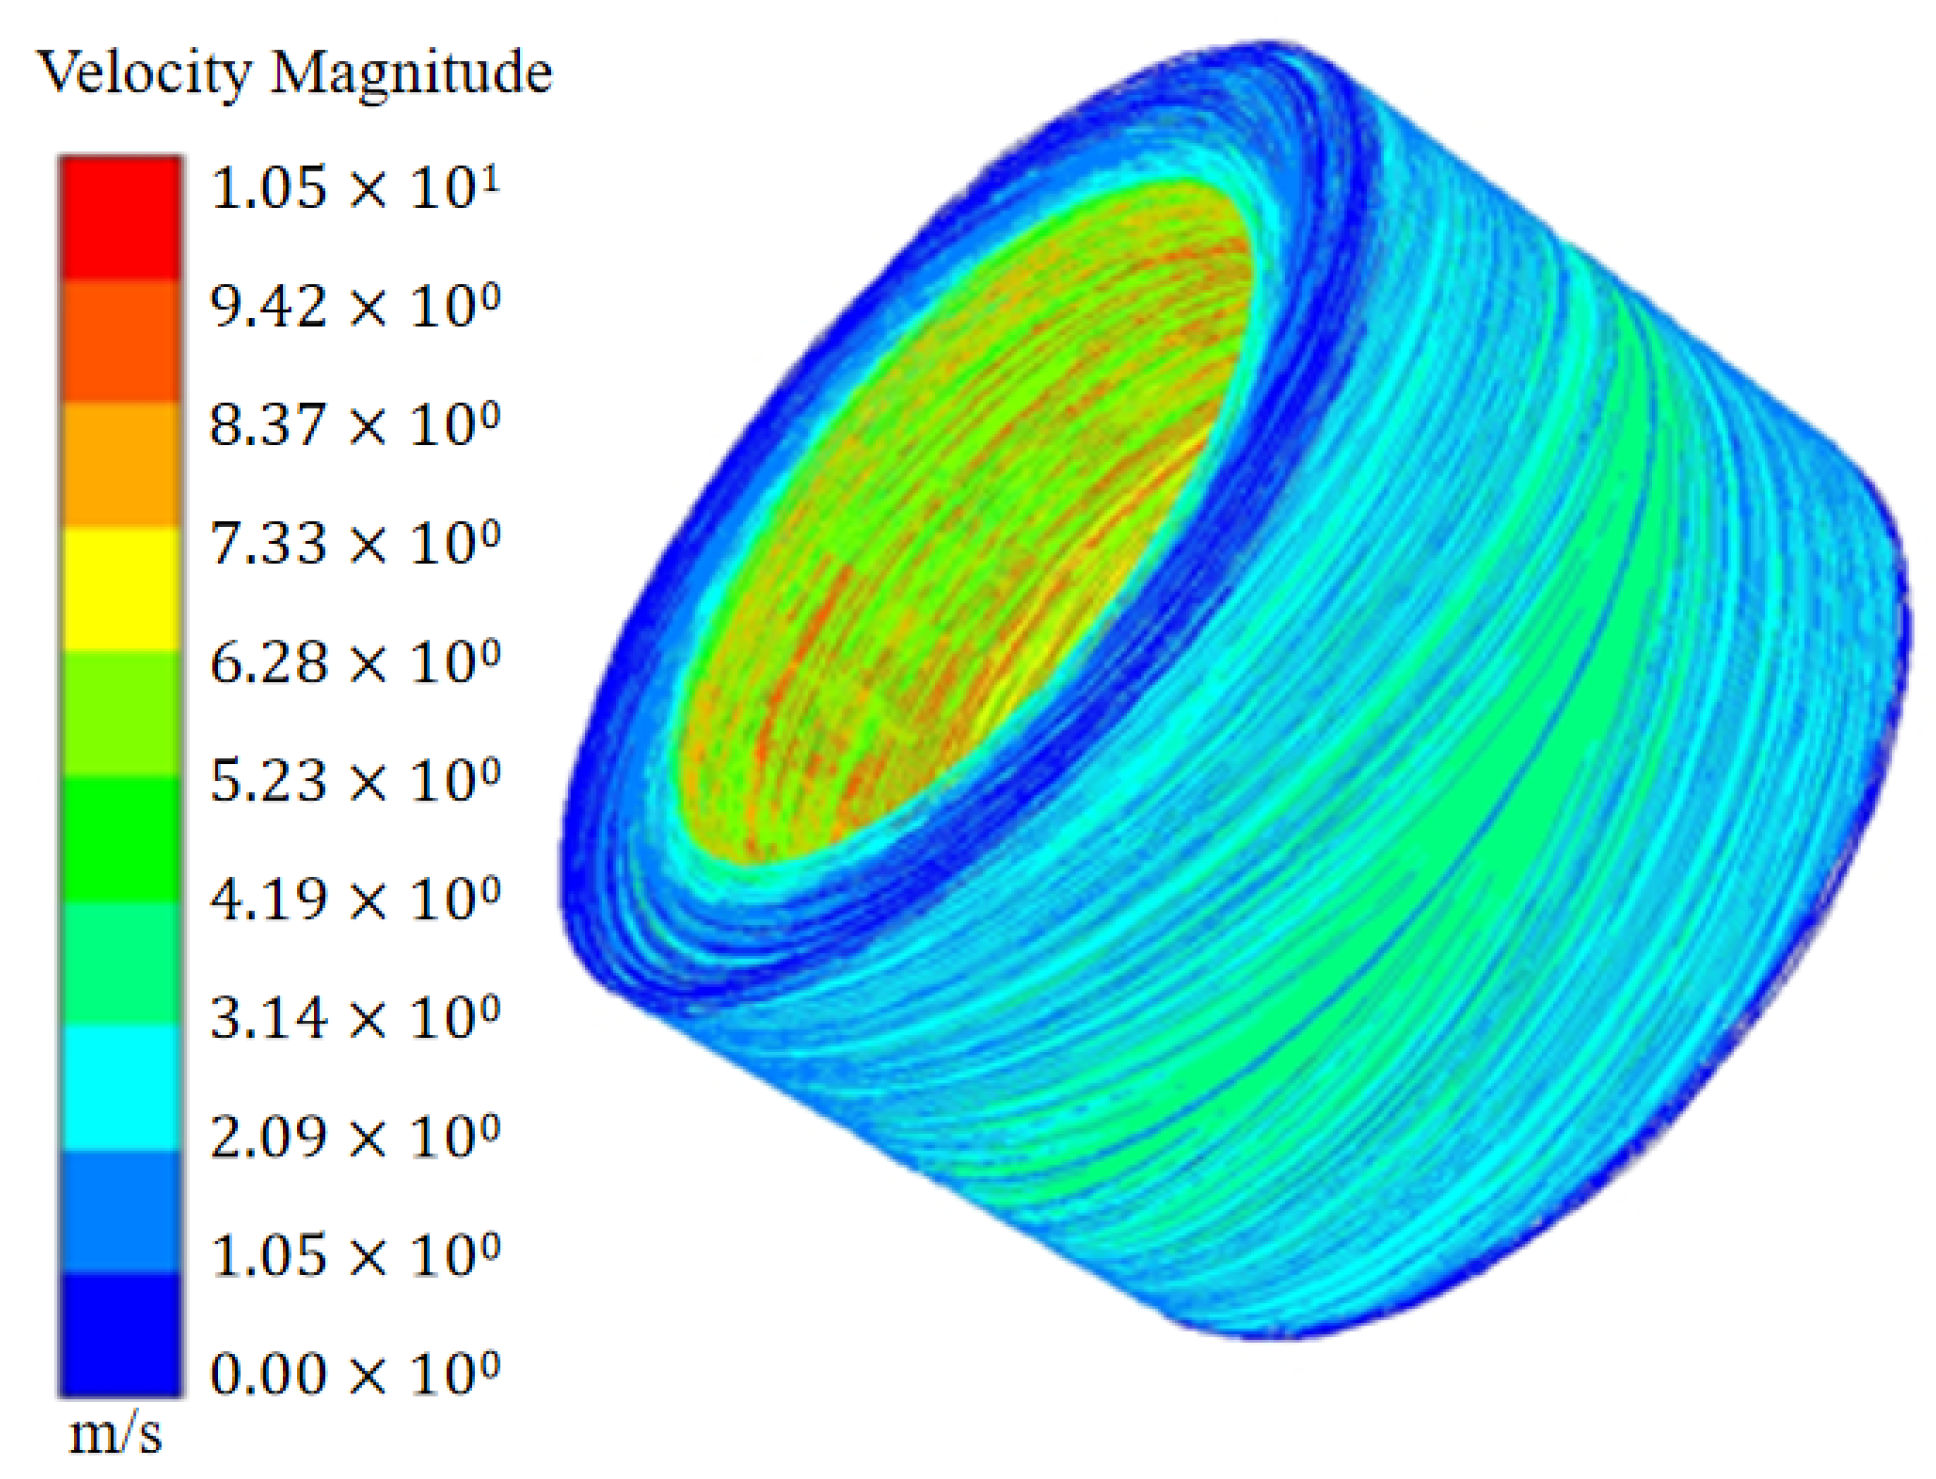
Figure 5.
Turbulence intensity distribution at the interface of the TS under different speeds.
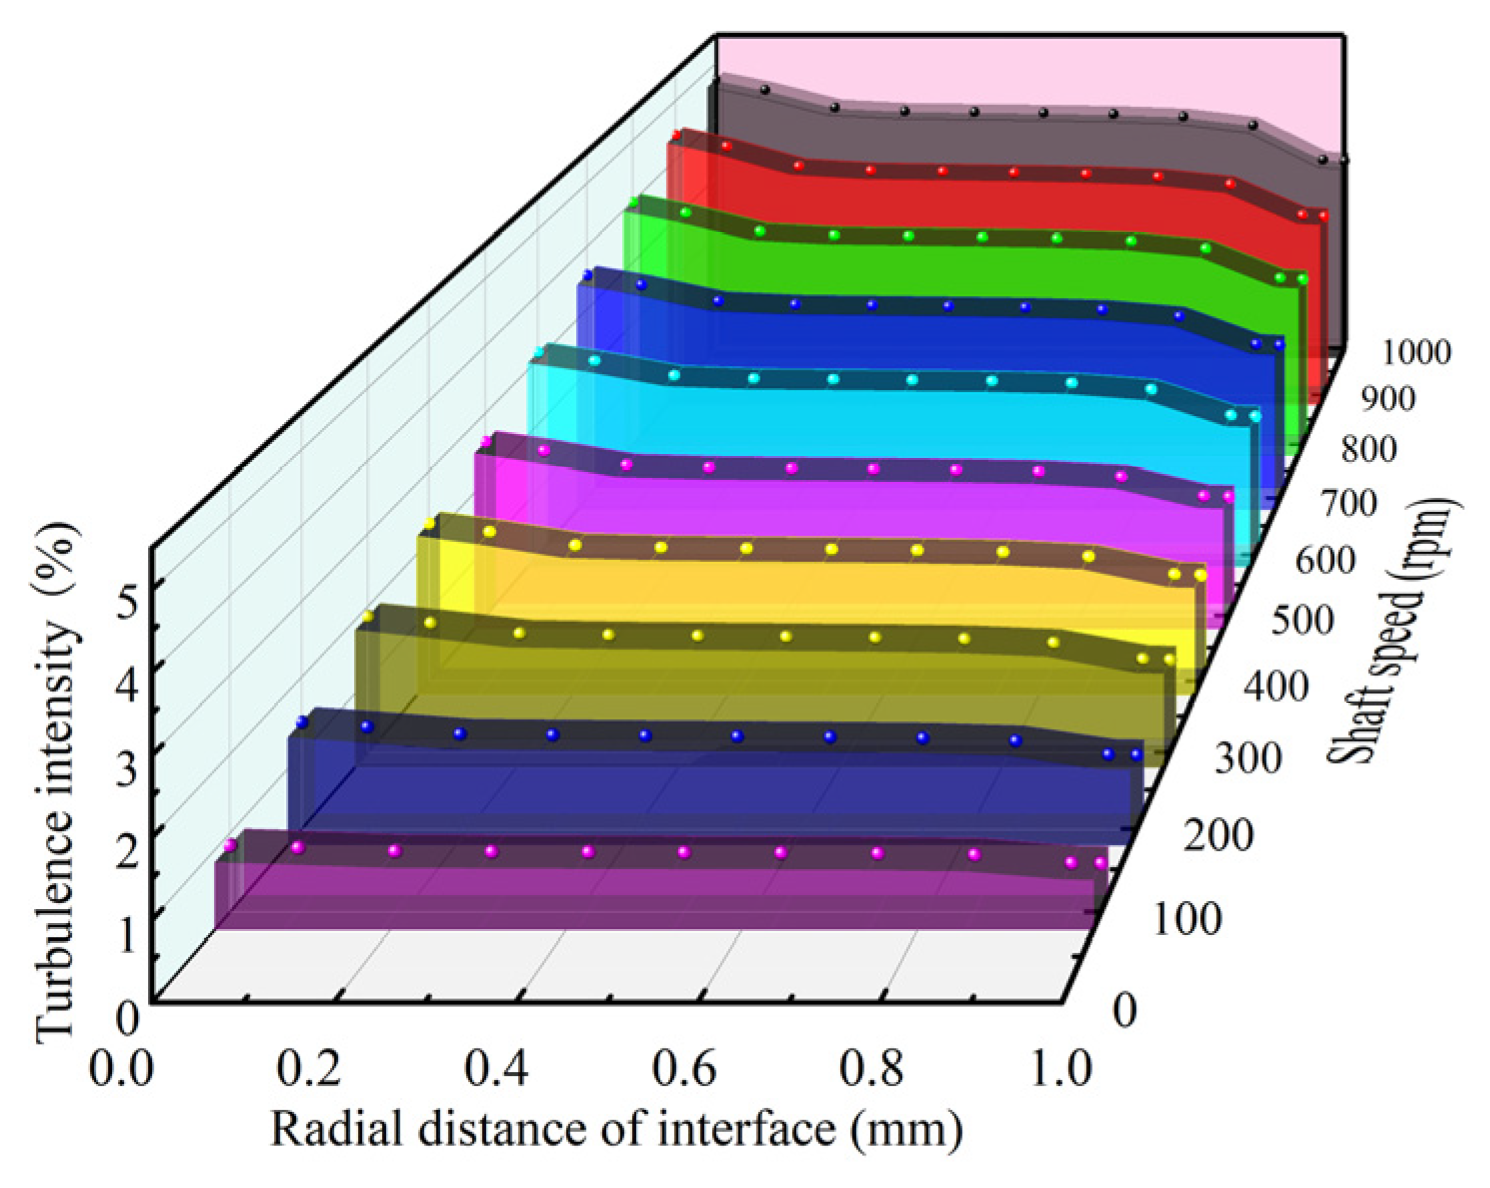
Figure 6.
Relationship between the maximum turbulence intensity and rotational speed.

Figure 7.
Influence of the slotting depth at the same rotational speed on the turbulence intensity at the axial interface. (a) Shaft speed 100 rpm, (b) Shaft speed 300 rpm, (c) Shaft speed 500 rpm, (d) Shaft speed 1000 rpm.
Figure 7.
Influence of the slotting depth at the same rotational speed on the turbulence intensity at the axial interface. (a) Shaft speed 100 rpm, (b) Shaft speed 300 rpm, (c) Shaft speed 500 rpm, (d) Shaft speed 1000 rpm.

Figure 8.
Effect of the slotting length on the turbulence intensity at the axial interface. (a) Shaft speed 100 rpm, (b) Shaft speed 300 rpm, (c) Shaft speed 500 rpm, (d) Shaft speed 1000 rpm.
Figure 8.
Effect of the slotting length on the turbulence intensity at the axial interface. (a) Shaft speed 100 rpm, (b) Shaft speed 300 rpm, (c) Shaft speed 500 rpm, (d) Shaft speed 1000 rpm.
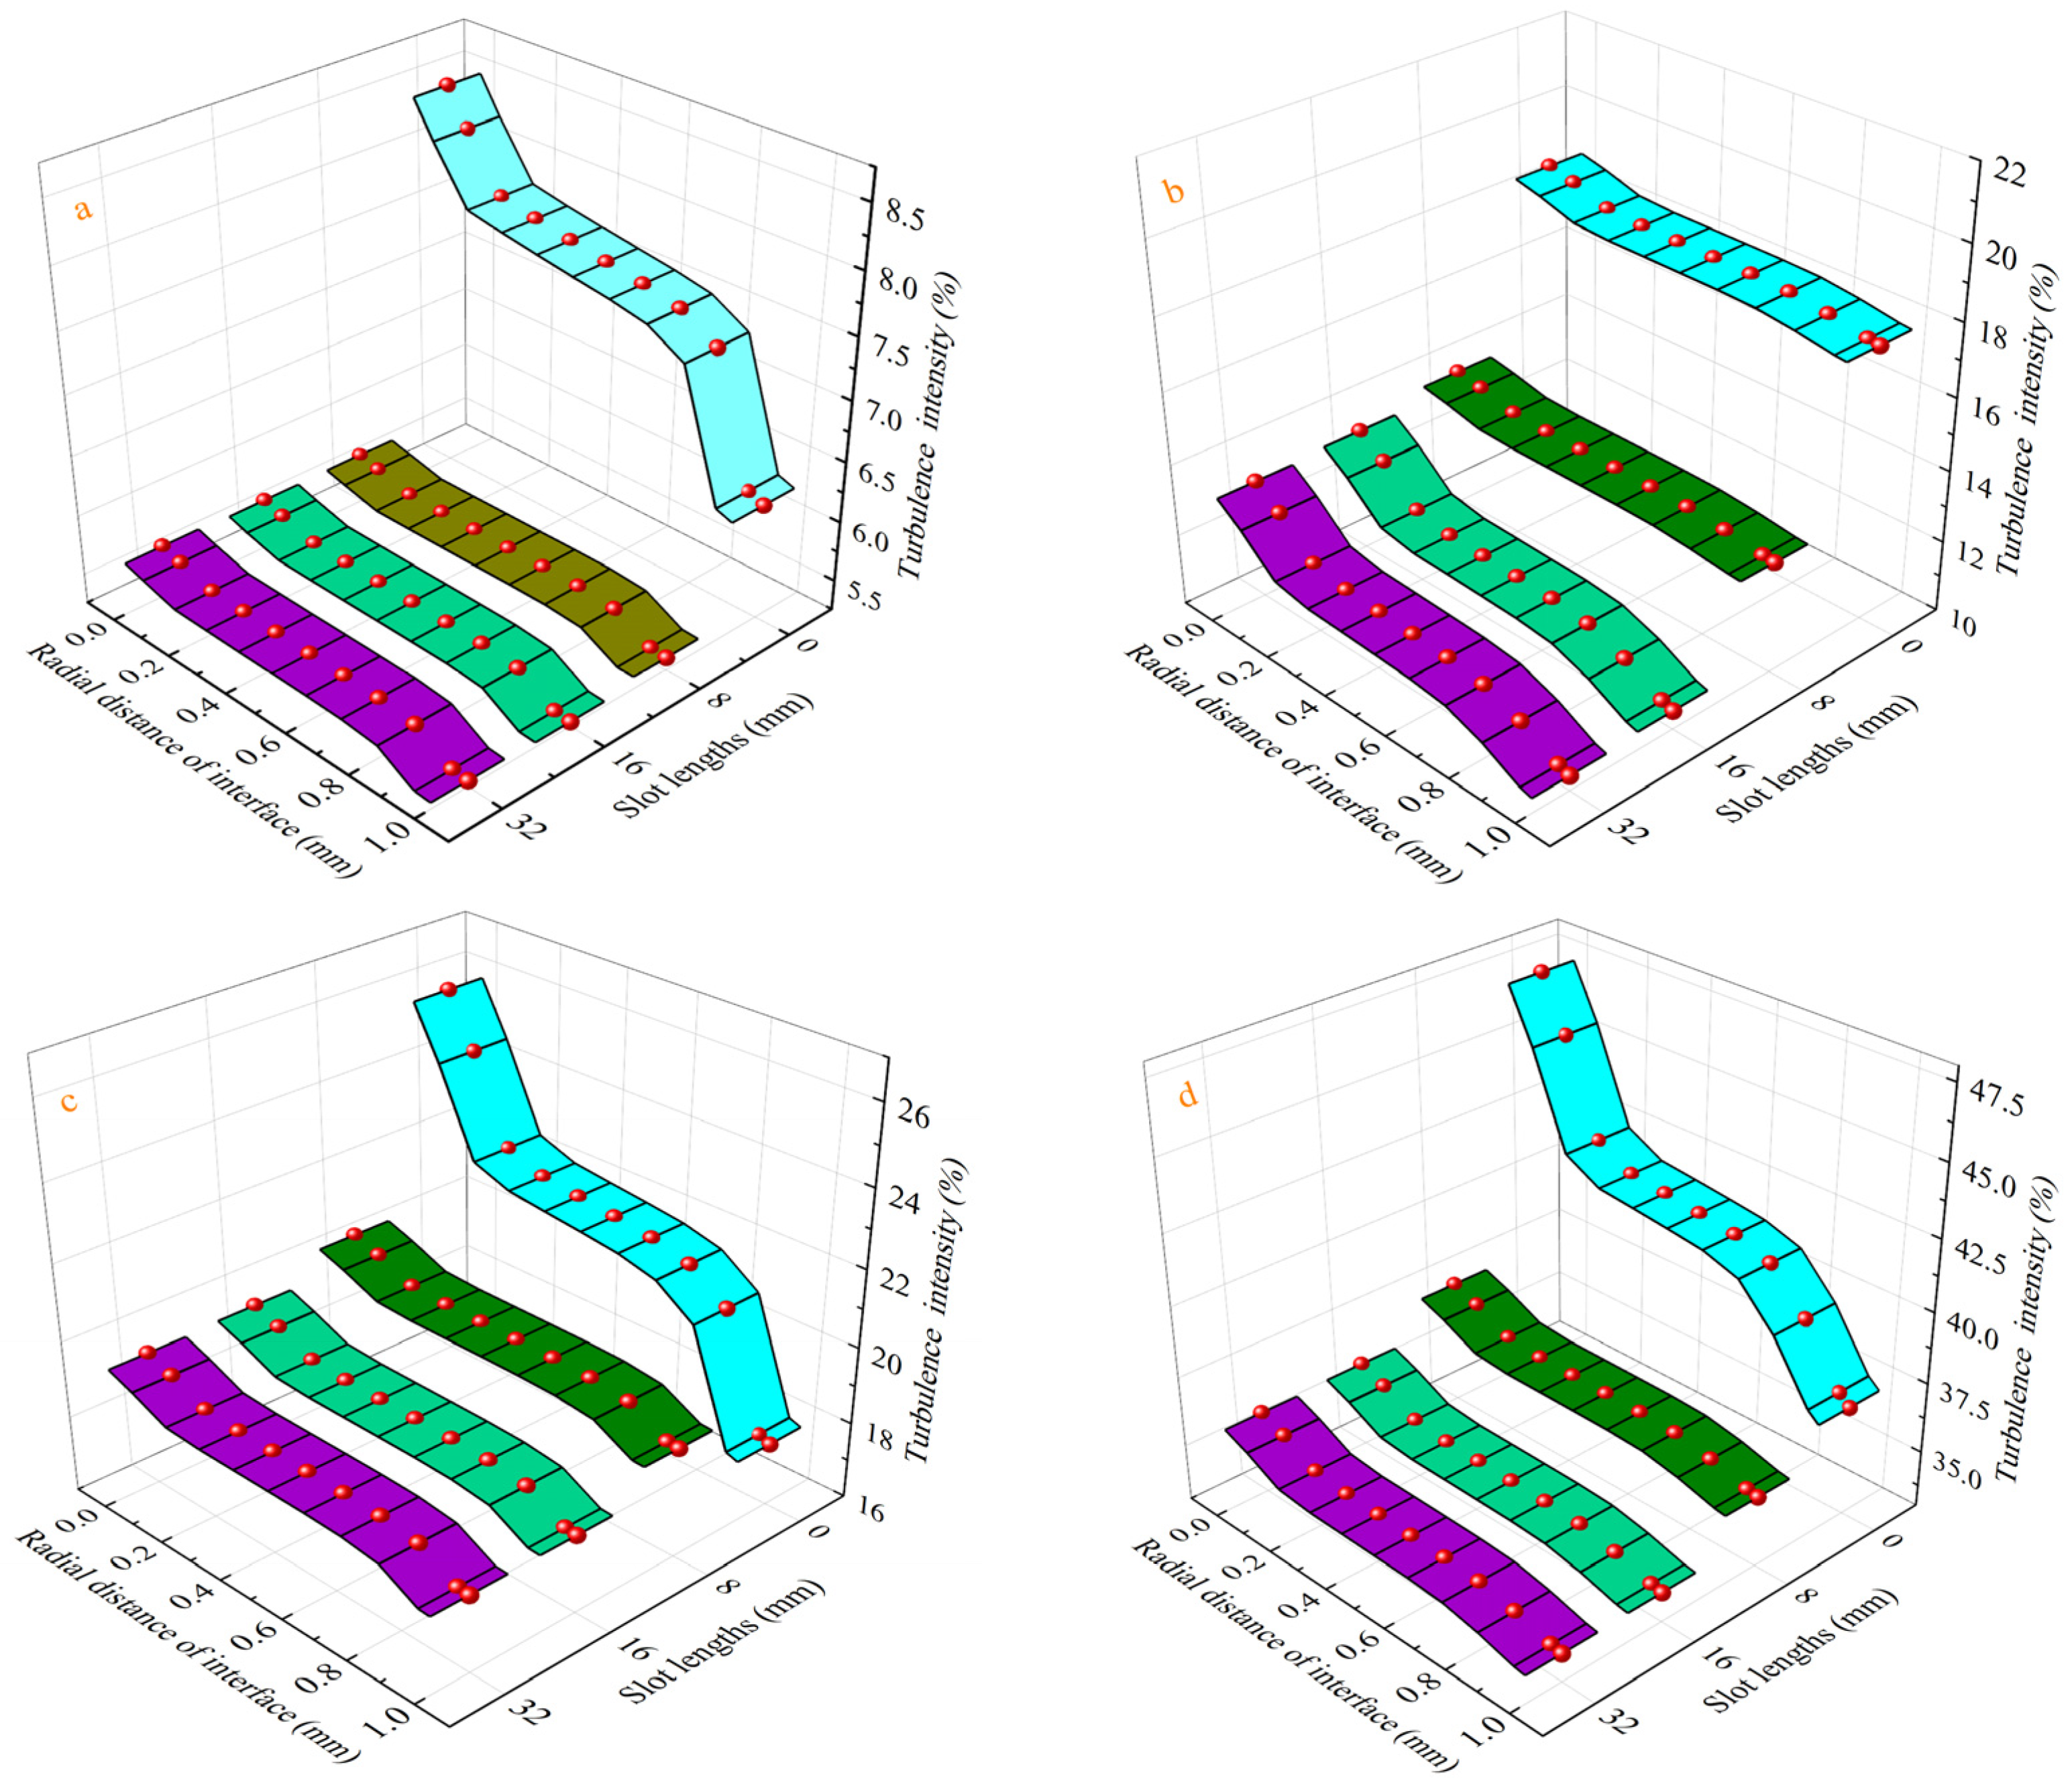
Figure 9.
Vorticity cloud diagram. (a) 2 SD, 8 SL; (b) 2 SD, 16 SL; (c) 2 SD, 32 SL.
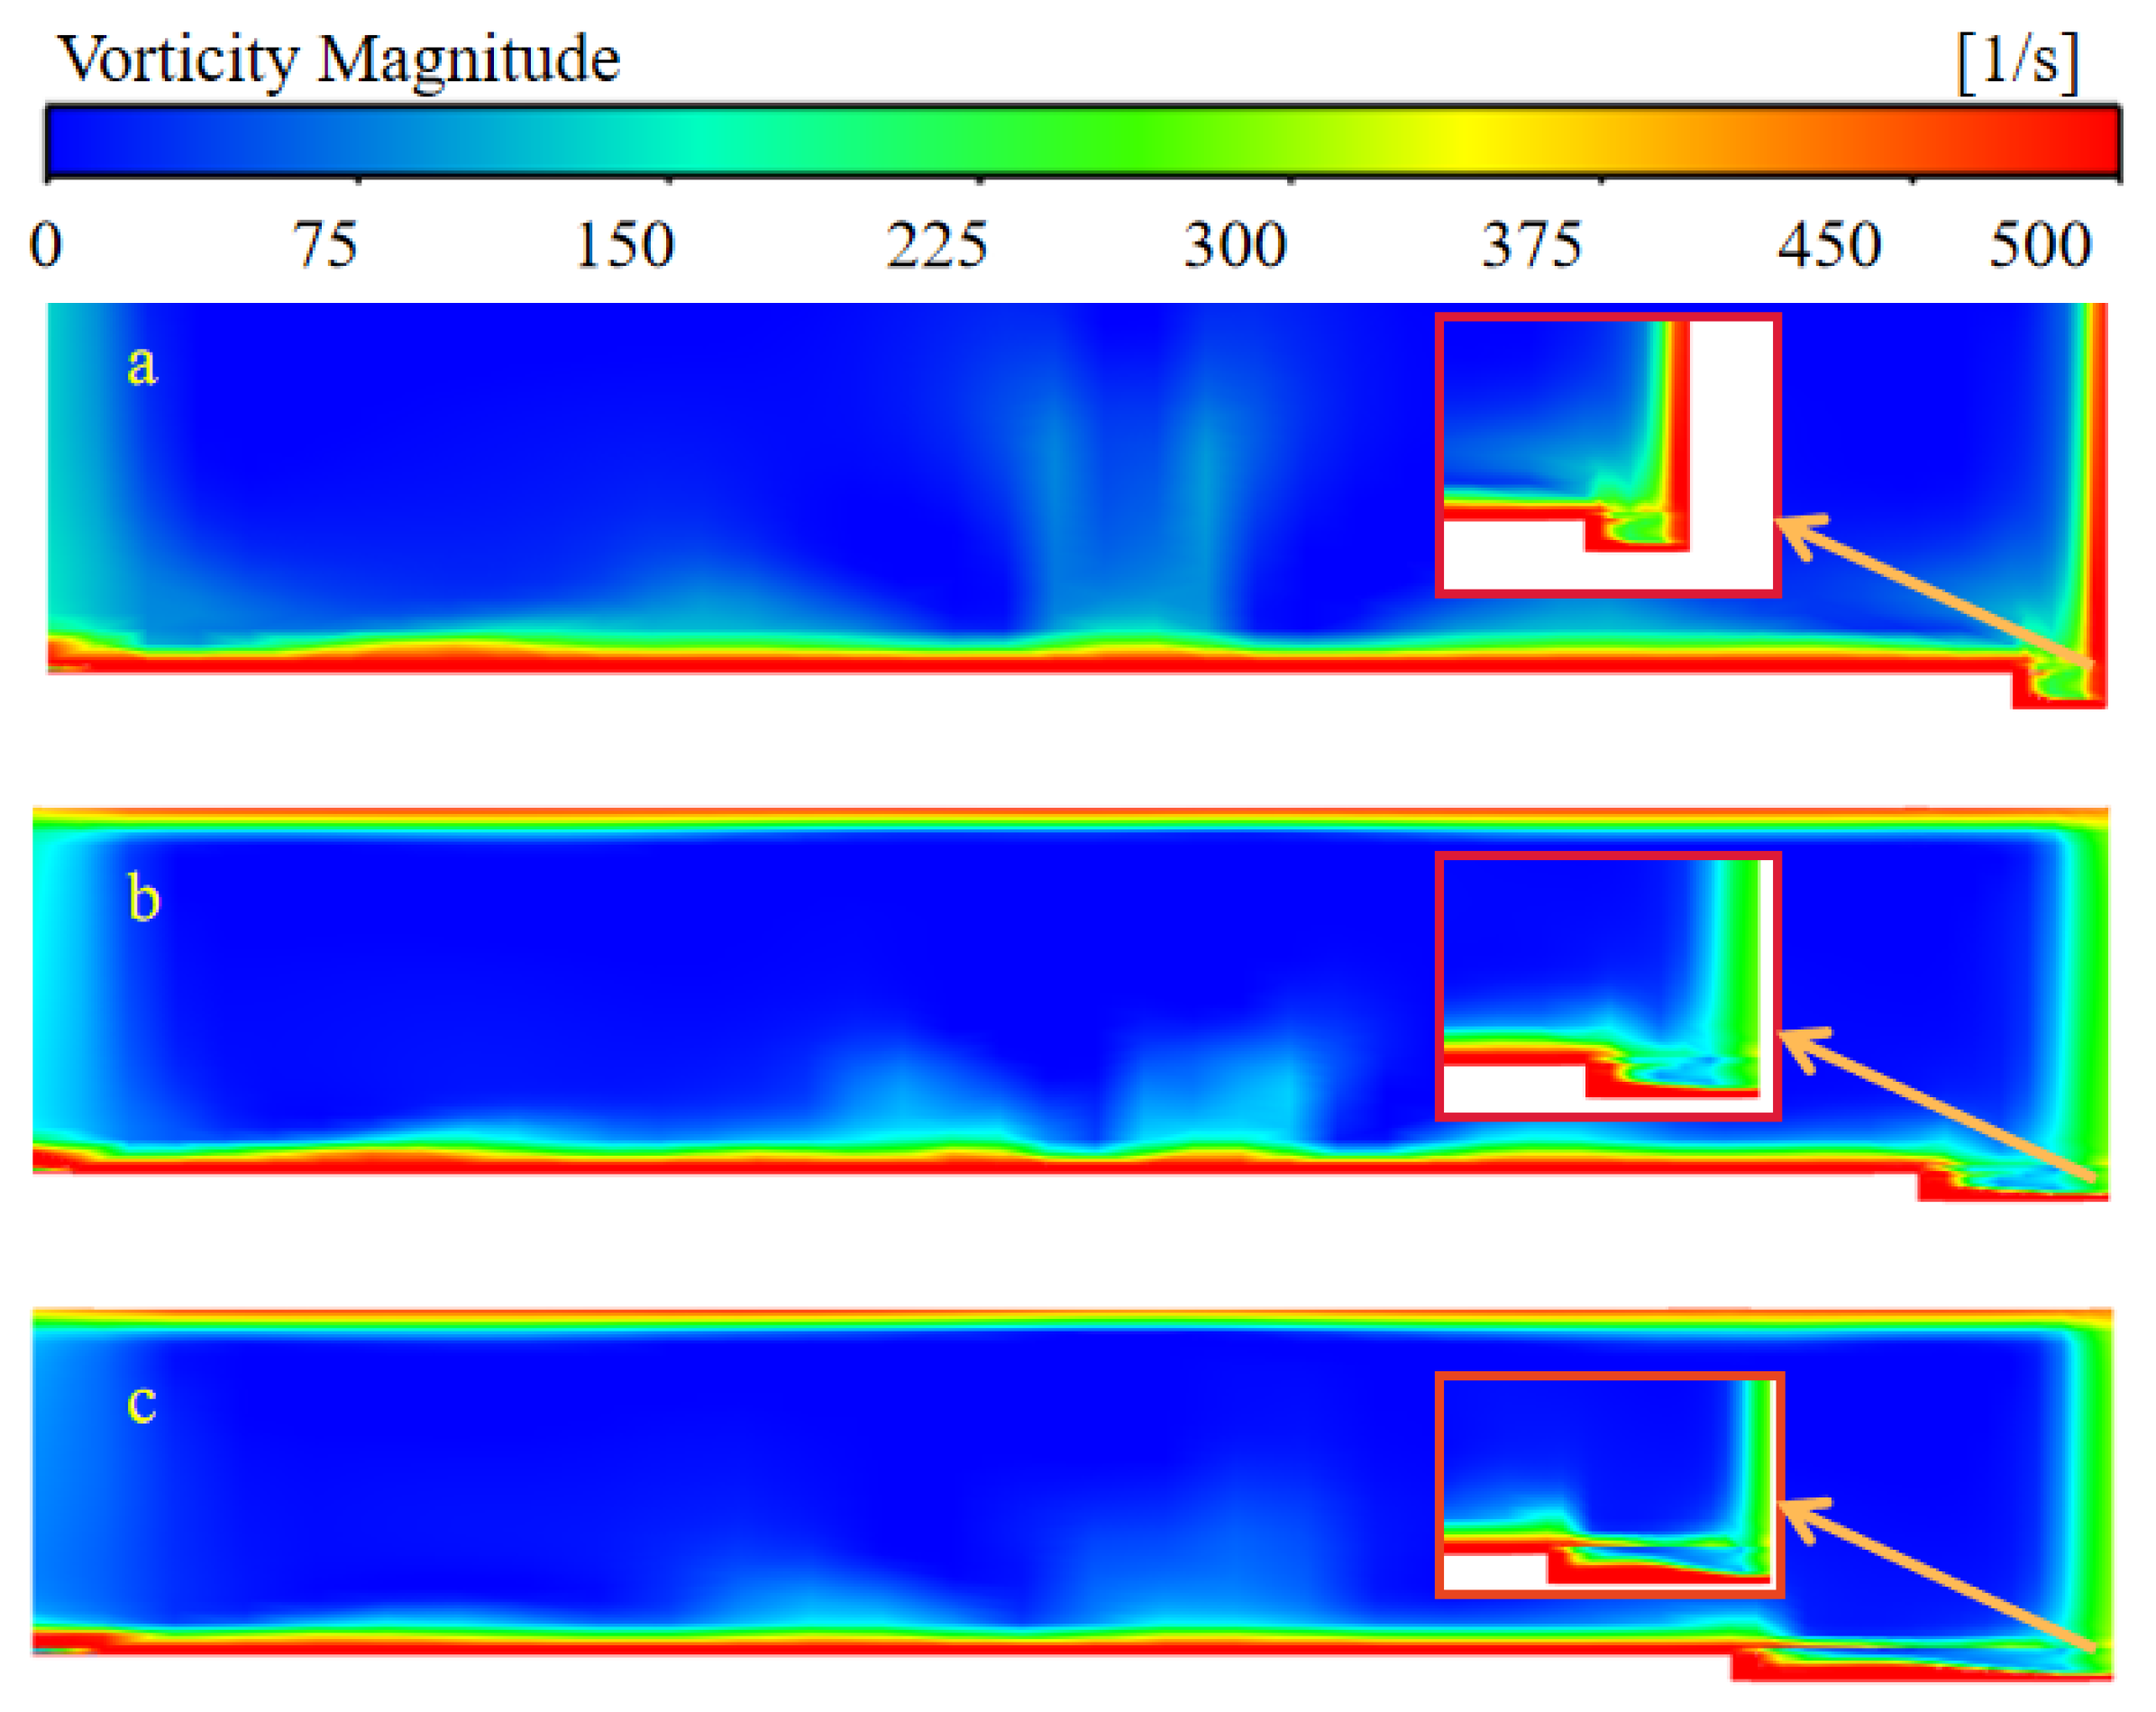
Figure 10.
Relationship between the effect value of the optimal structure and rotational speed.
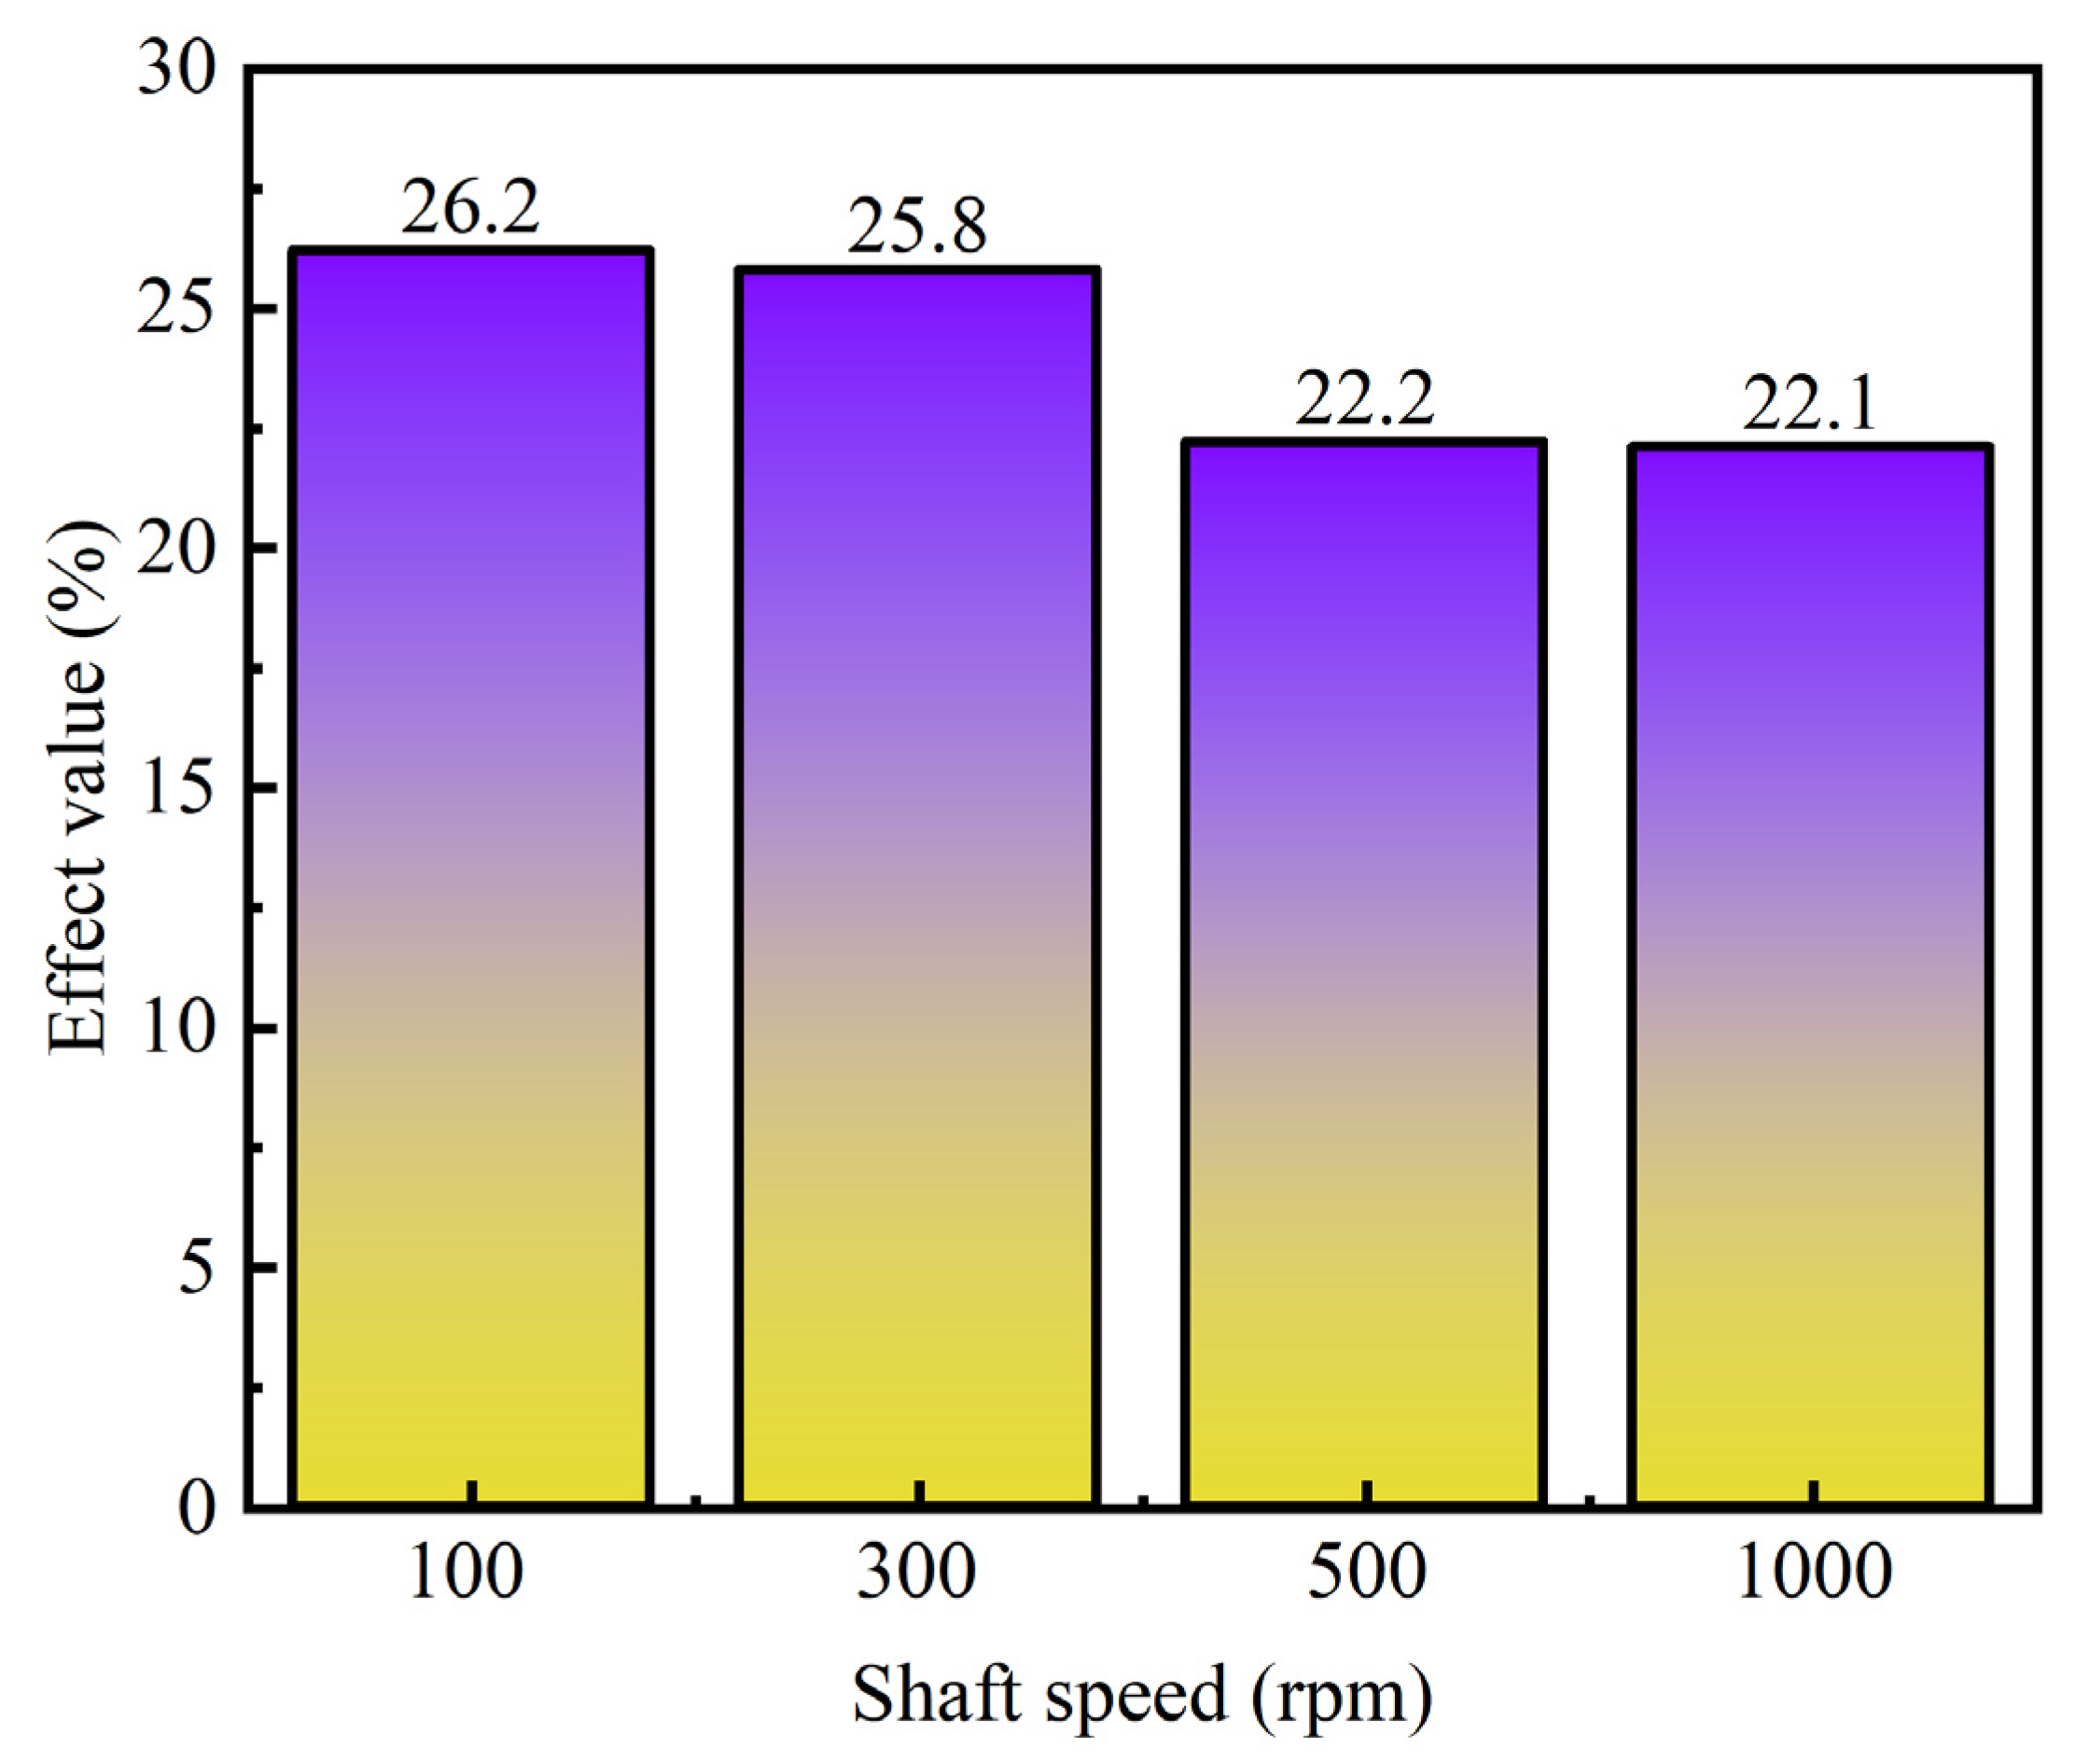
Figure 11.
B–H curve of AISI 1008 steel.
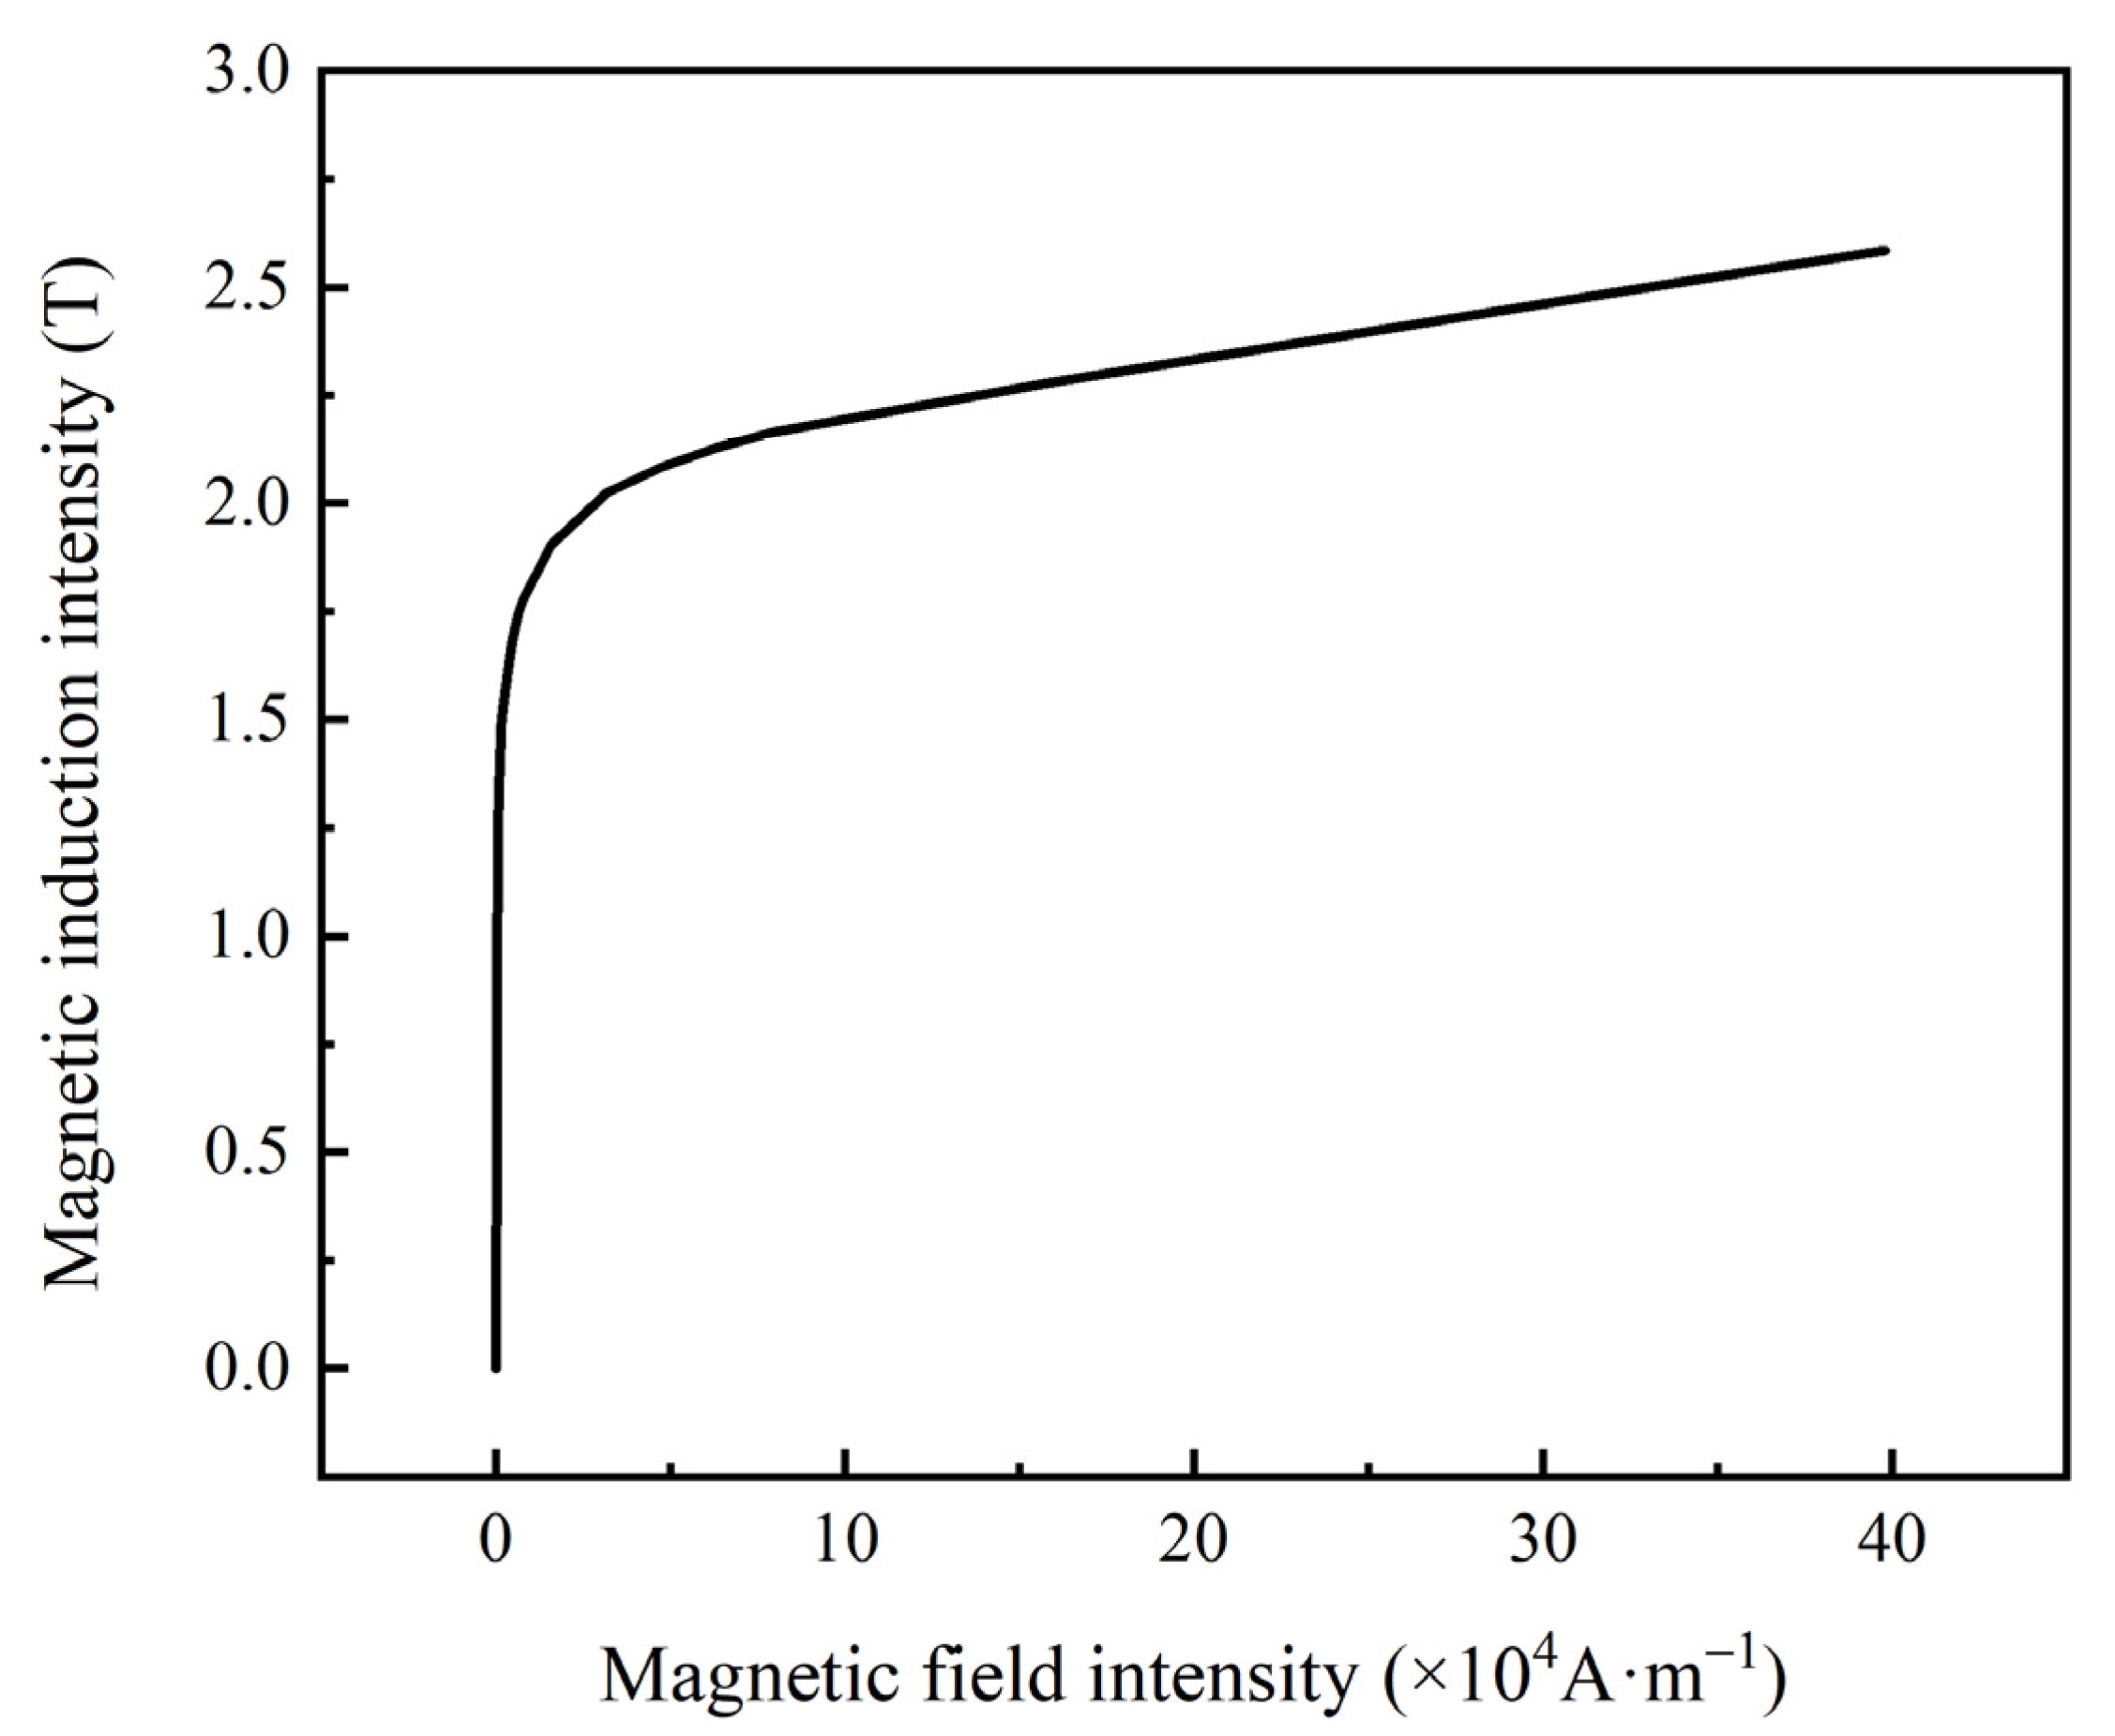
Figure 12.
Contrast of the magnetic induction intensity in the sealing gap.
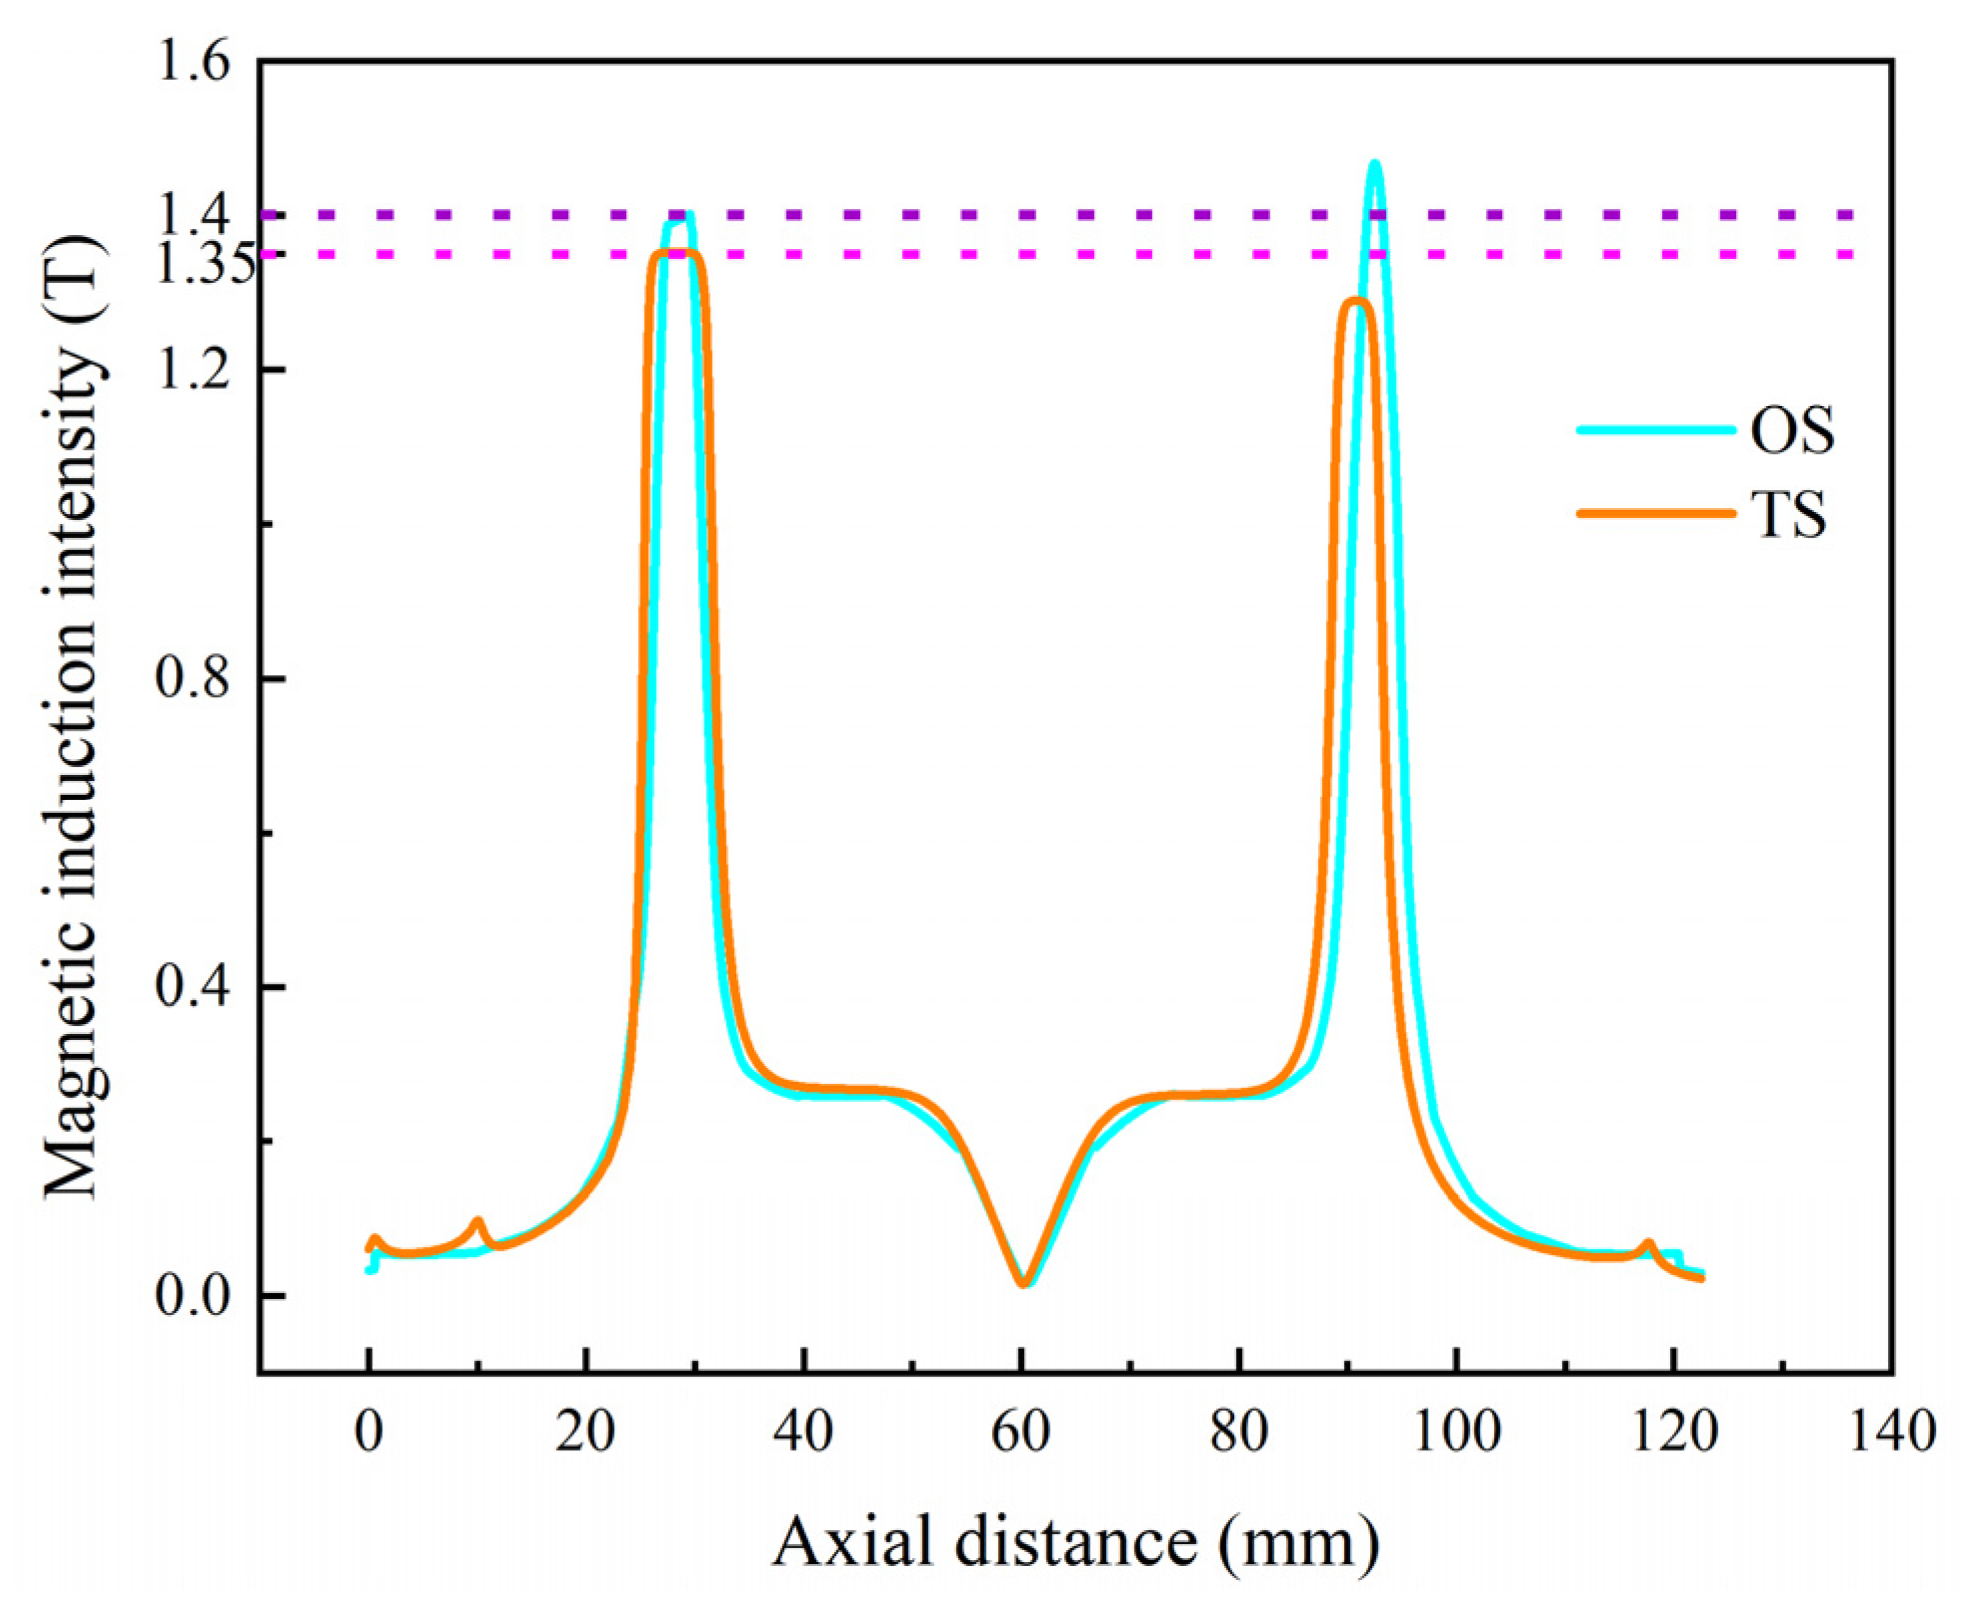
Figure 13.
Schematic of the test device.
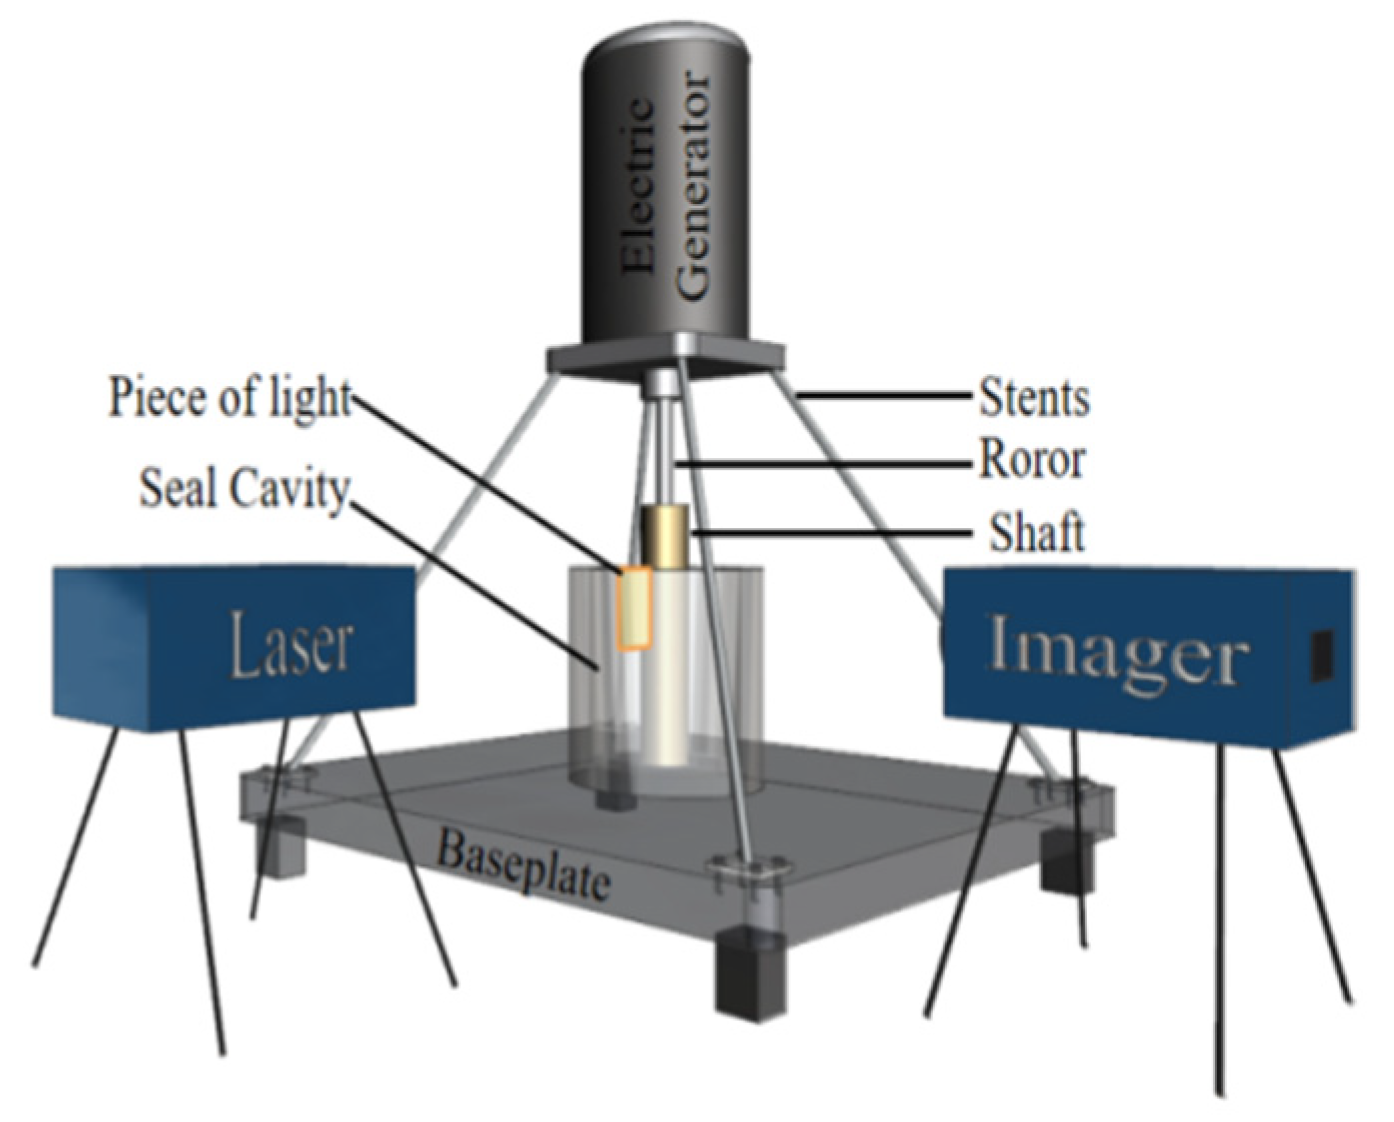
Figure 14.
Query area.
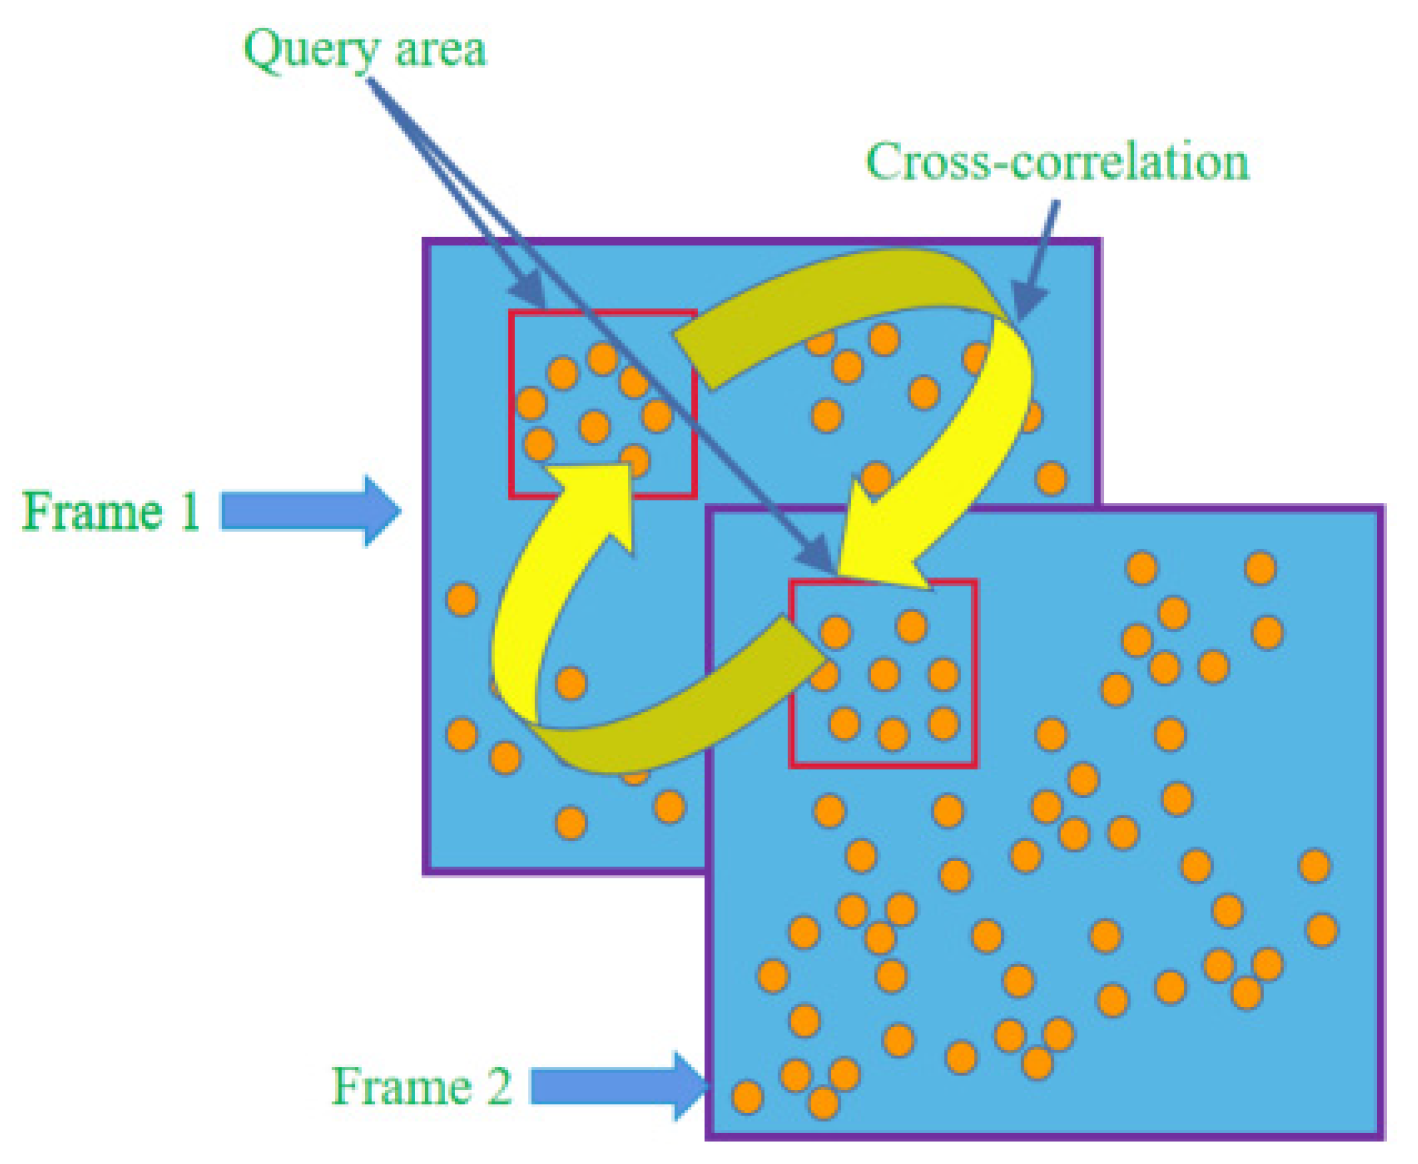
Figure 15.
Relation curve between the laser intensity and time.
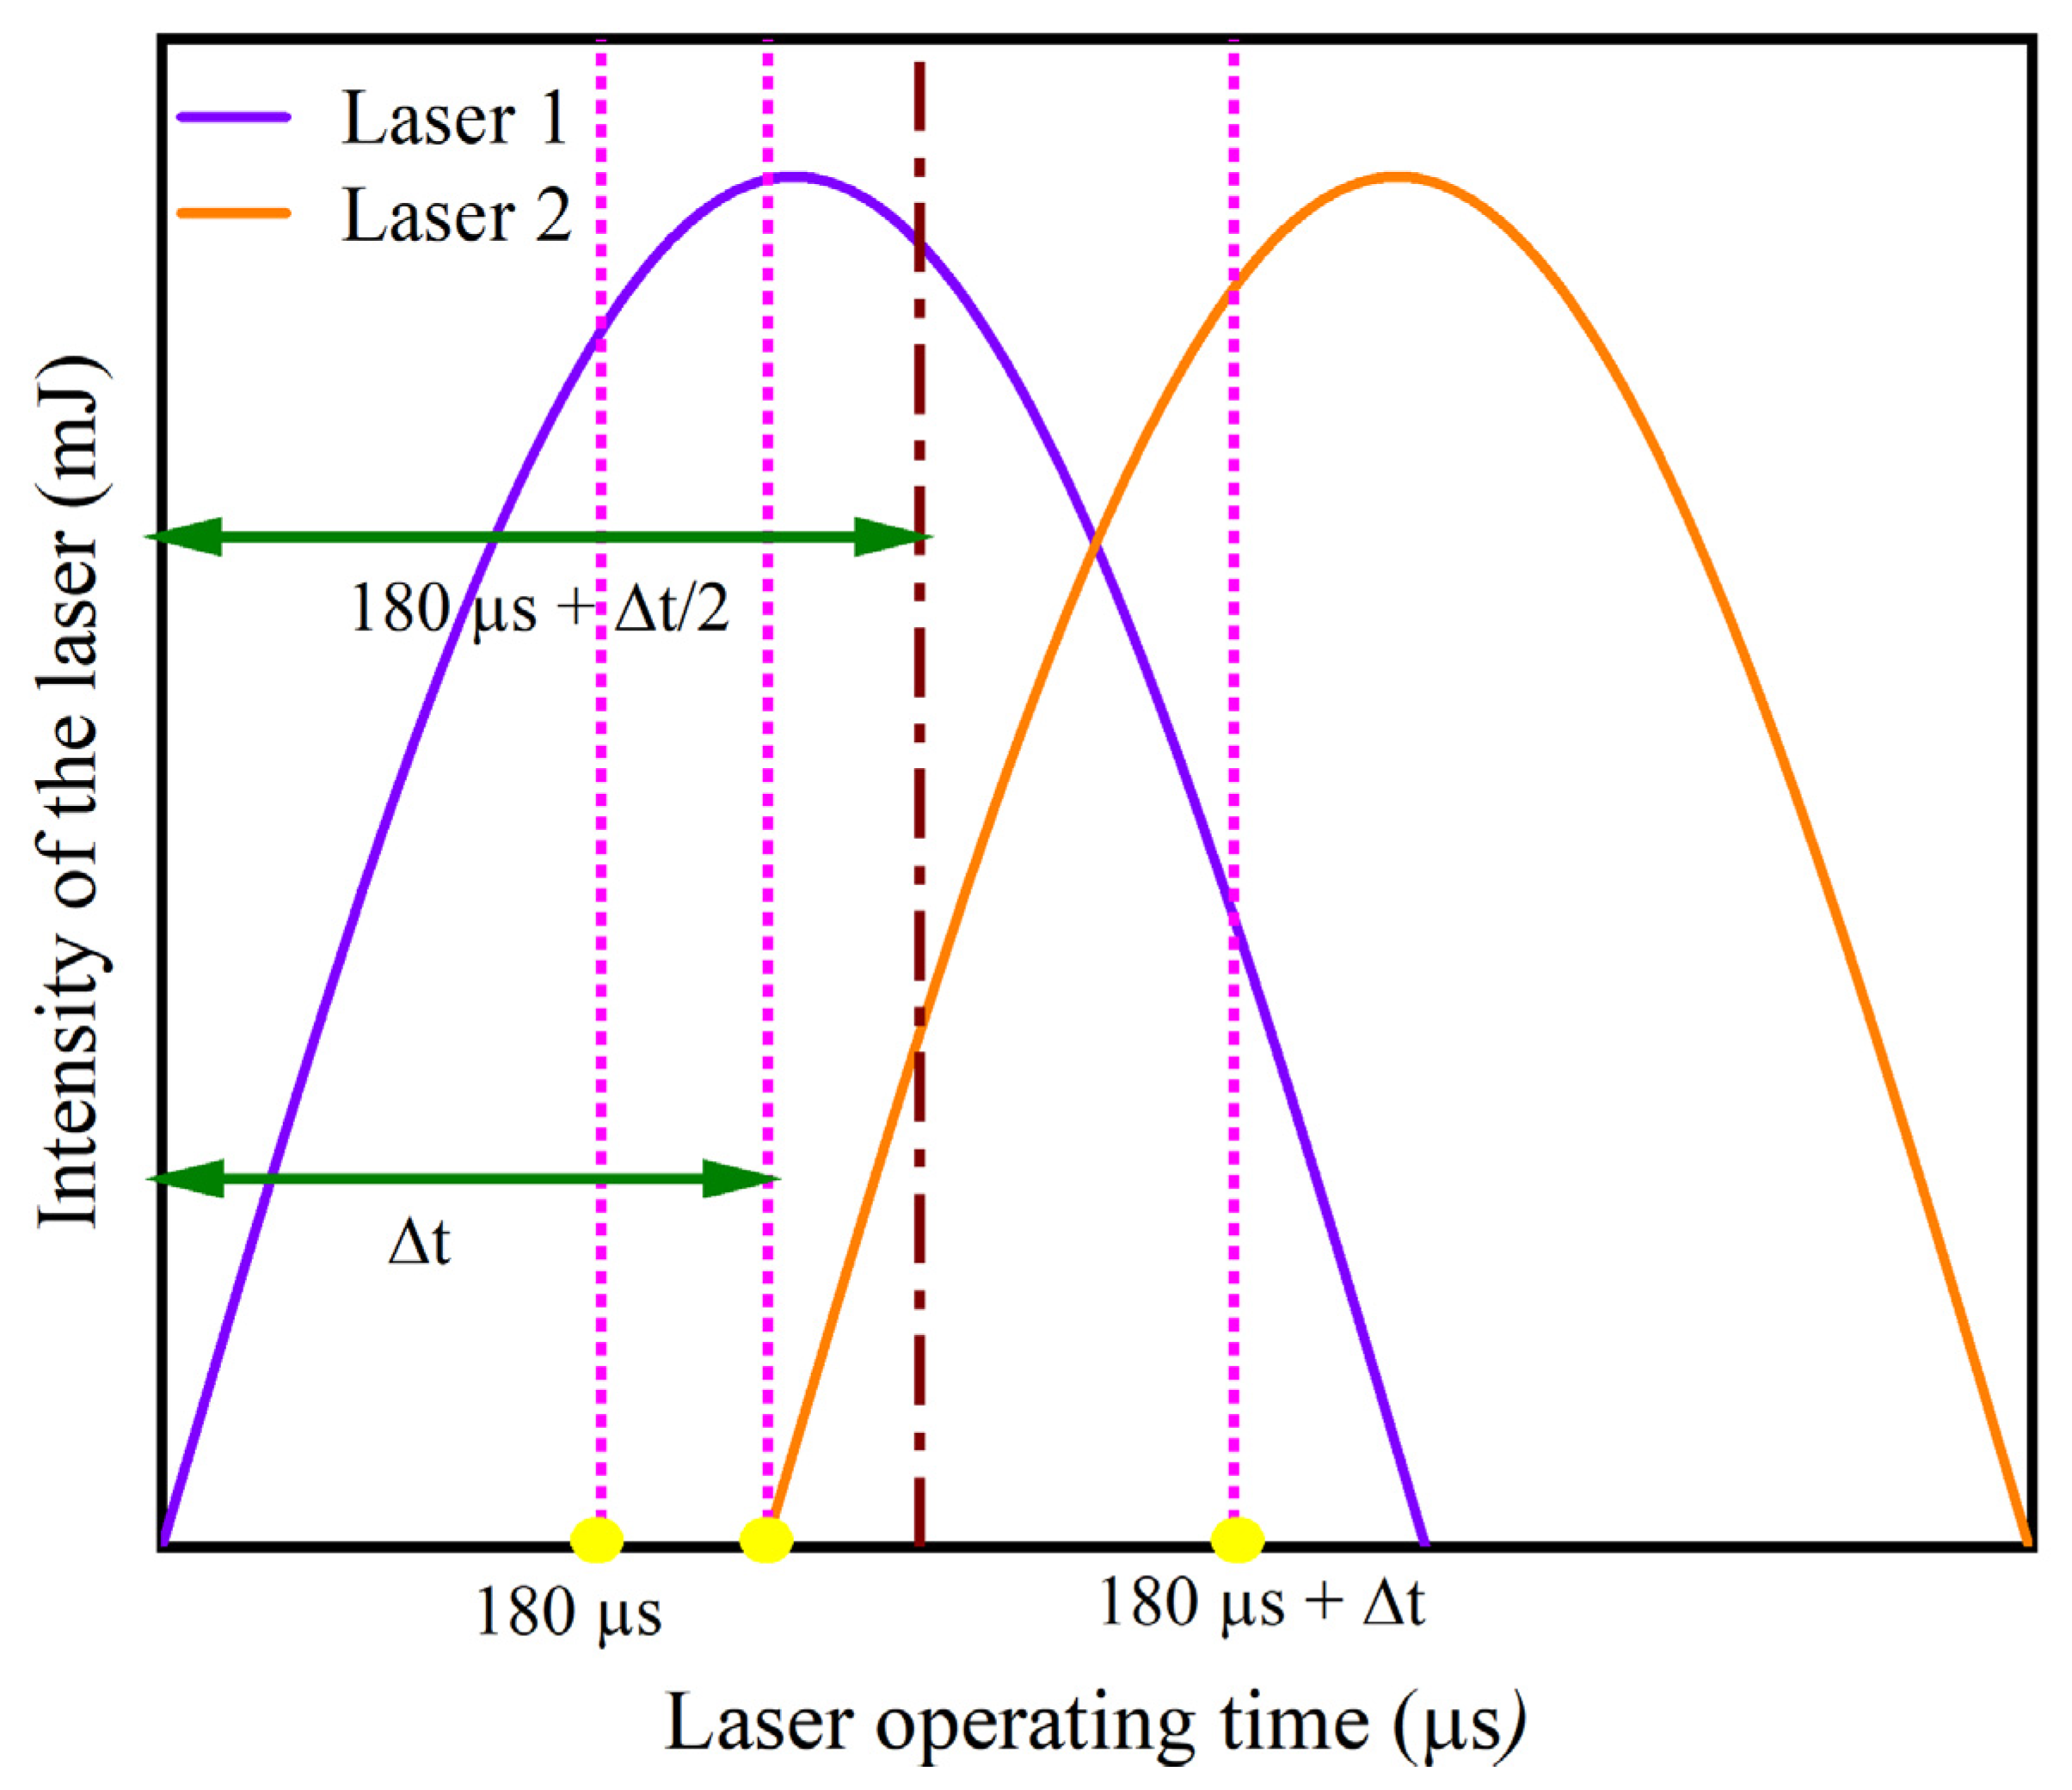
Figure 16.
Field test drawing.
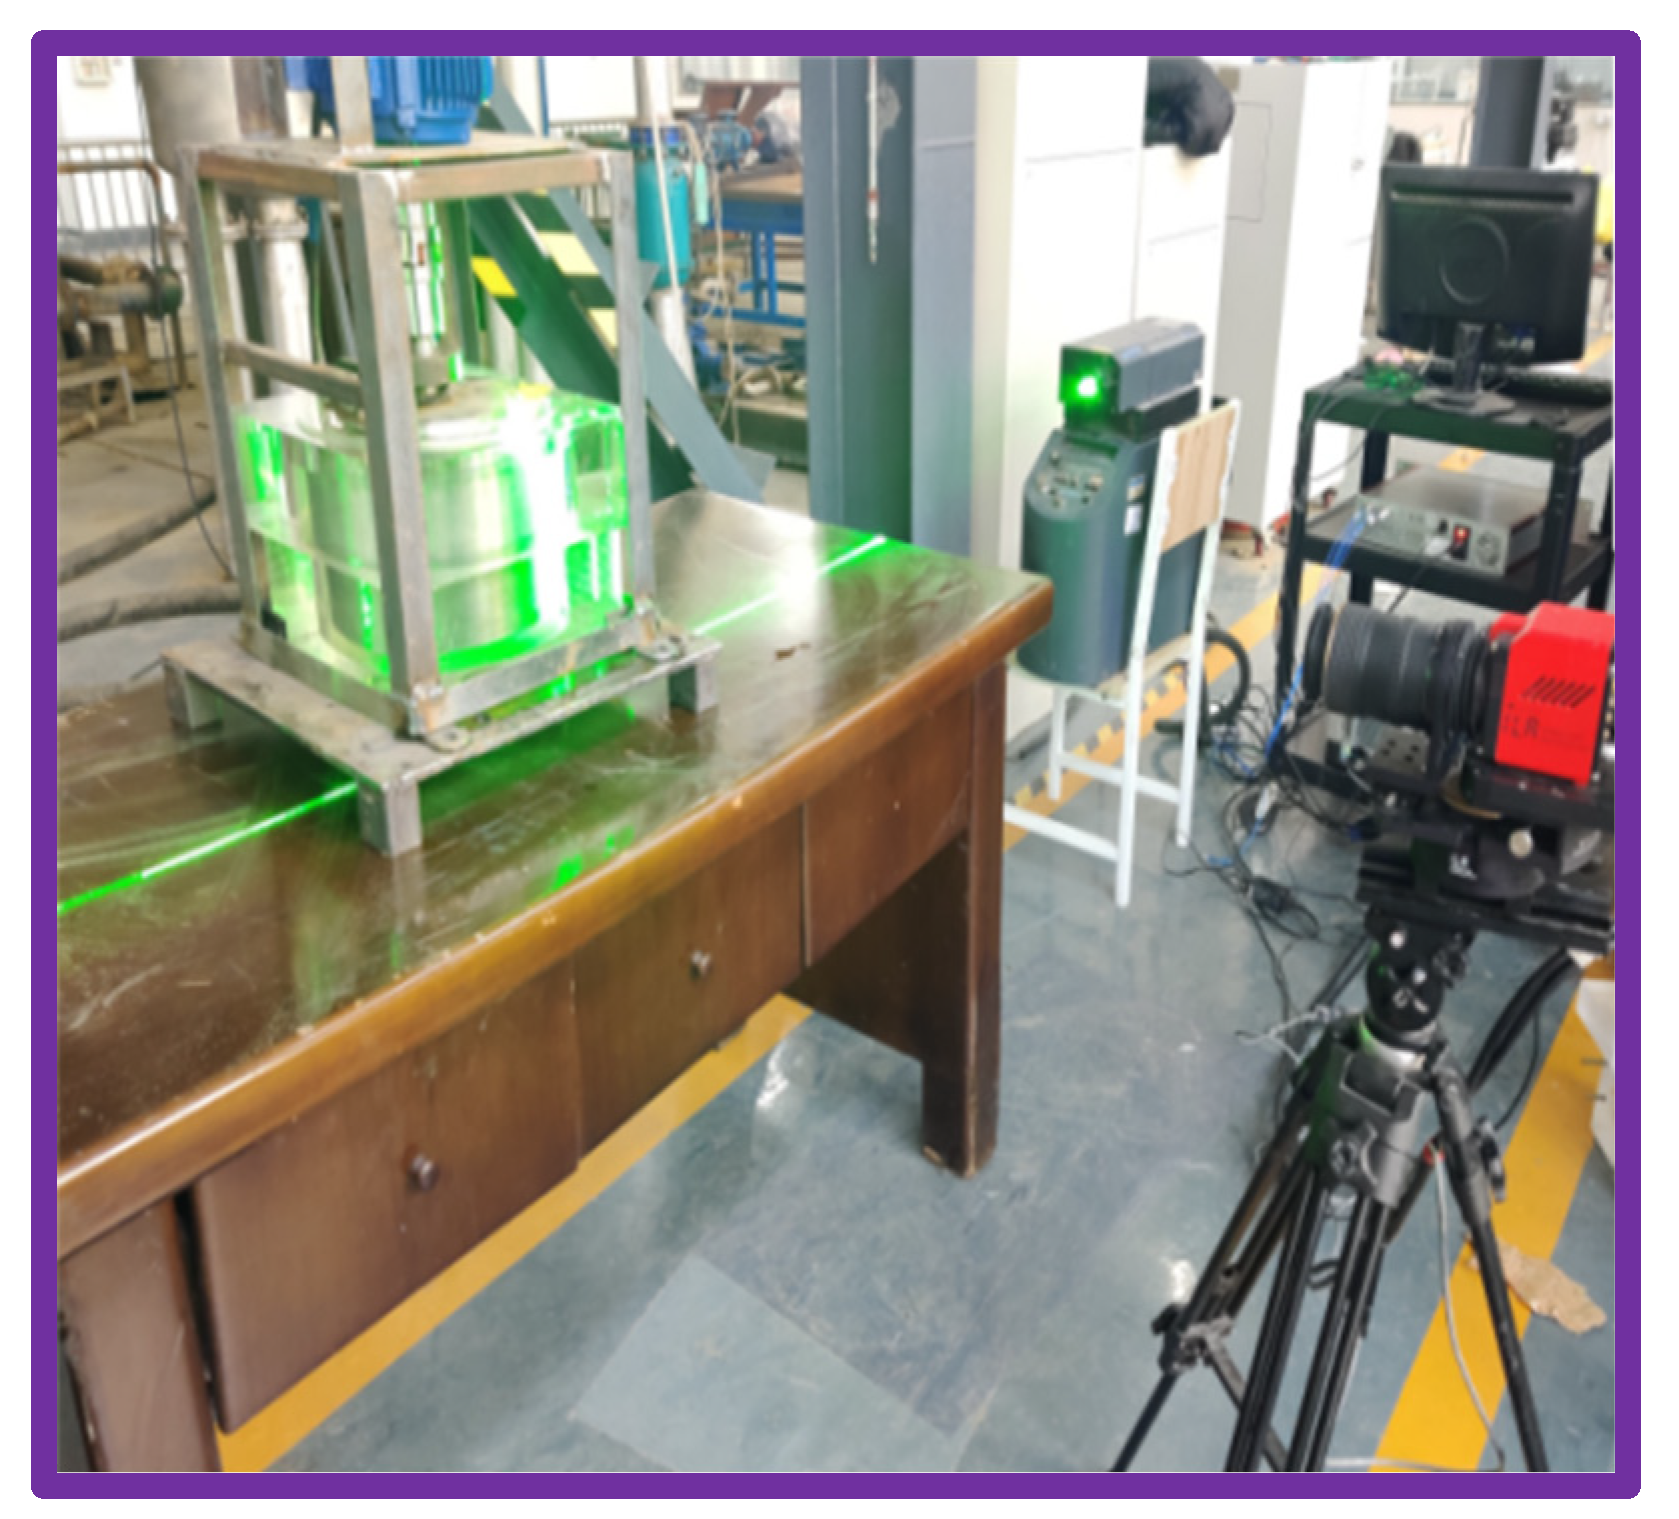
Figure 17.
Comparison of the experimental and simulation data. (a) Shaft speed 100 rpm, (b) Shaft speed 300 rpm, (c) Shaft speed 500 rpm, (d) Shaft speed 1000 rpm.
Figure 17.
Comparison of the experimental and simulation data. (a) Shaft speed 100 rpm, (b) Shaft speed 300 rpm, (c) Shaft speed 500 rpm, (d) Shaft speed 1000 rpm.

Table 1.
Magnetic circuit structure parameters.
| Item | Value |
|---|---|
| Shaft diameter | 200 mm |
| Inner radius of the pole piece | 214 mm |
| Outer radius of the pole piece | 294 mm |
| Length of the pole piece | 28 mm |
| Height of the pole teeth | 6 mm |
| Width of the pole teeth | 4 mm |
| Inner radius of the permanent magnet | 214 mm |
| Outer radius of the permanent magnet | 294 mm |
| Length of the permanent magnet | 12 mm |
Table 2.
Main technical parameters of the PIV system.
| Main Parameters | Technical Indices |
|---|---|
| Function | Measure the 2D velocity field distribution on a plane to obtain U and V velocity components, vorticity, velocity gradients, streamlines, etc. |
| Speed measurement range | 0–1000 m/s |
| Speed measurement accuracy | U and V component: ≤1% of reading |
| Measured area | Flow field area ≥900 mm × 1000 mm |
| Overall operating frequency | 15 Hz |
| Bits | 16 bits |
Publisher’s Note: MDPI stays neutral with regard to jurisdictional claims in published maps and institutional affiliations. |
© 2021 by the authors. Licensee MDPI, Basel, Switzerland. This article is an open access article distributed under the terms and conditions of the Creative Commons Attribution (CC BY) license (https://creativecommons.org/licenses/by/4.0/).
Share and Cite
MDPI and ACS Style
Li, W.; Li, Z.; Wang, Z.; Wu, F.; Xu, L.; Peng, S. Turbulence Intensity Characteristics of a Magnetoliquid Seal Interface in a Liquid Environment. Coatings 2021, 11, 1333. https://doi.org/10.3390/coatings11111333
AMA Style
Li W, Li Z, Wang Z, Wu F, Xu L, Peng S. Turbulence Intensity Characteristics of a Magnetoliquid Seal Interface in a Liquid Environment. Coatings. 2021; 11(11):1333. https://doi.org/10.3390/coatings11111333
Chicago/Turabian StyleLi, Wangxu, Zhenggui Li, Ziyue Wang, Feng Wu, Lianchen Xu, and Shengyang Peng. 2021. "Turbulence Intensity Characteristics of a Magnetoliquid Seal Interface in a Liquid Environment" Coatings 11, no. 11: 1333. https://doi.org/10.3390/coatings11111333
Note that from the first issue of 2016, this journal uses article numbers instead of page numbers. See further details here.