Article

Effective Detoxification of Aflatoxin B1 and Ochratoxin A Using Magnetic Graphene Oxide Nanocomposite: Isotherm and Kinetic Study

by
Atena Abbasi Pirouz
1,2,
Jinap Selamat
1,2,*,
Rashidah Sukor
1,2 and
Nuzul Noorahya Jambari
1,2
1
Food Safety and Food Integrity (FOSFI), Institute of Tropical Agriculture and Food Security, Universiti Putra Malaysia, Serdang 43400, Selangor, Malaysia
2
Department of Food Science, Faculty of Food Science and Technology, Universiti Putra Malaysia, Serdang 43400, Selangor, Malaysia
*
Author to whom correspondence should be addressed.
Coatings 2021, 11(11), 1346; https://doi.org/10.3390/coatings11111346
Submission received: 1 August 2021 / Revised: 9 September 2021 / Accepted: 14 September 2021 / Published: 2 November 2021
(This article belongs to the Collection Advanced Surface Coating of Nanoparticles)

Abstract

:
One of the approaches for reducing exposure to mycotoxins is to lessen their bioavailability by applying nanocomposite adsorbents. Magnetic graphene oxide (MGO) is a new class of nanostructured multifunctional nanocomposite materials, which play a vital role as an adsorbent. The primary aim of this study is to apply response surface methodology (RSM) to optimize the influence of pH within the range of 3 to 7, time (3–7 h), and temperature (30–50 °C), on the simultaneous detoxification of aflatoxin B1 (AFB1) and ochratoxin A (OTA) by using MGO. The optimal condition was obtained at pH 5, 5 h, and 40 °C. Further investigation of the adsorption evaluation was carried out by studying different parameters, such as the influence of contact time, initial mycotoxins concentration, and temperature. According to the experimental data, it can be concluded that the pseudo-second-order kinetic model and the Freundlich isotherm fitted well. The capability of adsorption for the Freundlich model was calculated as 153 and 95 ng/g for AFB1 and OTA, respectively. The thermodynamic study showed that the sorption studies act spontaneously as an exothermic process. These findings suggest that the application of MGO as a nanocomposite is of great significance for the detoxification of mycotoxins.

1. Introduction

Some filamentous fungi species are capable of producing mycotoxins, and these fungi grow under suitable physiological, biological, and chemical conditions that can be toxic and hazardous to the health of humans and animals [1]. Substantial economic losses arising from the worldwide occurrence of mycotoxins have had significant adverse impacts on crops and livestock [2]. Depending on the classification, around 300–400 different mycotoxins have been isolated so far [1]. Among these secondary metabolites, OTA and AFB1 have widely distributed feed and food contaminants that have potent health hazards for humans and animals. These two mycotoxins are more frequently produced by Aspergillus species [3]. The presence of AFB1 and OTA has often been demonstrated in both poultry and cattle feed, eggs, and edible tissues [4]. Once mycotoxins are secreted in feed or food, their detoxification has frequently been an immense task for both the agricultural and food industries. To this end, numerous chemicals, biological, and physical techniques have been developed to reduce or eliminate these toxic compounds in polluted feed and foodstuffs [5]. In the case of chemical methods, they have been found to lose nutritional value in animal feed [6]. As for biological methods, there is insufficient information regarding their mechanisms of action and toxicity of their transformation products [7]. In contrast, the use of adsorbents as a physical method offers enormous applications for the routine reduction of this constant exposure to low levels of mycotoxins. In addition, reduced non-specific binding to nutrients, such as minerals, vitamins, and amino acids, in feed [8]. The nanocomposite adsorbent’s properties constitute the most significant feature of adsorption. These include the total charges and their distribution, pore size, and the available surface area [9]. Various investigations have been carried out on the efficiencies of adsorbents to remove mycotoxins, for example, bentonite [10], activated charcoal (AC) [11], Diatomite [12], hydrated sodium calcium aluminosilicates (HSCAS) [13], and chitosan [14], intended for the detoxification of AFB1 or OTA. On the other hand, according to the results in the literature, the above adsorbents are relatively expensive and quite satisfactory only concerning one mycotoxin but not effective in multiple simultaneous mycotoxins. Consequently, this could limit their use for practical applications.
At present, nanomaterials have been widely used in mycotoxin contamination control due to nanomaterials that can change their properties as different physicochemical conditions and serve as nonpolar or polar substances provide a great opportunity with high adsorption capacity in response to the diversities of mycotoxins. Therefore, magnetic graphene oxide nanocomposite (MGO) is considered a promising material for the use of several functional groups and carbon nanostructures [15]. It is made from a combination of magnetic nanoparticles (Fe3O4) and graphene oxide (GO) [16]. GO possesses special properties, such as being economical, being readily available, and having an adequate oxygen group that contains multifunctional groups. More importantly, GO has a good selective adsorption capacity for those aromatic compounds through strong π–π interactions [17,18]. Nevertheless, GO with a small particle size and high dispersibility suffers from separation inconvenience due to the difficulty in separating it from the solution after adsorption using either filtration or centrifugation or both [19]. The use of conventional separations methods, for example, filtration and sedimentation, are consequently excluded. This challenge could perhaps be resolved by replacing Fe3O4 nanoparticles with exclusive properties, such as biocompatibility, superparamagnetic property, minimal toxicity, and maximum electron communication with graphene oxide, to develop nanocomposite [20]. Super-paramagnetic Fe3O4 has been broadly used in environmental remediation due to its high separation convenience [21]. Therefore, their chemical structure allows surface functionalization, including carboxylation, hydrogenation, and hydroxylation, which could provide binding affinity to various types of mycotoxins [22].
The present study was conducted to investigate different detoxification parameters, such as pH, time, temperature, and initial mycotoxin concentrations, as critical factors to optimize the adsorption processes regarding the adsorption capacities of the MGO. Besides that, in order to predict the adsorption mechanism, adsorption equilibrium, and the feasibility of the adsorption process, kinetic, isotherm, and thermodynamic studies are also evaluated and discussed. To the best of our knowledge, this is the first report of the detoxification of AFB1 and OTA in animal feed with MGO simultaneously.

2. Materials and Methods

2.1. Materials and Reagents

Animal feed was formulated with 20% palm kernel cake (PKC), which was contaminated by AFB1 and OTA at three different concentrations (5.00, 25.00, and 100.00 ng/g) that were prepared through diverse levels of corn, soybean, PKC, palm oil, and mineral, and supplement (37.87%, 27.20%, 20%, and 11.63%, and 3.3% respectively). The feed contaminated with mycotoxins was compressed to a satisfactory powder and filtered with sieve No. 16 prior to analysis. Analytical pure standards of AFB1, OTA, and AflaOchra high-pressure liquid chromatography (HPLC) immunoaffinity columns (IAC) were procured from VICAM (Watertown, MA, USA); sulfuric acid (H2SO4) 98%, hydrogen peroxide (H2O2), ferrous ammonium sulfate [(NH4)2SO4FeSO4·6H2O], ammonium ferric sulfate [NH4Fe(SO4)2·12H2O], potassium permanganate (KMnO4), and nitrate sodium (NaNO3) were procured from Merck (Darmstadt, Germany); graphite powder, and phosphate-buffered saline solution (PBS) in distilled water and lined filter papers (24 cm) were acquired from Sigma-Aldrich (Fluka, Steinheim, Germany); purified water was obtained by successive reverse osmosis using a Milli-Q Plus system (Millipore, Molsheim, France); and methanol (CH3OH) and acetic acid (C2H4O2) were produced from J.T. Baker (Deventer, The Netherlands). All eluents were filtered through 0.22-µm membrane filters (Whatman, Maidstone, UK).

2.2. Preparation of Graphene Oxide (GO)

Graphene oxide was prepared using a modification of the Hummers method [17]. Approximately 2.5 g of NaNO3 and 5 g of commercial graphite powder was added to 75 mL of concentrated sulfuric acid, and the mixture was maintained at a temperature below 2 ± 1 °C with an ice bath. A total of 15.0 g of KMnO4 was then added gradually, with vigorous stirring. Thereafter the stirring was continued at 35 ± 2 °C for a half-hour. Next, about 230 mL of ultrapure water was added into the reaction vessel in drops, and the temperature was kept for 15 min at 98 ± 2 °C. The mixture was diluted to 700 mL and 2.5 mL of ultrapure water and H2O2 (wt. 30%), respectively. The resulting mixture was filtered using a 0.1 µm membrane filter followed by washing of the residue successively with ethanol and ultrapure water until the pH 7 was reached. Finally, the resulting solid was desiccated in a vacuum at 60 ± 2 °C.

2.3. Preparation of Magnetic Graphene Oxide (MGO)

The MGO was produced according to the chemical co-precipitation method with some modifications [21]. Approximately 1 g of dried GO was diffused in distilled water (100 mL) and then sonicated for 3 h, thereby forming a stable GO suspension. Meanwhile, nanoparticles of iron (III) oxide were prepared by dissolving 10 g of ammonium iron (III) sulfate and about 5 g of ammonium iron (II) sulfate in ultrapure water (100 mL). This dissolution was done under nitrogen gas to remove any oxygen, and a mixed iron salt solution was thus formed. Iron (III) oxide solution was mixed in GO with sonication for 2 h. Next, an ammonia solution was added in drops to the obtained product, which was then stirred continuously at the ambient temperature for 24 h. Afterward, the derived product was then collected with a permanent magnet field, washed with ethanol, and distilled to remove dissociative iron (II) and remnant acid. Then, the final products were dried in a vacuum oven.

2.4. Characterization of Adsorbents

The morphology of GO and MGO were studied from scanning electron microscope (SEM) and transmission electron microscope (TEM) images captured using a field emission SEM (ZEISS, Jena, Germany) and JEM-2100 microscope (JEOL, Tokyo, Japan). X-ray diffraction (XRD) patterns were obtained with a Philips PW1800 diffractometer (Watertown, CT, USA) with CuKα radiation for crystalline phase identification. The FTIR spectra of the GO and MGO were recorded on a Perkin-Elmer 2000 FTIR machine (Waltham, MA, USA) with KBr disks.

2.5. Analysis of Mycotoxins

Determination of aflatoxin B1 and ochratoxin A was done by reversed-phase HPLC with a Waters HPLC system (Milford, MA, USA) that consisted of a Waters 717 autosampler, Waters 600E quaternary pump, Waters in-line degasser, and Waters 2475 fluorescence detector, which was used for a time-based program. Fluorescence was used to detect mycotoxins under the following conditions: 365 and 455 nm excitation and 329 and 460 nm emission for AFB1 and OTA, respectively [23]. Photochemical reaction enhanced detection (PHRED) was carried out to boost the fluorescent activity of AFB1. The PHRED was located between the fluorescence detector and the analytical column. HPLC separation was achieved with a C18 symmetry column (4.6 mm × 250 mm, 5 µm particles), and elution was performed using a methanol solvent with a flow rate of 1 mL/min. The complete process for the simultaneous detection of AFB1 and OTA was conducted in the following sequence: HPLC injector–PHRED system–FL detector.

2.6. Experimental Design

Response surface methodology (RSM) is used to evaluate the effect of various independent variables and their interaction on the response. This method is useful for achieving optimum results and a lesser number of experimental runs. The effect of three separate variables, namely pH, time, and temperature, for the detoxification of levels of AFB1 and OTA with MGO in the animal feed contaminated with mycotoxins was evaluated by using RSM. These variables and their ranges were selected based on the literature and results obtained from the preliminary studies. Experimental variable ranges were studied at three levels for each variable, as illustrated below in Table 1. Replication of the center point was performed six times to ensure reproducibility of the technique [24].

2.7. Statistical Analysis

Regression analysis and ANOVA procedures were performed to discover the relationship between each response and the three experimental process variables [25]. The response optimizer offers a possible compromise between the various targets. It can recognize the best combination of input variables for the optimization of a single target or a set of targets [26]. In the current study, the responses of AFB1 and OTA were optimized together to determine the overall optimal point of each factor so as to reduce the target mycotoxins simultaneously. The Minitab19 statistical package was used to generate and evaluate the statistical experimental design mixture.

2.8. Adsorption Studies

Batch adsorption of mycotoxins was undertaken using adsorbent (MGO). For determination of kinetic adsorption, a similar sum of AFB1 and OTA (50 µg/L) was applied and kept back in connection with a typical solution that was thinned in 50/50 methanol and water at various treatment times from (3–8 h) inside optimal pH and temperature. To investigate the isotherm studies, 5 g of animal feed was spiked with different concentrations of AFB1 and OTA (5.0–100.0 ng/g). Each spike was carried out three times. The sample spikes were deposited in the dark overnight for evaporation with methanol and water. In the primary study, the overall sum of MGO from 0.005 to 0.02 g was calculated; the decline of AFB1 and OTA after 200 mg was considered unimportant. Hence, in accordance with this primary research, the model was disturbed with 200 mg of MGO, and a further 20 mL purified 80:20 mixture of methanol/water was added to the spiked sample. The suspensions were agitated in a shaking incubator at 25 °C. The agitation speed and incubation time were 160 rpm and 24 h, respectively. The preliminary pH amount was adjusted with minor sums of 0.1 mol/L nitric acid. Subsequent to the adsorption process, the adsorbent was removed by permanent magnetics. The supernatant was examined for residual mycotoxins concentration by HPLC [27], and the adsorption capacity of adsorbent for the detoxification of AFB1 and OTA was calculated based on Equation (1), given below:
q e = ( C 0 C e ) v m
where C0 (ng/mL) and Ce (ng/mL) are the initial and final concentrations of AFB1 and OTA, respectively, and m (g) represents the weight of MGO while v (L) denotes the volume of AFB1 and OTA solutions [28]. In the direction of investigating the thermodynamic study, the animal feed was spiked with AFB1 and OTA at their maximum concentrations applied in this study (100.0 ng/g). Lastly, the effect of temperature on the equilibrium was studied from 30 to 50 °C.

2.9. Experimental Analysis

The adsorption rates and the controlling mechanism of the mycotoxins solutions onto the adsorbents were investigated with two different kinetic models, such as the pseudo-first-order (PFO) kinetic model and the pseudo-second-order (PSO) kinetic model.

2.9.1. Pseudo-First-Order

A pseudo-first-order kinetic Equation (2) is given as:
dq dt = k 1 ( q e q t )
Integrating Equation (2) with the boundary conditions of qt = 0 at t = 0 and qt = qt at t = t, yields:
1 ( q e q t ) = 1 q e + k 1 t
which can be rearranged to Equation (3):
ln ( q e q t ) = ln ( q e ) k 1 t
where qt (mg/g) is the amount of mycotoxins reduced at time t (min), and qe (mg/g) is the value of mycotoxins at equilibrium. k1 (min−1) is the PFO value constant for the kinetic model. Making the plot of ln(qe − qt) versus t, we find intercept (ln qe) and slope (−k1) of the linear plot [29].

2.9.2. Pseudo-Second-Order

The non-linear form of the pseudo-second-order rate Equation is expressed by Equation (5):
dq dt = k 2 ( q e q t ) 2
Equation (5) can be rearranged to the linear Equation (6):
t q t = 1 k 2 q e 2 + t q e
By linear plotting t/qe against t, the values of 1/qe and 1/k2qe2 can be obtained from the slope and intercept and of the plot Equation (6). Therefore, the amount of qe per gram of sorbent at equilibrium and the sorption rate constant (k2) are appraised from the intercept and the slope, respectively [30].

2.9.3. The Langmuir Isotherm

According to the Langmuir model, adsorption occurs uniformly on the active sides of the adsorbent. It can be arranged into a linear form as Equation (7):
C e q e = C e q max + 1 K L q max
where qe is the number of mycotoxins per unit weight of adsorbent (ng/g), qmax is the maximum adsorption capacity (ng/g), Ce is the equilibrium concentration in solution, and KL is a constant relating to the energy of sorption (L/ng). The values of KL and qmax were calculated from the slope and intercept of linear plots of 1/qe vs. 1/Ce, respectively [31,32].

2.9.4. The Freundlich Isotherm

The Freundlich isotherm is an empirical model that is based on adsorption on a heterogeneous surface. The Freundlich equation is fitted into the experimental data when it is often found in low concentrations [33].
ln q e = ln K F + 1 n ln C e
where n and KF are Freundlich constants, representing adsorption intensity and adsorption ability, respectively. A graph of ln(Ce) against ln(qe) gives a linear plot; the slope of which is equal to 1/n, with intercept as ln(KF) [34].

2.9.5. Thermodynamic Study

The thermodynamic adsorption study provides further information regarding the feasibility and spontaneity of the adsorption process [35]. The thermodynamic parameters for the adsorption of AFB1 and OTA, such as the change in enthalpy (ΔH°, kJ/mol), Gibbs free energy (∆G°, kJ/mol), and entropy (ΔS°, J/mol·K) were assessed at several temperatures using the following Equations:
Kc = qe/C0
Δ G ° = RT ln K c
ΔG° = ΔH° − TΔS°
By combining Equations (10) and (11) we get:
ln ( q e C 0 ) = Δ S R Δ H RT
where, qe is the amount of mycotoxins onto the MGO per liter of solution at equilibrium condition (g/mL), C0 is the concentration of solution at equilibrium condition, R, and T indicate universal gas constant (8.3145 J/mol·K), and absolute temperature (in Kelvin). According to Van’t Hoff (Equation (12)), the rates of ΔH° and ΔS° calculated from the plotting of ln Kc against 1/T gives a straight line with an intercept and a slope equal to (ΔS°/R) and (−ΔH°/R), respectively. The Gibbs free energy is related to the entropy and enthalpy for a process according to Equation (12) [36].

3. Results and Discussion

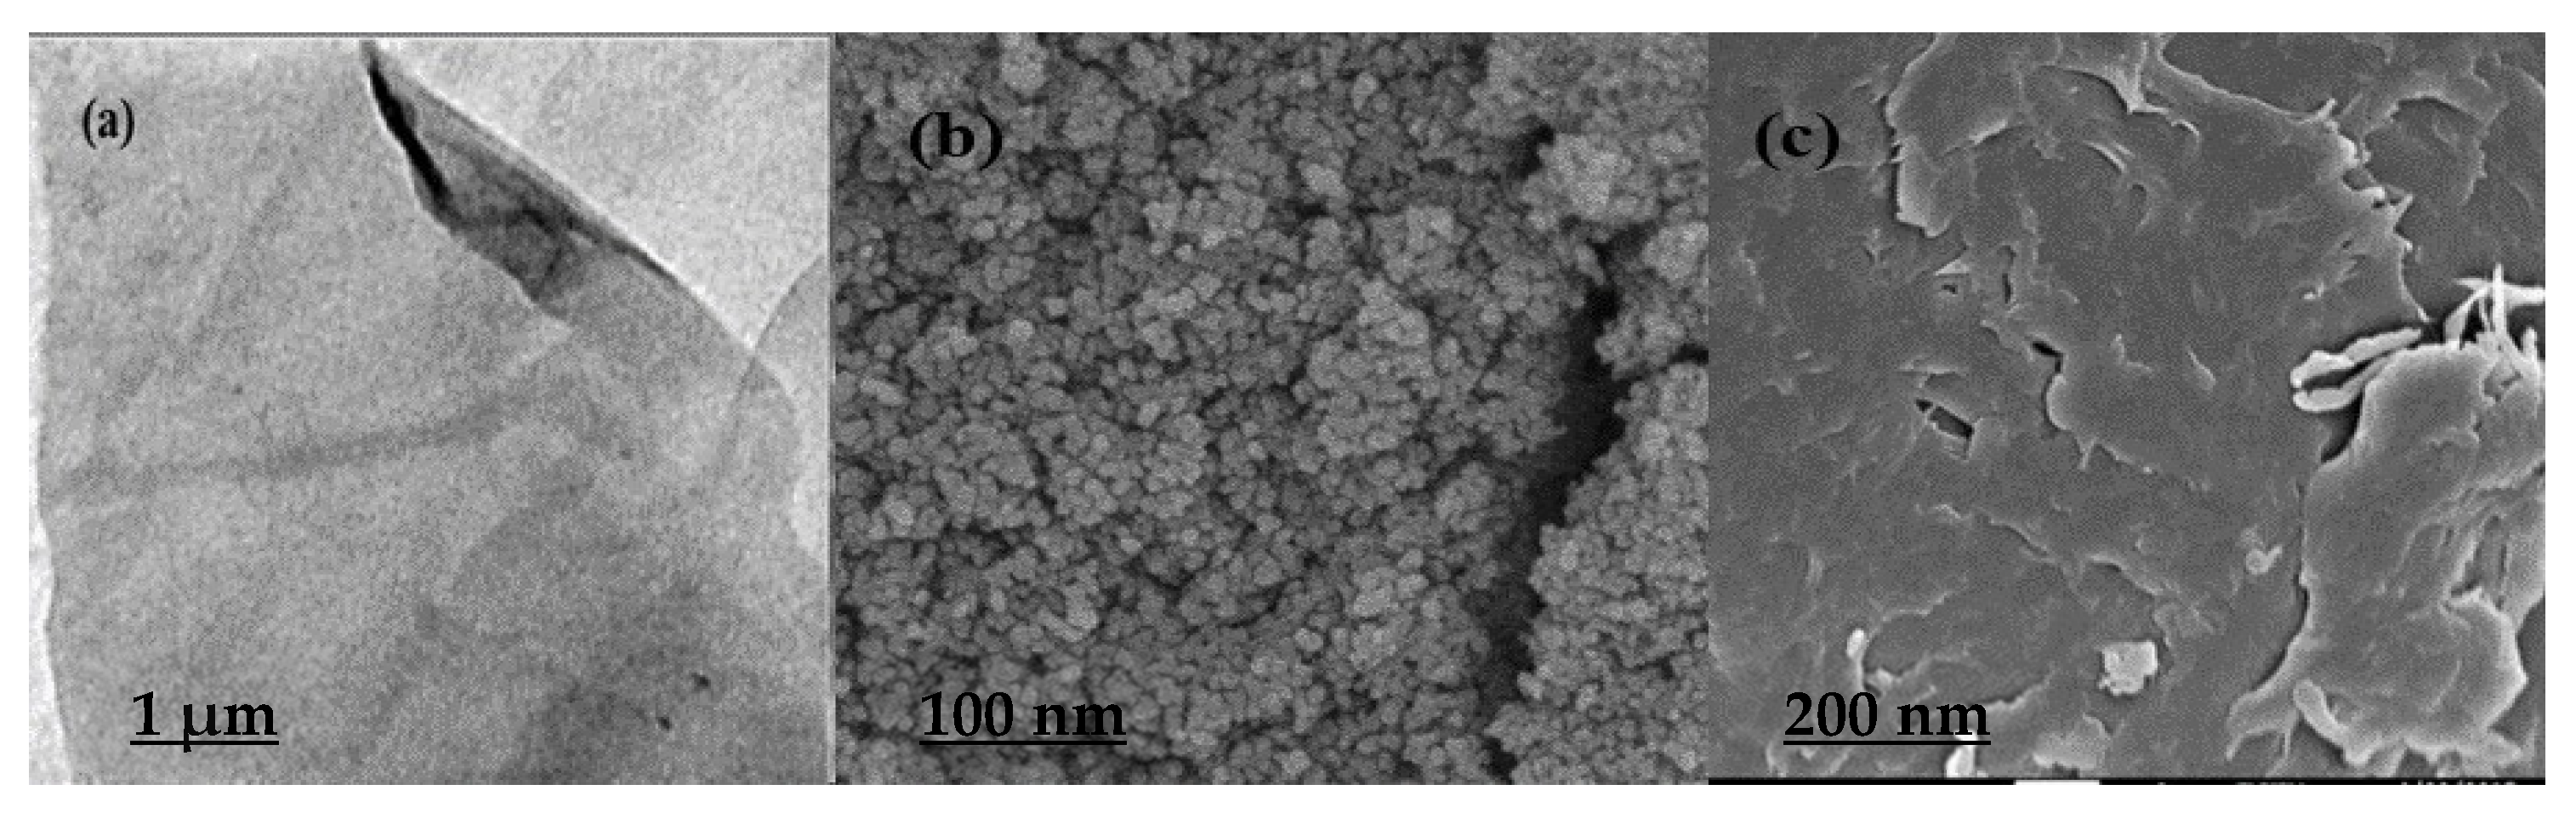
3.1. Characterization of Graphene Oxide and Magnetic Graphene Oxide

The XRD patterns of graphene oxide and magnetic graphene oxide nanoparticle composite is displayed in Figure 1. The wide diffraction peak in Figure 1a at 2θ = 38.4° is assigned to the characteristic peak of graphite flake [37]. The XRD analysis of MGO is presented in Figure 1b. It reveals that MGO retained the spinel structure of Fe3O4, where the identical peaks for Fe3O4 are located at 2θ = 44.6°, 58.9°, and 60.2° [38]. The decrease that was observed in Figure 1a can be attributed to the reduction in the oxygen-bearing functional groups as seen in the final MGO product [39].
Photomicrographs of TEM and Field emission scanning electron microscopy (FESEM) are presented in Figure 2. The surface texture and pore morphology of GO and MGO were examined by TEM and FESEM. The TEM images show that the GO film has wrinkled edges, is transparent as shown in Figure 2a, has spherical nanoparticles with a diameter of nearly 10 nm, and is well distributed on the adsorbent surface, as shown in Figure 2b. The FESEM analysis captured the disruption in the surface appearance of the GO and MGO. The GO presented a sheet-like structure with a smooth surface, whereas, after the combination with magnetics to form the MGO composite, the MGO had a much rougher surface, as shown Figure 2c. The MGO mostly comprised carbon-encapsulated iron with a size of 2–10 nm [39].
The FTIR pattern of GO and MGO, which are shown in Figure 3, reveals the existence of the oxygen-containing functional groups, which included epoxy, carboxylic acid, and hydroxyl groups [40]. The broad absorption bands in GO at 1715 and 1390 cm−1 were due to the stretching vibration peaks of carboxyl and carbonyl, while the band at 1165 cm−1 can be attributed to the stretching vibrations of C–O of the epoxy groups [41]. The IR adsorption bands at 1547 and 571 cm−1 were related to the epoxy groups, revealing the symmetric stretching of the Fe3O4 nanoparticles on the MGO nanocomposite. The strong, broad absorption at 571 cm−1 was assigned to the Fe-O group in Figure 3b. The peak at 1715 cm−1 can be attributed to C=O shearing vibration of the carboxyl group on the GO shifts to 1547 cm−1, and this is likely from the formation of –COO after coating with Fe3O4. The FTIR technique thus indicates that the elimination process of AFB1 and OTA reduction using MGO occurs in two stages (Figure 3c). The π–π stacking is principally based on the π–π interactions between the aromatic rings of AFB1 and OTA and the GO basal planes. In addition, electrostatic attractions between the negatively charged analytes (COO) and the positively charged iron ions (Fe2+ and Fe3+) of MGO accelerated the electron transfer between the reactants. Hence, AFB1 and OTA loaded with MGO were rendered less toxic via the elimination of the mycotoxins’ double bond as compared to the initial mycotoxins [39].

3.2. Fitting the Response Surface Models to Significant Independent Variables

The 20 experimental runs resulted from composite central design (CCD) and the measurement values earned for reduction of mycotoxins for each adsorbent, which are given in supplementary information Table S1. Each response was assessed as a function of main (linear), quadratic, and interaction effects of pH (X1), time (X2), and temperature (X3). Statistical analysis of variance of the RSM data, employing a full quadratic model, was carried out to obtain the best statistical model for the responses. In addition, according to the results, the adsorption capacity of MGO was significantly affected by pH; therefore, it should be kept as a critical parameter in the final reduced model fitted to the experimental (Supplementary information Table S2 and Figure S1).

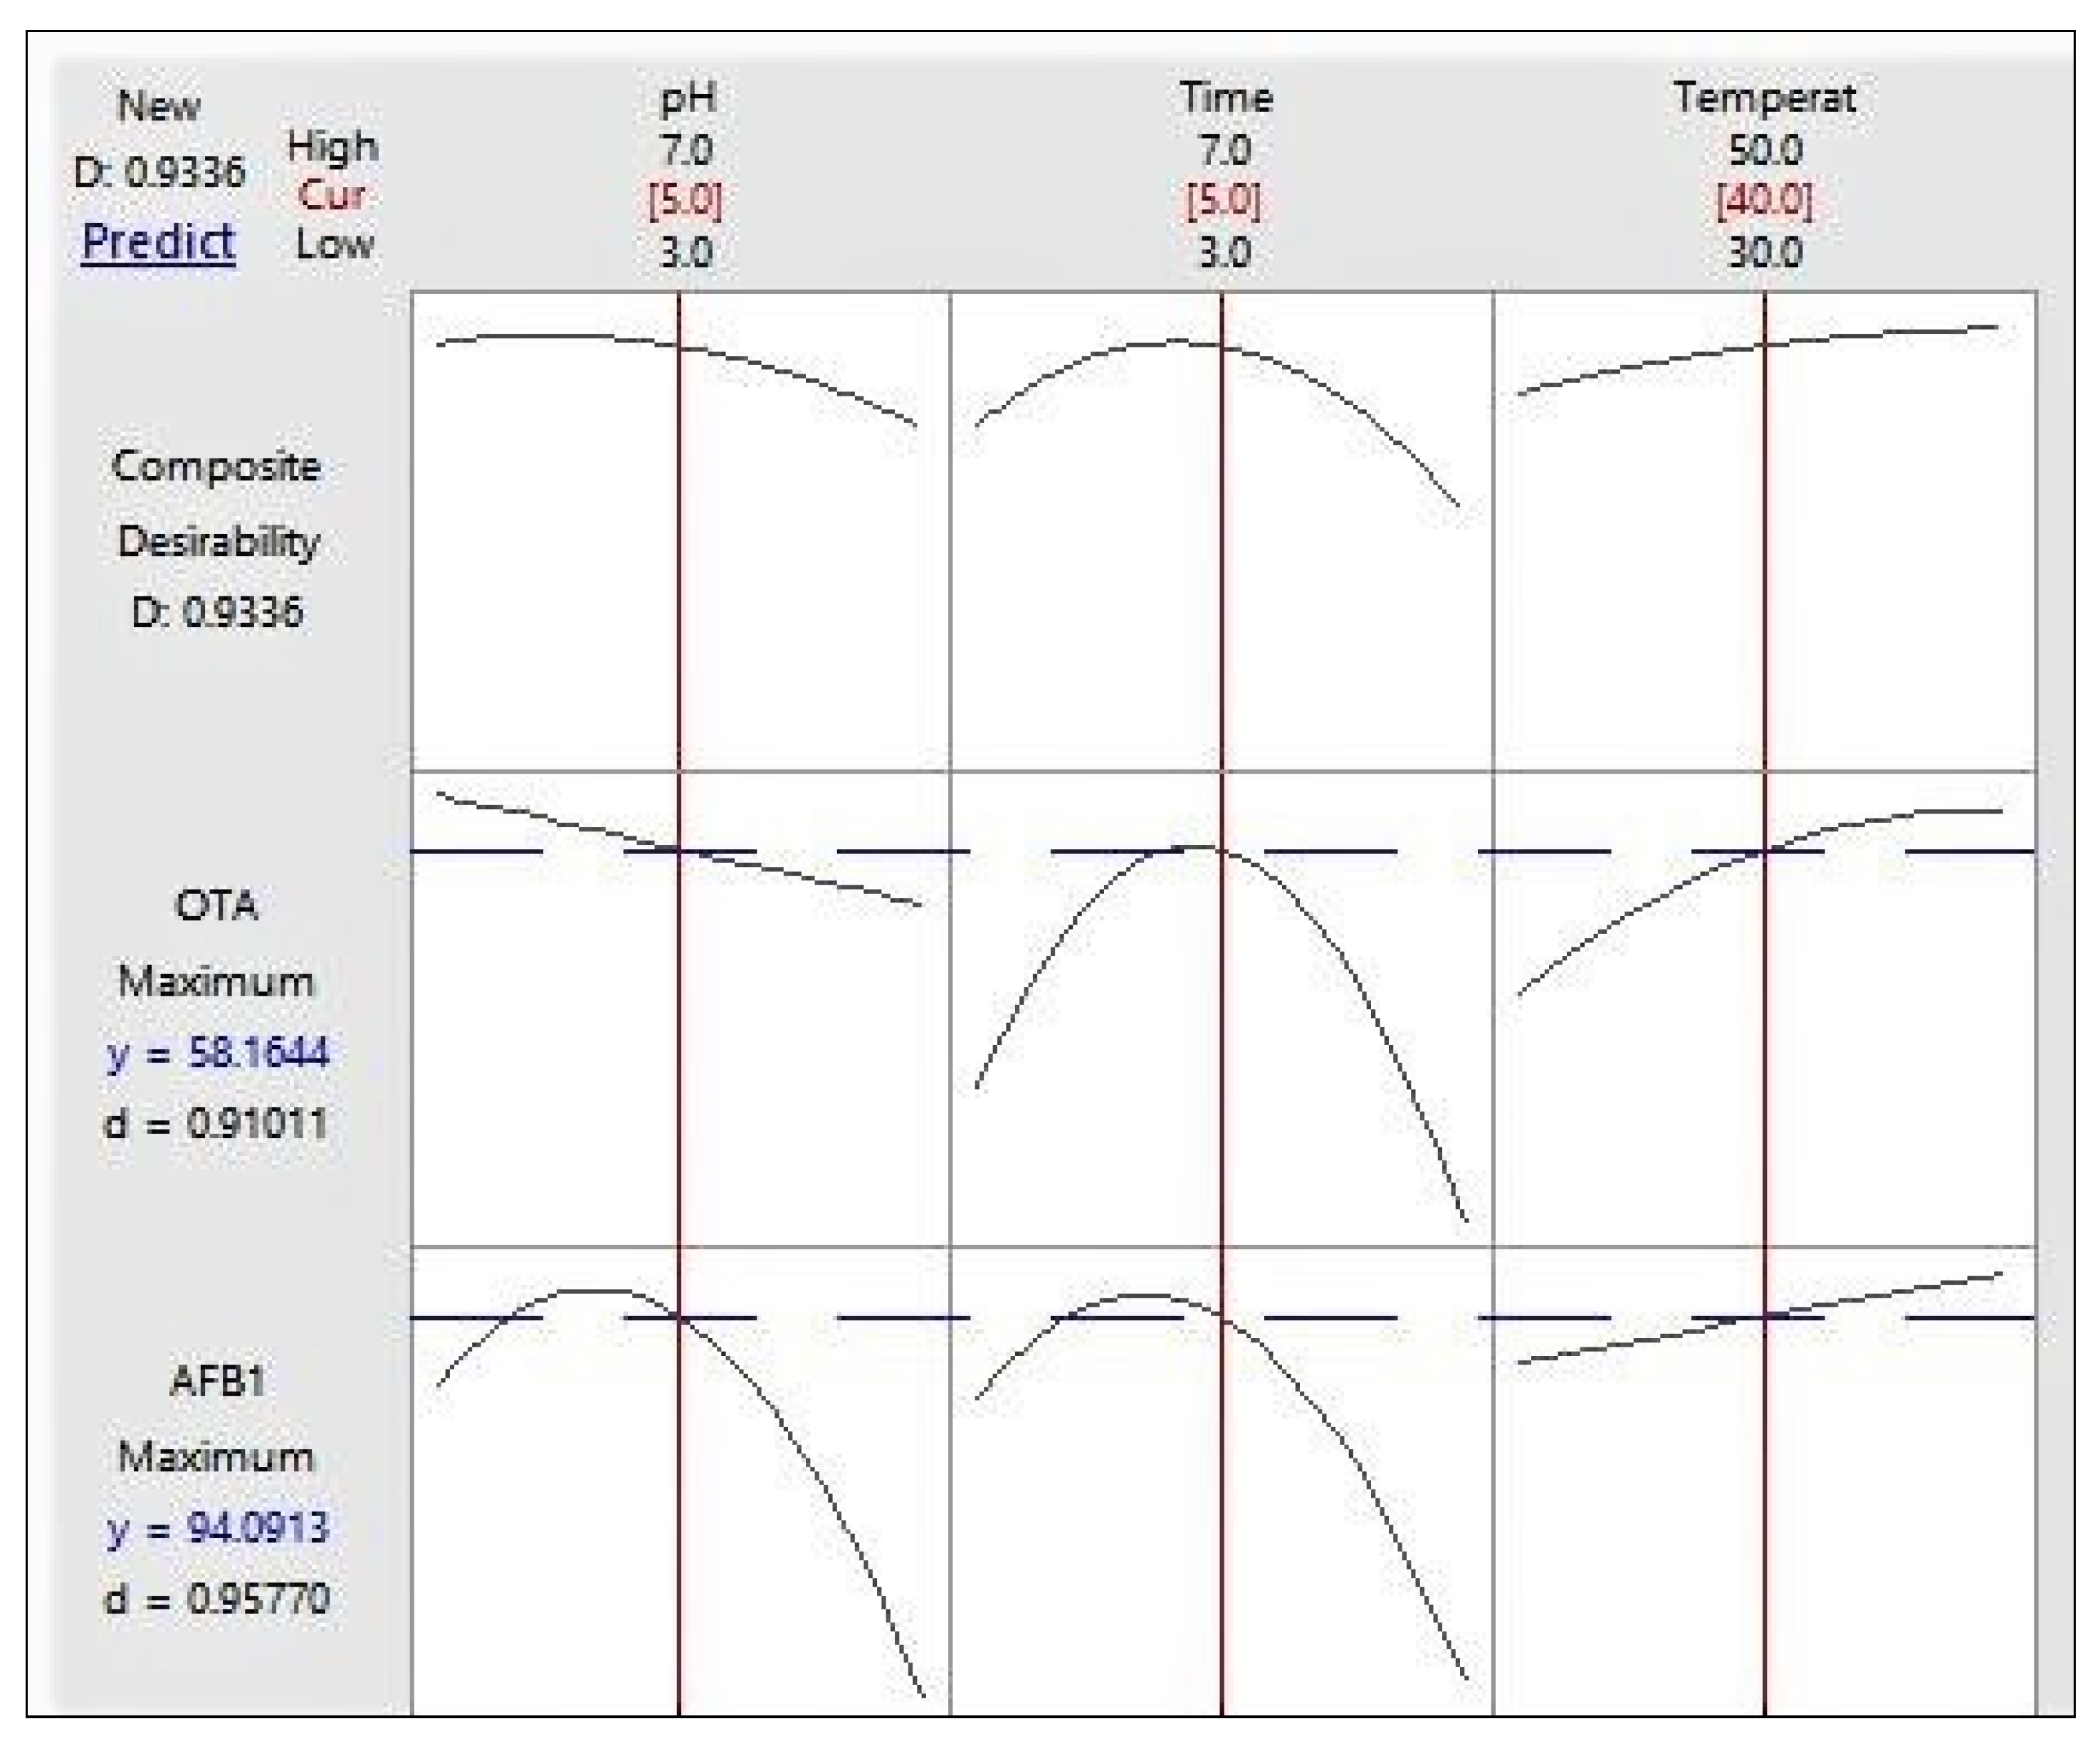
3.3. Optimization and Verification Procedure

To identify the optimum settings of the independent variables for the desired goal of mycotoxin removal, multiple response optimizations (numerical and visual) were conducted [42]. To ascertain the optimal point of experimental variables for the desired response targets, multiple response optimizations were performed [43]. The numerical multiple optimization results predicted the maximum level of detoxification of AFB1 and OTA with MGO. The inclusive ideal setting for simultaneous detoxification of mycotoxins with MGO was predicted to be at pH 5, 5 h, and 40 °C. Under optimal levels, the respective response for the detoxification of mycotoxins with MGO was predicted to be 94.09% and 58.16% AFB1 and OTA and with total desirability (D = 0.934), as shown in Figure 4. The verification experiment was performed by comparing the experimental and predicted fitted values, which are presented in Table 2. No significant (p < 0.05) difference was reported between the experimental and predicted values (test value), and there was a close correspondence between these values. Therefore, predicted values verified the adequacy of the models fitted by RSM.

3.4. Adsorption Kinetics

To provide information on the factors affecting the reaction rate, kinetics evaluation is necessary. Therefore, it is essential to introduce the value of regression coefficients (close or equal to 1). When the value of regression coefficients (R2) is high, the model is the best applicable data [44]. The results from the HPLC analyses for adsorption kinetics were calculated based on PFO and PSO. The values of the constants of the two kinetic models are summarized in Table 3.
According to Table 3, adsorption of AFB1 and OTA on MGO follow the PSO kinetics with higher correlation coefficients (0.965 < R2 < 0.981) than PFO. The results show that the constant rate is an indication of adsorption for AFB1 and OTA, as are shown in Figure 5. It can, therefore, be concluded that the adsorption of the mycotoxins onto MGO is likely due to the interaction between the mycotoxins and the adsorbents. This interaction, which is chemisorption, involves the sharing or the trading of electrons (valency forces) amongst water-loving (hydrophilic) spots and divalent of adsorbents and targets. It is also permanent since chemically adsorbed molecules are unable to interchange on the exterior of the interface.

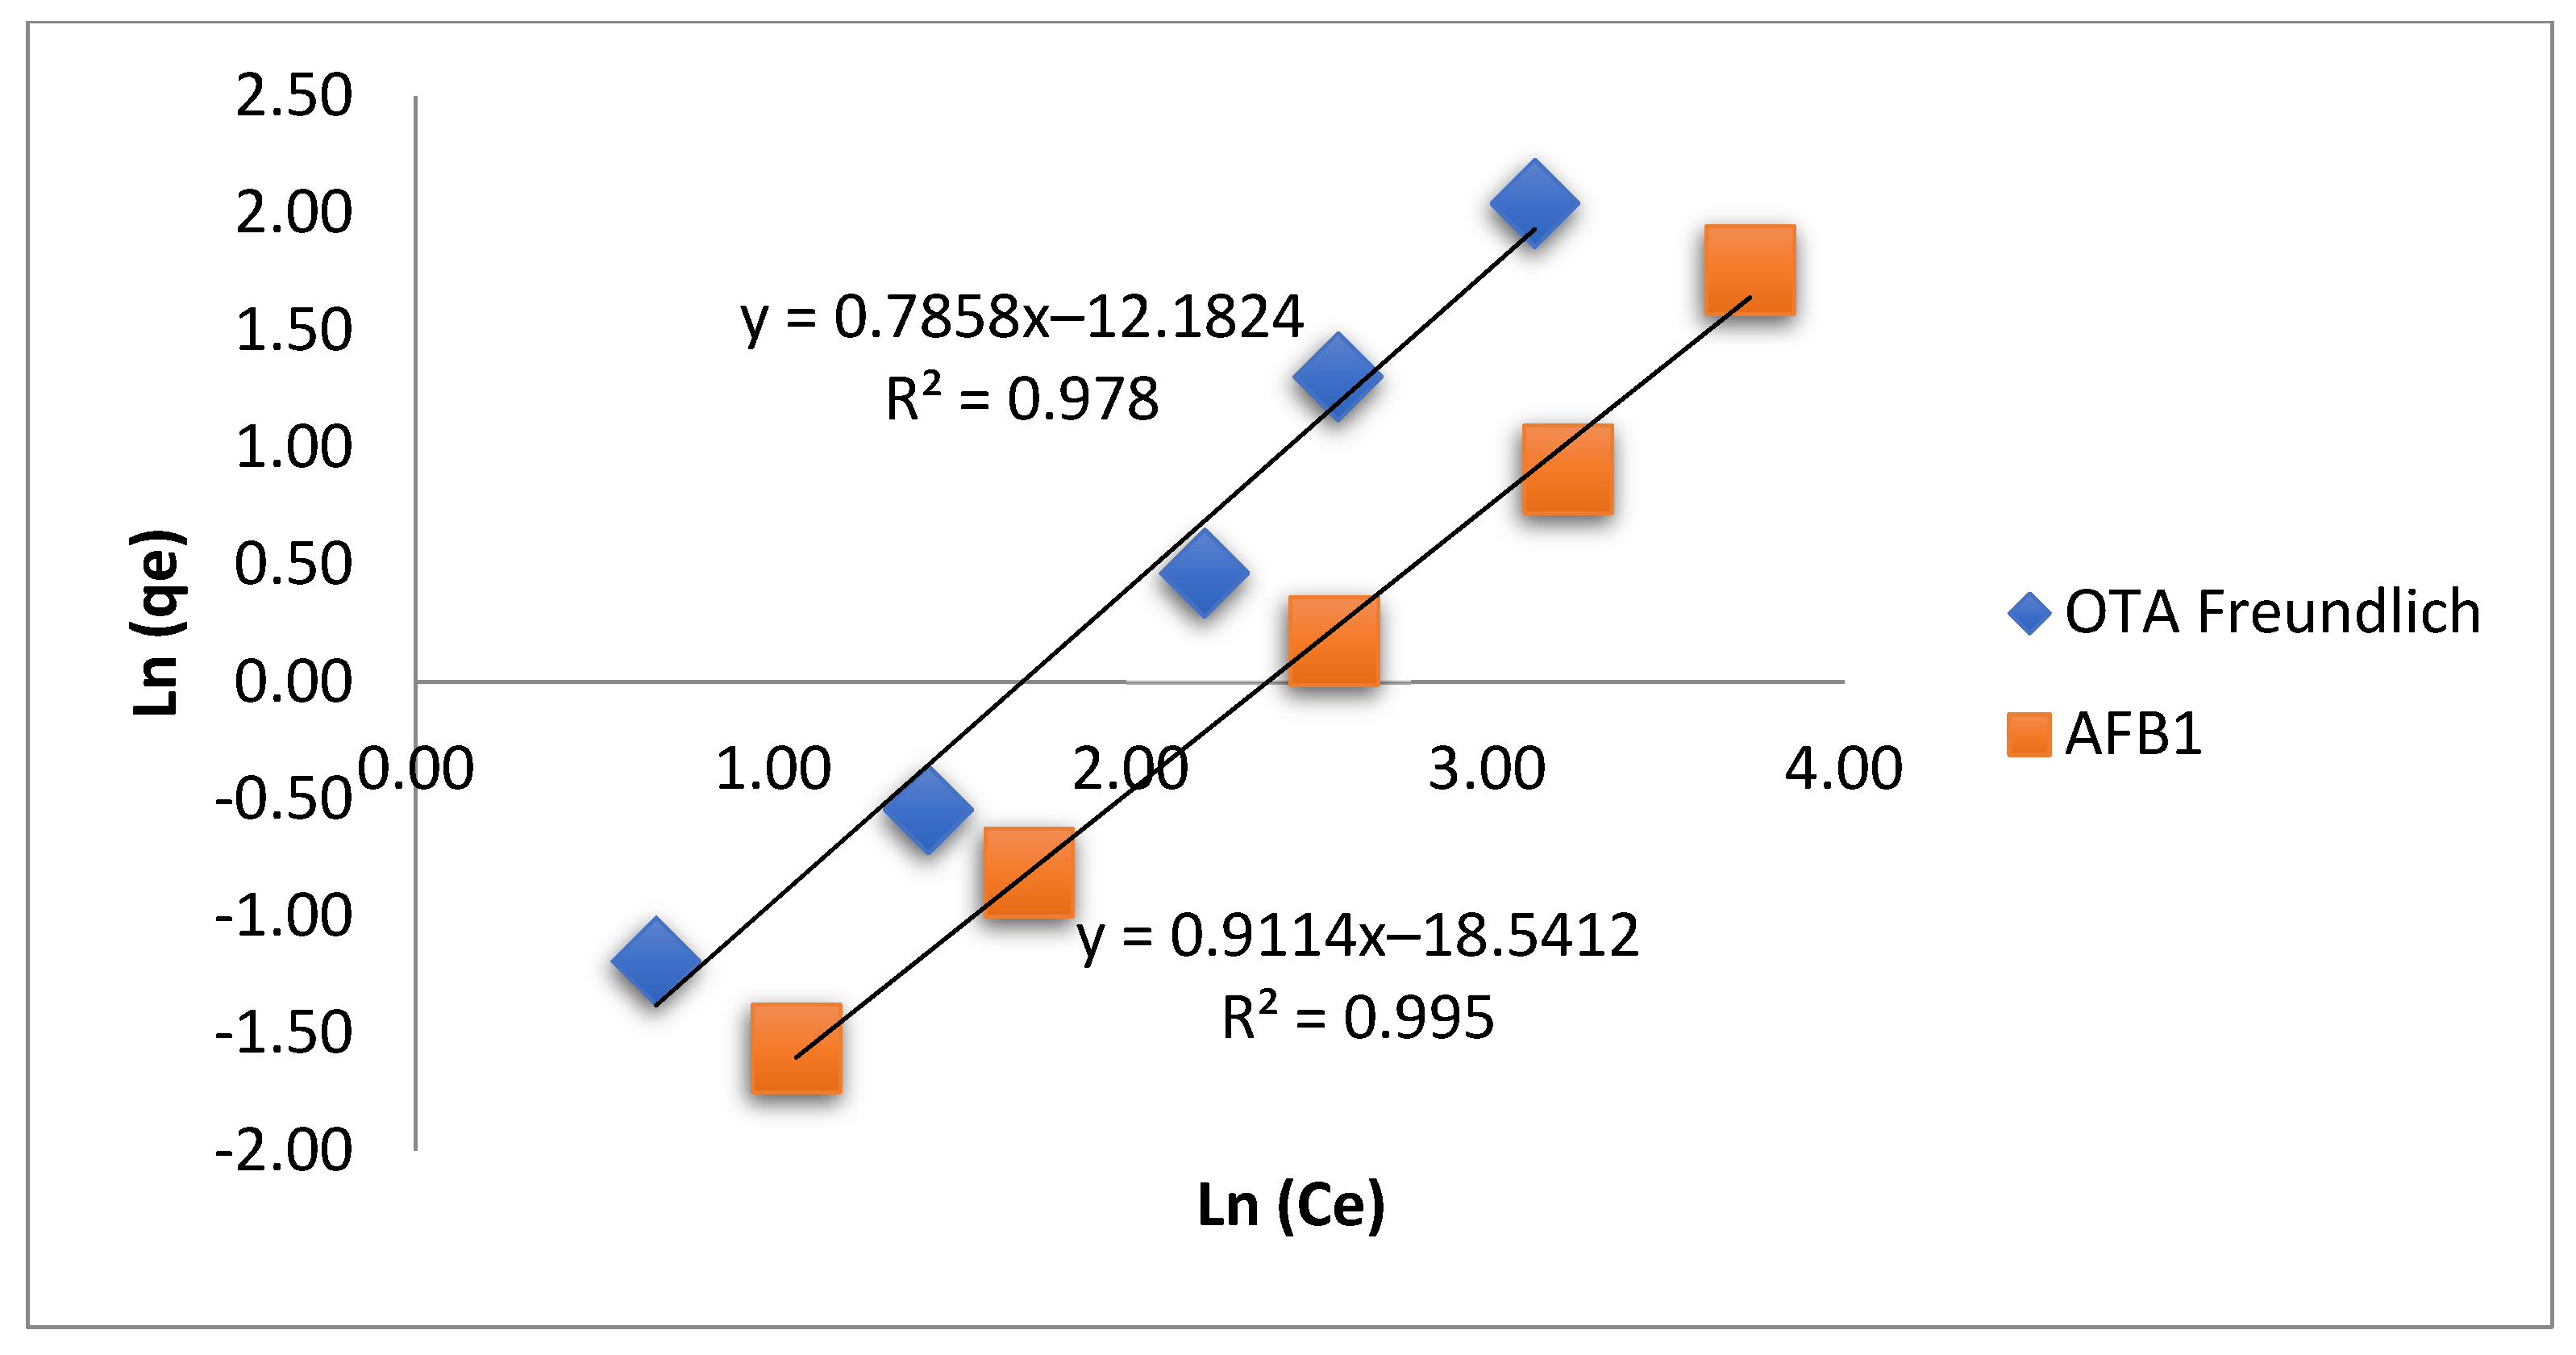
3.5. Adsorption Isotherm

The adsorption isotherm is an important statistic aimed at the surface properties of the adsorbent, the capacity of adsorption, and the design of adsorption systems [35]. For a better understanding of the adsorption isotherm, it is crucial to depict equilibrium adsorption curves. Langmuir and Freundlich adsorption isotherm representations were sourced to define the values in this research.
Linear plots of Freundlich isotherm of AFB1 and OTA into MGO is shown in Figure 6. The rate of n is not just a measure of the aberration from linearity; it also depicts the intensity of adsorption. Therefore, isotherms with n values greater than 1 are classified to be isotherms with a large affinity between adsorbate and adsorbent and are measured as a sign of chemisorption [45]. Conventionally, qmax, is determined from the Langmuir model. However, this parameter can also be estimated from the Freundlich model. According to Halsey’s equation [46].
K F = q max C 0 ( 1 n )
where C0 = the initial concentration of the solute in the solution (ng·L−1) and qmax = the Freundlich maximum adsorption ability (ng·g−1), which can illustrate the quantity of mycotoxins onto MGO as adsorbent per unit of equilibrium concentration.
All model parameters obtained from both isotherm models are shown in Table 4. The Langmuir and Freundlich curves were interpreted with respect to correlation coefficient R2. The results revealed that (0.978 < R2 <0.995) of the Freundlich isotherm with MGO was more appropriate than the Langmuir model, as evidenced in Table 4. In addition, the calculated maximum adsorption capacity (qmax) can be confirmed by the Freundlich model, which is an indication of the successful fitting. The value of n greater than 1 (1/n < 1) indicates favorable interaction between the mycotoxins and MGO. The values of adsorption intensity for the entirety of the mycotoxins were greater than 1, indicating that the interaction between the mycotoxins and adsorbent was promising, as shown in Table 4. Hence, it is clear that the Freundlich isotherm showed better adsorption of mycotoxins. The maximum adsorption capacity values of AFB1 and OTA by the Freundlich isotherm were observed at 153 and 95 ng/g, respectively.
The results in the current case indicate that the capacity of MGO is higher for the adsorption of AFB1 than that of OTA. The results of the adsorption of AFB1 show high adsorption capacity onto MGO due to stereochemistry and hydrophobic interactions of this mycotoxin, which can be described in different binding processes, such as electrostatic (ionic) interactions, π–π interactions, and hydrogen bindings, although there is no accurate explanation about the mechanism of AFB1 detoxification onto MGO.
Results of the recovery of all the experimental response values presented that this method is acceptable to be used for AFB1 and OTA removal with MGO in PKC. Recovery values ranged from 81% to 112% for mycotoxins, as reported in [47].
Based on the literature survey, the adsorption of AFB1 and OTA simultaneously on different adsorbents, such as cross-linked chitosan and tri-octahedral bentonites have been fitted with the Freundlich isotherm [48,49]. The authors dealt with an n value that gives information on the population of the binding sites and the adsorption intensity, and it is associated with the favorability of the binding process. The n values of AFB1 and OTA adsorption have been reported by Aibo Wu et al. as 0.65 and 0.42, respectively. Despite the fact that PilarVila-Donat et al. have represented a significant n value for AFB (1.90), OTA has shown a low level of n value (0.21) or not coverage (NC). The comparison to the n value of sorption on MGO indicated that there is high adsorption intensity. The huge adsorption intensity might be due to the ionic interactions between the abundant iron oxide, hydroxyl, and carboxyl functional groups on MGO and mycotoxins.

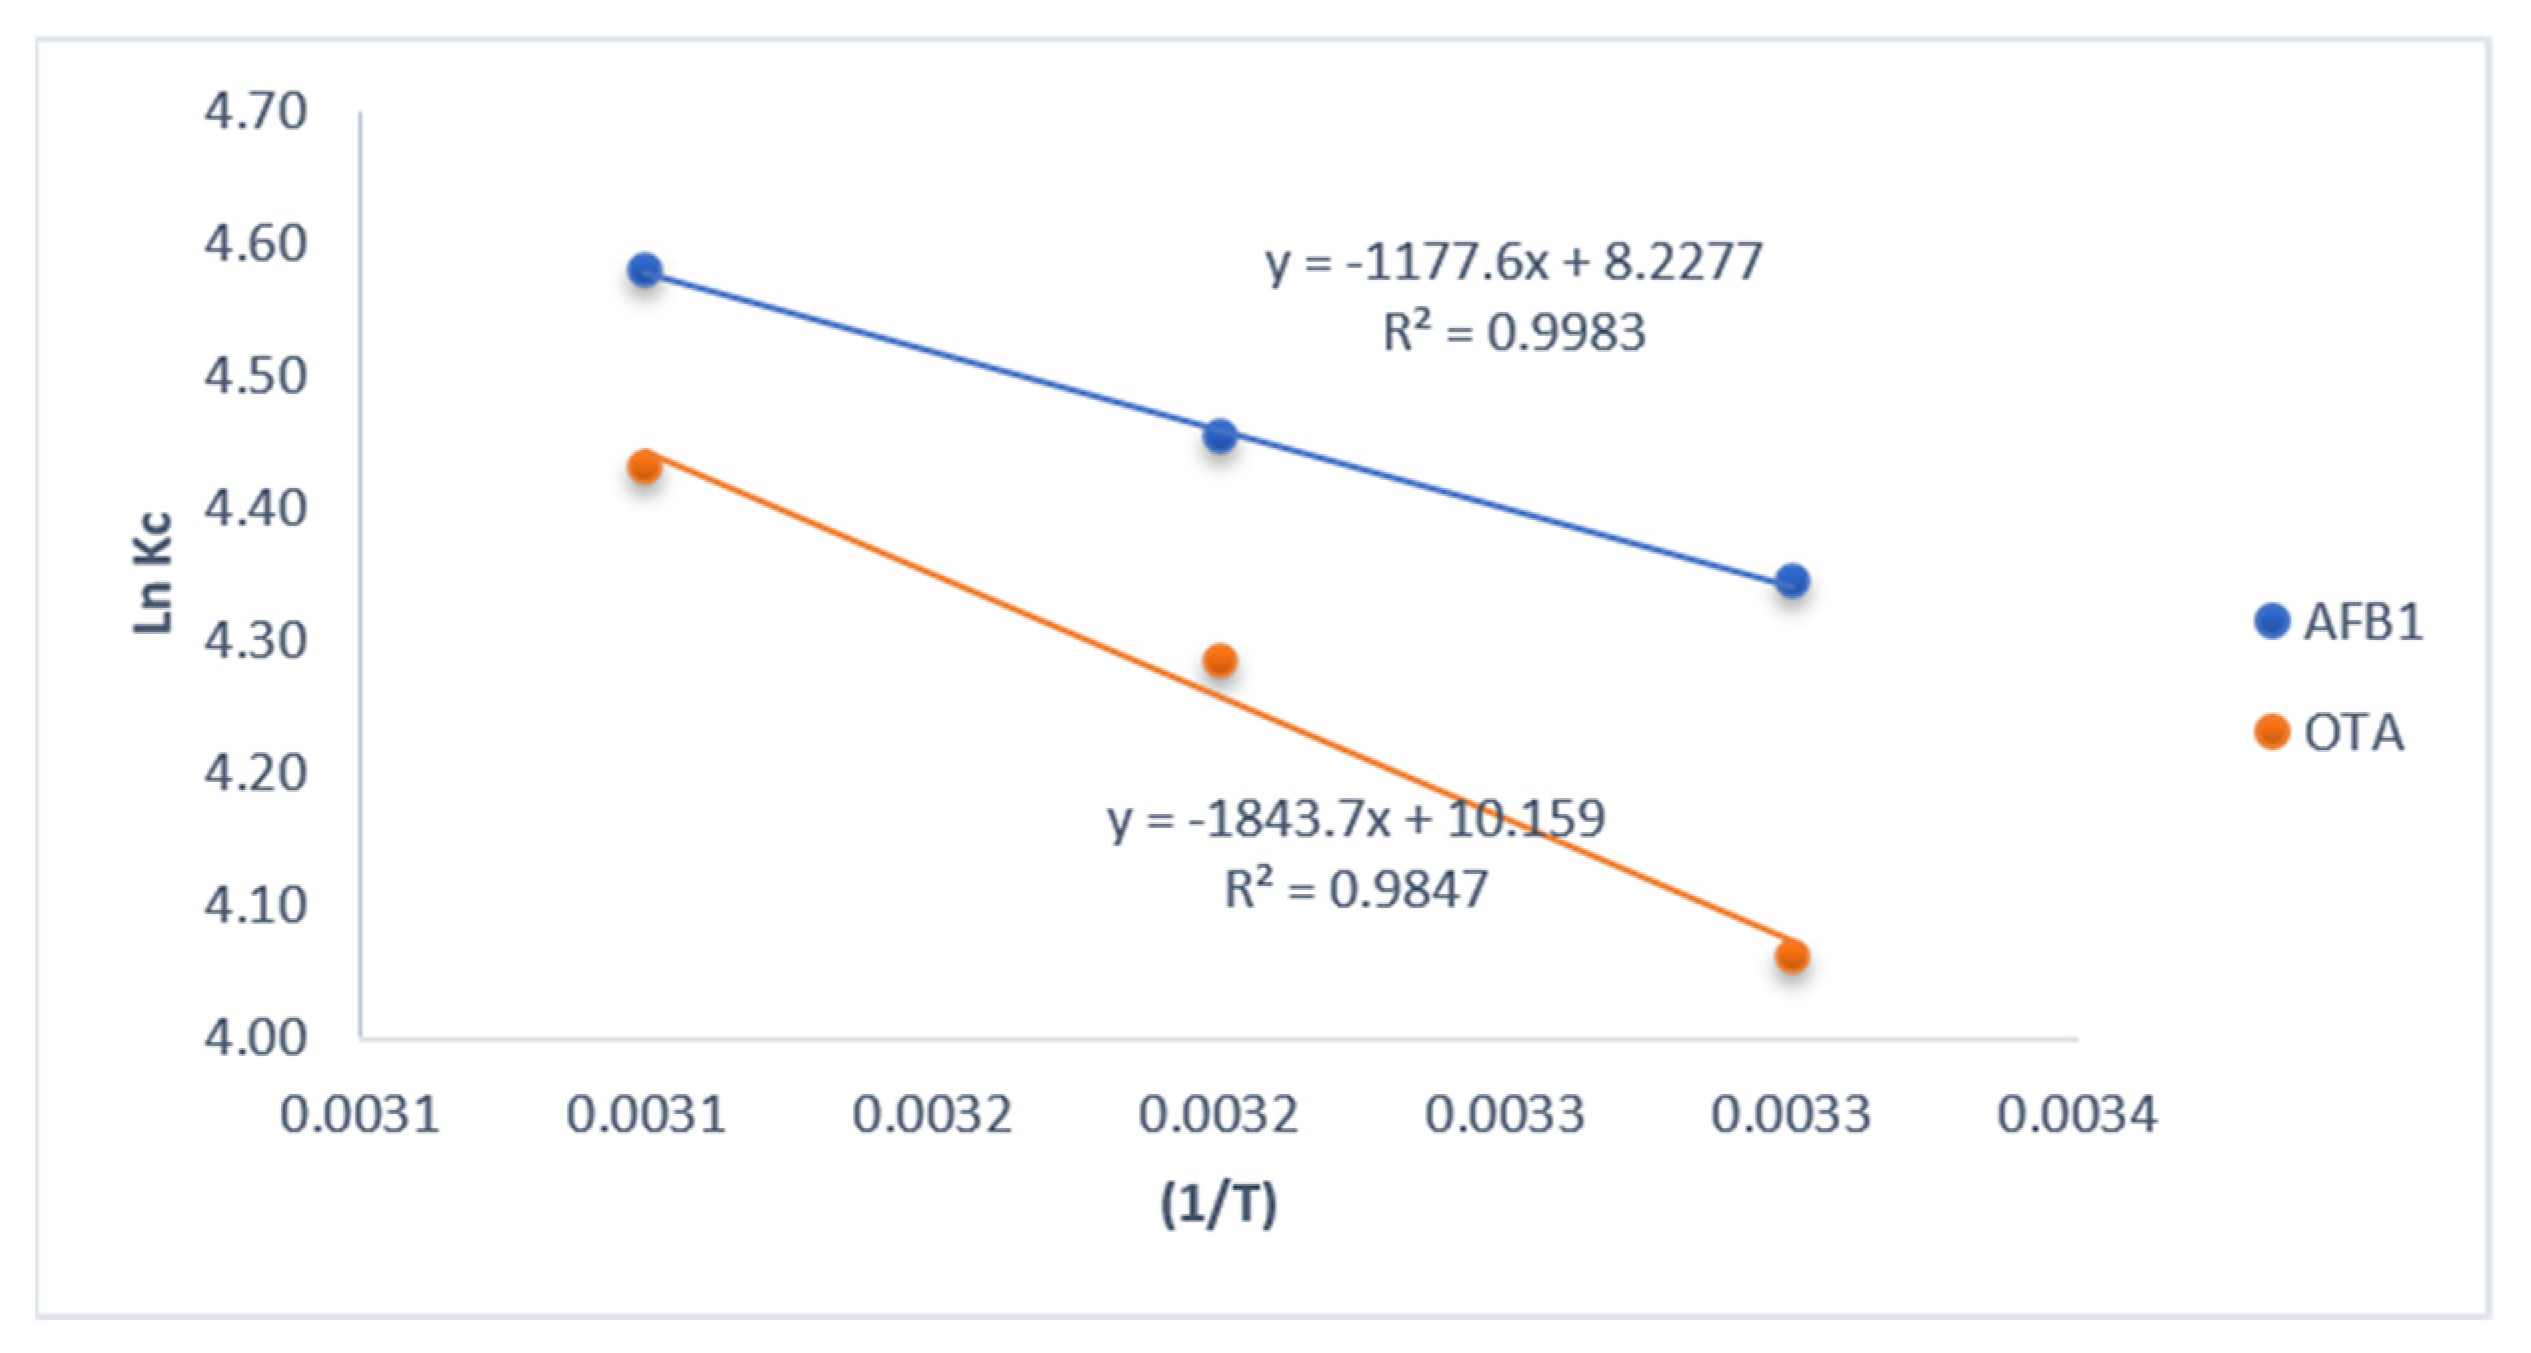
3.6. Thermodynamic Study

In this study, the spontaneous nature (the negative values of free energy) of the adsorption at different temperatures is demonstrated, as illustrated in Table 5. Hence, the positive values entropy fluctuations (ΔS°) formed the amplified unpredictability throughout the adsorption procedure. Likewise, it was noted that the adsorption of these mycotoxins onto MGO was originated to surge by means of increasing temperature, as shown in Figure 7. Thus, the positive values of ΔH° show that the detoxification of mycotoxins with MGO is an endothermic reaction [38]. The moderately high values of enthalpy may be ascribed to the covalent or ionic bond between the functional groups of adsorbates and adsorbent. Therefore, the thermodynamic data indicate that the sorption is governed mainly by a chemisorption process [50].

4. Conclusions

To the best knowledge of the researchers of this study, this stands to be the first instance in which the MGO nanocomposite absorption of AFB1 and OTA is investigated simultaneously in animal feed. Numerical examination using RSM has revealed the optimum point for detoxification of mycotoxins with MGO as pH 5, for a duration of 5 h, and at a temperature of 40 °C. Analysis of adsorption mechanisms displayed that the hydroxyl groups of MGO are predominantly responsible for binding mycotoxins. The adsorption data of AFB1 and OTA on adsorbents show that the pseudo-second-order model was more suitable than the pseudo-first-order model. Thus, the adsorption of mycotoxins onto MGO could likely be due to electrostatic attraction forces, hydrogen bonding, and valency forces between the adsorbent and the adsorbate. In equilibrium adsorption isotherm, the Langmuir model did not correlate well with the adsorption data. On the contrary, the Freundlich isotherm model described the adsorption data adequately. Mycotoxins were adsorbed by MGO in the following order of adsorption capacity: AFB1 > OTA. According to the results, the adsorption capacities were significantly affected by temperature. This effect should be compensated with the required properties of adsorbents and different structures of mycotoxins. Based on the thermodynamic data, it was concluded that the adsorption of AFB1 and OTA onto MGO was spontaneous because of the negative values of ΔG°; therefore, the positive values of ΔS° confirmed that the randomness increases at the solid/liquid interface. On the other hand, the influence of temperature and negative values of change in enthalpies in thermodynamic analysis reveals the exothermic nature of the adsorption process. The presented technique bids strong compensations, counting simplicity, decreased the lowest concentration of mycotoxins in the animal feed. Most importantly, there was a total separation of MGO after the mycotoxins were diminished compared to other methods for the detoxification of mycotoxins.

Supplementary Materials

The following are available online at https://www.mdpi.com/article/10.3390/coatings11111346/s1, Figure S1: Response surface plots of significant (p < 0.05) interaction effect of variables on the reduction of the mycotoxins with MGO, Table S1: Matrix of the central composite design (CCD), Table S2: F-ratio and p-value for each independent variable effect in the polynomial response surface models.

Author Contributions

Conceptualisation, A.A.P. and J.S.; Methodology, A.A.P., R.S. and J.S. Software, A.A.P.; Validation, N.N.J., R.S. and J.S.; Formal Analysis, A.A.P.; Investigation, N.N.J., R.S. and J.S.; Resources, J.S.; Data curation, A.A.P.; Writing—original draft preparation, A.A.P.; Writing—review and editing, A.A.P., N.N.J., R.S. and J.S.; Visualisation, R.S. and J.S.; Supervision, N.N.J., R.S. and J.S.; Project Administration, J.S.; Funding Acquisition, J.S. All authors have read and agreed to the published version of the manuscript.

Funding

This work is kindly supported by the Universiti Putra Malaysia (UPM) through GBP Grant Scheme (UPM/800-3/3/1/GPB/2018/9658100).

Institutional Review Board Statement

Not applicable.

Informed Consent Statement

Not applicable.

Data Availability Statement

Not applicable.

Acknowledgments

The authors also would like to thank the Institute of Tropical Agriculture and Food Security (ITAFoS) and the Faculty of Food Science and Technology, Universiti Putra Malaysia for providing research materials, equipment, and research facilities. The authors would like to thank the Ministry of Higher Education, Malaysia for the Higher Institution Centres of Excellence (HICoE) awarded to ITAFoS.

Conflicts of Interest

In accordance with the Coatings Journal Publishing Group, authors declare no competing nor any other interests that might be perceived as affecting result factors were involved in this study.

References

  1. Hussein, H.S.; Brasel, J.M.J.T. Toxicity, metabolism, and impact of mycotoxins on humans and animals. Toxicology 2001, 167, 101–134. [Google Scholar] [CrossRef]
  2. Zain, M.E. Impact of mycotoxins on humans and animals. J. Saudi Chem. Soc. 2011, 15, 129–144. [Google Scholar] [CrossRef] [Green Version]
  3. Bhat, R.; Rai, R.V.; Karim, A.A. Mycotoxins in food and feed: Present status and future concerns. Compr. Rev. Food Sci. Food Saf. 2010, 9, 57–81. [Google Scholar] [CrossRef] [PubMed]
  4. Zhao, L.; Feng, Y.; Wei, J.-T.; Zhu, M.-X.; Zhang, L.; Zhang, J.-C.; Karrow, N.A.; Han, Y.-M.; Wu, Y.-Y.; Guo, Y.-M.J.T. Mitigation Effects of Bentonite and Yeast Cell Wall Binders on AFB1, DON, and OTA Induced Changes in Laying Hen Performance, Egg Quality, and Health. Toxins 2021, 13, 156. [Google Scholar] [CrossRef] [PubMed]
  5. Adegoke, G.O.; Letuma, P. Strategies for the prevention and reduction of mycotoxins in developing countries. In Mycotoxin and Food Safety in Developing Countries; IntechOpen: London, UK, 2013. [Google Scholar]
  6. Luo, Y.; Liu, X.; Li, J. Updating techniques on controlling mycotoxins—A review. Food Control 2018, 89, 123–132. [Google Scholar] [CrossRef]
  7. Peng, W.-X.; Marchal, J.; van der Poel, A. Strategies to prevent and reduce mycotoxins for compound feed manufacturing. Anim. Feed Sci. Technol. 2018, 237, 129–153. [Google Scholar] [CrossRef]
  8. Zhu, Y.; Hassan, Y.I.; Watts, C.; Zhou, T. Innovative technologies for the mitigation of mycotoxins in animal feed and ingredients—A review of recent patents. Anim. Feed Sci. Technol. 2016, 216, 19–29. [Google Scholar] [CrossRef]
  9. Kolosova, A.; Stroka, J. Substances for reduction of the contamination of feed by mycotoxins: A review. World Mycotoxin J. 2011, 4, 225–256. [Google Scholar] [CrossRef]
  10. Manafi, M.; Umakantha, B.; Narayana Swamy, H.; Mohan, K. Evaluation of high-grade sodium bentonite on performance and immune status of broilers, fed ochratoxin and aflatoxin. World Mycotoxin J. 2009, 2, 435–440. [Google Scholar] [CrossRef]
  11. Sabater-Vilar, M.; Malekinejad, H.; Selman, M.; Van der Doelen, M.; Fink-Gremmels, J. In vitro assessment of adsorbents aiming to prevent deoxynivalenol and zearalenone mycotoxicoses. Mycopathologia 2007, 163, 81. [Google Scholar] [CrossRef] [Green Version]
  12. Sprynskyy, M.; Gadzała-Kopciuch, R.; Nowak, K.; Buszewski, B. Removal of zearalenone toxin from synthetics gastric and body fluids using talc and diatomite: A batch kinetic study. Colloids Surf. B Biointerfaces 2012, 94, 7–14. [Google Scholar] [CrossRef] [PubMed]
  13. Boudergue, C.; Burel, C.; Dragacci, S.; FAVROT, M.C.; FREMY, J.M.; Massimi, C.; PRIGENT, P.; Debongnie, P.; Pussemier, L.; Boudra, H. Review of mycotoxin-detoxifying agents used as feed additives: Mode of action, efficacy and feed/food safety. EFSA Supporting Publ. 2009, 6, 22E. [Google Scholar] [CrossRef]
  14. Quintela, S.; Villarán, M.; De Armentia, I.L.; Elejalde, E. Ochratoxin A removal from red wine by several oenological fining agents: Bentonite, egg albumin, allergen-free adsorbents, chitin and chitosan. Food Addit. Contam. Part A 2012, 29, 1168–1174. [Google Scholar] [CrossRef]
  15. Liang, J.; Xu, Y.; Sui, D.; Zhang, L.; Huang, Y.; Ma, Y.; Li, F.; Chen, Y. Flexible, magnetic, and electrically conductive graphene/Fe3O4 paper and its application for magnetic-controlled switches. J. Phys. Chem. C 2010, 114, 17465–17471. [Google Scholar] [CrossRef]
  16. Wang, H.; Yuan, X.; Wu, Y.; Chen, X.; Leng, L.; Wang, H.; Li, H.; Zeng, G. Facile synthesis of polypyrrole decorated reduced graphene oxide–Fe3O4 magnetic composites and its application for the Cr (VI) removal. Chem. Eng. J. 2015, 262, 597–606. [Google Scholar] [CrossRef]
  17. Sun, L.; Fugetsu, B. Mass production of graphene oxide from expanded graphite. Mater. Lett. 2013, 109, 207–210. [Google Scholar] [CrossRef] [Green Version]
  18. Medina, A.; Casado-Carmona, F.A.; López-Lorente, Á.I.; Cárdenas, S.J.N. Magnetic graphene oxide composite for the microextraction and determination of benzophenones in water samples. Nanomaterials 2020, 10, 168. [Google Scholar] [CrossRef] [Green Version]
  19. Cui, G.; Lu, Y.; Zhou, W.; Lv, X.; Hu, J.; Zhang, G.; Gu, G.J.N. Excellent microwave absorption properties derived from the synthesis of hollow Fe3O4@reduced graphite oxide (RGO) nanocomposites. Nanomaterials 2019, 9, 141. [Google Scholar] [CrossRef] [Green Version]
  20. Kaushik, A.; Solanki, P.R.; Ansari, A.A.; Ahmad, S.; Malhotra, B.D. Chitosan–iron oxide nanobiocomposite based immunosensor for ochratoxin-A. Electrochem. Commun. 2008, 10, 1364–1368. [Google Scholar] [CrossRef]
  21. Deng, J.-H.; Zhang, X.-R.; Zeng, G.-M.; Gong, J.-L.; Niu, Q.-Y.; Liang, J. Simultaneous removal of Cd (II) and ionic dyes from aqueous solution using magnetic graphene oxide nanocomposite as an adsorbent. Chem. Eng. J. 2013, 226, 189–200. [Google Scholar] [CrossRef]
  22. Purtov, K.; Shenderova, O.; Luo, M.; Brenner, D.; Bondar, V. The adsorption of aflatoxin B1 by detonation-synthesis nanodiamonds. In Proceedings of the Doklady Biochemistry and Biophysics, Krasnoyarsk, Russia, 22 May 2007; pp. 299–301. [Google Scholar]
  23. Soleimany, F.; Jinap, S.; Rahmani, A.; Khatib, A. Contaminants. Simultaneous detection of 12 mycotoxins in cereals using RP-HPLC-PDA-FLD with PHRED and a post-column derivatization system. Food Addit. Contam. Part A 2011, 28, 494–501. [Google Scholar] [CrossRef]
  24. Afsah-Hejri, L.; Jinap, S.; Arzandeh, S.; Mirhosseini, H. Optimization of HPLC conditions for quantitative analysis of aflatoxins in contaminated peanut. Food Control 2011, 22, 381–388. [Google Scholar] [CrossRef]
  25. Ko, W.-C.; Chang, C.-K.; Wang, H.-J.; Wang, S.-J.; Hsieh, C.-W. Process optimization of microencapsulation of curcumin in γ-polyglutamic acid using response surface methodology. Food Chem. 2015, 172, 497–503. [Google Scholar] [CrossRef] [PubMed]
  26. Mehrnoush, A.; Tan, C.P.; Hamed, M.; Aziz, N.A.; Ling, T.C. Optimisation of freeze drying conditions for purified serine protease from mango (Mangifera indica Cv. Chokanan) peel. Food Chem. 2011, 128, 158–164. [Google Scholar] [CrossRef] [PubMed]
  27. Ibáñez-Vea, M.; Corcuera, L.A.; Remiro, R.; Murillo-Arbizu, M.T.; González-Peñas, E.; Lizarraga, E. Validation of a UHPLC-FLD method for the simultaneous quantification of aflatoxins, ochratoxin A and zearalenone in barley. Food Chem. 2011, 127, 351–358. [Google Scholar] [CrossRef]
  28. Tran, L.; Wu, P.; Zhu, Y.; Liu, S.; Zhu, N. Comparative study of Hg (II) adsorption by thiol-and hydroxyl-containing bifunctional montmorillonite and vermiculite. Appl. Surf. Sci. 2015, 356, 91–101. [Google Scholar] [CrossRef]
  29. Robati, D. Pseudo-second-order kinetic equations for modeling adsorption systems for removal of lead ions using multi-walled carbon nanotube. J. Nanostructure Chem. 2013, 3, 1–6. [Google Scholar] [CrossRef] [Green Version]
  30. Luo, Y.; Li, Z.; Yuan, Y.; Yue, T. Bioadsorption of patulin from kiwi fruit juice onto a superior magnetic chitosan. J. Alloys Compd. 2016, 667, 101–108. [Google Scholar] [CrossRef]
  31. Azizian, S.; Haerifar, M.; Basiri-Parsa, J. Extended geometric method: A simple approach to derive adsorption rate constants of Langmuir–Freundlich kinetics. Chemosphere 2007, 68, 2040–2046. [Google Scholar] [CrossRef]
  32. Langmuir, I. The adsorption of gases on plane surfaces of glass, mica and platinum. J. Am. Chem. Soc. 1918, 40, 1361–1403. [Google Scholar] [CrossRef] [Green Version]
  33. Kilpatrick, M.; Baker, L., Jr.; McKinney, C., Jr. Studies of Fast Reactions Which Evolve Gases. the Reaction of Sodium-Potassium Alloy with Water in the Presence and Absence of Oxygen. Technical Report No. 6; Illinois Inst. of Tech.: Chicago, IL, USA, 1952. [Google Scholar]
  34. Barati, A.; Najafi, A.; Daryasafar, A.; Nadali, P.; Moslehi, H. Adsorption of a new nonionic surfactant on carbonate minerals in enhanced oil recovery: Experimental and modeling study. Chem. Eng. Res. Des. 2016, 105, 55–63. [Google Scholar] [CrossRef]
  35. Dada, A.O.; Ojediran, J.; Okunola, A.; Dada, F.E.; Lawal, A.; Isola, L.A.; Olalekan, A.P.; Dada, O.; Dada, J.O.O.; Ojediran, A.A.; et al. Modeling of biosorption of Pb (II) and Zn (II) ions onto PaMRH: Langmuir, Freundlich, Temkin, Dubinin-Raduskevich, Jovanovic, Flory-Huggins, Fowler-Guggenheim and Kiselev comparative isotherm studies. Int. J. Mech. Eng. Technol. 2019, 10, 1048–1058. [Google Scholar]
  36. Debnath, S.; Maity, A.; Pillay, K. Magnetic chitosan–GO nanocomposite: Synthesis, characterization and batch adsorber design for Cr (VI) removal. J. Environ. Chem. 2014, 2, 963–973. [Google Scholar] [CrossRef]
  37. Chuanyu, S.; Yu, W. Synthesis and characterization of graphene oxide composite with Fe3O4. Mater. Sci. 2015, 33, 488–490. [Google Scholar] [CrossRef] [Green Version]
  38. Cui, L.; Guo, X.; Wei, Q.; Wang, Y.; Gao, L.; Yan, L.; Yan, T.; Du, B. Removal of mercury and methylene blue from aqueous solution by xanthate functionalized magnetic graphene oxide: Sorption kinetic and uptake mechanism. J. Colloid Interface Sci. 2015, 439, 112–120. [Google Scholar] [CrossRef] [PubMed]
  39. Pirouz, A.; Selamat, J.; Iqbal, S.; Mirhosseini, H.; Karjiban, R.A.; Bakar, F.A. The use of innovative and efficient nanocomposite (magnetic graphene oxide) for the reduction on of Fusarium mycotoxins in palm kernel cake. Sci. Rep. 2017, 7, 12453. [Google Scholar] [CrossRef]
  40. Yang, J.H.; Ramaraj, B.; Yoon, K.R. Preparation and characterization of superparamagnetic graphene oxide nanohybrids anchored with Fe3O4 nanoparticles. J. Alloys Compd. 2014, 583, 128–133. [Google Scholar] [CrossRef]
  41. Pirouz, A.A.; Karjiban, R.A.; Bakar, F.A.; Selamat, J. A novel adsorbent magnetic graphene oxide modified with chitosan for the simultaneous reduction of mycotoxins. Toxins 2018, 10, 361. [Google Scholar] [CrossRef] [Green Version]
  42. Pirouz, A.A.; Selamat, J.; Iqbal, S.Z.; Samsudin, N.I.P. Efficient and simultaneous chitosan-mediated removal of 11 mycotoxins from palm kernel cake. Toxins 2020, 12, 115. [Google Scholar] [CrossRef] [Green Version]
  43. Mirhosseini, H.; Tan, C.P.; Taherian, A.R.; Boo, H.C. Modeling the physicochemical properties of orange beverage emulsion as function of main emulsion components using response surface methodology. Carbohydr. Polym. 2009, 75, 512–520. [Google Scholar] [CrossRef]
  44. Li, L.; Fan, L.; Sun, M.; Qiu, H.; Li, X.; Duan, H.; Luo, C. Adsorbent for chromium removal based on graphene oxide functionalized with magnetic cyclodextrin–chitosan. Colloids Surf. B Biointerfaces 2013, 107, 76–83. [Google Scholar] [CrossRef] [PubMed]
  45. Hafshejani, L.D.; Nasab, S.B.; Gholami, R.M.; Moradzadeh, M.; Izadpanah, Z.; Hafshejani, S.B.; Bhatnagar, A. Removal of zinc and lead from aqueous solution by nanostructured cedar leaf ash as biosorbent. J. Mol. Liq. 2015, 211, 448–456. [Google Scholar] [CrossRef]
  46. Baccar, R.; Sarrà, M.; Bouzid, J.; Feki, M.; Blánquez, P. Removal of pharmaceutical compounds by activated carbon prepared from agricultural by-product. Chem. Eng. J. 2012, 211, 310–317. [Google Scholar] [CrossRef]
  47. Yibadatihan, S.; Jinap, S.; Mahyudin, N.A. Simultaneous determination of multi-mycotoxins in palm kernel cake (PKC) using liquid chromatography-tandem mass spectrometry (LC-MS/MS). Food Addit. Contam. Part A 2014, 31, 2071–2079. [Google Scholar] [CrossRef]
  48. Zhao, Z.; Liu, N.; Yang, L.; Wang, J.; Song, S.; Nie, D.; Yang, X.; Hou, J.; Wu, A. Cross-linked chitosan polymers as generic adsorbents for simultaneous adsorption of multiple mycotoxins. Food Control 2015, 57, 362–369. [Google Scholar] [CrossRef]
  49. Vila-Donat, P.; Marín, S.; Sanchis, V.; Ramos, A.J. New mycotoxin adsorbents based on tri-octahedral bentonites for animal feed. Anim. Feed. Sci. Technol. 2019, 255, 114228. [Google Scholar] [CrossRef]
  50. Wu, H.; Salles, F.; Zajac, J. A critical review of solid materials for low-temperature thermochemical storage of solar energy based on solid-vapour adsorption in view of space heating uses. Molecules 2019, 24, 945. [Google Scholar] [CrossRef] [PubMed] [Green Version]
Figure 1. XRD patterns of (a) graphite and (b) magnetic graphene oxide.
Coatings 11 01346 g001
Figure 2. TEM and FESEM micrograph of GO and MGO: (a) TEM of GO, (b) TEM of MGO, and (c) FESEM of MGO.
Coatings 11 01346 g002
Figure 3. FTIR spectra of (a) graphene oxide, (b) magnetic graphene oxide, and (c) mycotoxins loaded with MGO.
Coatings 11 01346 g003
Figure 4. Response optimizer graph showing the predicted optimum point.
Coatings 11 01346 g004
Figure 5. Pseudo-second-order kinetics for adsorption of AFB1 and OTA with MGO.
Coatings 11 01346 g005
Figure 6. Freundlich isotherm plot during sorption of mycotoxins with the adsorbent (at 40 °C and pH 5).
Coatings 11 01346 g006
Figure 7. Plots of ln(Kc) vs. 1/T for evaluation of thermodynamic data.
Coatings 11 01346 g007
Table 1. Experimental settings of independent process variables.
Experimental VariablesExperimental Variables Level
Independent variables−10+1
pH (X1)357
Time (X2)357
Temperature (X3)304050
Time: hour, Temperature: °C.
Table 2. Comparison between experimental and predicted values based on the final reduced models of reduction of mycotoxins with MGO.
ResponsepHTime (h)Temperature (°C)Y0YiY0 − YiDesirability
AFB1554094.09 ± 1.7890.59 ± 1.053.5 ± 0.730.934
OTA554058.16 ± 2.0659.96 ± 1.41−1.80 ± 0.650.934
Table 3. Adsorption kinetics parameters of mycotoxins sorption onto adsorbent (T = 40 °C and pH = 5).
MycotoxinsPseudo-First-OrderPseudo-Second-Order
k1 (1/min)qeR2k2 (g/ng·min)qeR2
AFB10.0042.360.9350.0034.080.965
OTA0.0052.020.9250.0043.180.981
k1: the PFO constant (1/min). k2: the PSO rate constant (g/ng·min), qe: the adsorption ability at equilibrium (ng/g).
Table 4. Langmuir and Freundlich parameters for the adsorption of mycotoxins with MGO (at 40 °C, 5 h, and pH 5).
MycotoxinLangmuir ModelFreundlich Model
T
(°C)
qmax
(ng/g)
KL
(L/mg)
R2KF
(ng·L/g)
nqmax
(ng/g)
R2
AFB1404.930.680.8472.921.101530.995
OTA406.540.010.9592.501.27950.978
KL: Langmuir constants, KF: Freundlich constants, qmax: the adsorption capacity at equilibrium(ng/g), n: adsorption intensity.
Table 5. Thermodynamic data for the adsorption of mycotoxins with the adsorbent (pH = 5, t = 5 h).
MycotoxinC0
ng/g
qeKcln(Kc)TΔG°
(kj/mol·K)
ΔH°
(kj/mol)
ΔS°
(j/mol·K)
AFB1100770477.044.34303−3.69−1.188.27
100859485.944.45313−3.77
100975097.504.58323−3.85
OTA100580658.064.06303−4.92−1.8410.16
100726572.654.29313−5.02
100839583.954.43323−5.12
C0: highest concentration, T: temperature (in Kelvin), qe: the adsorption capacity at equilibrium(mg/mL).
Publisher’s Note: MDPI stays neutral with regard to jurisdictional claims in published maps and institutional affiliations.

