Article

Comparison of Biocompatible Coatings Produced by Plasma Electrolytic Oxidation on cp-Ti and Ti-Zr-Nb Superelastic Alloy

1
Department of Theoretical Basis of Electrical Engineering, Ufa State Aviation Technical University, 12 Karl Marx Street, Ufa 450008, Russia
2
Metal Forming Department, National University of Science and Technology MISIS, 4 Leninsky Prospect, Moscow 119049, Russia
*
Author to whom correspondence should be addressed.
Coatings 2021, 11(4), 401; https://doi.org/10.3390/coatings11040401
Submission received: 30 December 2020 / Revised: 8 March 2021 / Accepted: 29 March 2021 / Published: 31 March 2021
(This article belongs to the Special Issue Electrochemical and Electrophoretic Deposition of Bioactive Coatings)

Abstract

:
The paper compares the coatings produced by plasma electrolytic oxidation (PEO) on commercially pure titanium and a novel superelastic alloy Ti-18Zr-15Nb (at. %) for implant applications. The PEO coatings were produced on both alloys in the identical pulsed bipolar regime. The properties of the coatings were examined using scanning electron microscopy (SEM), X-ray diffraction (XRD), and energy-dispersive X-ray spectroscopy (EDX), potentiodynamic polarization (PDP), and electrochemical impedance spectroscopy (EIS). The PEO process kinetics was modeled based on the Avrami theorem and Cottrell equation using a relaxation method. The resultant coatings contain TiO2, for both alloys, and NbO2, Nb2O5, ZrO2 for Ti-18Zr-15Nb alloy. The coating on the Ti-18Zr-15Nb alloy has a higher thickness, porosity, and roughness compared to that on cp-Ti. The values of the kinetic coefficients of the PEO process—higher diffusion coefficient and lower time constant for the processing of Ti-18Zr-15Nb—explain this effect. According to the electrochemical studies, PEO coatings on Ti-18Zr-15Nb alloy provide better corrosion protection. Higher corrosion resistance, porosity, and roughness contribute to better biocompatibility of the PEO coating on Ti-18Zr-15Nb alloy compared to cp-Ti.

1. Introduction

Currently, bone implants made of metals and their alloys are widely used in orthopedics and dentistry. Due to the combination of bioinertness, strength, and low density [1,2,3], titanium and its alloys are commonly used for implant applications [4]. Titanium alloy Ti-6Al-4V is the predominant material for implant production because it combines corrosion resistance and high mechanical properties; however, this alloy contains cytotoxic elements Al and V, which can cause allergic reactions in the body tissues or a general toxic effect on the human organism [5]. The functional reliability of metal implants is largely determined by the elastic modulus values of the implant and bone tissue: the closer they are, the better. Since the elastic modulus for titanium and its commercial alloys are higher than that for the bone tissue, such an implant can damage the adjacent bone, promote osteoporosis, and lead to other undesirable consequences [6].
To overcome these biological and mechanical disadvantages, experimental Ti alloys doped with non-toxic elements such as niobium (Nb), zirconium (Zr), and tantalum (Ta) have been developed [7,8,9,10]. When exposed to an oxidative environment, oxide films of the alloy constituents (TiO2, Nb2O5, ZrO2, Ta2O5) are formed on the surface [11]. This oxide layer protects the substrate, provides corrosion resistance and chemical stability [11,12], and induces a number of biological reactions, which increases the biocompatibility of implants [13]. Moreover, stable and metastable β titanium alloys have both higher corrosion resistance and lower elastic modulus than α-type alloys, and especially commercially pure (cp) Ti [1,14,15]. Most of these ternary and quaternary alloys are based on a Ti-Nb system with additional alloying by Zr, Sn, Ta, Mo and Hf [2,15,16,17,18]. Furthermore, metastable β titanium alloys can be designed to exhibit a superelastic behavior at human body temperature, which promotes an additional decrease in the elastic modulus [17,18]. It was shown that Ti-18Zr-(14-15) Nb (at. %) alloy exhibits a high value of superelastic recovery strain (5–6%) [18], which is decisive for improving the functional fatigue resistance [19]. Thus, the Ti-18Zr-(14-15) Nb (at. %) alloy is a promising biocompatible material, allowing a reduction in the likelihood of implant failure.
The tissue response to a metal implant depends on the properties of the implant surface that gets into direct contact with the living tissue after the implantation [20]. To improve the osseointegration and biocompatibility of titanium and titanium alloys, various surface treatments are used [21,22,23]. Such methods can be based on mechanical, electrochemical, sol–gel techniques [24,25], physical vapor deposition [26], anodizing and plasma electrolytic oxidation (PEO) [27,28], hybrid, and other methods [29]. It should be noted that methods based on physical or chemical vapor deposition are considered as high-cost processes compared with the PEO, and they produce the coatings with rather less thickness. Other coating methods include high energy flux (HEF) surface treatment technologies, e.g., electron or laser beam technologies. Valkov et al. [30] have shown that electron beam machining (EBT) results in increased surface roughness compared to other HEFs. The higher surface roughness after the EBT process should be suitable to support the cell growth and adhesion to the coated surface.
Anodizing is anodic oxidation in which a metal workpiece is anodically polarized at voltages not exceeding the potential corresponding to the dielectric breakdown of the oxide layer. As a result of anodizing, relatively thin uniform oxide coatings of the barrier type are obtained [31]. Plasma electrolytic oxidation is a progression of the anodizing into higher voltages; it is a relatively new, inexpensive, and efficient method that allows the formation of a biocompatible oxide layer on the titanium alloys to improve cell attachment and adhesion to the implant surface [32,33,34]. The PEO process has a good throwing power; the resultant coatings are uniform, and they can be much thicker than conventional anodic films, with controllable porosity and good adhesion.
Numerous studies on the coating growth, biocompatibility, and corrosion resistance by variation of PEO technological parameters and/or electrolytes show that plasma electrolytic oxidation of β titanium alloys is described by different kinetics compared to that of cp-Ti because these alloys contain significant amounts of doping elements. Therefore, it is important to understand the differences between the mechanisms of PEO for cp-Ti and Ti-Zr-Nb alloys. Sowa et al. modified the surface of the Ti-13Nb-13Zr alloy using plasma electrolytic oxidation at various voltages at a fixed DC density [31]. This treatment increased the corrosion resistance and successful incorporation of Ca and P species into the PEO coatings. The topography of the resulting surface resembled the structure of a porous bone; this biomimetic effect improves the osseointegration, as shown elsewhere [35]. In another study, the authors produced DC PEO coatings on the gum metal Ti-36Nb-3Zr-2Ta in a calcium hypophosphite-based electrolyte system [31]. It was shown that, at the voltages applied (438 V and below), only Ti and Nb oxides were detected in the coating, both at the highest oxidation state. Tanase et al. [20] showed that 50 Hz AC PEO technology can be used to modify the surface of low-modulus β-titanium alloys with a porous structure that facilitates osseointegration. Songur et al. [36] formed PEO coatings on β-titanium alloy Ti-29Nb-13Ta-4.6Zr in pulsed DC regime at various frequencies with duty cycles from 10 to 30%. Corrosion rates in all coated samples were calculated approximately 4–14 times lower than those of the uncoated sample; the highest corrosion resistance was obtained in the PEO coatings obtained at 500 Hz with 30%.
Earlier, by optimization of the PEO process parameters and the coating composition, a pulsed bipolar PEO regime was proposed; this treatment has higher efficiency compared to DC, AC and pulsed DC PEO, and it helps to obtain biocompatible coatings on cp-Ti for implant applications [37,38]. Therefore, the goal of this research is to conduct a comparative analysis of the coatings obtained by plasma electrolytic oxidation in the same electrolyte and same pulsed bipolar regime on cp-Ti and the novel superelastic alloy Ti-18Zr-15Nb (at. %) for prospective use on spinal implants [18,39]. To the best of the authors’ knowledge, the pulsed bipolar PEO technology has not yet been investigated for this type of alloy.

2. Materials and Methods

2.1. Metal Sample Preparation and PEO Coating

In this work, samples made of titanium Grade 2 and the alloy Ti-18Zr-15Nb (TZN) were used. The TZN 15 kg ingot (supplied by NUST “MISIS”, Moscow, Russia) was produced by vacuum arc remelting. The melting of the alloy provided low amounts of impurities (O < 0.05, C < 0.01, N < 0.01, H < 0.01 in wt. %). Cp-Ti and TZN specimens were cut from a solid 9 mm rod as disks 0.5 mm thick using a spark cutting machine. Then, the disks were polished on abrasive paper until the roughness Ra < 0.1 μm was reached. Before carrying out plasma electrolytic oxidation, the samples were washed ultrasonically; first, in distilled water, then, in isopropyl alcohol, both for 5 min. To achieve a good electric contact, both for the PEO and for the consequent electrochemical tests, a copper wire was attached into a small hole drilled at the sample edge. The contact place and the copper wire were coated with an epoxy resin, which was able to withstand the applied voltage.
For the plasma electrolytic oxidation, a 10-L glass vessel was used; it was equipped with a stainless steel heat exchanger arranged around its walls. The electrolyte comprised 20 g/L aqueous solution of Na3PO4·12H2O of puris grade. The electrolyte volume was 5 L. The electrolyte temperature was maintained at 20 ± 1 °C using microcontroller regulation. The PEO process was run in the pulsed bipolar regime under the voltage regulation; the positive pulse was 470 V, negative 40 V; the frequency was 300 Hz. The duty cycle of positive pulses was 51%, negative—26%. The PEO treatment duration was 5 min.

2.2. Surface Characterization

The top view of PEO coating was studied using the JEOL JSM-6490LV scanning electron microscope at an accelerating voltage of 20 kV. The coating thickness was measured using the Defelsko Positector 6000 eddy current gauge of N-type. The surface roughness was measured with the TR-220 profilometer. The coating porosity was assessed with ImageJ software from the SEM images following the ASTM E112-10. The adhesion of the coatings was evaluated using a CSM micro scratch tester. In this test, the load on a diamond Rockwell indenter with a tip radius of 200 μm was linearly increased from 0 to 20 N. After the test, the scratch on the surface of the coating was examined under an optical microscope to determine the position at which the coating was peeled off the substrate. The critical load values were determined using the data regarding acoustic emission and penetration depth. The phase composition of the surface layer was characterized using a Rigaku Ultima IV X-ray diffractometer in Cu Kα radiation at 40 kV and 40 mA using 0.02 deg. step scan with 2 s exposure, from 20 to 80 degrees 2θ. Further, the XRD spectra were processed using Philips X’Pert Highscore Plus software with the PDF2 pattern database; a built-in SemiQuant algorithm was employed to quantify the amounts of the crystalline phases in the coating. The elemental analysis of the coatings was carried out using a Shimadzu EDX-800HS energy-dispersive X-ray fluorescence spectrometer.

2.3. Electrochemical Tests

The electrochemical tests were carried out in Ringer’s solution at room temperature using the P-5X (Elins, Moscow, Russia) electrochemical system. Open circuit potential (OCP) measurements, electrochemical impedance spectroscopy (EIS) from 100 kHz to 1 mHz (20 points/decade) with the magnitude of 10 mV around OCP, and potentiodynamic polarization (PDP) tests in the range from −0.6 V to 1.5 V with respect to the OCP at 0.25 mV/s scan rate, were performed. A silver chloride electrode filled with 3.5 M KCl was used as a reference electrode. The counter electrode was a graphite rod. The polarization resistance Rp was calculated from the slope of the polarization curve at ± 10 mV around the free corrosion potential. The EIS results were analyzed using ZView software from Scribner Associates [40].

2.4. Estimation of Kinetic Coefficients for the PEO Process

To study the kinetic aspects of the PEO process for the two different Ti alloys, we used the electrochemical relaxation method based on removing the electrochemical system from equilibrium using an input step action and further monitoring its relaxation back to equilibrium or new stationary state [41]. In this work, a chronoamperometric method was used to quantitatively estimate the growth kinetics of the PEO coating via the amplitude of the anodic current density pulses. According to the method, when evaluating the kinetic coefficients, the transient processes of the current density in the relaxation region were analyzed. In this case, the input step was the power supply voltage, the amplitude values of which were maintained at a constant level after a soft-start ramp, and the response was the dependence of the resulting amplitude values of the current density j. This approach was successfully applied elsewhere for the kinetic studies of plasma electrolytic oxidation of a Mg alloy [42]. We used the kinetic model which contains three terms: (i) for the metal dissolution, (ii) for crystallization of the oxides, (iii) for the oxygen evolution. These terms follow from the Avrami theorem and Cottrell equation. The derivation of the formulae for the first two terms is described elsewhere [41]; the third term is presented as a constant jC [43]:
j = j 0 exp ( t m τ ) + z F c D π t ( 1 exp ( t m τ ) + j c ,
where j0—initial (maximum) current density; m—the type of crystallization; z—nuclear charge; F—Faraday’s constant; c—concentration of metal in the coating; D—diffusion coefficient; τ—time constant of nucleation. The transients of the anodic current density values were approximated using Curve Fitting Toolbox in Matlab; the coefficient of determination R2 was used to characterize the goodness of the fit.

3. Results

3.1. Process Characteristics for PEO of cp-Ti and Ti-Zr-Nb Alloy in Pulsed Bipolar Regime

Figure 1 shows the evolution of the electrical characteristics of the PEO process for cp-Ti and Ti-Zr-Nb. The voltage was ramped for 50 s for both samples, then it was kept at a constant level. The initial stages of the increasing current density and its maximal value are similar for both samples. In the time range from 0 to 50 s, the samples undergo the primarily anodizing process. In the time range from 50 to 300 s, a nonlinear decrease in the current density occurs since the system reaches a new stationary state at constant root mean square (RMS) voltage, and the growth of the oxide film diminishes the current density. The sharper drop in the current density for the TZN+PEO sample indicates that this coating grows faster at the initial time stages compared to the Ti+PEO sample. The sharp decrease in the current density is followed by almost constant values after 120–150 s. In this time range, the current density for the Ti+PEO sample is approximately thrice higher than that for the TZN+PEO sample. The lower final current density for the TZN+PEO sample shows that this coating reaches higher electrical resistance, and this can result in higher sample roughness because fewer microdischarges appear for this current, and they can be more violent than that for Ti+PEO. The effect of the current density on the quality of the resulting coating on titanium was also shown elsewhere [44]. As shown by Kim et al. [45], the larger roughness of the TZN+PEO sample can contribute to the biocompatibility of this coating.

3.2. PEO Coating Characterization

Figure 2 shows SEM images of a top view and cross-sections of the treated samples abbreviated as Ti+PEO, TZN+PEO. The main properties of the PEO coatings are presented in Table 1. In both cases, the coatings have a typical porous structure resulting from exposure to micro-discharges. Compared to TZN+PEO, Ti+PEO coating has a smaller thickness and smoother surface, much less porosity with a smaller average pore size; some pores show elongated shape. TZN+PEO coating has significant roughness and uneven porosity distribution over the surface. The cross-section images show that Ti+PEO coating shows much less porosity; the inner and outer layers in this coating appear quite compact, and the difference between them is quite negligible. TZN+PEO sample has a distinctive two-layer coating; there is a compact inner layer and a quite porous outer layer; this was also reported in [46]. Both coatings do not show significant cracks on the top view and any breaks at the alloy/coating interface. Figure 3 shows the results of the scratch test for Ti+PEO and TZN+PEO samples. This test shows that the Ti+PEO coating has slightly higher adhesion strength than the TZN+PEO coating; the results are summarized in Table 1, and they are consistent with other studies [33]. As it can be seen from Figure 3a, the Ti+PEO sample shows a decrease in the penetration depth for a range of loads larger than the critical load. This can be explained by a contribution of the adhesive wear: chipped coating particles adhere to the scratch tester tip, and the penetration depth decreases. Unlike this, the TZN+PEO sample shows an increase in the slope of the load curve and an increase in the acoustic emission when the critical load is achieved (Figure 3b). This curve shows that the abrasive type of wear dominates for this coating [47].
Elemental analysis shows that in Ti+PEO coating, in addition to Ti and O, electrolyte elements P and Na are also present (Table 2). TZN+PEO coating also contains Zr and Nb substrate elements; for this coating, the increase in P content is noticeable, probably due to higher porosity; this can have a positive effect on the biocompatibility of the coating. Relatively large amounts of oxygen in the samples suggest that the coating contains oxides of the substrate elements.
Figure 4 shows the X-ray diffractograms of the studied samples, and Table 3 presents the results of the quantitative analysis. According to the XRD analysis, the Ti+PEO sample is the α-Ti alloy, and the TZN+PEO sample exhibits the high-temperature β-Ti structure. The PEO coating on the Ti+PEO sample contains titanium oxide in two modifications—anatase and rutile; the peaks of the α-Ti substrate are also visible in this diffractogram. In TZN+PEO coating, crystalline phases of zirconium oxide ZrO2 and niobium oxides Nb2O5, NbO2 appear in addition to rutile and anatase. Crystalline phases containing electrolyte elements P and Na were not detected in the coatings by XRD, but the compounds were detected in a small amount by the elemental analysis with the EDX. This phenomenon suggests that P-containing compounds exist as the amorphous phases in the coatings. The X-ray diffractograms do not show the notable amorphous halo between 20° and 40° 2θ that is typical for phosphate-containing PEO coatings [37] due to the insignificant amount of the substances containing P and Na elements in the coatings.

3.3. Electrochemical Behavior of the Uncoated and PEO Coated Samples

Figure 5 shows the polarization curves of the samples before and after PEO treatment. From the analysis of the PDP curves, it can be seen that reliable Tafel regions are not observed; therefore, it is not possible to evaluate the corrosion current values correctly. However, from the point of view of the qualitative analysis, it can be assumed that PDP curves located at the left-hand-side exhibit lower corrosion currents; this is also reported for other PEO coatings elsewhere [48]. Consequently, the untreated samples have a higher corrosion rate than the PEO coated samples. Moreover, the TZN+PEO sample will have the lowest corrosion rate since its PDP curve has the most left position. Other corrosion process parameters that can be calculated from the PDP curves—free corrosion potential (Ecorr), and polarization resistance (Rp)—are presented in Table 4. As follows from the PDP analysis, PEO treatment results in the passivation of the Ti+PEO and TZN+PEO samples, because they have a higher free corrosion potential Ecorr and higher polarization resistance Rp. Electrochemical polarization of the coatings into higher anodic potentials of up to 1500 mV (Figure 5) shows quite passive behavior without notable regions with the rapid increasing of the current, suggesting either pitting corrosion or film breakdown. Assuming the application of the coatings in a human body where such potentials do not naturally appear, we can assume that surface passivation occurs due to the PEO coating.
Figure 6 shows the results of the electrochemical impedance spectroscopy as Nyquist and Bode plots. The impedance spectra demonstrate significant differences among the samples. The uncoated samples have a thin natural oxide layer. The impedance of such a system has one time constant, as evident from the Nyquist plots showing parts of a semi-circle for both Ti and TZN samples. Therefore, the spectrum can be fitted by the equivalent electrical circuit presented in Figure 7a [40]. Such a system assumes that the reaction is one-step without diffusion restrictions. The impedance spectra of Ti+PEO and TZN+PEO samples have a linear increase in impedance at the lowest frequencies on the Nyquist plot. This behavior can be explained by the presence of diffusion processes in the PEO coating. Therefore, to describe the impedance of the processed samples, an open Warburg element, which helps to describe the diffusion processes in the coating pores, was introduced into the equivalent electrical circuit, which is known as the Randles circuit (Figure 7b) [40]. The fit results for the parameters of the equivalent circuits are summarized in Table 5.
The electrolyte resistance was calculated as R1 = 23.3 ± 12.3 Ω cm2 for all the samples. In the equivalent electric circuit, resistance R2 is the passive film resistance, and the constant phase element CPE1 is the first approximation of the passive film capacitance. Between the substrates, the TZN sample has the best corrosion resistance, since its resistance R2 is higher than that of the Ti sample. The thickness of the natural oxide layer is inversely proportional to the CPE-Q parameter, which can be treated as the capacitance estimate if the value of CPE-n is close to 1. Lower values of the CPE-Q for the TZN sample indicate the thicker natural oxide layer. The CPE-n value, which can vary from 0 to 1, is higher for the TZN sample; this indicates better homogeneity of the natural oxide layer and better corrosion resistance, and is consistent with the PDP results. The Randles circuit has the Warburg impedance in series with R2 (Figure 7b). The coating resistance can be estimated as a sum of the passive film and diffusion resistances (R2+ Wo-R).
From the Bode diagrams shown in Figure 6, it follows that PEO treatment leads to an increase in the corrosion resistance of Ti+PEO and TZN+PEO samples because, at the lowest frequencies, the values of the impedance modulus for the coated samples are higher than that for the uncoated. At the same time, the TZN+PEO sample demonstrates the best corrosion resistance and, at the lowest frequency, its impedance |Zf→0|is more than an order of magnitude higher (3.86 × 10⁶ Ω cm2) compared to (2.66 × 10⁵ Ω cm2) for Ti+PEO, due to the larger diffusion difficulties in the TZN+PEO coating.

3.4. Quantitative Evaluation of the PEO Kinetics for the Ti and Ti-Zr-Nb Alloys

To simplify the calculations, we assumed m = 1 for Formula (1) so that the crystallization is instantaneous. The Ti concentration c was calculated for the titanium oxide TiO2 rutile and anatase using the proportions given in Table 3:
c Ti = X 1 ( 0.742 ρ anatase + 0.258 ρ rutile ) M TiO 2
The TZN c concentration was calculated for the oxides of the alloy elements using the proportions given in Table 3:
c TZN = ( 0.747 X 1 + 0.253 X 2 )   ( 0.151 ρ anatase + 0.293 ρ rutile + 0.040 ρ ZrO 2 + 0.253 ρ Nb 2 O 5 + 0.263 ρ Nb 2 O 5 ) 0.444 M TiO 2 + 0.040 M ZrO 2 + 0.253 M Nb 2 O 5 + 0.263 M NbO 2
where X1 is the atom portion of Ti, Zr, Nb in oxide TiO2, ZrO2, NbO2; X2 is the atom portion of Nb in oxide Nb2O5, and M and ρ are the molar volumes and density of oxides TiO2, ZrO2, NbO2, and Nb2O5. The zTi—the nuclear charge of Ti in oxide TiO2—is equal to 4; the zTZN—the effective nuclear charge of Ti, Zr, Nb in oxides TiO2, ZrO2, NbO2, Nb2O5—was estimated as zTZN = 0.747 × 4 + 0.253 × 5 = 4.253.
We approximated the current density curve at the stage of spark and microarc discharges because the most intense surface transformation occurs at this stage. Figure 8 shows the experimental and modeled current density curves. The parameters of the kinetic model (1) are presented in Table 6. The value of R2 close to 1 shows that a good fit was achieved.

4. Discussion

During the PEO treatment of cp-Ti and Ti-Zr-Nb alloy, the following reactions occur in the system [49,50]. For the PEO of cp-Ti, on the anode, metal ions are released into the electrolyte due to anodic dissolution:
Ti→Ti2+ + 2e (−1.63 V)
This reaction is described by the first term in Equation (1) for the kinetic model of the PEO cp-Ti. The anodic oxidation reaction of Ti to titanium dioxide can be written as:
Ti + 2H2O→TiO2 + 2H+ + 4e (−0.86 V)
This reaction of the oxide formation during PEO of the cp-Ti alloy is described by the second term of Equation (1).
For the Ti-Zr-Nb alloy, in addition to that mentioned above, reactions for the alloying elements Zr and Nb also occur. The following reactions of the anodic dissolution also contribute to the first term of Equation (1) for Ti-Zr-Nb alloy:
Zr→Zr4+ + 4e (−1.55 V)
Nb→Nb3+ + 3e (−1.1 V)
The reactions of formation of the Zr and Nb oxides also influence the second term of Equation (1) for Ti-Zr-Nb alloy:
Zr + 2H2O→ZrO2 + 4H+ + 4e (−1.45 V)
2Nb + 5H2O→Nb2O5 + 10H+ + 10e (−0.65 V)
As a competing reaction on the anode, water is decomposed according to the following reaction:
2H2O→2O2− + 4H+ (1.229 V)
The release of oxygen at the anode is described by the third term of Equation (1).
The oxides of Ti, Zr and Nb were identified in TZN+PEO coating. However, the main part of the coating consists of Ti and Nb oxides, while ZrO2 content is less than 5%. This is consistent with the results presented elsewhere [51], and it can be explained as follows. In this work, the voltage of positive pulses of the PEO treatment was below 500 V, which corresponds to the effective treatment of Ti and Nb [52,53]. At higher voltages, coatings on Ti and Nb can crack due to the action of powerful discharges. Unlike these elements, Zr is effectively oxidized at voltages above 600 V in a similar phosphate electrolyte [54]. This is consistent with the values of the melting temperatures of the oxides (Table 7). Since the zirconia has a much higher melting temperature compared to that of titania and niobia, the microdischarges at the voltages below 500 V are not powerful enough to contribute to the formation of ZrO2. Therefore, after the PEO treatment of the Ti-Zr-Nb alloy, the content of ZrO2 in the coating is insignificant, which is reflected in the XRD results.
From the calculated parameters of the kinetic model, it follows that the diffusion coefficient D is higher for the PEO process of the Ti-Zr-Nb alloy. This indicates higher mobility of the products of the electrochemical reactions in the microdischarges during the PEO process of the Ti-Zr-Nb alloy. This may be due to the difference in the melting temperatures of the oxides [50] (Table 7) since the temperature gradient enhances the diffusion processes.
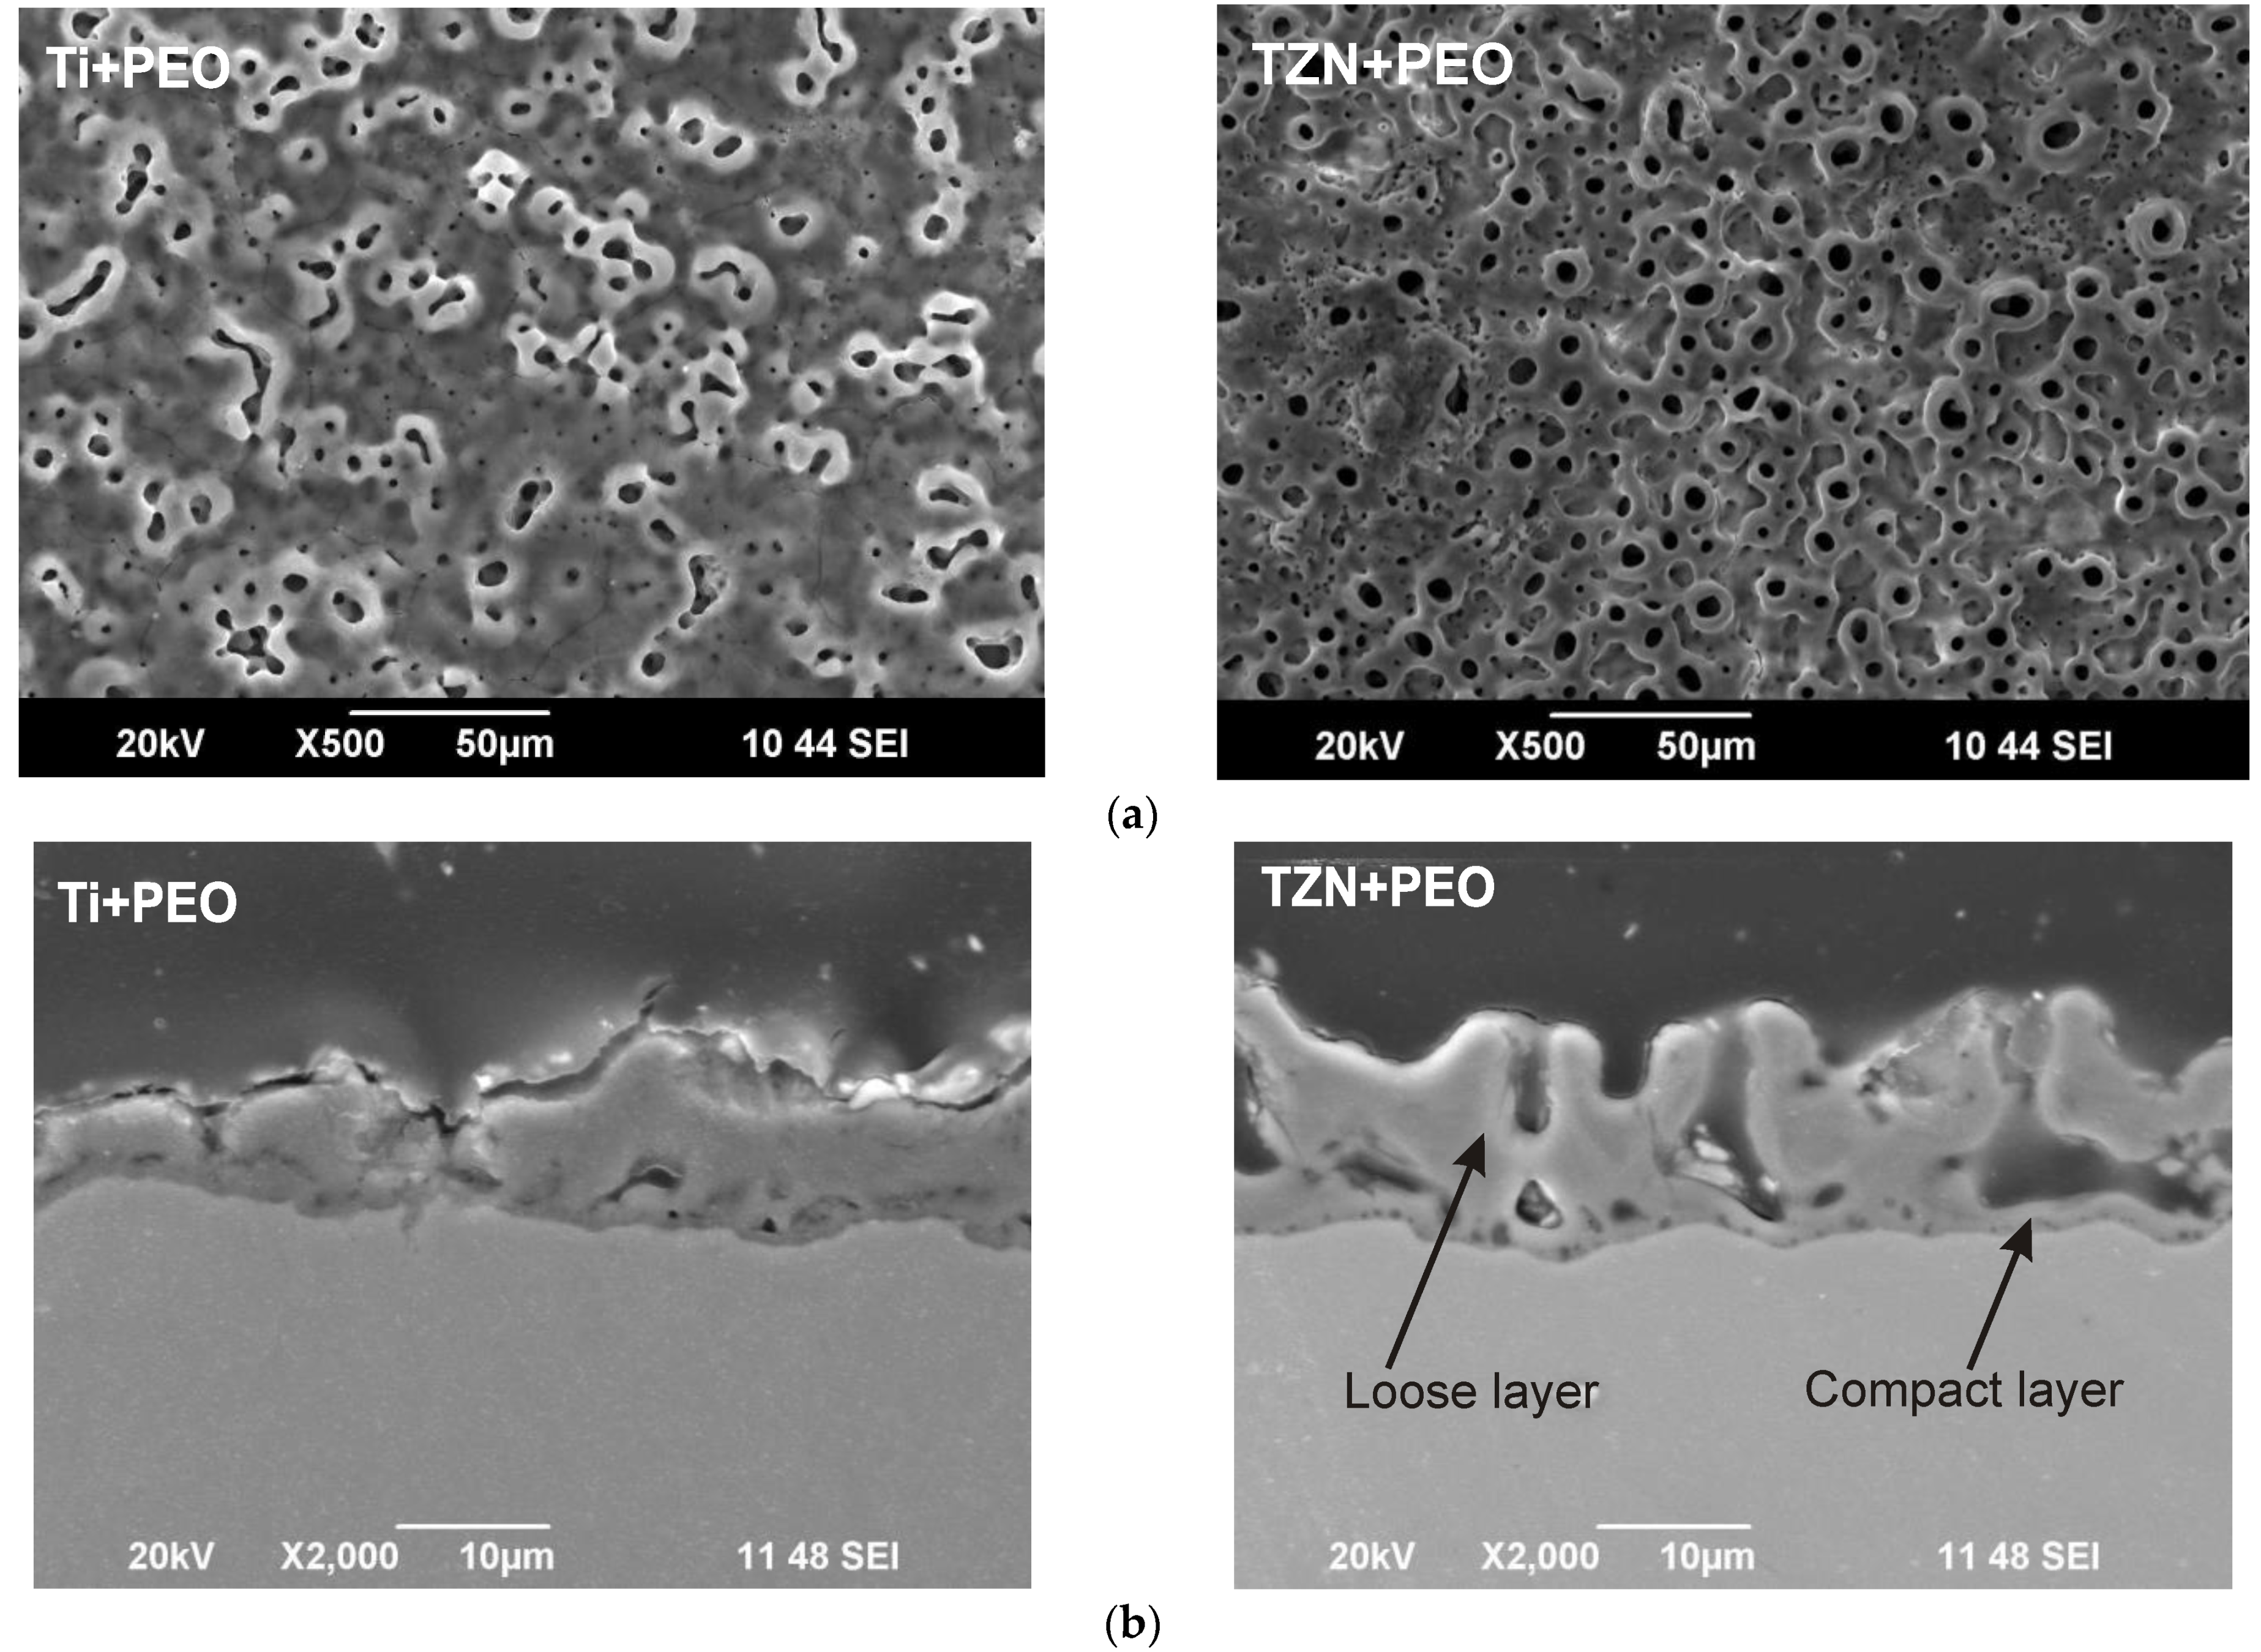
As a result, a thicker coating with higher porosity and roughness is formed on the Ti-Zr-Nb alloy compared to the coating on the cp-Ti alloy. The TZN+PEO coating is formed faster, since the time constant of the crystallization process τ for the TZN+PEO sample is almost twice as small as that of the Ti+PEO sample. The formation of the oxides leads to an increase in the electrical resistance of the coating; as a result, the current density decreases—this is reflected in the lower value of jc of the third term in Equation (1) for the TZN alloy. An increase in the porosity and roughness of the TZN+PEO coating occurs because of processing at a lower current density compared to the Ti+PEO sample. Therefore, if the alloy is exposed to lower energy pulses, the formation of the coating with higher porosity and roughness is observed.
The morphology of the PEO coating of the TZN+PEO sample significantly influenced the corrosion behavior, which was shown in electrochemical tests. Based on the results of PDP electrochemical tests, it was found that PEO treatment significantly reduces the corrosion current of the Ti+PEO and TZN+PEO samples. The results of the electrochemical impedance spectroscopy show a significant increase in the corrosion resistance for the TZN+PEO sample.
Finally, to obtain the PEO coatings in the pulsed regime on a novel Ti-18Zr-15Nb superelastic alloy, further research based on the uncovered regularities is required to find the most efficient electrolyte composition and electrical parameters for optimal PEO treatment of this alloy for implant applications.

5. Conclusions

We have compared two PEO coatings produced by plasma electrolytic oxidation (PEO) on commercially pure titanium and a novel superelastic alloy Ti-18Zr-15Nb (at. %) for implant applications. The PEO coatings were produced on both alloys in the identical pulsed bipolar regime.
  • Compared to the PEO coating on cp-Ti, which consists of rutile and anatase, the coating on Ti-Zr-Nb alloy also contains zirconium and niobium oxides. Both coatings include P- and Na-containing compounds incorporated from the electrolyte as amorphous phases. The amount of P in TZN+PEO coating is more than twice as high as that in Ti+PEO; this is a favorable factor that should improve the biocompatibility of prospective implants manufactured from Ti-18Zr-15Nb alloy with the PEO coating.
  • The coating on the Ti-18Zr-15Nb alloy has a higher thickness, roughness, and porosity compared to the coating on cp-Ti. The estimation of the kinetic coefficients of the PEO process of two alloys shows that the higher value of the diffusion coefficient and lower value of the time constant contribute to the porous coating morphology with higher roughness and thickness.
  • According to cross-sections, TZN+PEO coating appears distinctively two-layered and contains the inner compact layer and the outer porous layer, in contrast to Ti+PEO coating that is more compact and has a negligible difference between the layers.
  • According to the electrochemical studies, the PEO coatings on Ti-18Zr-15Nb alloy have higher corrosion resistance and better protective properties. This decreases the ion release from the metal implant and, in combination with higher porosity, can contribute to its biocompatibility.

Author Contributions

Conceptualization, E.P. and S.P.; investigation, R.F., V.M., O.M., V.S. and A.R.; writing—original draft preparation, R.F. and O.M.; writing—review and editing, E.P. and Y.Z.; supervision, E.P. and S.P.; project administration, V.S. and E.P. All authors have read and agreed to the published version of the manuscript.

Funding

The authors are grateful for the financial support received through the Russian Science Foundation through multi-disciplinary project No. 20-69-47029 jointly implemented with NUST “MISiS”.

Institutional Review Board Statement

Not applicable.

Informed Consent Statement

Not applicable.

Data Availability Statement

The data presented in this study are available on request from the corresponding author.

Acknowledgments

The characterization of the PEO coatings was performed at “Nanotech” Collective Usage Center of Ufa State Aviation Technical University (Russia), which is acknowledged with thanks.

Conflicts of Interest

The authors declare no conflict of interest. The funders had no role in the design of the study; in the collection, analyses, or interpretation of data; in the writing of the manuscript, or in the decision to publish the results.

References

  1. Geetha, R.M.; Singh, A.K.; Asokamani, R.; Gogia, A.K. Ti based biomaterials, the ultimate choice for orthopaedic implants–A review. Prog. Mater. Sci. 2009, 54, 397–425. [Google Scholar] [CrossRef]
  2. Khorasani, A.M.; Goldberg, M.; Doeven, E.H.; Littlefair, G. Titanium in Biomedical Applications—Properties and Fabrication: A Review. J. Biomater. Tissue Eng. 2015, 5, 593–619. [Google Scholar] [CrossRef]
  3. Betekhtin, V.I.; Kolobov, Y.R.; Golosova, O.A.; Dvorak, J.; Sklenicka, V.; Kardashev, B.K.; Kadomtsev, A.G.; Narykova, M.V.; Ivanov, M.B. Elastic modulus, microplastic properties and durability of titanium alloys for biomedical applications. Adv. Mater. Sci. 2016, 45, 42–51. [Google Scholar]
  4. Froes, F.S.; Qian, M. Titanium background, alloying behavior and advanced fabrication techniques—An overview. In Titaniu in Medical and Dental Applications; Elsevier BV: Amsterdam, The Netherlands, 2018; pp. 23–37. [Google Scholar]
  5. Keegan, G.M.; Learmonth, I.D.; Case, C.P. Orthopaedic metals and their potential toxicity in the arthroplasty patient. J. Bone Jt. Surgery. Br. Vol. 2007, 89, 567–573. [Google Scholar] [CrossRef]
  6. McCracken, M. Dental Implant Materials: Commercially Pure Titanium and Titanium Alloys. J. Prosthodont. 1999, 8, 40–43. [Google Scholar] [CrossRef] [PubMed]
  7. Sheremetyev, V.A.; Prokoshkin, S.D.; Brailovski, V.; Dubinskiy, S.M.; Korotitskiy, A.V.; Filonov, M.R.; Petrzhik, M.I. Investigation of the structure stability and superelastic behavior of thermomechanically treated Ti-Nb-Zr and Ti-Nb-Ta shape-memory alloys. Phys. Met. Metallogr. 2015, 116, 413–422. [Google Scholar] [CrossRef]
  8. Liang, S.; Feng, X.; Yin, L.; Liu, X.Y.; Ma, M.; Liu, R. Development of a new β Ti alloy with low modulus and favorable plasticity for implant material. Mater. Sci. Eng. C 2016, 61, 338–343. [Google Scholar] [CrossRef] [PubMed]
  9. Elias, L.; Schneider, S.; Silva, H.; Malvisi, F. Microstructural and mechanical characterization of biomedical Ti–Nb–Zr(–Ta) alloys. Mater. Sci. Eng. A 2006, 432, 108–112. [Google Scholar] [CrossRef]
  10. Cordeiro, J.M.; Beline, T.; Ribeiro, A.L.R.; Rangel, E.C.; da Cruz, N.C.; Landers, R.; Faverani, L.P.; Vaz, L.G.; Fais, L.M.; Vicente, F.B.; et al. Development of binary and ternary titanium alloys for dental implants. Dent. Mater. 2017, 33, 1244–1257. [Google Scholar] [CrossRef] [PubMed] [Green Version]
  11. Dikici, B.; Esen, Z.; Duygulu, O.; Gungor, S. Corrosion of Metallic Biomaterials. In Nanomaterials and Their Biomedical Applications; Springer Science and Business Media LLC: New York, NY, USA, 2015; pp. 275–303. [Google Scholar]
  12. Guo, Y.; Chen, D.; Lu, W.; Jia, Y.; Wang, L.; Zhang, X. Corrosion resistance and in vitro response of a novel Ti35Nb2Ta3Zr alloy with a low Young’s modulus. Biomed. Mater. 2013, 8, 055004. [Google Scholar] [CrossRef]
  13. Stenlund, P.; Omar, O.; Brohede, U.; Norgren, S.; Norlindh, B.; Johansson, A.; Lausmaa, J.; Thomsen, P.; Palmquist, A. Bone response to a novel Ti–Ta–Nb–Zr alloy. Acta Biomater. 2015, 20, 165–175. [Google Scholar] [CrossRef]
  14. Kuroda, D.; Niinomi, M.; Morinaga, M.; Kato, Y.; Yashiro, T. Design and mechanical properties of new β type titanium alloys for implant materials. Mater. Sci. Eng. A 1998, 243, 244–249. [Google Scholar] [CrossRef]
  15. Niinomi, M. Fatigue performance and cyto-toxicity of low rigidity titanium alloy, Ti–29Nb–13Ta–4.6Zr. Biomaterials 2003, 24, 2673–2683. [Google Scholar] [CrossRef]
  16. Guo, Y.; Chen, D.; Cheng, M.; Lu, W.; Wang, L.; Zhang, X. The bone tissue compatibility of a new Ti35Nb2Ta3Zr alloy with a low Young’s modulus. Int. J. Mol. Med. 2013, 31, 689–697. [Google Scholar] [CrossRef] [Green Version]
  17. Sheremetyev, V.; Kudryashova, A.; Dubinskiy, S.; Galkin, S.; Prokoshkin, S.; Brailovski, V. Structure and functional properties of metastable beta Ti-18Zr-14Nb (at.%) alloy for biomedical applications subjected to radial shear rolling and thermomechanical treatment. J. Alloys Compd. 2018, 737, 678–683. [Google Scholar] [CrossRef]
  18. Kim, H.Y.; Fu, J.; Tobe, H.; Kim, J.I.; Miyazaki, S. Crystal Structure, Transformation Strain, and Superelastic Property of Ti–Nb–Zr and Ti–Nb–Ta Alloys. Shape Mem. Superelast. 2015, 1, 107–116. [Google Scholar] [CrossRef] [Green Version]
  19. Konopatsky, A.; Dubinskiy, S.; Zhukova, Y.; Sheremetyev, V.; Brailovski, V.; Prokoshkin, S.; Filonov, M. Ternary Ti-Zr-Nb and quaternary Ti-Zr-Nb-Ta shape memory alloys for biomedical applications: Structural features and cyclic mechanical properties. Mater. Sci. Eng. A 2017, 702, 301–311. [Google Scholar] [CrossRef]
  20. Tanase, C.; Golozar, M.; Best, S.; Brooks, R. Cell response to plasma electrolytic oxidation surface-modified low-modulus β-type titanium alloys. Colloids Surf. B Biointerfaces 2019, 176, 176–184. [Google Scholar] [CrossRef]
  21. Dorozhkin, S.V. Calcium orthophosphate deposits: Preparation, properties and biomedical applications. Mater. Sci. Eng. C 2015, 55, 272–326. [Google Scholar] [CrossRef]
  22. Asri, R.; Harun, W.; Samykano, M.; Lah, N.; Ghani, S.; Tarlochan, F.; Raza, M. Corrosion and surface modification on biocompatible metals: A review. Mater. Sci. Eng. C 2017, 77, 1261–1274. [Google Scholar] [CrossRef] [Green Version]
  23. Liu, X.; Chu, P.K.; Ding, C. Surface modification of titanium, titanium alloys, and related materials for biomedical applications. Mater. Sci. Eng. R Rep. 2004, 47, 49–121. [Google Scholar] [CrossRef] [Green Version]
  24. Singh, S.; Singh, G.; Bala, N. Electrophoretic deposition of bioactive glass composite coating on biomaterials and electrochemical behavior study: A review. Mater. Today Proc. 2018, 5, 20160–20169. [Google Scholar] [CrossRef]
  25. Dikici, B.; Niinomi, M.; Topuz, M.; Say, Y.; Aksakal, B.; Yilmazer, H.; Nakai, M. Synthesis and Characterization of Hydroxyapatite/TiO2 Coatings on the β-Type Titanium Alloys with Different Sintering Parameters using Sol-Gel Method. Prot. Met. Phys. Chem. Surf. 2018, 54, 457–462. [Google Scholar] [CrossRef]
  26. Pillai, R.S.; Frasnelli, M.; Sglavo, V.M. HA/β-TCP plasma sprayed coatings on Ti substrate for biomedical applications. Ceram. Int. 2018, 44, 1328–1333. [Google Scholar] [CrossRef]
  27. Yerokhin, A.; Nie, X.; Leyland, A.; Matthews, A. Characterisation of oxide films produced by plasma electrolytic oxidation of a Ti–6Al–4V alloy. Surf. Coat. Technol. 2000, 130, 195–206. [Google Scholar] [CrossRef]
  28. Santos-Coquillat, A.; Mohedano, M.; Martinez-Campos, E.; Arrabal, R.; Pardo, A.; Matykina, E. Bioactive multi-elemental PEO-coatings on titanium for dental implant applications. Mater. Sci. Eng. C 2019, 97, 738–752. [Google Scholar] [CrossRef]
  29. Say, Y.; Aksakal, B.; Dikici, B. Effect of hydroxyapatite/SiO2 hybride coatings on surface morphology and corrosion resistance of REX-734 alloy. Ceram. Int. 2016, 42, 10151–10158. [Google Scholar] [CrossRef]
  30. Valkov, S.; Parshorov, S.; Andreeva, A.; Bezdushnyi, R.; Nikolova, M.; Dechev, D.; Ivanov, N.; Petrov, P. Influence of Electron Beam Treatment of Co–Cr Alloy on the Growing Mechanism, Surface Topography, and Mechanical Properties of Deposited TiN/TiO2 Coatings. Coatings 2019, 9, 513. [Google Scholar] [CrossRef] [Green Version]
  31. Sowa, M.; Piotrowska, M.; Widziołek, M.; Dercz, G.; Tylko, G.; Gorewoda, T.; Osyczka, A.M.; Simka, W. Bioactivity of coatings formed on Ti–13Nb–13Zr alloy using plasma electrolytic oxidation. Mater. Sci. Eng. C 2015, 49, 159–173. [Google Scholar] [CrossRef]
  32. Yerokhin, A.; Nie, X.; Leyland, A.; Matthews, A.; Dowey, S. Plasma electrolysis for surface engineering. Surf. Coat. Technol. 1999, 122, 73–93. [Google Scholar] [CrossRef]
  33. Parfenov, E.; Parfenova, L.; Mukaeva, V.; Farrakhov, R.; Stotskiy, A.; Raab, A.; Danilko, K.; Nagumothu, R.; Valiev, R. Biofunctionalization of PEO coatings on titanium implants with inorganic and organic substances. Surf. Coat. Technol. 2020, 404, 126486. [Google Scholar] [CrossRef]
  34. Mashtalyar, D.V.; Nadaraia, K.V.; Gnedenkov, A.S.; Imshinetskiy, I.M.; Piatkova, M.A.; Pleshkova, A.I.; Belov, E.A.; Filonina, V.S.; Suchkov, S.N.; Sinebryukhov, S.L.; et al. Bioactive Coatings Formed on Titanium by Plasma Electrolytic Oxidation: Composition and Properties. Materials 2020, 13, 4121. [Google Scholar] [CrossRef]
  35. Cordeiro, J.M.; Nagay, B.E.; Ribeiro, A.L.R.; da Cruz, N.C.; Rangel, E.C.; Fais, L.M.; Vaz, L.G.; Barão, V.A. Functionalization of an experimental Ti-Nb-Zr-Ta alloy with a biomimetic coating produced by plasma electrolytic oxidation. J. Alloys Compd. 2019, 770, 1038–1048. [Google Scholar] [CrossRef]
  36. Songur, F.; Dikici, B.; Niinomi, M.; Arslan, E. The plasma electrolytic oxidation (PEO) coatings to enhance in-vitro corrosion resistance of Ti–29Nb–13Ta–4.6Zr alloys: The combined effect of duty cycle and the deposition frequency. Surf. Coat. Technol. 2019, 374, 345–354. [Google Scholar] [CrossRef]
  37. Yerokhin, A.; Parfenov, E.; Matthews, A. In situ impedance spectroscopy of the plasma electrolytic oxidation process for deposition of Ca- and P-containing coatings on Ti. Surf. Coat. Technol. 2016, 301, 54–62. [Google Scholar] [CrossRef]
  38. Parfenov, E.V.; Parfenova, L.V.; Dyakonov, G.S.; Danilko, K.V.; Mukaeva, V.R.; Farrakhov, R.G.; Lukina, E.S.; Valiev, R.Z. Surface functionalization via PEO coating and RGD peptide for nanostructured titanium implants and their in vitro assessment. Surf. Coat. Technol. 2019, 357, 669–683. [Google Scholar] [CrossRef]
  39. Zhukova, Y.; Korobkova, A.; Dubinskiy, S.; Pustov, Y.; Konopatsky, A.; Podgorny, D.; Filonov, M.; Prokoshkin, S.; Brailovski, V. The Electrochemical and Mechanical Behavior of Bulk and Porous Superelastic Ti‒Zr-Based Alloys for Biomedical Applications. Materials 2019, 12, 2395. [Google Scholar] [CrossRef] [PubMed] [Green Version]
  40. Barsukov, E.; Macdonald, J.R. Impedance Spectroscopy: Theory, Experiment, and Applications, 2nd ed.; John Willey & Sons, Inc.: Hoboken, NJ, USA, 2005. [Google Scholar]
  41. Snizhko, L.; Yerokhin, A.; Gurevina, N.; Misnyankin, D.; Ciba, A.; Matthews, A. Voltastatic studies of magnesium anodising in alkaline solutions. Surf. Coat. Technol. 2010, 205, 1527–1531. [Google Scholar] [CrossRef]
  42. Lazarev, D.M.; Farrakhov, R.G.; Mukaeva, V.R.; Kulyasova, O.B.; Parfenov, E.V.; Yerokhin, A.L. Growth Kinetics and Corrosion Protection Properties of Plasma Electrolytic Oxidation Coatings on Biodegradable Mg−2% Sr Alloy. Surf. Eng. Appl. Electrochem. 2020, 56, 83–92. [Google Scholar] [CrossRef]
  43. Mukaeva, V.R.; Melnichuk, O.V.; A Vasilev, R.; Lutfrakhmanov, I.M.; Parfenov, E.V. Study into initial stages of plasma electrolytic oxidation of magnesium alloy. J. Phys. Conf. Ser. 2020, 1713. [Google Scholar] [CrossRef]
  44. Shin, K.R.; Kim, Y.S.; Yang, H.W.; Ko, Y.G.; Shin, D.H. In vitro biological response to the oxide layer in pure titanium formed at different current densities by plasma electrolytic oxidation. Appl. Surf. Sci. 2014, 314, 221–227. [Google Scholar] [CrossRef]
  45. Kim, M.-J.; Kim, C.-W.; Lim, Y.-J.; Heo, S.-J. Microrough titanium surface affects biologic response in MG63 osteoblast-like cells. J. Biomed. Mater. Res. Part A 2006, 79, 1023–1032. [Google Scholar] [CrossRef]
  46. Chen, L.; Wei, K.; Qu, Y.; Li, T.; Chang, B.; Liao, B.; Xue, W. Characterization of plasma electrolytic oxidation film on biomedical high niobium-containing β-titanium alloy. Surf. Coat. Technol. 2018, 352, 295–301. [Google Scholar] [CrossRef]
  47. Ashby, M.F.; Jones, D.R. Friction and Wear. In Engineering Materials 1; Elsevier BV: Amsterdam, The Netherlands, 2012; pp. 417–430. [Google Scholar]
  48. Gao, Y.; Yerokhin, A.; Parfenov, E.; Matthews, A. Application of Voltage Pulse Transient Analysis during Plasma Electrolytic Oxidation for Assessment of Characteristics and Corrosion Behaviour of Ca- and P-containing Coatings on Magnesium. Electrochim. Acta 2014, 149, 218–230. [Google Scholar] [CrossRef]
  49. Necula, B.; Apachitei, I.; Fratila-Apachitei, L.; Van Langelaan, E.; Duszczyk, J. Titanium bone implants with superimposed micro/nano-scale porosity and antibacterial capability. Appl. Surf. Sci. 2013, 273, 310–314. [Google Scholar] [CrossRef]
  50. Dean, J.A.; Lange, N.A. Lange’s Handbook of Chemistry; McGraw-Hill: New York, NY, USA, 1999; p. 1561. [Google Scholar]
  51. Sowa, M.; Parafiniuk, M.; Mouzêlo, C.M.; Kazek-Kęsik, A.; Zhidkov, I.; Kukharenko, A.I.; Cholakh, S.O.; Kurmaev, E.Z.; Simka, W. DC plasma electrolytic oxidation treatment of gum metal for dental implants. Electrochim. Acta 2019, 302, 10–20. [Google Scholar] [CrossRef]
  52. Parfenova, L.V.; Lukina, E.S.; Galimshina, Z.R.; Gil’Fanova, G.U.; Mukaeva, V.R.; Farrakhov, R.G.; Danilko, K.V.; Dyakonov, G.S.; Parfenov, E.V. Biocompatible Organic Coatings Based on Bisphosphonic Acid RGD-Derivatives for PEO-Modified Titanium Implants. Molecules 2020, 25, 229. [Google Scholar] [CrossRef] [Green Version]
  53. Sowa, M.; Simka, W. Electrochemical behavior of plasma electrolytically oxidized niobium in simulated physiological environment. Surf. Coat. Technol. 2018, 344, 121–131. [Google Scholar] [CrossRef]
  54. Arun, S.; Hariprasad, S.; Saikiran, A.; Ravisankar, B.; Parfenov, E.V.; Mukaeva, V.R.; Rameshbabu, N. The effect of graphite particle size on the corrosion and wear behaviour of the PEO-EPD coating fabricated on commercially pure zirconium. Surf. Coat. Technol. 2019, 363, 301–313. [Google Scholar] [CrossRef]
Figure 1. Electrical characteristics for the plasma electrolytic oxidation (PEO) process of Ti and Ti-18Zr-15Nb (TZN) samples: (a) root mean square (RMS) voltage; (b) RMS current density.
Coatings 11 00401 g001
Figure 2. SEM images of the PEO coating for Ti+PEO and TZN+PEO samples: (a) Top view; (b) cross-section.
Coatings 11 00401 g002
Figure 3. Scratch test results of Ti+PEO (a) and TZN+PEO (b) coatings; vertical lines represent the critical load values.
Coatings 11 00401 g003
Figure 4. X-ray diffractograms for the uncoated and PEO coated Ti and TZN samples (PDF reference pattern numbers: α-titanium (00-044-1294), β-titanium (98-007-1749), anatase (01-083-2243), rutile (01-072-1148), m-ZrO2 (98-009-0936), m-Nb2O5 (98-005-6144), t-NbO2 (98-000-2300)).
Coatings 11 00401 g004
Figure 5. Polarization curves in Ringer’s solution for the uncoated and PEO coated Ti and TZN samples.
Coatings 11 00401 g005
Figure 6. Nyquist and Bode plots for the uncoated and PEO coated Ti and TZN samples.
Coatings 11 00401 g006
Figure 7. Equivalent circuits used for the electrochemical impedance spectroscopy (EIS) results fitting: (a) uncoated Ti and TZN substrates; (b) Ti+PEO and TZN+PEO coated samples.
Coatings 11 00401 g007
Figure 8. Experimental and modeled current density for PEO of the Ti (a) and Ti-Zr-Nb alloys (b).
Coatings 11 00401 g008
Table 1. Surface properties of the PEO treated samples Ti+PEO and TZN+PEO.
Sample Typeh (μm)Rz (μm)Ra (μm)Porosity (%)Average Pore Size (μm)Critical Load (N)
Ti+PEO11.9 ± 3.314.8 ± 2.72.1 ± 0.46.8 ± 0.40.82 ± 0.211.1 ± 0.9
TZN+PEO14.1 ± 2.517.3 ± 2.23.2 ± 0.417.9 ± 0.62.86 ± 0.48.3 ± 0.7
Table 2. Elemental composition (wt %) of the PEO coatings from the energy-dispersive X-ray spectroscopy (EDX) analysis.
Sample TypeTiOPNaZrNb
Ti+PEO46.6 ± 5.645.8 ± 3.95.7 ± 1.31.8 ± 0.6--
TZN+PEO16.3 ± 3.141.2 ± 7.712.6 ± 0.51.8 ± 0.922.9 ± 4.35.1 ± 0.6
Table 3. Estimation of the crystalline phase content (wt %) of the PEO coatings from the XRD analysis.
Sample TypeAnataseRutileZrO2 MonoclinicNb2O5 MonoclinicNbO2 Tetragonal
Ti+PEO74.2 ± 4.125.8 ± 3.2---
TZN+PEO15.1 ± 0.229.3 ± 0.34 ± 0.725.3 ± 0.326.3 ± 0.3
Table 4. Corrosion properties of the PEO coatings on Ti and TZN samples.
Sample TypeTiTZNTi+PEOTZN+PEO
Ecorr (V vs. Ag/AgCl)−0.281 ± 0.08−0.411 ± 0.12−0.172 ± 0.01−0.068 ± 0.07
Rp (105 Ω·cm2)3.7 ± 0.510.2 ± 7.48.2 ± 0.721.1 ± 2.0
Table 5. EIS fit results of the parameters of the equivalent circuits for the uncoated and PEO coated samples tested in Ringer’s solution.
Sample TypeR2 (103 Ω cm2)CPE1-Q (μFn−1·cm−2)CPE1-nWo-R (104 Ω cm2)Wo-T (s)Wo-P
Ti237 ± 36.20 × 10⁻⁵ ± 0.01 × 10−50.77 ± 0.00---
TZN953 ± 1094.07 × 10−5 ± 0.04 × 10−50.93 ± 0.00---
Ti+PEO4.4 ± 0.24.63 × 10−6 ± 0.15 × 10−60.66 ± 0.002.7 ± 0.10.53 ± 0.020.41 ± 0.00
TZN+PEO1.440 ± 0.186.4 × 10−8 ± 0.8 × 10−80.93 ± 0.01386 ± 1399 ± 70.52 ± 0.00
Table 6. Parameters of the kinetic model (1).
Sample Typej0 (A cm−2)D (cm2 s−1)τ (s)jC (A cm−2)R2
Ti+PEO1.67 ± 0.182.42·10−6 ± 0.08 ×·10−65.7 ± 1.80.88 ± 0.010.98
TZN+PEO2.84 ± 0.113.23·10−6 ± 0.20 × 10−62.8 ± 0.30.09 ± 0.010.98
Table 7. Melting temperature of oxides.
OxideNb2O5TiO2NbO2ZrO2
tm (°C)1512184319172710
Publisher’s Note: MDPI stays neutral with regard to jurisdictional claims in published maps and institutional affiliations.

