
Optimal Data Processing Method for the Application of Eu3+ Photoluminescence Piezospectroscopy in Thermal Barrier Coatings


1
Department of Mechanics, Tianjin University, Tianjin 300354, China
2
Tianjin Key Laboratory of Modern Engineering Mechanics, Tianjin 300354, China
*
Author to whom correspondence should be addressed.
Coatings 2021, 11(6), 678; https://doi.org/10.3390/coatings11060678
Submission received: 28 April 2021
/
Revised: 25 May 2021
/
Accepted: 2 June 2021
/
Published: 4 June 2021
(This article belongs to the Special Issue Defects, Stresses and Cracks in Thermal Barrier Coatings)
Abstract
:Thermal barrier coatings (TBCs) are widely used to protect gas turbine blades but internal stress near the interface in TBCs is one of the main causes of thermal barrier failure under thermal cycling. A non-destructive inspection technique based on Eu3+ photoluminescence piezospectroscopy has been successfully used to analyze the residual stress in TBCs, but systematic and quantitative evaluation of data processing is still needed, especially with respect to the identification of peak positions. In this work, processing methods for Eu3+ photoluminescence spectroscopy data were studied to characterize TBC internal stress. Both physical and numerical experiments were carried out where Eu3+ luminescence spectra were obtained from a sample of europium-doped yttria-stabilized zirconia (YSZ:Eu3+) under step-by-step uniaxial loading, and the simulated spectra were numerically deduced from the measured spectra. The peak shifts were then obtained by processing the spectral data in different ways (Gaussian, Lorentzian, pseudo-Voigt fitting, and the barycenter method), and comparing the results. We found that the Gaussian function, rather than the commonly used Lorentzian function, is the most appropriate method for the application of Eu3+ photoluminescence piezospectroscopy in TBCs because it provides sufficient sensitivity, stability and confidence for quantitative stress analysis.

1. Introduction
Thermal barrier coatings (TBCs) are key to the development of advanced aircraft engines and energy generators because of their excellent thermal insulation and high durability, which enable them to protect gas turbine blades [1,2,3,4,5,6]. However, under high-temperature thermal cycling, thermal expansion mismatch, ceramic sintering, and phase transformation introduce a complicated stress field into the TBC ceramic layer, especially near the interface between the top coat (TC) and bonding coat (BC). This can cause local cracking and spalling, and even the failure of the whole system [7,8,9,10,11,12]. Therefore, theoretical modeling, numerical simulation, and experimental measurement are all indispensable for analyzing the state, magnitude, distribution, and evolution of the internal stress near the TC/BC interface, both for scientific research and engineering failure analysis of TBCs.
The existing Cr3+ photoluminescence piezospectroscopy has been widely used for stress analysis of thermally grown oxides (TGO) in the TC/BC interface [11]. However, Cr3+ photoluminescence cannot analyze the internal stress of a ceramic layer so near the TC/BC interface [13,14]. In the luminescent sublayer doping technique [15,16,17,18,19,20], an 8YSZ:Eu3+ sublayer doped with traces of fluorescent Eu3+ ions can be placed above the TC/BC interface and used to measure the properties, especially residual stress, of the ceramic layer. Eu3+ photoluminescence piezospectroscopy [21] is a nondestructive and non-contact means with high spatial resolution for stress measurement in the sublayer [22,23,24], which is similar to Cr3+ photoluminescence piezospectroscopy [11,13,14,25]. In 1993, Ma and Clarke constructed the theoretical foundation of fluorescence piezospectroscopy in ceramics when they reported a quantitative relationship between the stress and the peak position of the Cr3+ photoluminescence spectrum for some monocrystalline and polycrystalline materials [26]. Zhao et al. [21] carried out calibration experiments on polycrystalline YSZ materials doped with Eu3+ to obtain the piezospectroscopic coefficient of Eu3+ fluorescence. They then used this result to measure the deposited residual stress in a YSZ:Eu3+ sublayer near the TC/BC interface. Based on the simplified photoluminescence piezospectroscopic theory, Jiang et al. [27] determined the piezospectroscopic coefficient for sprayed YSZ:Eu3+ material using a uniaxial loading system and a Raman spectrometer. They then measured the residual stress fields near the interface of TBCs under different thermal cycles in situ.
The key procedure for accurately characterizing the internal stress in the ceramic layer near the TC/BC interface is to identify fluorescence peak shifts using a suitable data processing method. Most of the previous work in this area has used a Lorentzian curve to fit the Eu3+ photoluminescence spectra, and the stresses in the ceramic sublayer are typically hundreds of MPa or even GPa in magnitude. For example, Zhao et al. [21] used a Lorentzian function to fit their Eu3+ fluorescence spectra for stress measurement, and the deposited residual stress in the TC sublayer of their samples was about −100 to 400 MPa, but the standard deviation of the fitted peak position was at least 0.25 cm−1 (which corresponds to ~100 MPa). Zhao et al. [28] also used a Lorentzian function to fit Eu3+ photoluminescence spectra and measured the residual stress inside a LAMA/8YSZ:Eu double ceramic layer as ranging from −1 to 0.8 GPa. The evolution of residual stress in the TC sublayer was studied by Jiang et al. [27] using a Lorentzian function to process the Eu3+ photoluminescence spectra. They found that the detected stress ranged from approximately 200 to 550 MPa throughout the loading history, with a standard deviation of about 86 MPa under the same loading conditions. In addition, the interfacial crack initiation and propagation induced by local stress in these ceramic layers was very complicated because of the TC/TGO/BC thermal mismatch, ceramic sintering, and TGO growth [29]. Microcracks always nucleate first at local regions near the interface, and this nucleation continuously caused slight stress relief in the TC layer [30]. Therefore, only high-resolution stress characterization could assist in explaining this dynamic evolution mechanism of TBC delamination, which has been well presented by the latest numerical model [31]. However, among all the published works, the measured residual stresses in the TC layer vary by at least tens of MPa, which makes elucidating the delamination process extremely difficult [21,28].
To increase the service life of turbine blades in extremely hot and humid environments, physical-chemical-mechanical models to describe quantitatively the residual stress near the interface and non-destructive methods to evaluate the structural safety of the TBCs are needed [32]. Both these goals require accurate (precision of around 10 MPa) in situ stress characterization [33]. However, at present, the resolution and confidence of stress characterization based on Eu3+ photoluminescence piezospectroscopy are generally on the order of hundreds of MPa [27,28].
Eu3+ photoluminescence piezospectroscopy is not the only spectromechanical technique. Others, including Ce3+ photoluminescence and [34], Cr3+ photoluminescence piezospectroscopy, [14,23,35,36], cathodoluminescence spectroscopy [37,38], and micro-Raman spectroscopy [39,40,41,42,43,44], were also broadly applied to stress–strain analyses for different materials and structures. Data processing methods (Lorentzian, Gaussian, pseudo-Voigt (Psd-Voigt) functions, and the barycenter method) were used to identify the positions and intensities of the characteristic peaks in the spectra taken from samples with external or internal stress. For example, Lu et al. [45] compared the fitting results using different functions and found that the Lorentzian method was the most applicable and contributed to improving the stress measurement precision in the TGO layer based on Cr3+ photoluminescence piezospectroscopy. However, there is still a lack of specific studies on the effectiveness and applicability of data processing methods for the high-resolution stress analysis of the TBC layer using Eu3+ photoluminescence piezospectroscopy.
In this paper, several data processing methods were compared by applying them to identifying the peak positions in Eu3+ photoluminescence spectra. The spectra were obtained through both numerical experiments and calibration tests under uniaxial loading. Subsequently, changes in the peak positions corresponding to different stress values were determined by the different methods (Lorentzian, Gaussian, Psd-Voigt fits, and the barycenter method). The piezospectroscopic coefficients were then obtained by linear fits of the correlation between the peak shift and uniaxial stress. The different fitting functions were verified and compared to determine the most reliable and sensitive way to fit Eu3+ photoluminescence spectroscopy data to evaluate stress in TBCs.
2. Materials and Methods
2.1. Sample Preparation
A plasma-sprayed free-standing 8YSZ:Eu3+ specimen was produced from 8YSZ (8 wt.% yttria stabilized zirconia) powder doped with 1 mol% Eu3+. As shown in Figure 1a, the as-synthesized 8YSZ:Eu3+ powder particles are nearly spherical, and the particle size ranges from ~10 to ~45 μm according to the statistical histogram with size distribution as shown in Figure 1b. Hence, the powders are suitable for atmospheric plasma spraying (APS). The 8YSZ:Eu3+ coating, about 3 mm thick was sprayed onto an aluminum substrate (ϕ30 × 5 mm) using the APS method. Spaying parameters for the coating are listed in Table 1 [46]. The specimen was then immersed to a 10 wt.% NaOH aqueous solution for 1 h to completely corrode the aluminum substrate. The specimen was then cleaned by ultrasonicating in deionized water for 20 min. Eventually, the specimen was cut and polished into several 2 mm × 2 mm × 5 mm samples. The SEM images of the cross-sectional microstructure of the as-prepared 8YSZ:Eu3+ coating samples present typical microstructure including extended microcracks and randomly distributed voids or pores, which are commonly found in plasma sprayed YSZ coatings (Figure 1c) [20,27,28].
2.2. Calibration Experiments
The experimental system used for the calibration tests in this work, as shown in Figure 2a, contained three main devices: a self-built micro-Raman/PL system using a 500 mm spectroscope (Shamrock 500i, Andor, Belfast, UK), a uniaxial loading device (Microtest 5000, Deben, Woodbridge, UK) with a load capacity of 5000 N, and an electrical 2D-stage (RC201ZA100 × 100, Beijing Ruicheng, Beijing, China). In the spectroscopic system, a 532-nm laser was used to induce Eu3+ photoluminescence in the YSZ:Eu3+ samples. An 1800 groove/mm grating was used and the spectral resolution was about 0.01 nm. A 20× objective lens (378-803-3, Mitutoyo, Kanagawa, Japan) was chosen to achieve a sampling spot with a diameter of ~10 μm [26]. Before the calibration test, an 8YSZ:Eu3+ sample was fixed to the loading device by a compressive preload of 50 N. Then the sample was loaded by compression stepwise to 500 N in 50 N steps. At each loading step, luminescence spectra were recorded from 20 different spots on the top surface of the sample. A typical spectrum of Eu3+ photoluminescence (PL) is shown in Figure 2b, which shows its larger FWHM (full width at half maximum), poor symmetry, and relatively low SNR (signal-to-noise ratio) compared to those of a Cr3+ fluorescence spectrum [23].
2.3. Numerical Experiments
Numerical experiments were carried out to analyze how accurately each processing method can identify the wavenumber increment in the Eu3+ luminescence peak caused by stress [47]. The procedure for the numerical experiments is shown in Figure 3 [45]. First, an actually measured spectrum (shown in Figure 2b) was fitted using a multipeak (18 peaks) Gaussian function to obtain a smooth curve (shown in Figure 4a) that had an extreme goodness-of-fit (GOF) of over 0.9995. The GOF used in this work was the substitution sum of squares of the residuals between the fitted curve and the actual spectrum data. The purpose of multipeak fitting is to obtain a curve that is as consistent as possible with the actual spectrum [48,49]; the fitting parameters of the multipeak Gaussian function had no physical significance [45]. The noise distribution of the actual spectrum relative to the multipeak fitted curve is given in Figure 4b, showing that the random distribution approximately followed a normal distribution, the center of which was −0.0012 and FWHM was 0.3826. Using interpolation, the data density of the multipeak fitted curve was increased to 20 times that of the experimental data.
Some overall shifts in wavenumber were then introduced into the density-increased curve by adding specific increments to the horizontal ordinate data to simulate the effect of stress on the spectral curve. The increments were set to a fixed step length of 0.0162 cm−1 at the beginning, which corresponded to 6.25 MPa if the wavenumber-stress coefficient were taken to be 2.59 cm−1/GPa [21]. Subsequently, the increment step was gradually increased.
Finally, the data density of each wavenumber-shifted curve was reduced to a degree consistent with the actually measured spectrum. Random errors (at the same level as the error of the actually measured spectrum) were then introduced using the normal distribution shown in Figure 4b, which yielded the spectral data of the simulation experiments, an example of which is shown in Figure 4c.
3. Model and Methods
3.1. The Theoretical Model of Eu3+ Photoluminescence Piezospectroscopy
Equation (1) gives the general relationship between the stress tensor of a single crystal material and the wavenumber increment of a certain luminescence peak [21],
where ∆ν denotes the experimentally detected wavenumber increment of the luminescence spectrum; Πij denotes components of the wavenumber–stress coefficient tensor, and σij* are the stress components; the subscripts i and j represent crystallographic directions.
Generally, the Πij matrix can be simplified by considering the symmetry of the fluorescing ion [50]. In the 8YSZ:Eu lattice, each Eu3+ ion dopant occupies a site usually occupied by Zr4+; hence, it is surrounded by O2− ions and vacancies. The symmetry of the Eu3+ site at the lattice scale is insufficient to simplify the Πij matrix. However, the 8YSZ:Eu coating prepared by APS is a typical polycrystalline material with many crystal orientations, and it satisfies the assumption of macroscopic isotropy at the scale of the overall PL measurement. In other words, there are enough grains with random orientations in the region probed by the laser in a PL measurement. The spatial orientation in the piezospectroscopic relationship can be expressed by an Euler angle transformation matrix, so the effect of off-diagonal elements Πij (i ≠ j) and σij* (i ≠ j) will vanish after integration over the whole space. Finally, the following Equation (2) can be obtained [26].
Furthermore, the relationship between uniaxial stress, σU, and luminescence peak shift, Δν, can be expressed as follows,
where ΠU is the piezospectroscopic coefficient under a uniaxial stress state.
3.2. Data Processing Methods
The Eu3+ photoluminescence spectrum, as shown in Figure 2b, is decided by the intra-configuration of the f–f transition and generated from the magnetic-dipole 5D0–7F2 transition. Most existing studies [21,27,28], use Lorentzian, Gaussian, or Psd-Voigt functions to fit the characteristic peaks or bands in experimental molecular and atomic spectra (including those obtained from Eu3+ photoluminescence). In this work, all the luminescence spectra from both actual and numerical experiments were fitted with Lorentzian, Gaussian, and Psd-Voigt functions.
The expression for the Lorentzian function is as follows:
where y0 is the relative base value of the peak; A is the area of this peak; w is its FWHM, and xc is the peak position.
The expression for the Gaussian function is as follows,
where y0, A, w, and xc have the same meaning as in Equation (4).
The expression of the Psd-Voigt function, the linear superposition of a Lorentzian and Gaussian function, is as follows:
where wL is the FWHM of the Lorentzian curve, wG is the FWHM of the Gaussian curve, xc is the peak position, and mu is the weight of the Lorentzian function.
The spectral fitting process using each function fitting method was done through the Peak Analyzer function of software OriginPro 2016 (OriginLab, Northampton, MA, USA). The fitting procedures were as follows. First, baselines were created based on the minimum value of spectral data. After that, one peak was automatically selected according to the spectral line shape. Then the spectrum was fitted based on the Levenberg-Marquardt Algorithm, and the maximum number of iterations was set at 200. Finally, when the Chi square tolerance value of 10−6 was reached, the curve fitting was accomplished.
In addition, the barycenter method [34] was applied to process both the simulated and measured spectra in the present work. An intensity-normalized fluorescence spectrum is given in Figure 5, which shows that the whole band can be divided into two regions, “Left” and “Right”, by a vertical line. When the area of region Left is equal to that of region Right, as shown in the upper right sub-figure in Figure 5, the wavenumber of the vertical line dividing the two regions is regarded as the barycentric wavenumber, which moves as the whole band shifts in response to stress. In the present work, spectral data with normalized intensity greater than 0.2 were selected to calculate the barycenter to avoid the interference of background noise, as shown in the lower right sub-figure in Figure 5.
4. Results and Discussion
The fits for a typical Eu3+ photoluminescence spectrum obtained using Lorentzian, Psd-Voigt, and Gaussian functions are shown in Figure 6a–c, respectively, and the GOF values obtained with different functions for both measured and simulated spectra are listed in Table 2. Using the Psd-Voigt function resulted in a visually better fit (shown in Figure 6) and a larger value of the GOF (listed in Table 2). Conversely, the Lorentzian fit gave the biggest apparent difference between the curves and the lowest GOF.
4.1. Results of the Numerical Experiments
All the simulated spectra were processed with Lorentzian, Psd-Voigt, Gaussian, and barycenter methods. The wavenumber increments (i.e., the shifts of the characteristic peak), under increasing stress were obtained as shown in Figure 7. Based on the processed results, the piezospectroscopic coefficients ΠU were obtained and are listed in Table 3.
Figure 7a shows the fitted peak shifts under different uniaxial loadings (equal step length and then increasing step length) obtained using the Lorentzian function. This peak shift increased linearly (R2 = 1) with increasing uniaxial stress. The slope of this linear relationship was the piezospectroscopic coefficient (ΠU) and wis 2.61 ± 8.86 × 10⁻⁴ cm−1/GPa, nearly equal to the pre-set value 2.59 cm−1/GPa with a relative error of 0.77%. The Gaussian fit yielded similar results as shown in Figure 7c. The peak shift maintained a clear linear relationship with the compressive stress. The ΠU was 2.58 ± 1.93 × 10⁻⁴ cm−1/GPa, with a relative error of only 0.39%.
The results of the Psd-Voigt fits are shown in Figure 7b. Overall, the peak shift has a linear relationship with compressive stress; however, such a relationship does not exist at small loadings (corresponding to the first few ~6.25 MPa stress steps) where the peak shifts by a seemingly random increment. This implied that the Psd-Voigt function was not sensitive enough to small stresses when fitting the Eu3+ photoluminescence spectrum. Moreover, the peak shift began to increase more steeply as the loading steps increased, but the data still fluctuated and the results were not correct. The linear correlation coefficient (R2) between peak shift and stress was only 0.7141. Meanwhile, the ΠU value was 3.65 ± 0.57 cm−1/GPa, which was quite different from the pre-set value of 2.59 cm−1/GPa, thus resulting a large error of 35.52%.
As shown in Figure 7d, the barycenter shift had a linear relationship (R2 = 1) with the uniaxial stress and the ΠU was 2.66 ± 6.76 × 10⁻⁴ cm−1/GPa, a deviation of 2.62% from the pre-set value.
4.2. Results of the Calibration Experiments
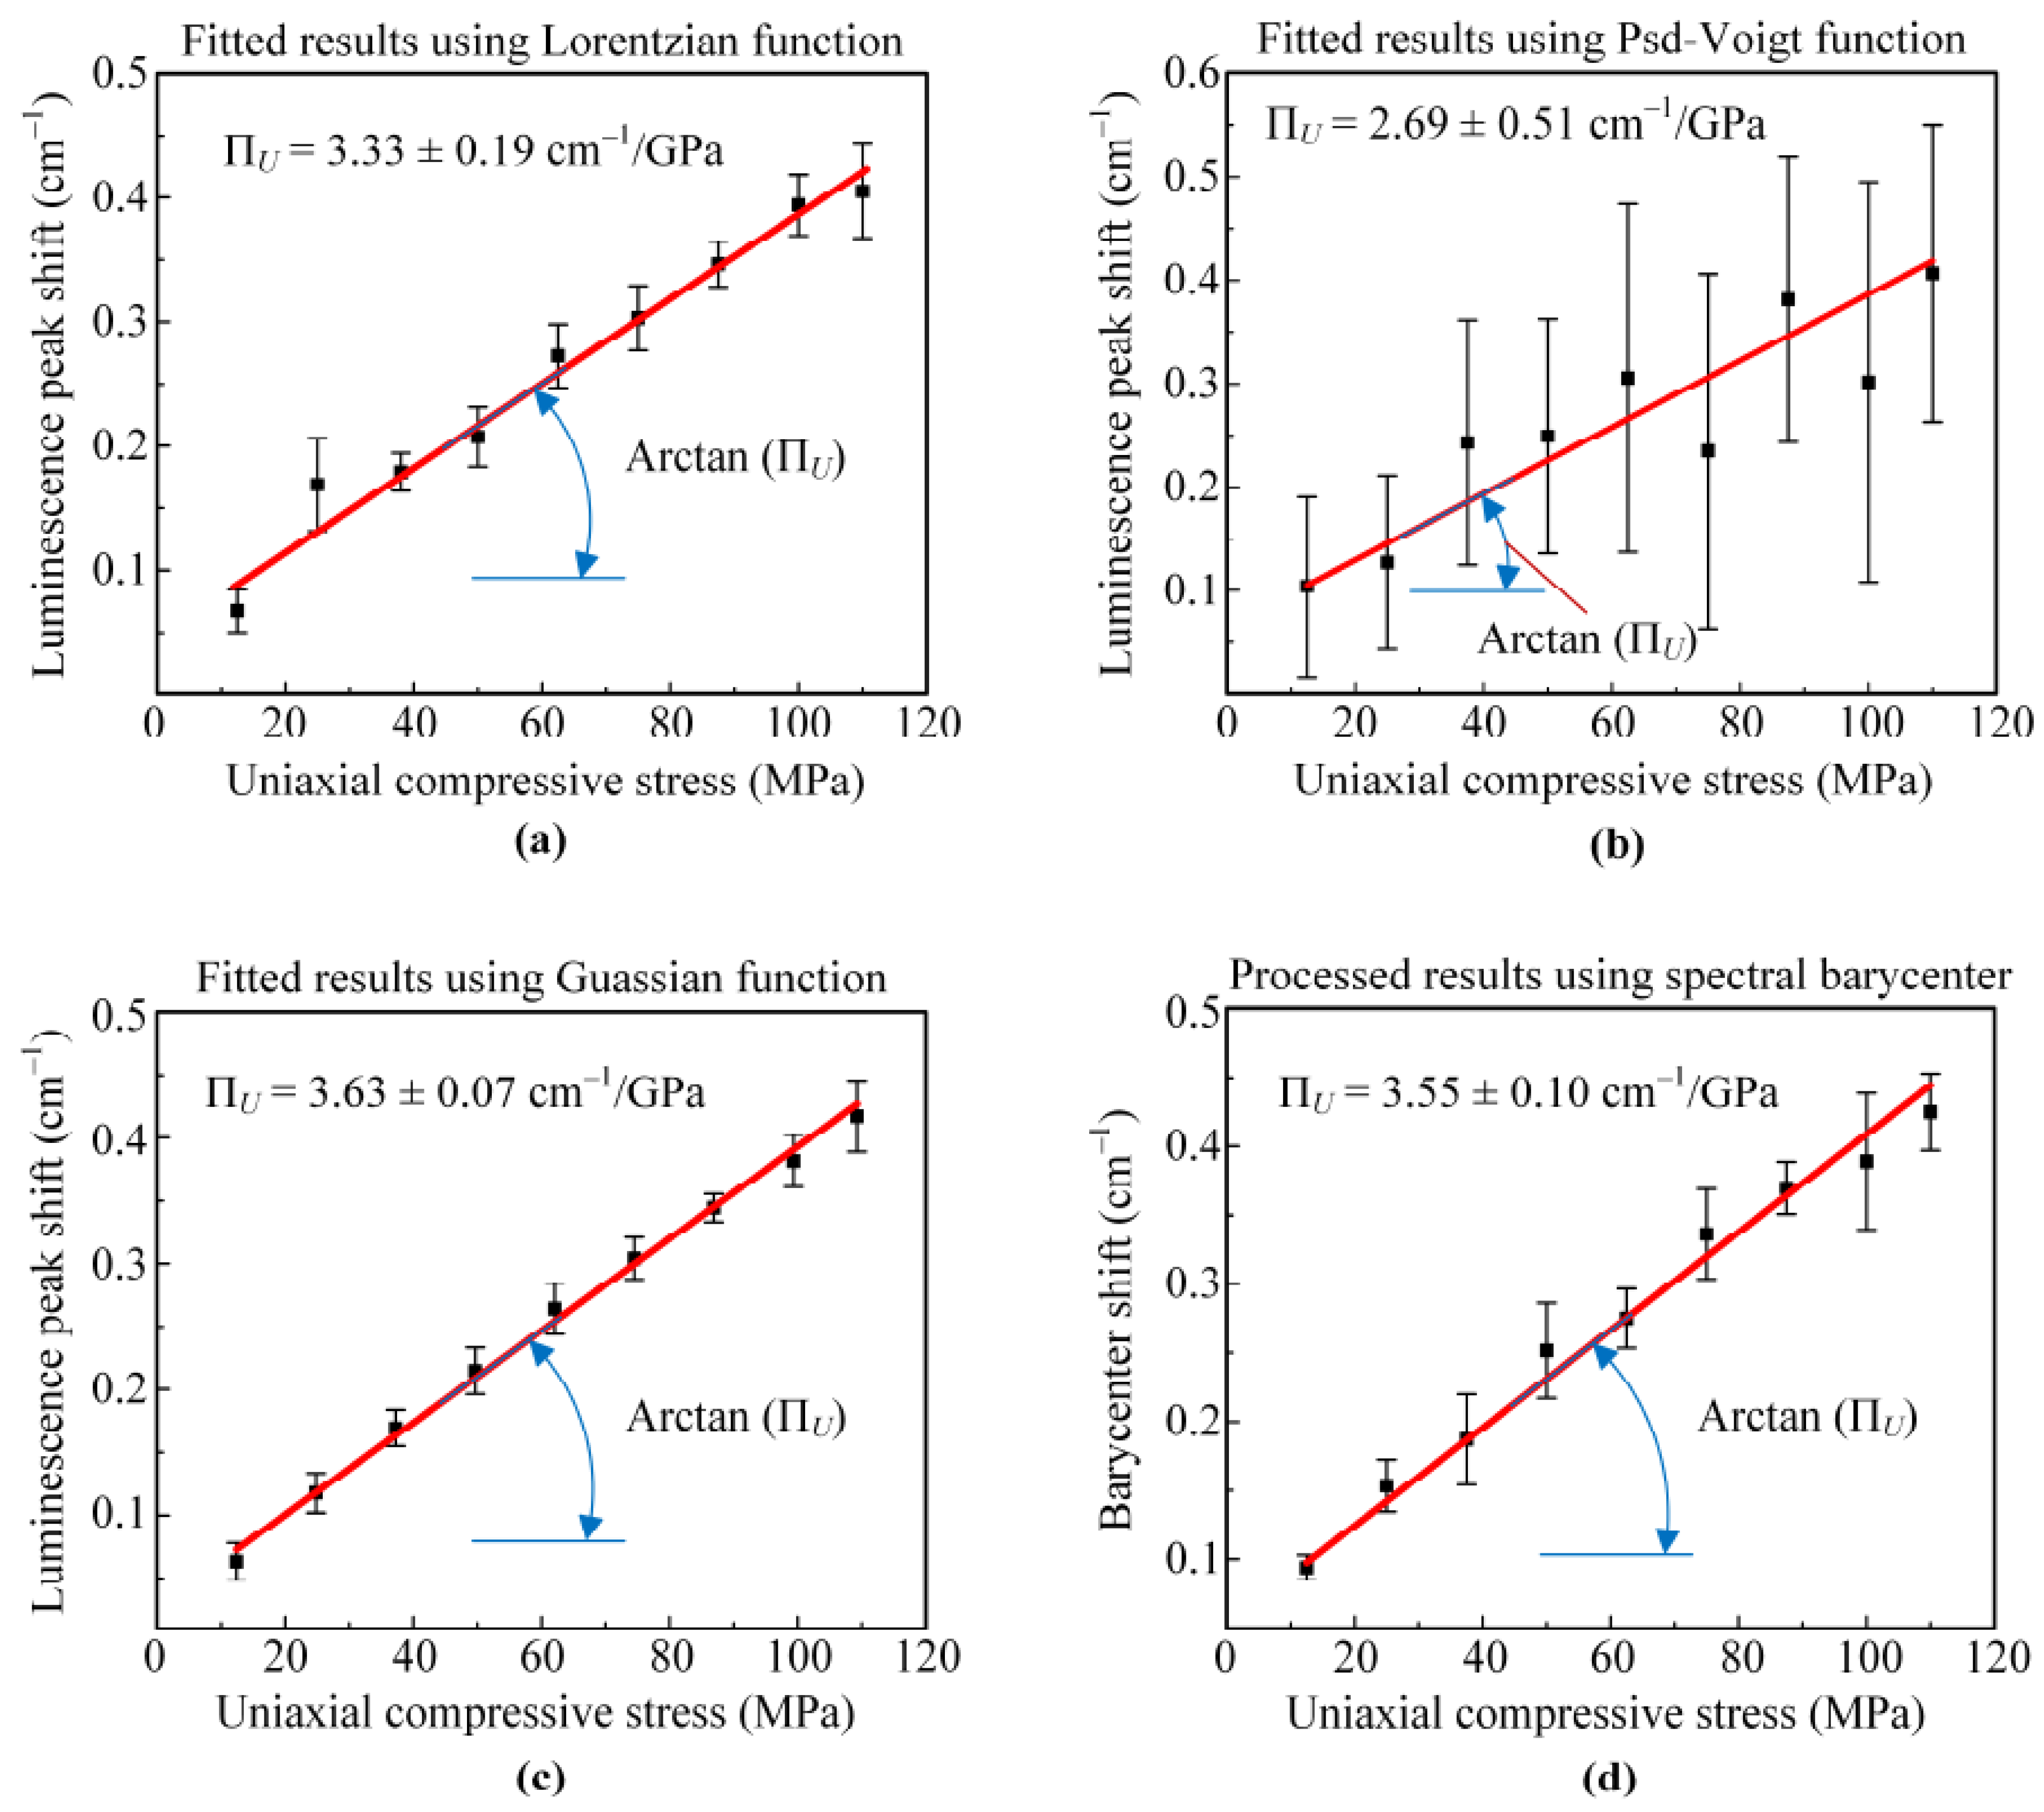
Lorentzian, Psd-Voigt, Gaussian and barycenter methods were used to process all the measured spectra, and wavenumber increments under different uniaxial loadings (equal step lengths) were obtained, as shown in Figure 8. Based on the processed results, the piezospectroscopic coefficients ΠU were obtained and are listed in Table 4.
The peak shifts processed by both Lorentzian (Figure 8a), and Gaussian (Figure 8c) functions increased linearly (R2 > 0.97) with increasing uniaxial stress. The piezospectroscopic coefficient ΠU obtained using the Lorentzian function was close to that obtained by the Gaussian function, 3.63 ± 0.07 cm−1/GPa. In contrast, the peak shifts in the spectra processed with the Psd-Voigt function had the largest fluctuation or the poorest stability. More specifically, the peak shifts measured at different sampling spots with the same loading varied widely, with an average variation of 0.27 cm−1. Although the peak shifts changed with external loading in a generally linear fashion, the correlation coefficient was low, only 0.80. As shown in Figure 8d, the average barycenter shift showed a linear (R2 ~ 0.99) increase with compressive stress, and the ΠU was 3.55 ± 0.10 cm−1/GPa. All the ΠU results obtained in this work were larger than that reported in a previous study (Ref. [19]) which used 8YSZ:Eu3+ powders under hydrostatic pressure for calibration. Our results (specifically the value of ΠU from the data fitted with a Gaussian function) are closer to those reported in another study [27] that used a similar calibration sample and loading method.
4.3. Combined Discussion
The Psd-Voigt function was clearly unsuitable for fitting Eu3+ photoluminescence piezospectroscopy for stress analysis owing to its low sensitivity to small stress changes, poor stability, and low reliability of obtained peak shifts even though the fitted curves more closely corresponded to the original data. In particular, Psd-Voigt fitting did not clearly identify any stress changes below 50 MPa, as shown in Figure 7b. Conversely, both Lorentzian and Gaussian curves accurately identified the peak shifts caused by small stresses and stably described the linear relationship between the stress and peak shift. The Gaussian fits always gave a higher GOF, and appeared closer to the original data than did the Lorentzian. Thus, the Gaussian function was the best choice for fitting Eu3+ photoluminescence spectra for experimental stress analysis.
The applicability of any fitting function to spectral analysis is determined by the spectral generation mechanism. Generally, a characteristic peak corresponding to a single (or close to single) vibration/excitation mode in the Raman/fluorescence spectrum of a crystal, especially that of a monocrystalline material, presents as a perfect Lorentzian shape. Examples of such peaks include the Raman G peak of graphene [51], the first-order Raman peak of monocrystalline silicon [42], and the fluorescence peak of ruby crystal, which has been verified by our published work [45]. For polycrystalline materials, or eutectic substances, with some hybrid structures or multioverlay vibration/excitation modes, the characteristic peaks in their Raman or fluorescence spectra show Gaussian shapes, just like that of the 8YSZ:Eu3+ polycrystal prepared by solid-state reaction [28]. In many other materials, Raman or fluorescence peaks present Voigt shapes, which are actually a convolution of Lorentzian and Gaussian characteristics. However, it is difficult to achieve curve fitting using the real Voigt function because of the discrete sequence of spectral data. As an alternative, the Psd-Voigt function, which is the linear superposition of Lorentzian and Gaussian functions with a certain weighting, has been widely used. The fitting a Raman or fluorescence spectrum using a Psd-Voigt function usually results in a high GOF [11]. However, this is often achieved by adjusting the Lorentzian-Gaussian weight ratio without any physical meaning. Hence, the weight ratios obtained from fitting the spectra of the same sample at different stresses or taken from different positions are uncertain, inconsistent, and irregular. Owing to the loss of a unified standard for mutual comparison, the small wavenumber changes caused by stress are often unclear in the fitting results, which makes the Psd-Voigt function insensitive and inaccurate for evaluating stress.
Considering the noise, large FWHM, and asymmetry of typical Eu3+ photoluminescence spectroscopy, published works have always taken the top half of the peak that consists of less data and usually fitted it to a Lorentzian function [27,28]. In these cases, the residual stress being measured was always hundreds or even thousands of MPa in magnitude. This concealed the problem that the Lorentzian function is not sensitive enough to analyze the whole peak and accurately identified stresses on the order of 10 MPa. However, such accuracy in piezospectroscopic analysis is now needed because of more stringent engineering requirements for advanced thermal barrier coating technology, which depend upon credible characterization of residual/processing stress.
As is well known, Cr3+ and Eu3+ photoluminescence piezospectroscopic technologies have been widely used for residual stress analysis in the interface region of TBC, and the Lorentzian function is a better choice than the other functions mentioned above to process Cr3+ photoluminescence spectra, which is generated under a single mechanism in TGO and has better symmetry and a lower SNR [45]. As for the Eu3+ photoluminescence spectra, Gaussian function fitting was the best method to improve stress analysis precision for the 8YSZ:Eu3+ sublayer embedded just above the TC/BC interface, where the residual stress accumulated and evolved under thermal cycling [27]. The dopant Eu3+ ions in the 8YSZ substitute for Zr4+ ions, so their neighbors are O2− ions and vacancies, and their micro-environment is asymmetric. Such Eu3+ ions will generate one emission peak near 606 nm, at a wavenumber of approximately 16,508 cm−1, from the magnetic-dipole 5D0–7F2 transition under laser irradiation. Eu3+ might occupy three different crystal lattice sites in the 8YSZ matrix, which may result in the characteristic emission peak being broader and composed of at least three sub-peaks. Importantly, the thermally sprayed 8YSZ:Eu3+ sublayer is usually polycrystalline. Therefore, the shape of the Eu3+ fluorescence peak was closer to that of a Gaussian line type compared with the Cr3+ fluorescence because of the multiple fluorescence mechanisms [52]. The above was also confirmed by the fitting results of Figure 6 and Table 2.
In addition, the ΠU value obtained from the barycenter method is close to that obtained from Gaussian fitting, indicating that the barycenter method was reliable. Its strength is that when calculating the band areas (an essential part of calculating the barycentric wavenumber) it sums and eliminates random noise, thereby clarifying the position of the spectral band [34]. However, this method requires manual selection of the optimal data range from the original luminescence peak to reduce the interference from the noise background, as shown in Figure 5. Therefore, Gaussian fitting is a more efficient way of processing data because it is insensitive to the random noise background. Additionally, the difference between the ΠU values obtained from Gaussian fitting and the barycenter method was very small as shown in Figure 8. This agreement between the barycenter method (which is statistical in nature) and the Gaussian fit is further evidence of the sensitivity and stability of the Gaussian function for fitting broad, asymmetric Eu3+ fluorescence spectra.
5. Conclusions
In this work, numerical experiments and calibration tests were carried out to obtain Eu3+ photoluminescence spectra corresponding to different uniaxial loadings. Then, the Psd-Voight, Lorentzian and Gaussian fitting methods, and barycenter method, respectively, were used to process the photoluminescence spectroscopic data. The results showed that the Psd-Voigt fitting gave the highest goodness-of-fit, but had low sensitivity to small stress changes, as well as low stability and low confidence in the peak shift value. Compared with the Lorentzian fitting, which was very widely used in the published literature, Gaussian fitting was found to give more accurate results, while being consistent with the generation mechanism of Eu3+ photoluminescence. In addition, the barycenter method also identified small peak shifts and achieved a similar reliability to the Gaussian fitting, which was, however, more efficient and gave more accurate results than the barycenter method. Thus, the Gaussian fitting method should be used to process Eu3+ photoluminescence spectroscopic data for accurate stress analysis in the ceramic layer near the interface in thermal barrier coatings.
Author Contributions
Conceptualization, W.Q.; methodology, Y.Z. and N.L.; formal analysis, Y.Z. and N.L.; investigation, Y.Z. and N.L.; resources, W.Q.; data curation, Y.Z. and N.L.; writing—original draft preparation, N.L. and Y.Z.; writing—reviewing and editing, W.Q., Y.Z. and N.L.; visualization, W.Q., Y.Z. and N.L.; supervision, W.Q. and Y.Z.; project administration, W.Q.; funding acquisition, W.Q. All authors have read and agreed to the published version of the manuscript.
Funding
This research was funded by the National Natural Science Foundation of China, Grant Nos. 12021002, 11827802 and 11890680.
Institutional Review Board Statement
Not applicable.
Informed Consent Statement
Not applicable.
Data Availability Statement
The data are not publicly available because they form part of an ongoing study.
Conflicts of Interest
The authors declare no conflict of interest.
References
- Clarke, D.R.; Oechsner, M.; Padture, N.P. Thermal-barrier coatings for more efficient gas-turbine engines. MRS Bull. 2012, 37, 891–899. [Google Scholar] [CrossRef] [Green Version]
- Hardwicke, C.U.; Lau, Y.C. Advances in thermal spray coatings for gas turbines and energy generation: A review. J. Therm. Spray Technol. 2013, 22, 564–576. [Google Scholar] [CrossRef]
- Clarke, D.R.; Phillpot, S.R. Thermal barrier coating materials. Mater. Today 2005, 8, 22–29. [Google Scholar] [CrossRef]
- Schulz, U.; Leyens, C.; Fritscher, K.; Peters, M.; Saruhan-Brings, B.; Lavigne, O.; Dorvaux, J.M.; Poulain, M.; Mevrel, R.; Caliez, M.L. Some recent trends in research and technology of advanced thermal barrier coatings. Aerosp. Sci. Technol. 2003, 7, 73–80. [Google Scholar] [CrossRef]
- Padture, N.P. Advanced structural ceramics in aerospace propulsion. Nat. Mater. 2016, 15, 804–809. [Google Scholar] [CrossRef] [PubMed]
- Belmonte, M. Advanced ceramic materials for high temperature applications. Adv. Eng. Mater. 2006, 8, 693–703. [Google Scholar] [CrossRef] [Green Version]
- Padture, N.P.; Gell, M.; Jordan, E.H. Thermal barrier coatings for gas-turbine engine applications. Science 2002, 296, 280–284. [Google Scholar] [CrossRef]
- Wellman, R.G.; Nicholls, J.R. Erosion, corrosion and erosion–corrosion of EB PVD thermal barrier coatings. Tribol. Int. 2008, 41, 657–662. [Google Scholar] [CrossRef] [Green Version]
- Jiang, P.; Fan, X.; Sun, Y.; Li, D.; Li, B.; Wang, T. Competition mechanism of interfacial cracks in thermal barrier coating system. Mater. Des. 2017, 132, 559–566. [Google Scholar] [CrossRef] [Green Version]
- Evans, H.E. Oxidation failure of TBC systems: An assessment of mechanisms. Surf. Coat. Technol. 2011, 206, 1512–1521. [Google Scholar] [CrossRef]
- Jiang, P.; Yang, L.; Sun, Y.; Li, D.; Wang, T. Nondestructive measurements of residual stress in air plasma-sprayed thermal barrier coatings. J. Am. Ceram. Soc. 2021, 104, 1455–1464. [Google Scholar] [CrossRef]
- Jiang, P.; Fan, X.; Sun, Y.; Li, D.; Wang, T. Bending-driven failure mechanism and modelling of double-ceramic-layer thermal barrier coating system. Int. J. Solids Struct. 2018, 130, 11–20. [Google Scholar] [CrossRef]
- Clarke, D.; Christensen, R.; Tolpygo, V. The evolution of oxidation stresses in zirconia thermal barrier coated superalloy leading to spalling failure. Surf. Coat. Technol. 1997, 94, 89–93. [Google Scholar] [CrossRef]
- Schlichting, K.; Vaidyanathan, K.; Sohn, Y.; Jordan, E.; Gell, M.; Padture, N. Application of Cr3+ photoluminescence piezo-spectroscopy to plasma-sprayed thermal barrier coatings for residual stress measurement. Mater. Sci. Eng. A 2000, 291, 68–77. [Google Scholar] [CrossRef]
- Gentleman, M.; Clarke, D. Concepts for luminescence sensing of thermal barrier coatings. Surf. Coat. Technol. 2004, 188, 93–100. [Google Scholar] [CrossRef]
- Eldridge, J.I.; Bencic, T.J. Monitoring delamination of plasma-sprayed thermal barrier coatings by reflectance-enhanced luminescence. Surf. Coat. Technol. 2006, 201, 3926–3930. [Google Scholar] [CrossRef] [Green Version]
- Eldridge, J.I.; Singh, J.; Wolfe, D.E. Erosion-indicating thermal barrier coatings using luminescent sublayers. J. Am. Ceram. Soc. 2006, 89, 3252–3254. [Google Scholar] [CrossRef]
- Zhao, S.; Zhao, Y.; Zhu, L.; Gu, L.; Huang, W.; Fan, X.; Zou, B.; Wang, Y.; Cao, X. A simple non-destructive method to indicate the spallation and damage degree of the double-ceramic-layer thermal barrier coating of La2(Zr0.7Ce0.3)2O7 and 8YSZ:Eu. J. Eur. Ceram. Soc. 2013, 33, 2207–2213. [Google Scholar] [CrossRef]
- Zhao, S.; Gu, L.; Zhao, Y.; Huang, W.; Zhu, L.; Fan, X.; Zou, B.; Cao, X. Thermal cycling behavior and failure mechanism of La2(Zr0.7Ce0.3)2O7/Eu3+-doped 8YSZ thermal barrier coating prepared by atmospheric plasma spraying. J. Alloys Compd. 2013, 580, 101–107. [Google Scholar] [CrossRef]
- Li, C.; Fan, X.; Jiang, P.; Jin, X. Delamination-indicating of atmosphere-plasma-sprayed thermal barrier coating system using Eu3+ luminescence mapping. Mater. Lett. 2018, 222, 41–44. [Google Scholar] [CrossRef]
- Zhao, Y.; Ma, C.; Huang, F.; Wang, C.; Zhao, S.; Cui, Q.; Cao, X.; Li, F. Residual stress inspection by Eu3+ photoluminescence piezo-spectroscopy: An application in thermal barrier coatings. J. Appl. Phys. 2013, 114, 073502. [Google Scholar] [CrossRef]
- Manero II, A.; Selimov, A.; Fouliard, Q.; Knipe, K.; Wischek, J.; Meid, C.; Karlsson, A.M.; Bartsch, M.; Raghavan, S. Piezospectroscopic evaluation and damage identification for thermal barrier coatings subjected to simulated engine environments. Surf. Coat. Technol. 2017, 323, 30–38. [Google Scholar] [CrossRef]
- Sohn, Y.; Schlichting, K.; Vaidyanathan, K.; Gell, M.; Jordan, E. Nondestructive evaluation of residual stress for thermal barrier coated turbine blades by Cr3+ photoluminescence piezospectroscopy. Metall. Mater. Trans. A 2000, 31, 2388–2391. [Google Scholar] [CrossRef]
- Lima, C.; Dosta, S.; Guilemany, J.; Clarke, D. The application of photoluminescence piezospectroscopy for residual stresses measurement in thermally sprayed TBCs. Surf. Coat. Technol. 2017, 318, 147–156. [Google Scholar] [CrossRef]
- Hanhan, I.; Durnberg, E.; Freihofer, G.; Akin, P.; Raghavan, S. Portable piezospectroscopy system: Non-contact in-situ stress sensing through high resolution photo-luminescent mapping. J. Instrum. 2014, 9, P11005. [Google Scholar] [CrossRef]
- Ma, Q.; Clarke, D.R. Stress measurement in single-crystal and polycrystalline ceramics using their optical fluorescence. J. Am. Ceram. Soc. 1993, 76, 1433–1440. [Google Scholar] [CrossRef]
- Jiang, P.; Fan, X.; Sun, Y.; Wang, H.; Su, L.; Wang, T. Thermal-cycle dependent residual stress within the crack-susceptible zone in thermal barrier coating system. J. Am. Ceram. Soc. 2018, 101, 4256–4261. [Google Scholar] [CrossRef]
- Zhao, S.; Ren, Z.; Zhao, Y.; Xu, J.; Zou, B.; Hui, Y.; Zhu, L.; Zhou, X.; Cao, X. The application of Eu3+ photoluminescence piezo-spectroscopy in the LaMgAl11O19/8YSZ:Eu double-ceramic-layer coating system. J. Eur. Ceram. Soc. 2015, 35, 249–257. [Google Scholar] [CrossRef]
- Zhu, W.; Zhang, Z.; Yang, L.; Zhou, Y.; Wei, Y. Spallation of thermal barrier coatings with real thermally grown oxide morphology under thermal stress. Mater. Des. 2018, 146, 180–193. [Google Scholar] [CrossRef]
- Wei, Z.Y.; Cai, H.N.; Li, C.J. Comprehensive dynamic failure mechanism of thermal barrier coatings based on a novel crack propagation and TGO growth coupling model. Ceram. Int. 2018, 44, 22556–22566. [Google Scholar] [CrossRef]
- Wei, Z.Y.; Cai, H.N.; Meng, G.H.; Tahir, A.; Zhang, W.W. An innovative model coupling TGO growth and crack propagation for the failure assessment of lamellar structured thermal barrier coatings. Ceram. Int. 2020, 46, 1532–1544. [Google Scholar] [CrossRef]
- Wei, Z.Y.; Cai, H.N.; Tahir, A.; Zhang, W.W.; Li, X.F.; Zhang, Y.; Huang, Y.P.; Liu, Y. Stress states in plasma-sprayed thermal barrier coatings upon temperature cycling: Combined effects of creep, plastic deformation, and TGO growth. Ceram. Int. 2019, 45, 19829–19844. [Google Scholar] [CrossRef]
- Shen, Z.; Zhong, B.; He, L.; Xu, Z.; Mu, R.; Huang, G. LaZrCeO/YSZ TBCs by EB-PVD: Microstructural evolution, residual stress and degradation behavior. Mater. Chem. Front. 2019, 3, 892–900. [Google Scholar] [CrossRef]
- Zhang, W.; Li, Z.; Baxter, G.; Collins, S.F. Stress-and temperature-dependent wideband fluorescence of a phosphor composite for sensing applications. Exp. Mech. 2017, 57, 57–63. [Google Scholar] [CrossRef] [Green Version]
- Yang, J.; Wang, L.; Li, D.; Zhong, X.; Zhao, H.; Tao, S. Stress analysis and failure mechanisms of plasma-sprayed thermal barrier coatings. J. Therm. Spray Tech. 2017, 26, 1–12. [Google Scholar] [CrossRef]
- Yang, J.; Zhao, H.; Zhong, X.; Ni, J.; Zhuang, Y.; Wang, L.; Tao, S. Evolution of residual stresses in PS-PVD thermal barrier coatings on thermal cycling. J. Therm. Spray Tech. 2018, 27, 914–923. [Google Scholar] [CrossRef]
- Fabisiak, K.; Łoś, S.; Paprocki, K.; Szybowicz, M.; Winiecki, J.; Dychalska, A. Orientation dependence of cathodoluminescence and photoluminescence spectroscopy of defects in chemical-vapor-deposited diamond microcrystal. Mater. 2020, 13, 5446. [Google Scholar] [CrossRef] [PubMed]
- Sonntag, J.; Li, J.; Plaud, A.; Loiseau, A.; Barjon, J.; Edgar, J.; Stampfer, C. Excellent electronic transport in heterostructures of graphene and monoisotopic boron-nitride grown at atmospheric pressure. 2D Mater. 2020, 7, 031009. [Google Scholar] [CrossRef] [Green Version]
- Li, Q.; Qiu, W.; Tan, H.; Guo, J.; Kang, Y. Micro-raman spectroscopy stress measurement method for porous silicon film. Opt. Laser Eng. 2010, 48, 1119–1125. [Google Scholar] [CrossRef]
- Xu, C.; Xue, T.; Qiu, W.; Kang, Y. Size effect of the interfacial mechanical behavior of graphene on a stretchable substrate. ACS Appl. Mater. Interfaces 2016, 8, 27099–27106. [Google Scholar] [CrossRef]
- Lei, Z.K.; Kang, Y.L.; Hao, C.; Ming, H.; Yu, Q. Residual stress on surface and cross-section of porous silicon studied by micro-Raman spectroscopy. Chin. Phys. Lett. 2005, 22, 984. [Google Scholar] [CrossRef]
- Qiu, W.; Cheng, C.L.; Liang, R.R.; Zhao, C.W.; Lei, Z.K.; Zhao, Y.C.; Ma, L.L.; Xu, J.; Fang, H.J.; Kang, Y.L. Measurement of residual stress in a multi-layer semiconductor heterostructure by micro-Raman spectroscopy. Acta Mech. Sin. 2016, 32, 805–812. [Google Scholar] [CrossRef]
- Dou, W.; Xu, C.; Guo, J.; Du, H.; Qiu, W.; Xue, T.; Kang, Y.; Zhang, Q. Interfacial mechanical properties of double-layer graphene with consideration of the effect of stacking mode. ACS Appl. Mater. Interfaces 2018, 10, 44941–44949. [Google Scholar] [CrossRef] [PubMed]
- Qiu, W.; Ma, L.; Li, Q.; Xing, H.; Cheng, C.; Huang, G. A general metrology of stress on crystalline silicon with random crystal plane by using micro-Raman spectroscopy. Acta Mech. Sin. 2018, 34, 1095–1107. [Google Scholar] [CrossRef]
- Lu, N.; Zhang, Y.; Qiu, W. Comparison and selection of data processing methods for the application of Cr3+ photoluminescence piezospectroscopy to thermal barrier coatings. Coatings 2021, 11, 181. [Google Scholar] [CrossRef]
- Lavasani, H.Q.; Valefi, Z.; Ehsani, N.; Masoule, S.T. Studying the effect of spraying parameters on the sintering of YSZ TBC using APS method. Surf. Coat. Technol. 2019, 360, 238–246. [Google Scholar] [CrossRef]
- Zhao, J.; Fan, S.S.; Zhang, S.L. Numerical simulation for the raman spectrum of SiC nano-rod. Chin. J. Light Scatter. 2004, 16, 299–302. [Google Scholar] [CrossRef]
- Tai, F.C.; Lee, S.C.; Chen, J.; Wei, C.; Chang, S.H. Multipeak fitting analysis of raman spectra on DLCH film. J. Raman Spectrosc. 2009, 40, 1055–1059. [Google Scholar] [CrossRef]
- Tohidi, T.; Jamshidi-Ghaleh, K. Effect of TEA on photoluminescence properties of PbS nanocrystalline thin films. Appl. Phys. A 2015, 118, 1247–1258. [Google Scholar] [CrossRef]
- Syassen, K. Ruby under pressure. High. Press. Res. 2008, 28, 75–126. [Google Scholar] [CrossRef]
- Huang, M.; Yan, H.; Chen, C.; Song, D.; Heinz, T.F.; Hone, J. Phonon softening and crystallographic orientation of strained graphene studied by Raman spectroscopy. Proc. Natl. Acad. Sci. USA 2009, 106, 7304–7308. [Google Scholar] [CrossRef] [PubMed] [Green Version]
- Reichert, F.; Pérez-Mas, A.M.; Barreda, D.; Blanco, C.; Santamaria, R.; Kuttner, C.; Fery, A.; Langhof, N.; Krenkel, W. Influence of the carbonization temperature on the mechanical properties of thermoplastic polymer derived C/C-SiC composites. J. Eur. Ceram. Soc. 2017, 37, 523–529. [Google Scholar] [CrossRef] [Green Version]
Figure 1.
(a) The SEM micrograph of as-synthesized 8YSZ:Eu3+ powder particles; (b) histogram with the size distribution of the particles; (c) SEM images of cross-sectional microstructures of the as-prepared 8YSZ:Eu3+ coating samples; inset image shows the high-magnification SEM image of local region in (c).
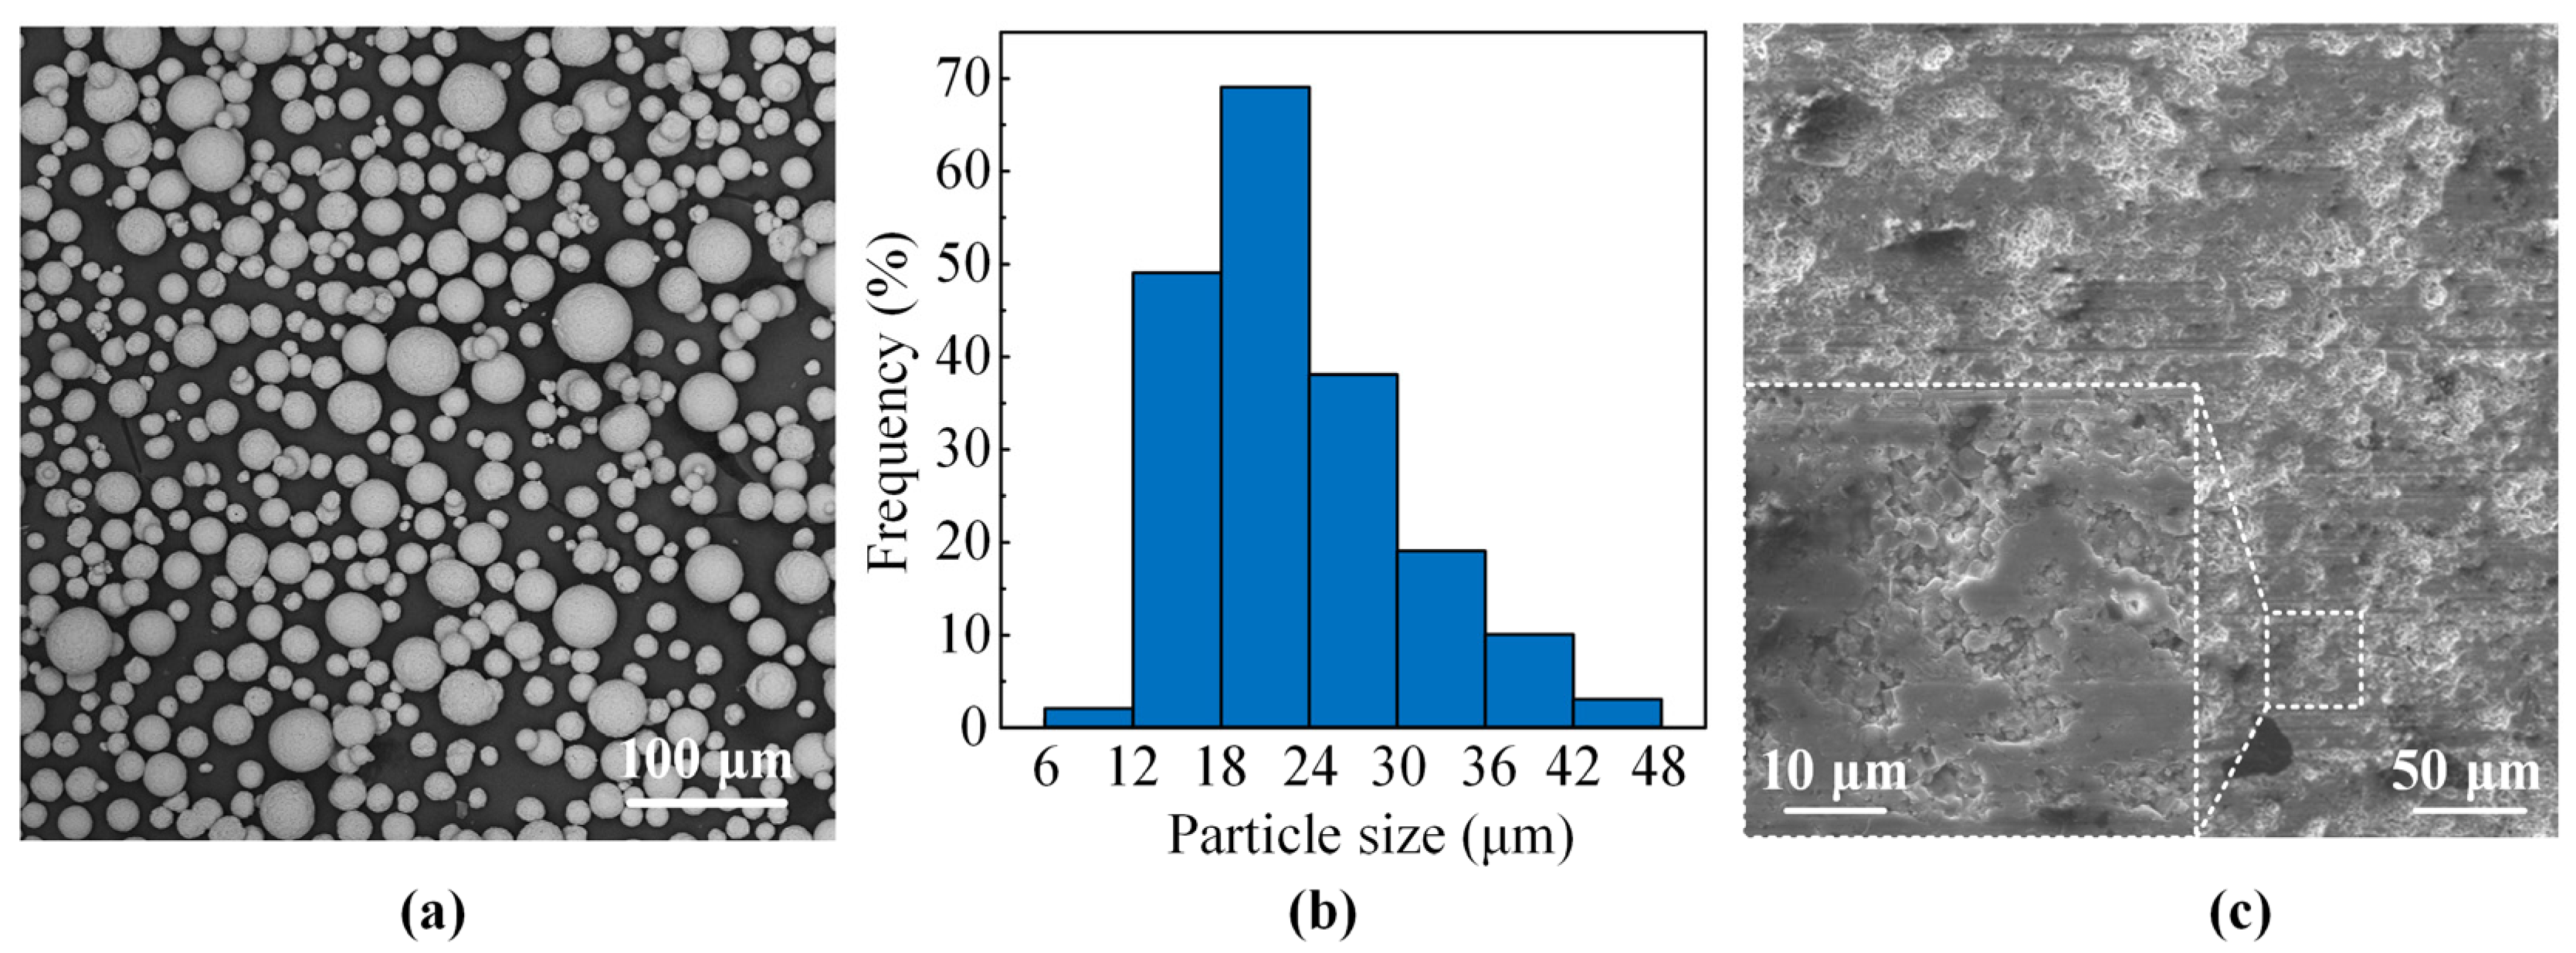
Figure 2.
(a) The experimental system used for calibration tests; (b) a typical Eu3+ fluorescence spectrum.
Figure 2.
(a) The experimental system used for calibration tests; (b) a typical Eu3+ fluorescence spectrum.

Figure 3.
Procedure used for the numerical experiments.
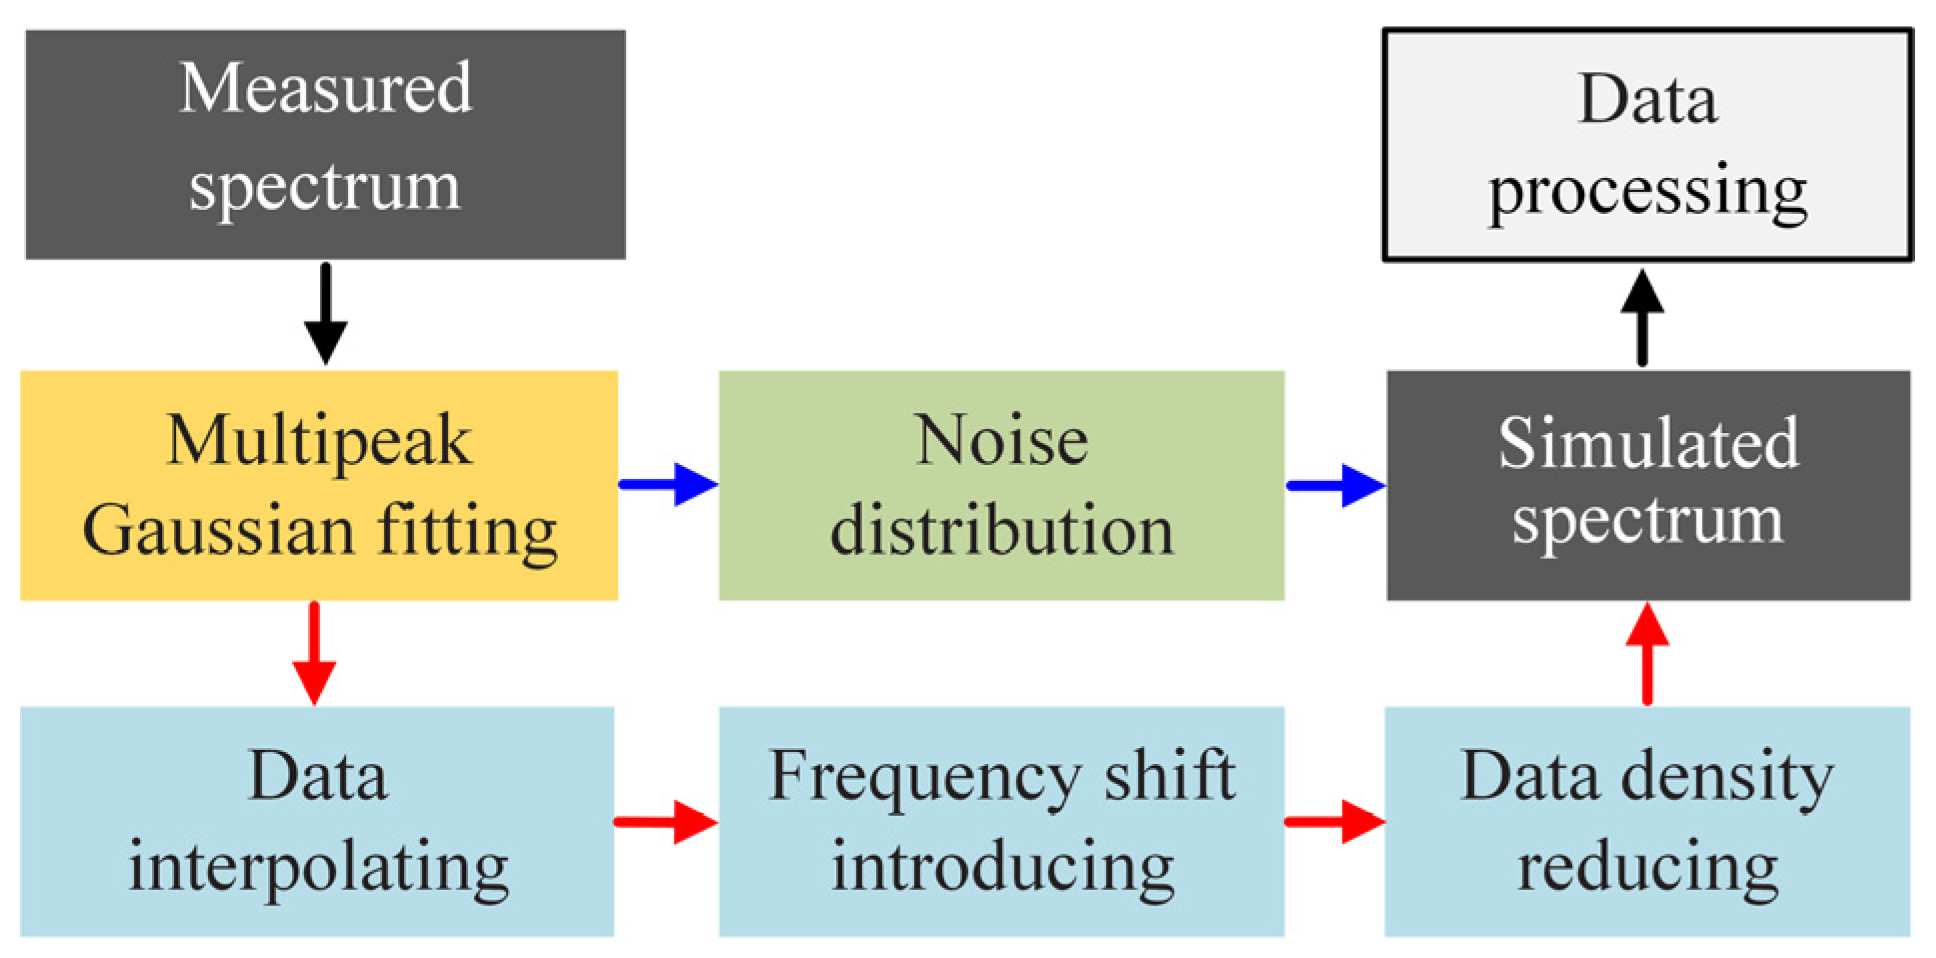
Figure 4.
(a) Smooth curve obtained by multipeak fitting; (b) noise distribution; (c) simulated spectrum with introduced noise.
Figure 4.
(a) Smooth curve obtained by multipeak fitting; (b) noise distribution; (c) simulated spectrum with introduced noise.

Figure 5.
The intensity-normalized fluorescence spectra with the definition of barycenter in the upper right and the background noise in the lower right.
Figure 5.
The intensity-normalized fluorescence spectra with the definition of barycenter in the upper right and the background noise in the lower right.
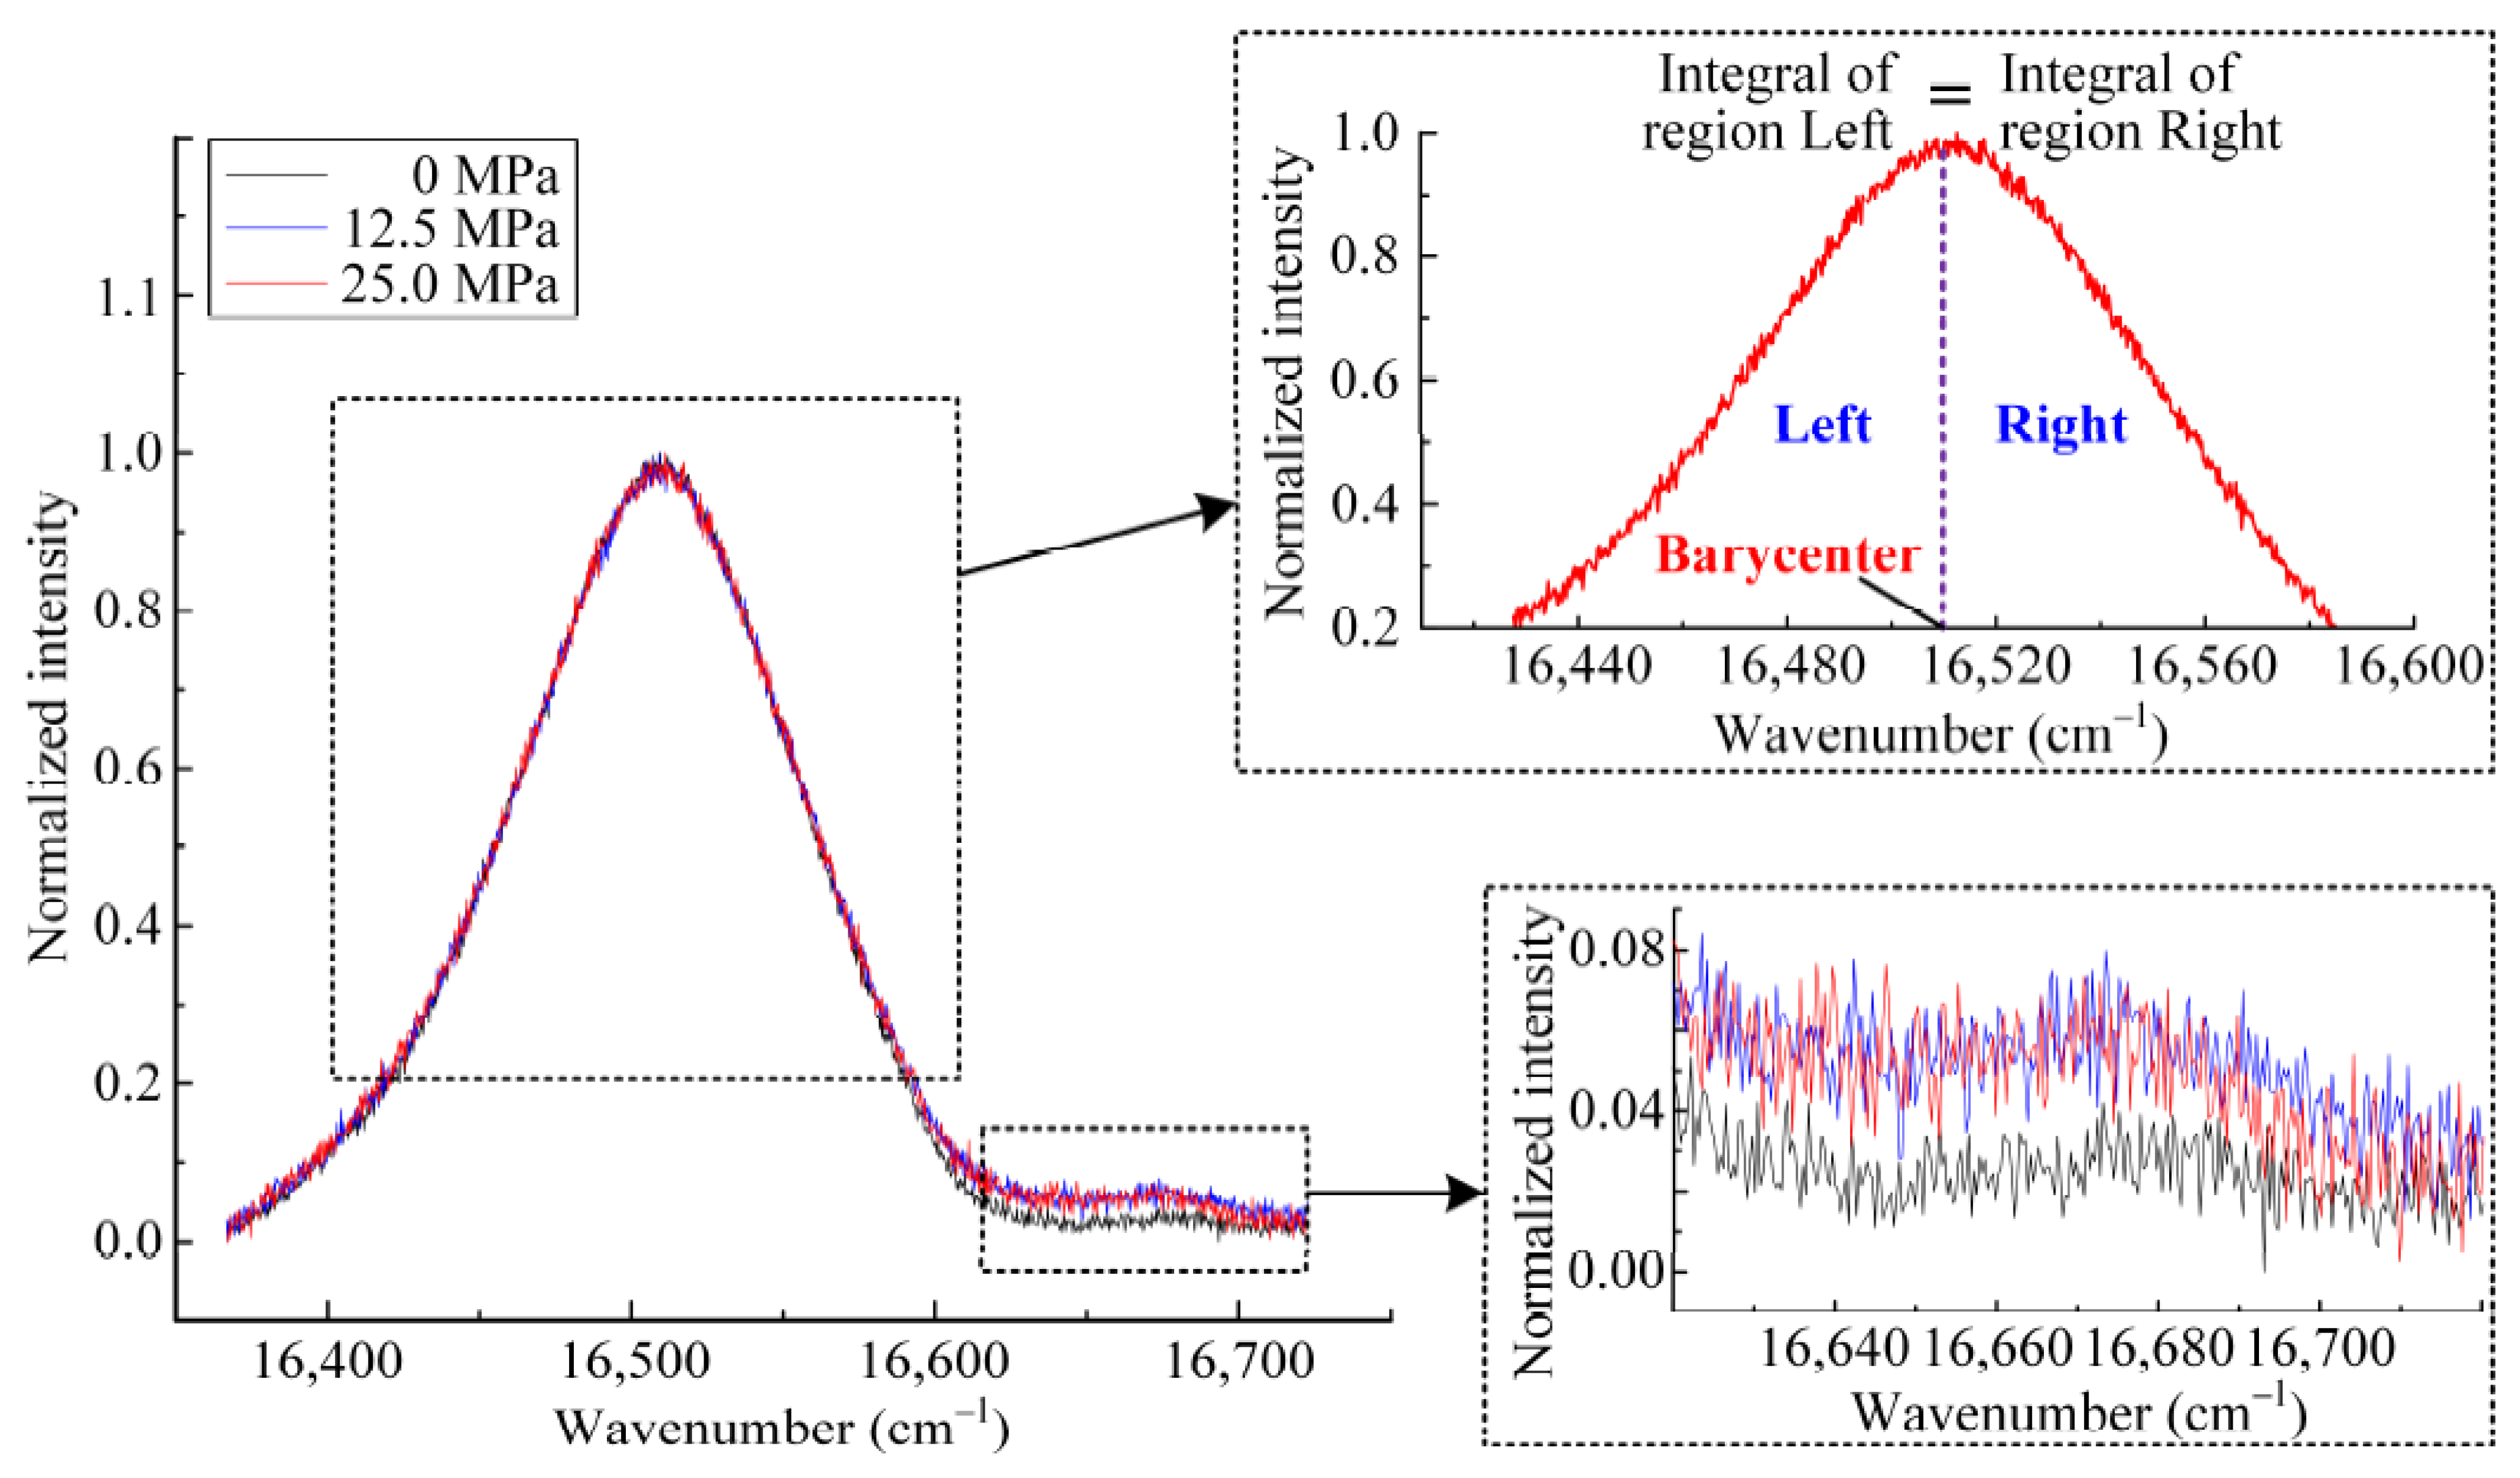
Figure 6.
A typical Eu3+ photoluminescence spectrum and fitting results. (a) Lorentzian; (b) Psd-Voigt; (c) Gaussian.
Figure 6.
A typical Eu3+ photoluminescence spectrum and fitting results. (a) Lorentzian; (b) Psd-Voigt; (c) Gaussian.
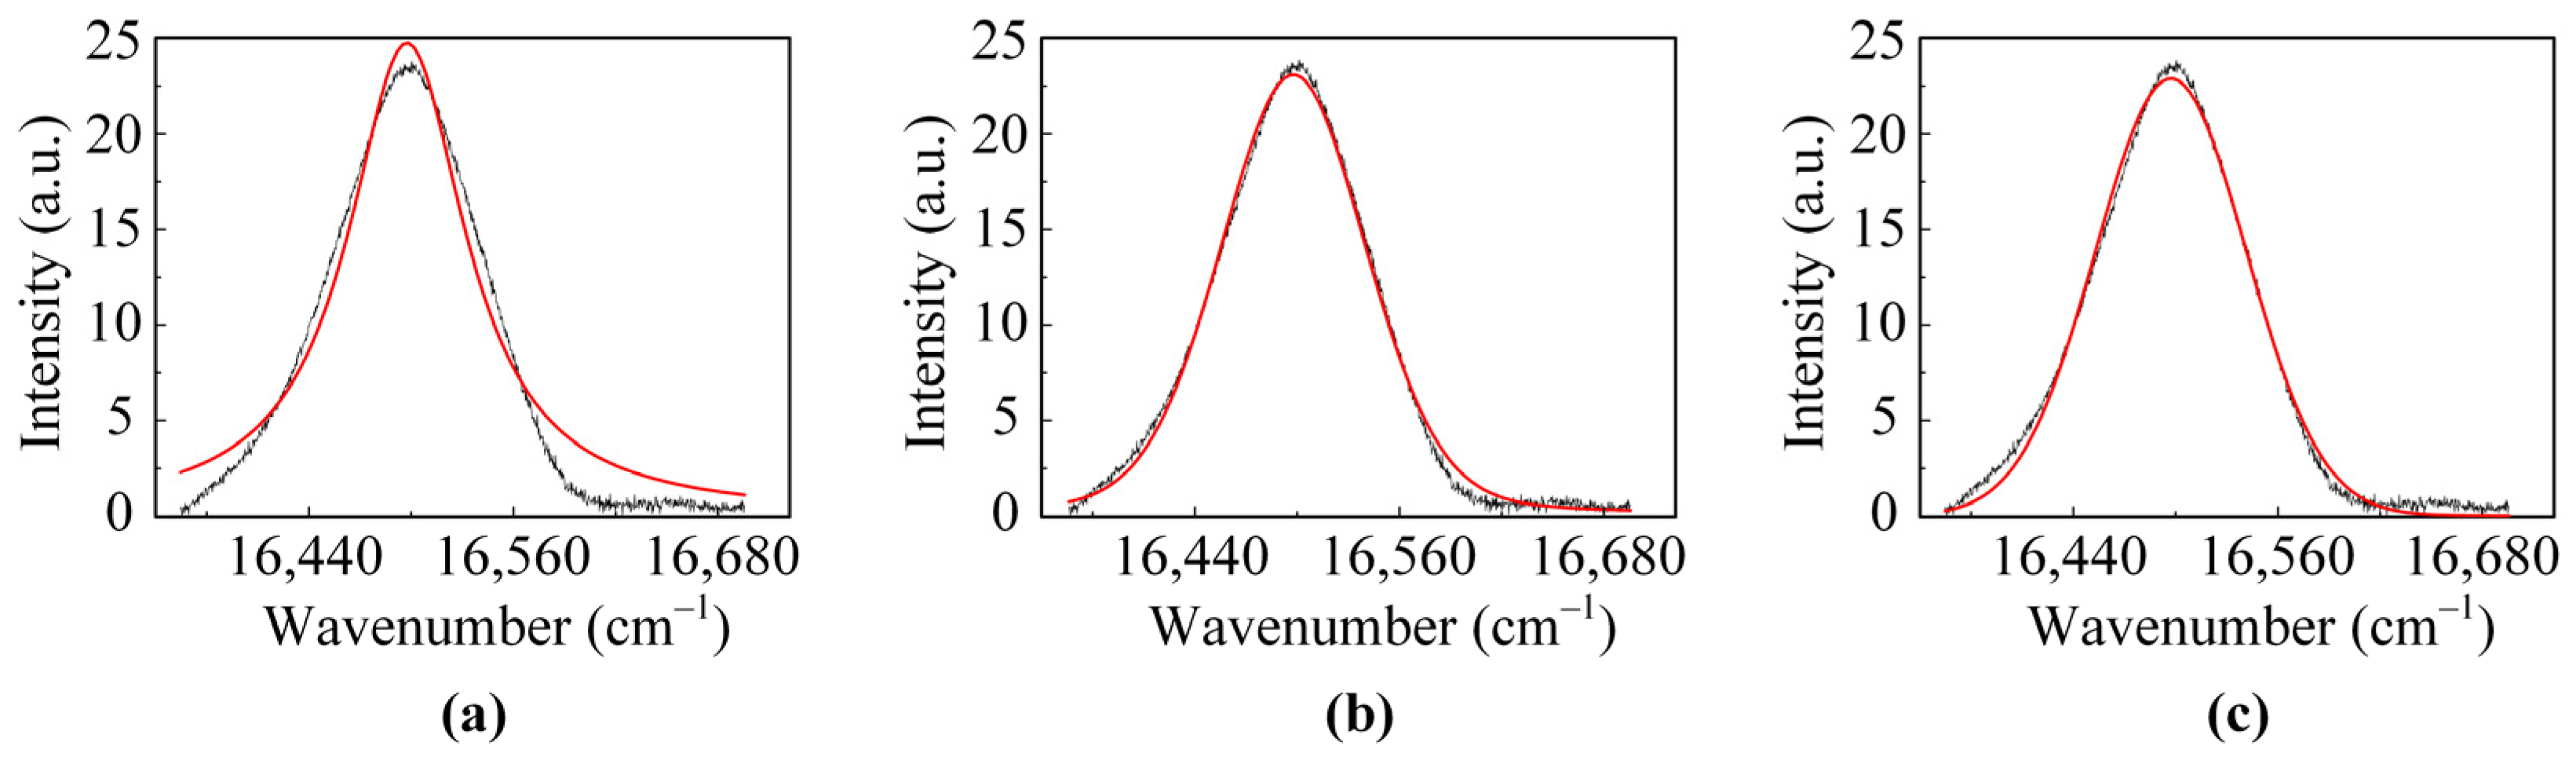
Figure 7.
The relationships between luminescence peak shift and uniaxial compressive stress obtained from simulated spectra with different processing methods. (a) Lorentzian fitting; (b) Psd-Voigt fitting; (c) Gaussian fitting; (d) Barycenter method.
Figure 7.
The relationships between luminescence peak shift and uniaxial compressive stress obtained from simulated spectra with different processing methods. (a) Lorentzian fitting; (b) Psd-Voigt fitting; (c) Gaussian fitting; (d) Barycenter method.

Figure 8.
The relationships between uniaxial compressive stress and luminescence peak shift of measured spectra obtained with different processing methods. (a) Lorentzian fitting; (b) Psd-Voigt fitting; (c) Gaussian fitting; (d) Barycenter method.
Figure 8.
The relationships between uniaxial compressive stress and luminescence peak shift of measured spectra obtained with different processing methods. (a) Lorentzian fitting; (b) Psd-Voigt fitting; (c) Gaussian fitting; (d) Barycenter method.

Table 1.
Spaying parameters of the 8YSZ:Eu3+ coating.
| Current (A) | Voltage (V) | Gas Flow (L/min) | Feedstock Rate (g/min) | Spraying Distance (mm) | Spraying Angle (°) |
|---|---|---|---|---|---|
| 630 | 72 | Ar: 38 H2: 60 | 30 | 100 | 90 |
Table 2.
GOF values for different functions used to fit Eu3+ fluorescence spectra.
| Fitting Function | Lorentzian | Psd-Voigt | Gaussian | |
|---|---|---|---|---|
| GOF | Simulated data | 0.9683 | 0.9966 | 0.9958 |
| Measured data | 0.9699 | 0.9966 | 0.9953 | |
Table 3.
Piezospectroscopic coefficients ΠU obtained from numerical experiments using different data processing methods.
Table 3.
Piezospectroscopic coefficients ΠU obtained from numerical experiments using different data processing methods.
| Processing Method | ΠU (cm−1/GPa) | R2 | Relative Error of ΠU |
|---|---|---|---|
| Pre-set value | 2.59 | - | 0 |
| Lorentzian | 2.61 ± 8.86 × 10⁻⁴ | 1 | 0.77% |
| Psd-Voigt | 3.65 ± 0.57 | 0.7141 | 35.52% |
| Gaussian | 2.58 ± 1.93 × 10⁻⁴ | 1 | 0.39% |
| Barycenter | 2.67 ± 6.76 × 10⁻⁴ | 1 | 2.62% |
Table 4.
Piezospectroscopic coefficients ΠU from calibration experiments, obtained with different data processing methods.
Publisher’s Note: MDPI stays neutral with regard to jurisdictional claims in published maps and institutional affiliations. |
© 2021 by the authors. Licensee MDPI, Basel, Switzerland. This article is an open access article distributed under the terms and conditions of the Creative Commons Attribution (CC BY) license (https://creativecommons.org/licenses/by/4.0/).
Share and Cite
MDPI and ACS Style
Zhang, Y.; Lu, N.; Qiu, W. Optimal Data Processing Method for the Application of Eu3+ Photoluminescence Piezospectroscopy in Thermal Barrier Coatings. Coatings 2021, 11, 678. https://doi.org/10.3390/coatings11060678
AMA Style
Zhang Y, Lu N, Qiu W. Optimal Data Processing Method for the Application of Eu3+ Photoluminescence Piezospectroscopy in Thermal Barrier Coatings. Coatings. 2021; 11(6):678. https://doi.org/10.3390/coatings11060678
Chicago/Turabian StyleZhang, Yanheng, Ning Lu, and Wei Qiu. 2021. "Optimal Data Processing Method for the Application of Eu3+ Photoluminescence Piezospectroscopy in Thermal Barrier Coatings" Coatings 11, no. 6: 678. https://doi.org/10.3390/coatings11060678
Note that from the first issue of 2016, this journal uses article numbers instead of page numbers. See further details here.