
Corrosion Behavior of J55 and N80 Carbon Steels in Simulated Formation Water under Different CO2 Partial Pressures


1
State Key Laboratory for Mechanical Behavior of Materials, Xi’an Jiaotong University, Xi’an 710049, China
2
CNPC Tubular Goods Research Institute, Xi’an 710077, China
*
Authors to whom correspondence should be addressed.
Coatings 2022, 12(10), 1402; https://doi.org/10.3390/coatings12101402
Submission received: 10 August 2022
/
Revised: 8 September 2022
/
Accepted: 15 September 2022
/
Published: 26 September 2022
(This article belongs to the Special Issue Deposition, Characterization and Application of Anti-corrosion and Lubricating Coatings)
Abstract
:The purpose of this paper is to reveal the corrosion behavior of J55 and N80 carbon steels in formation water under oil wells at different partial pressures, explore the formation process of corrosion product films under supercritical CO2 conditions, and analyze the reasons why the microstructure of carbon steel affects the corrosion behavior. The results show that the corrosion rate gradually increases with the increase in CO2 partial pressure. When the pressure exceeds 10 MPa, the corrosion rate of J55 increases slightly, and that of N80 decreases slightly. Under different partial pressures, the surface composition of the corrosion product film of J55 steel is FeCO3, and that of N80 steel is FeCO3 with a small amount of Fe3C. The analysis shows that the corrosion product films of two kinds of carbon steels can be divided into three layers under the condition of supercritical CO2. There are holes in the middle layer, which are formed first, and then the inner layer and the outer layer are formed at the same time. It is believed that the difference in the morphology and distribution of Fe3C is the reason why the corrosion rate of J55 steel is lower than that of N80 steel. Fe3C in J55 steel is lamellar, which can anchor FeCO3, promote the formation of corrosion product films, and improve the compactness of corrosion product films. However, the Fe3C in N80 is granular and dispersed in the ferrite matrix, which makes it easy to fall off the surface, form pits, and destroy the integrity of the corrosion product film.
1. Introduction
The global climate change problem has aroused widespread concern in the international community, and it has gradually become an international consensus to reduce CO2 emissions to meet the climate challenge [1]. Carbon capture utilization and shortage (CCUS) is considered one of the effective means to reduce CO2 emissions and slow down global climate change [2,3]. CCUS refers to the industrial process in which carbon dioxide is separated from industrial production or the atmosphere and then directly used or injected into the strata or the seabed to achieve CO2 emission reduction. With the development of science and technology, CCUS has become one of the essential technologies for achieving the goal of carbon neutrality in the world [2,3]. The process of injecting CO2 into existing oil fields is a well-known “CO2 enhanced oil recovery” (CO2-EOR) technique, which is the utilization method in CCUS [4]. Although CO2-EOR can improve oil recovery and reduce CO2, it also results in CO2-corrosion of oil country tubular goods due to the injection of high-pressure CO2 [5]. Furthermore, in order to improve the oil recovery, the pressure of CO2 () injected is increased and even exceeds the supercritical pressure [6,7], which aggravates the CO2 corrosion [5]. The CO2-EOR technique plays an important role in ensuring economic and stable petroleum products. Therefore, it is necessary to solve the corrosion problem of tubing under the condition of CO2 oil displacement.
J55 and N80 carbon steels are widely used in oil production. The CO2 corrosion of these steels in oil wells has received extensive attention. The structure of the CO2-corrosion product film on the steel surface is an important factor affecting the CO2 corrosion of carbon steel. Many scholars have studied the structure and formation process of CO2-corrosion product films through immersion experiments and morphology observations. Zhang found that ( = 1 MPa, temperature = 90 °C, simulated formation water) the composition of N80 carbon steel-corrosion product film was FeCO3, and the corrosion product film was composed of inner and outer layers. Due to the different formation mechanisms, the outer layer was formed by the precipitation of FeCO3 on the surface of the inner layer, so its binding force was weak. The inner layer was formed by the reaction of with the metal matrix in situ, and its binding force is relatively large [8]. Wei found that ( = 1, 9.5 MPa, temperature = 80 °C, 3.5% NaCl solution) the corrosion product film composition of X65 pipeline steel was FeCO3. The corrosion product film was composed of inner and outer layers. Under the condition of supercritical CO2 (temperature > 31.1 °C, > 7.38 MPa), an amorphous FeCO3 layer is preferentially formed on the surface of carbon steel, which is gradually transformed into a dense inner FeCO3 layer, and the outer layer is finally formed [9]. Chen found that ( = 1 MPa, temperature = 78 °C, simulated formation water) the corrosion product film of N80 steel had a three-layer structure and believed that the three layers were formed at the same time. The middle layer and the outer layer were formed by FeCO3 deposition, and delamination occurred during the deposition process. The corrosion product film of the inner layer was mainly formed by the direct reaction of and ions with the steel matrix at the interface, so the binding force was strong [10]. Li also believed that ( = 1 MPa, temperature = 60 °C, simulated formation water) the corrosion product film of X65 pipeline steel had a three-layer structure: the surface layer and inner layer were dense, and the middle layer was porous. The middle layer was formed first, and the inner and outer layers were formed simultaneously [11]. Through the study of X65 pipeline steel ( = 1, 9.5 MPa, temperature = 50, 80 °C, simulated formation water), Zhang found that under the conditions of low pressure and supercritical CO2, the outer layer and middle layer of corrosion product film had holes, while the inner layer was dense [12]. Although researchers have not reached a consensus on the structure and formation process of corrosion product films for carbon steel, they all found that the inner layer was dense and had the best corrosion resistance.
On the other hand, the formation process of the corrosion product film of carbon steel under different CO2 partial pressures was explored with electrochemical technology. Wang studied the influence of CO2 partial pressure on the Nyquist impedance spectrum ( = 0.3–2 MPa, temperature = 60 °C, 1% NaCl solution), and found that CO2 partial pressure obviously changed the “size” of the semicircle but had little effect on the shape of the impedance spectrum. This means that with the increase in CO2 partial pressure, the corrosion rate changed, but the corrosion mechanism did not change, because the “size” of the semicircle corresponds to the corrosion rate and the resistance of the corrosion product film, while the shape of the impedance spectrum determines the corrosion mechanism [13]. Zhang ( = 5, 8 MPa, temperature = 60 °C, simulated formation water) used electrochemical impedance spectroscopy (EIS) to study the formation process of corrosion product films for N80 carbon steel in simulated formation water [14]. Under the conditions of 5 MPa and 8 MPa (supercritical CO2 condition), the corrosion mechanism did not change, but with the increase in partial pressure, the resistance and corrosion resistance of the corrosion product film increased. Wei found that ( = 1, 9.5 MPa, temperature = 60 °C, carbon steel, 1% NaCl solution) under the conditions of low CO2 partial pressure and supercritical CO2, the impedance spectrum of Nyquist showed a capacitive arc. With the increase in immersion time, the radius of the capacitive arc became larger, and the charge transfer rate decreased [15]. These researchers used electrochemical technology to study the formation process of corrosion product films on carbon steel under the conditions of low CO2 partial pressure and supercritical CO2. They found that the Nyquist impedance spectrum showed a capacitive arc, and that the shape of the impedance spectrum did not change with time, but the radius of the capacitive arc gradually expanded. This shows that the increase in CO2 partial pressure does not change the corrosion mechanism but enhances the compactness of the corrosion product film.
Moreover, the mechanical properties of the corrosion product film also have an important impact on the corrosion behavior. Studies [16,17,18,19] showed that the mechanical characteristics of corrosion product scales, especially Young’s modulus, strongly affect the CO2 corrosion process of steels. They found that the corrosion rate decreased as the Young’s modulus of FeCO3 increased.
Most researchers have studied the corrosion behavior of carbon steel under one or two partial pressures of CO2. Due to the complexity of oil well production conditions, the partial pressure of CO2 changes continuously from low pressure to supercritical, and these research results can no longer provide better theoretical guidance for oil well safety production. Therefore, the corrosion behavior of J55 and N80 carbon steels in a wider range of CO2 partial pressures (0.1, 3, 5, 7, 10, and 15 MPa) was studied in this paper, and the change law of corrosion rate and corrosion morphology under different CO2 partial pressures were revealed. These works may provide a theoretical basis for preventing CO2 corrosion in oil wells with complex working conditions. At the same time, under the condition of supercritical CO2, the structure and formation process of the corrosion product film of carbon steel are still unclear and need further exploration. Hence, the structure and formation process of the corrosion product film of carbon steel under supercritical CO2 conditions were explored in this paper to enrich people’s understanding of this.
In addition, researchers have extensively discussed the effect of microstructure on corrosion behavior under low CO2 partial pressures [20,21,22]. However, there are few studies under supercritical CO2 conditions, and more research and attention are needed. Thus, in this paper, two kinds of commonly used tubing (J55 and N80 steels) with different microstructures were selected, and the corrosion behavior of these steels under supercritical CO2 conditions was analyzed to reveal the reasons why the microstructure affects the corrosion behavior.
2. Experimental Section
2.1. Materials
The materials used in the experiment are J55 and N80 carbon steels, whose chemical compositions are shown in Table 1 (ARL4460 direct reading spectrometer). As shown in Figure 1, the microstructure of J55 is a mixture of lamellar ferrite and lamellar pearlite, while the microstructure of N80 steel is tempered sorbite. The sizes of samples for immersion test, X-ray diffraction test, and scanning electron microscopy observation are 50 mm × 10 mm × 3 mm, 10 mm × 10 mm × 3 mm, and 10 mm × 10 mm × 3 mm, respectively.
2.2. Immersion Test
The experimental conditions at different CO2 partial pressures are shown in Table 2. In order to simulate the working conditions under oil wells, the parameters were set to the following: 80 °C, 168 h, 0.3 m/s. Additionally, the chemical compositions of the simulated formation water are shown in Table 3. Immersion tests were carried out in a 10-L dynamic autoclave produced by Cortest (JB/T 7901-1999). Before the experiment, the samples were polished step by step with 1000# metallographic sandpaper, and then cleaned with acetone and deionized water. After dehydrating with ethanol, the samples were dried with hot air, and then weighed and measured for geometric dimensions. The simulated formation water was injected into the autoclave and the samples were immersed in water, and then the water was deoxygenated with nitrogen for 8 h. After that, the system was heated to the preset temperature, and then CO2 was injected into the solution to ensure that the CO2 partial pressure reached a predetermined value. Finally, the total pressure reached 20 MPa by injecting N2. The immersion time tests were carried out to study the formation process of the corrosion product film and the effect of microstructure on the corrosion behavior of the steels under supercritical CO2 conditions. The test parameters are shown in Table 4.
After immersion tests, the samples were washed with deionized water, dehydrated with ethanol, and dried with cold air. One sample was used to observe the morphology and analyze the phase of the corrosion products. The corrosion products of the other three samples were removed by some kind of solution (appropriate amount of deionized water, 500 mL of hydrochloric acid (density is 1.19 mg/mL), and 3.5 g of hexamethylene tetramine were prepared into a 1000-mL solution) according to the ASTM G1-03 standard. The three samples were washed, then dehydrated, dried, and weighed to observe the weight loss. The corrosion rate was calculated with the equation (ASTM G31-27 standard):
where CR is the corrosion rate, mm/y; is the weight loss, g; S is the surface area of a sample, cm2; ρ is the density of the steel, g/cm3; t is the immersion time, h. The average corrosion rate is the mean value of the corrosion rates of three samples.
2.3. Characterization of the Corrosion Product
The microstructure of J55 and N80 steels, the surface, and cross-section morphologies of the corrosion product were observed with a Tescan Vega II scanning electron microscopy (SEM) (an acceleration voltage of 20 Kv, a working distance of 15 mm). The chemical compositions and phases of the corrosion product were analyzed with X-ray diffraction (XRD) with a Cu K X-ray source operated at 40 kV and 150 mA.
3. Results
3.1. Corrosion Behavior of J55 and N80 under Different CO2 Partial Pressures
As shown in Figure 2, as CO2 partial pressure rises, the corrosion rates of J55 and N80 increase in general. It should be noted that the corrosion rate of the N80 steel reaches the maximum at 10 MPa and then decreases slightly. The corrosion rate under supercritical CO2 conditions is higher than that under low CO2 partial pressures.
Figure 3 shows the different states of CO2. When the temperature exceeds 31.1 °C, the CO2 partial pressure exceeds 7.38 MPa, and CO2 is in a supercritical state [23,24,25,26]. In this paper, No.5 and No.6 immersion tests are all in the supercritical state. Under these conditions, the solubility of CO2 is much higher than that under low CO2 pressures [27]. The higher the solubility, the higher the concentration of the hydrogen ions, leading to a large increase in the dissolution rate of the metal. Hence, the corrosion rate under supercritical CO2 conditions is higher than that under low CO2 partial pressures. The reason why the corrosion rate of the N80 steel decreases slightly when the CO2 partial pressure exceeds 10 MPa may be related to the formation of a dense corrosion product film.
Figure 4 shows the phases of corrosion products of J55 and N80 steels at various CO2 partial pressures. Only FeCO3 was detected on the surface of the J55 steel, while FeCO3 and Fe3C were detected on the surface of the N80 steel. The difference in the phase between J55 and N80 steels may be due to the different shapes and distributions of carbides in steels.
As shown in Figure 1, after normalizing, the microstructure of the J55 steel is composed of ferrite (F) and pearlite (P). In Figure 1, ferrite is black, and pearlite is gray. The fine structure of pearlite consists of lamellar ferrite and lamellar Fe3C [20,21,22]. Through XRD analysis (Figure 4), the main component of the corrosion product films on the surface of the J55 steel is FeCO3. During the formation of the corrosion product film, the residual Fe3C was not easy to fall off and was completely covered by FeCO3, so it was not detected. As shown in Figure 1, after quenching and high-temperature tempering, the microstructure of the N80 steel is tempered sorbite [20,21,22], that is, a ferrite matrix (gray or white) and dispersed Fe3C particles (black dot). Under different CO2 partial pressures, the main components of the N80 steel corrosion product films are FeCO3 and Fe3C (Figure 4). In the corrosion process, the ferrite matrix was preferentially dissolved, and the granular Fe3C was easy to fall off and mix into the FeCO3 corrosion product film. Fe3C was not completely covered by FeCO3, so it was detected. At 7 MPa, the surface of corrosion products of the N80 steel contained approximately 78% FeCO3 and 22% Fe3C (mass fraction). At 10 MPa, it contained 76% FeCO3 and 24% Fe3C (mass fraction).
Figure 5 and Figure 6 show the surface and cross-section morphologies of the J55 steel at various CO2 partial pressures. When the partial pressure of CO2 was 0.1 MPa and 3 MPa, the thickness of the corrosion films was less than 10 μm (Figure 6), no crystalline corrosion products were observed on the surface of the samples, and the flaky corrosion products peeled off and shallow corrosion pits were formed (Figure 5). At 5, 7, 10, and 15 MPa, the thickness was approximately 100, 110, 140, and 140 μm, respectively. At 5 MPa, the surface of the sample was covered by amorphous and crystalline corrosion products, and after exceeding 5 MPa, the corrosion products were crystalline particles. As shown in Figure 6, as the CO2 partial pressure rose, the thickness of the corrosion product film increased.
When the pressure was low (0.1, 3 MPa), no crystalline corrosion product particles were found (Figure 7) on the surface of the N80 samples and the thickness was less than 10 μm (Figure 8). When the pressure exceeded 3 MPa, the thickness increased, obviously, and all thicknesses were greater than 120 μm (Figure 8). When the pressure was 5 MPa, the surface of the sample was covered by amorphous corrosion products and crystalline corrosion products. At 7 MPa and 15 MPa, the surface of the sample was covered by crystalline corrosion product particles, and the corrosion product film was dense. On the contrary, at 10 MPa, the corrosion product film was porous, and consisted of granular and sludge-like corrosion products. At 10 MPa, it was observed from the cross-section picture that holes appeared at the interface between the corrosion product film and the metal matrix. The porous corrosion product film led to the maximum corrosion rate of 10 MPa.
3.2. Corrosion Behavior of J55 and N80 Steels at Different Immersion Times under Supercritical CO2 Conditions
In order to study the formation process of corrosion product films under supercritical CO2 conditions, immersion tests were carried out (shown in Table 4, temperature = 60 °C, velocity = 0 m/s). The immersion time of the samples in simulated formation water was 20 h, 66 h, 114 h, and 168 h, respectively. As shown in Figure 9, the average corrosion rates of the J55 and N80 steels decrease rapidly as immersion times increase from 20 h to 66 h. After 66 h, the corrosion rates decrease slowly, and after 114 h, the average corrosion rates tend to be stable. The changing trend of the corrosion rate was similar to the experimental results of Zhang [28,29] and Wei [30]. In addition, the corrosion rate of the N80 steel was higher than that of J55 steel at different immersion times.
As shown in Figure 10 and Figure 11, with the increase in immersion time, the film thickness of corrosion products of the J55 and N80 steels continued to increase. Before 66 h, the thickness was less than 10 μm. When the immersion time exceeded 66 h, the thickness increased rapidly. At 114 h, the thickness of all samples exceeded 100 μm. After 114 h, the thickness did not change noticeably. Zhang [12,28] and Wei [29] discovered the same phenomenon. It can be seen that the period from 20 h to 66 h is a period of rapid decline in corrosion rate, and the thickness of the corrosion product film is small and increases slowly. From 66 h to 114 h, the corrosion rate decreased slowly, and the thickness of the corrosion product film increased rapidly. After 114 h, the corrosion rate was stable, and the thickness of the corrosion product film did not change noticeably.
4. Discussion
4.1. Influence of CO2 Partial Pressure on the Corrosion Behavior of J55 and N80 Steels
Zhang [14] and Wei [15] used EIS to study the corrosion behavior of carbon steel under supercritical CO2 and low CO2 partial pressure. They found that under both conditions, after 7 h, the impedance spectrum showed a capacitive reactance arc, and the radius of the capacitive reactance arc increased with time, which showed that the protectiveness of the corrosion product film increased with time. In addition, when the immersion time was the same, the impedance of the corrosion product film under supercritical CO2 was greater than that under high CO2 partial pressure and low CO2 partial pressure. This indicated that the protective property of the corrosion product film increased with the increase in CO2 partial pressure. The corrosion rate of carbon steel is the result of the joint action of the protection of the corrosion product film and the corrosiveness of the solution in which carbon steel is located. When the protection of the corrosion product film dominates, the corrosion rate decreases, while when the corrosiveness of the solution dominates, the corrosion rate increases. As shown in Figure 2, with the increase in CO2 partial pressure, the corrosion rate of J55 steel continues to increase, which indicates that the corrosivity of the solution is dominant. The corrosion rate of the N80 steel continued to increase, reaching a maximum of 10 MPa, and then decreased. This shows that the corrosivity of the solution is dominant when it is lower than 10 MPa, and the protection of the corrosion product film is dominant when it is higher than 10 MPa.
According to research [30,31], the deposition process of FeCO3 includes nucleation and growth. It is generally believed that the nucleation and growth of particles are related to the relative supersaturation (RS) of FeCO3.The nucleation rate of particles is exponentially related to the relative supersaturation, and the growth rate of particles is linearly related to the relative supersaturation. Therefore, the deposition of FeCO3 is controlled by growth at low supersaturation and is controlled by nucleation at high supersaturation. The supersaturation and relative supersaturation of FeCO3 are expressed by Formulas 2 and 3:
where S is the supersaturation of FeCO3; [Fe2+] is the equilibrium concentration of iron ion, mol/L. [C is the equilibrium concentration of carbonate ion, mol/L; is the solubility product of FeCO3. When the temperature and the composition of the solution are constant, is constant; RS is the relative supersaturation.
RS = S − 1
At low CO2 partial pressures, the relative supersaturation of FeCO3 was low, the growth of FeCO3 dominated, and the growth of FeCO3 was inhibited [30,31]. Therefore, FeCO3 particles were coarse, and the corrosion product films were porous. Conversely, under supercritical CO2 conditions, the relative supersaturation was high and the growth of FeCO3 dominated. Therefore, FeCO3 particles were fine, and the corrosion product films were dense. As shown in Figure 12 and Figure 13, the size of FeCO3 particles in supercritical states is smaller than that in low CO2 partial pressures.
Small holes were observed in the middle layer of the corrosion product films of the J55 steel (Figure 6). This was because FeCO3 grew along the lamellar Fe3C and then FeCO3 sheets squeezed against each other, increasing the stress, leading to the fracture of FeCO3 sheets [32]. It can be observed from Figure 12 that there are cracks (10 MPa, 15 MPa) on the surface of the corrosion product film of the J55 steel, which may have originated from the middle layer of the corrosion product film. Similarly, there were small holes in the middle layer and the surface of corrosion product films for the N80 steel at 7, 10, and 10 MPa (Figure 8 and Figure 13). This was due to the falling off of Fe3C particles.
4.2. Formation Process of the Corrosion Product Film under Supercritical CO2 Conditions
As shown in Figure 14 and Figure 15, at 20 h, Fe and a small amount of Fe3C were detected on the surface of the corrosion products. This indicated that there was no FeCO3 on the steel surface, or the content was too low to be detected. At 66 h, Fe, Fe3C, and FeCO3 were detected on the surface of the corrosion products. This indicated that FeCO3 was deposited on the surface of the steel. The FeCO3 did not completely cover the surface of the steel, so the diffraction peak of Fe was found. At 114 h and 168 h, the surface of the J55 steel was completely covered by FeCO3, while the surface of the corrosion product film of the N80 steel was a mixture of Fe3C and FeCO3. Since Fe3C in the N80 steel is granular, it is easy for it to fall off from the metal matrix in the process of Fe dissolution, mix with the precipitated FeCO3, and cover the steel surface. On the contrary, Fe3C in the J55 steel is lamellar, which means it is not easy for it to fall off, and it is beneficial to fix the deposited FeCO3 so that the corrosion product film of FeCO3 can form quickly and cover the surface of the J55 steel.
Researchers have studied the film structure and formation process of the corrosion products of carbon steel [8,9,10,11,12]. The research focuses on the structure of corrosion product films and the formation mechanisms of each layer. Table 5 lists the specific contents of the study.
According to Figure 6 and Figure 8 (7, 10, and 15 MPa), the corrosion product film is divided into three layers: the middle layer is porous, the inner layer, and the outer layer are dense. Figure 16 and Figure 17 show the delamination morphology of the J55 and N80 steels at 15 MPa. As shown in Figure 16 and Figure 17, the middle layer of the J55 steel is composed of crystalline particles and amorphous corrosion products, and its structure is loose. Both the inner layer and the outer layer are composed of crystalline particles, which are dense. On the other hand, all three layers of the N80 steel are composed of crystalline particles, and holes and cracks are distributed in the middle layer. This is consistent with the morphology of Figure 6 and Figure 8.
A mechanism is proposed to explain the formation process of the corrosion product film for the J55 and N80 steels under supercritical CO2 conditions. The formation process of the corrosion product film is as follows: (1) Rapid corrosion stage.from 0 h to 20 h, ferrite in the matrix dissolves quickly, leaving Fe3C, and FeCO3 is hardly deposited on the matrix, which is covered with Fe3C residues [33]. Since no protective corrosion product film is formed, the corrosion rate is high. Zhang [14] found a similar phenomenon using EIS research. Under the conditions of supercritical CO2, before 7 h, the impedance spectrum was composed of an inductive reactance arc and a capacitive reactance arc. Inductive arcing is related to metal dissolution on carbon steel surfaces, and capacitive arcing is related to the formation of corrosion product films. This indicates that the initial stage of corrosion is accompanied by the dissolution of metal, and no protective corrosion product film is formed at this time. (2) Initial formation of FeCO3-corrosion product film. From 20 h to 66 h, with the continuous dissolution of ferrite, the concentration of Fe2+ near the surface of the substrate increases. When S > 1, FeCO3 will preferentially nucleate and grow on Fe3C. At this stage, the surface of the corrosion product film consists of residual Fe3C, FeCO3, and Fe (Figure 14 and Figure 15), and the corrosion rate drops rapidly. Under supercritical CO2 conditions, Zhang and Wei [14,15] found that in the middle and late corrosion periods, the impedance spectrum consisted of a capacitive arc, and the radius of the capacitive arc increased with time. This shows that the corrosion resistance of the corrosion product film increases with the increase in immersion time. The increase in the thickness and compactness of the corrosion product film is consistent with this conclusion (Figure 10 and Figure 11). (3) The total formation of the FeCO3-corrosion product film. From 66 h to 114 h, with the deposition of FeCO3, the compactness of the corrosion product film is improved, and the surface of the steel is completely covered by the corrosion product film, which inhibits the diffusion of Fe2+ from the substrate to the outer surface of the corrosion product film. However, anions can still pass through the FeCO3 corrosion product film. (4) The formation of outer and inner layers. When the immersion time exceeds 114 h, anions pass through the corrosion product film and react with the matrix to form FeCO3, then FeCO3 is directly attached to the matrix. Under this condition, the compactness of the FeCO3 film is higher than that of the FeCO3 film formed in the previous stage [34]. Meanwhile, a small amount of Fe2+ ions diffuse to the surface of the corrosion product film and react with C to generate FeCO3. With the formation of the dense inner layer, the ion exchange is inhibited, the corrosion rate decreases, and tends to be stable.
4.3. Influence of Microstructure on the Corrosion Behavior of Steels under Supercritical CO2 Conditions
In this paper, the corrosion resistance of J55 steel is higher than that of N80 steel, which is mainly due to the difference in fine structure. The microstructure of the J55 steel is ferrite and pearlite. The fine structure of pearlite consists of lamellar ferrite and lamellar Fe3C (Figure 18a). The microstructure of N80 is tempered sorbate (granular Fe3C is distributed on the matrix ferrite (Figure 19a). The difference between the two microstructures lies in the morphology of Fe3C.
The corrosion mechanism of the J55 steel is shown in Figure 18. In the CO2 corrosion process, ferrite preferentially dissolves, leaving the lamellar Fe3C (Figure 18b); with the increase in Fe2+ concentration between Fe3C flakes, FeCO3 preferentially nucleates on Fe3C flakes when S > 1. As lamellar Fe3C is beneficial for fixing FeCO3[35], FeCO3 gradually fills the gaps between Fe3C flakes; with the continuous deposition of FeCO3, FeCO3 grows rapidly along the gaps of Fe3C flakes, forming a corrosion product film to cover the surface of steel (Figure 18d); due to the directional growth of FeCO3 along the Fe3C flakes, FeCO3 sheets squeeze against each other, increasing the stress, which eventually leads to the fracture of FeCO3 sheets (Figure 12) [10,32]. This is the reason for the formation of the small holes in the middle layer and the cracks on the surface of the corrosion product films. Anions can easily pass through the holes generated by cracking (Figure 18e) and direct contact with the metal matrix, resulting in FeCO3 directly attaching to the metal matrix, forming a dense inner corrosion product film (Figure 18f) [34]. At the same time, Fe2+ will also diffuse to the surface of the corrosion product film through holes, generating FeCO3, which will be deposited in the middle layer to form an outer layer. With the formation of the dense inner layer, the corrosion rate decreases and tends to be stable. In the formation process of the corrosion product film, the porous middle layer is first formed, and then the inner layer and the outer layer are formed simultaneously. The inner and outer layers are dense, while the middle layer is porous.
The corrosion mechanism of the N80 steel is shown in Figure 19. Ferrite preferentially dissolves (Figure 19b), and the residual granular Fe3C is distributed on the matrix; the specific surface area of granular Fe3C is larger than that of lamellar Fe3C, so when the volume content of Fe3C is the same, the surface area of granular Fe3C is larger. A larger cathode surface area leads to a larger corrosion rate. The increase in the concentration of Fe2+ promotes the deposition of FeCO3. Fe2+ easily nucleates and grows in Fe3C (Figure 19c). With the deposition of FeCO3, FeCO3 gradually covers Fe3C and the metal matrix (Figure 19d). Granular Fe3C easily falls off from the metal matrix [34], resulting in the formation of holes (Figure 19e). Due to the porous corrosion structure near the holes, the diffusion of anions to the metal matrix and the outward diffusion of Fe2+ were not inhibited. The anions contact the metal matrix to form FeCO3, which is directly attached to the metal matrix and forms a dense inner layer. On the other hand, Fe2+ diffuses outward to form FeCO3 and FeCO3 deposits in the middle layer, forming an outer layer with FeCO3 and Fe3C. Since the granular Fe3C is easy to fall off, it will also lead to the formation of holes in the outer layer (Figure 13, Figure 19f, and Figure 20). In the formation process of the corrosion product films, the middle layer is formed first, and then the inner layer and the outer layer are formed simultaneously. The inner layer is dense, while the middle layer is porous. In other words, because of the different shapes and distributions of Fe3C, the outer and inner layers are dense for the J55 steel while the inner layer is dense for the N80 steel. This may be the reason why the corrosion resistance of the J55 steel is better than that of the N80 steel.
Cr, Mo, and Ni elements can improve the corrosion resistance of steel, but the content of these elements in this paper is very low, so the influence on corrosion resistance can be neglected. The carbon content of the J55 steel is higher than that of the N80 steel, so the Fe3C content of the J55 steel is higher than that of the N80 steel, which reduces the corrosion resistance of the J55 steel and improves the corrosion resistance of the N80 steel. On the other hand, because the Fe3C in the J55 steel is flaky, it can anchor Fe3C and promote the formation of dense corrosion product films, while the Fe3C in the N80 steel is granular, which is easy to fall off and form pits, which improves the corrosion resistance of the J55 steel and reduces the corrosion resistance of the N80 steel. From the experimental results, the corrosion rate of the J55 steel is generally lower than that of N80 steel, which indicates that the morphology of Fe3C plays a dominant role in corrosion resistance.
5. Conclusions
By studying the corrosion behaviors of J55 and N80 steels in simulated formation water of oil wells under different partial pressures, we have reached the following conclusions:
(1) With the rise in CO2 partial pressure, the corrosion rate of J55 and N80 steels increases continuously. At 10 MPa, the corrosion rate of N80 steel reaches its maximum value and then decreases.
(2) From 0.1 to 3 MPa, no crystalline particles were observed on the surface of J55 and N80 samples; at 5 MPa, the surface of the sample is covered with muddy corrosion products and crystalline particles; over 5 MPa, the surface of most samples is completely covered with crystalline particles, except for the N80 sample at 10 MPa.
(3) Under different partial pressures, the surface of the corrosion product of J55 steel consists of FeCO3, and the surface of the corrosion product for N80 steel consists of FeCO3 and a small amount of Fe3C.
(4) In the formation process of the corrosion product film, the middle layer is formed first, and then the inner layer and the outer layer are formed simultaneously. The outer and inner layers are dense for J55, while only the inner layer is dense for N80 steel.
(5) The continuous lamellar Fe3C is beneficial to the fixation of FeCO3 and the formation of a dense corrosion product film, which improves the corrosion resistance of J55 steel. The granular Fe3C in N80 steel has a larger cathode surface area and is easy to fall off, resulting in damage to the corrosion product film. Therefore, the corrosion resistance of J55 steel is better than that of N80 steel under experimental conditions.
There are some things that can be improved in this paper. Due to the limitations of the equipment, no high-pressure electrochemical tests were carried out. High-pressure electrochemical technology can reflect the formation process of the corrosion product film of carbon steel under supercritical CO2 corrosion in real-time, and it is an important means for revealing the corrosion mechanism of carbon steel under high CO2 partial pressure. However, due to the difficulty of manufacturing and maintaining high-pressure electrochemical electrodes, there is little research in this area at present, which requires researchers to conduct in-depth research. In addition, the influence of microstructure on the corrosion behavior of carbon steel can be studied with the help of scanning Kelvin probe force microscopy, which may reveal the relationship between them in more detail and more accurately.
Author Contributions
Conceptualization, S.C., Y.F. and X.Z.; methodology, S.C. and C.Y.; software, S.C.; validation, A.F., S.C. and X.Z.; formal analysis, A.F., D.L. and S.C.; investigation, X.Z.; resources, A.F. and D.L.; data curation, S.C.; writing—original draft preparation, S.C.; writing—review and editing, A.F., D.L., C.Y., Y.F. and S.C.; visualization, X.Z.; supervision, Y.F.; project administration, A.F., D.L. and C.Y.; funding acquisition, A.F. and D.L. All authors have read and agreed to the published version of the manuscript.
Funding
Basic Research and Strategic Reserve Technology Research of PetroChina Company Limited (Beijing, China) (No. 2018Z–03), Scientific Research and Technology Development Project of PetroChina Company Limited (No. 2017F–19), Special Support Program for High Level Talents of Shaanxi Province (No. 00439), and Scientific Research and Technology Development Project of Petrochina (No. 2021ZZ01–04).
Institutional Review Board Statement
Not applicable.
Informed Consent Statement
Not applicable.
Data Availability Statement
Not applicable.
Conflicts of Interest
The authors declare no conflict of interest.
References
- Yang, Q.; Zhou, H.; Bartocci, P.; Fantozzi, F.; Mašek, O.; Agblevor, F.A.; Wei, Z.; Yang, H.; Chen, H.; Lu, X.; et al. Prospective contributions of biomass pyrolysis to China’s 2050 carbon reduction and renewable energy goals. Nat. Commun. 2021, 12, 1698. [Google Scholar] [CrossRef] [PubMed]
- Wilberforce, T.; Olabi, A.; Sayed, E.T.; Elsaid, K.; Abdelkareem, M.A. Progress in carbon capture technologies. Sci. Total Environ. 2021, 761, 143203. [Google Scholar] [CrossRef] [PubMed]
- Friedlingstein, P.; O’sullivan, M.; Jones, M.W.; Andrew, R.M.; Hauck, J.; Olsen, A.; Peters, G.P.; Peters, W.; Pongratz, J.; Sitch, S.; et al. Global Carbon Budget 2020. Earth Syst. Sci. Data 2020, 12, 3269–3340. [Google Scholar] [CrossRef]
- Cheng, J.; Zhu, W.; Jiang, H. Study on mathematical models for multi-phase porous flow in CO2 drive of extra-low permeability reservoir and field application. Acta Pet. Sin. 2008, 29, 246–251. [Google Scholar]
- Wu, X. Discussion on the influence of CO2 on oil well production. Pet. Geol. Eng. 2008, 22, 97–100. [Google Scholar]
- Wang, Y.; Zhao, Z. Experimental research on the effect of pressure on CO2 oil displacement efficiency. Spec. Oil Gas Reserv. 2017, 24, 132–135. [Google Scholar]
- Li, X. Experimental study on the effect of temperature and injection pressure on CO2 flooding. Pet. Geol. Recovery Effic. 2015, 22, 84–87. [Google Scholar]
- Zhang, G.; Lu, M.; Wu, Y. Formation mechanism of corrosion scales of carbon steel by CO2 corrosion under high temperature and high pressure. J. Univ. Sci. Technol. 2005, 23, 537–548. [Google Scholar]
- Wei, L.; Pang, X.L.; Gao, K.W. Corrosion mechanism discussion of X65 steel in NaCl solution saturated with supercritical CO2. Acta Metall. Sin. 2015, 51, 701–712. [Google Scholar]
- Chen, C.; Zhao, G.; Lu, M. Study of CO2 corrosion scales on N80 steel. J. Chin. Soc. Corros. Prot. 2002, 22, 143–146. [Google Scholar]
- Li, T.; Gao, K.; Lu, M. Formation mechanism of CO2 corrosion product scale on X65 steel. J. Chin. Soc. Corros. Prot. 2007, 38, 411–416. [Google Scholar]
- Zhang, Y.; Pang, X.; Qu, S.; Li, X.; Gao, K. Discussion of the CO2 corrosion mechanism between low partial pressure and supercritical condition. Corros. Sci. 2012, 59, 186–197. [Google Scholar] [CrossRef]
- Wang, S.H.; George, K.; Nesic, S. High Pressure CO2 Corrosion Electrochemistry and the Effect of Acetic Acid, Corrosion/2004; Paper No. 375; NACE International: Houston, TX, USA, 2004. [Google Scholar]
- Zhang, G.; Liu, D.; Li, Y.; Guo, X. Corrosion behaviour of N80 carbon steel in formation water under dynamic supercritical CO2 condition. Corros. Sci. 2017, 120, 107–120. [Google Scholar] [CrossRef]
- Wei, L.; Pang, X.; Liu, C.; Gao, K. Formation mechanism and protective property of corrosion product scale on X70 steel under supercritical CO2 environment. Corros. Sci. 2015, 100, 404–420. [Google Scholar] [CrossRef]
- Fuseini, M.; Zaghloul, M.M.; Elkady, M.F.; El-Shazly, A.H. Evaluation of synthesized polyaniline nanofibresas corrosion protection film coating on coppersubstrate by electrophoretic deposition. J. Mater. Sci. 2022, 57, 6085–6101. [Google Scholar] [CrossRef]
- Zhang, Y.C.; Pang, X.L.; Qu, S.P.; Li, X.; Gao, K.W. The relationship between fracture toughness of CO2 corrosion scale and corrosion rate of X65 pipelinesteel under supercritical CO2 condition. Int. J. Greenh. Gas Control 2011, 5, 1643–1650. [Google Scholar] [CrossRef]
- Gao, K.; Yu, F.; Pang, X.; Zhang, G.; Qiao, L.; Chu, W.; Lu, M. Mechanical properties of CO2 corrosion product scales and their relationship to corrosionrates. Corros. Sci. 2008, 50, 2796–2803. [Google Scholar] [CrossRef]
- Yu, F.; Gao, K.; Su, Y.; Li, J.; Qiao, L.; Chu, W.; Lu, M. The fracture toughness of CO2 corrosion scale in pipeline steel. Mater. Lett. 2005, 59, 1709–1713. [Google Scholar] [CrossRef]
- Lopez, D.A.; Simison, S.N.; De Sanchez, S.R. The influence of steel microstructure on CO2 corrosion. EIS studies on the inhibition efficiency of benzimidazole. Electrochim. Acta 2003, 48, 845–854. [Google Scholar] [CrossRef]
- Ko, M.; Ingham, B.; Laycock, N.; Williams, D. In situ synchrotron X-ray diffraction study of the effect of microstructure and boundary layer conditions on CO2 corrosion of pipeline steels. Corros. Sci. 2015, 90, 192–201. [Google Scholar] [CrossRef]
- Zhang, H.-H.; Pang, X.; Gao, K. Localized CO2 corrosion of carbon steel with different microstructures in brine solutions with an imidazoline-based inhibitor. Appl. Surf. Sci. 2018, 442, 446–460. [Google Scholar] [CrossRef]
- Cui, Z.; Wu, S.; Zhu, S.; Yang, X. Study on corrosion properties of pipelines in simulated produced water saturated with supercritical CO2. Appl. Surf. Sci. 2006, 252, 2368–2374. [Google Scholar] [CrossRef]
- Cui, Z.; Wu, S.; Li, C.; Zhu, S.; Yang, X. Corrosion behavior of oil tube steels under conditions of multiphase flow saturated with super-critical carbon dioxide. Mater. Lett. 2004, 58, 1035–1040. [Google Scholar] [CrossRef]
- Hua, Y.; Barker, R.; Neville, A. Effect of temperature on the critical water content for general and localized corrosion of X65 carbon steel in the transport of supercritical CO2. Int. J. Greenh. Gas Control 2014, 31, 48–60. [Google Scholar] [CrossRef]
- Choi, Y.; Nesic, S. Effect of Water Content on the Corrosion Behavior of Carbon Steel in Supercritical CO2 Phase with Impurities, Corrosion/2011; Paper No. 377; NACE International: Houston, TX, USA, 2011. [Google Scholar]
- Lin, Y.; Deng, K.; Ning, H. CO2 solubility test in formation water and prediction model. J. China Univ. Pet. Ed. Nat. Sci. 2021, 45, 117–126. [Google Scholar]
- Zhang, Y.; Gao, K.; Schmitt, G. Effect of water on steel corrosion under supercritical CO2 conditions. Mater. Perform. 2011, 50, 62–68. [Google Scholar]
- Wei, L.; Gao, K.; Li, Q. Corrosion of low alloy steel containing 0.5% chromium in supercritical CO2-saturated brine and water-saturated supercritical CO2 environments. Appl. Surf. Sci. 2018, 440, 524–534. [Google Scholar] [CrossRef]
- Dugstad, A. Fundamental Aspects of CO2 Metal Loss Corrosion-Part 1: Mechanism, Corrosion/2006; Paper No. 06111; NACE International: Houston, TX, USA, 2006. [Google Scholar]
- Dugstad, A. Mechanism of Protective Film Formation during CO2 Corrosion of Carbon Steel, Corrosion/98; Paper No. 31; NACE International: Houston, TX, USA, 1998. [Google Scholar]
- Chen, C.F.; Lu, M.X.; Zhao, G.X.; Bai, Z.Q. Mechanical properties of CO2 corrosion scale on N80 well tube steel. Acta Metall. Sin. 2003, 39, 175–181. [Google Scholar]
- Sun, W.; Nesic, S. Basics Revisited: Kinetics of Iron Carbonate Scale Precipitation in CO2 Corrosion, Corrosion/2006; Paper No. 365; NACE International: Houston, TX, USA, 2006. [Google Scholar]
- Crolet, J.L.; Thevenot, N.; Nesic, S. Role of Conductive Corrosion Products in the Protectiveness of Corrosion Layers. Corrosion 1998, 54, 194–203. [Google Scholar] [CrossRef]
- Dugstad, A.; Hemmer, H.; Seiersten, M. Effect of Steel Microstructure on Corrosion Rate and Protective Iron Carbonate Film Formation. Corrosion 2001, 57, 369–378. [Google Scholar] [CrossRef]
Figure 1.
Microstructures of J55 and N80 steels: P (pearlite); F (ferrite).
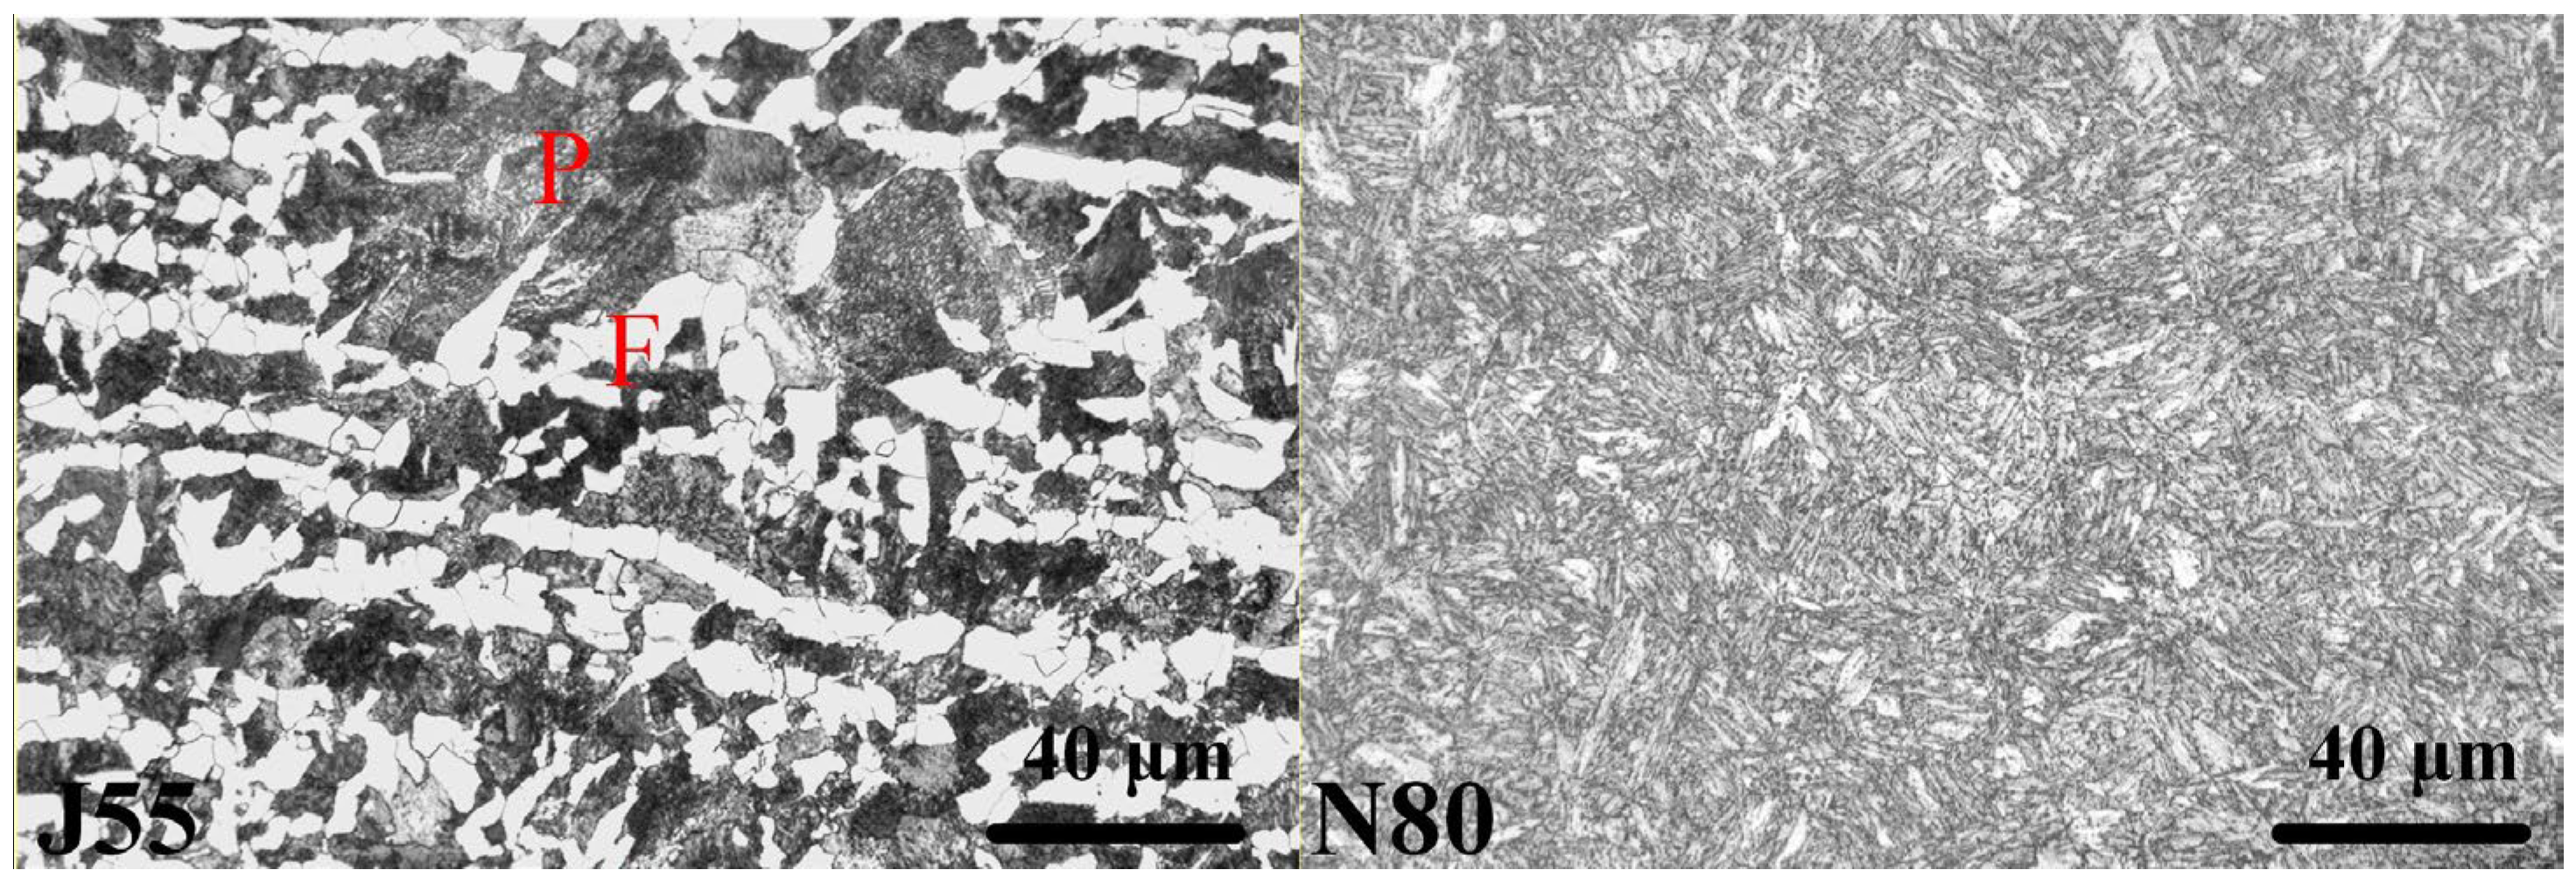
Figure 2.
Corrosion rates of J55 and N80 steels under different CO2 pressures.

Figure 3.
States of CO2.
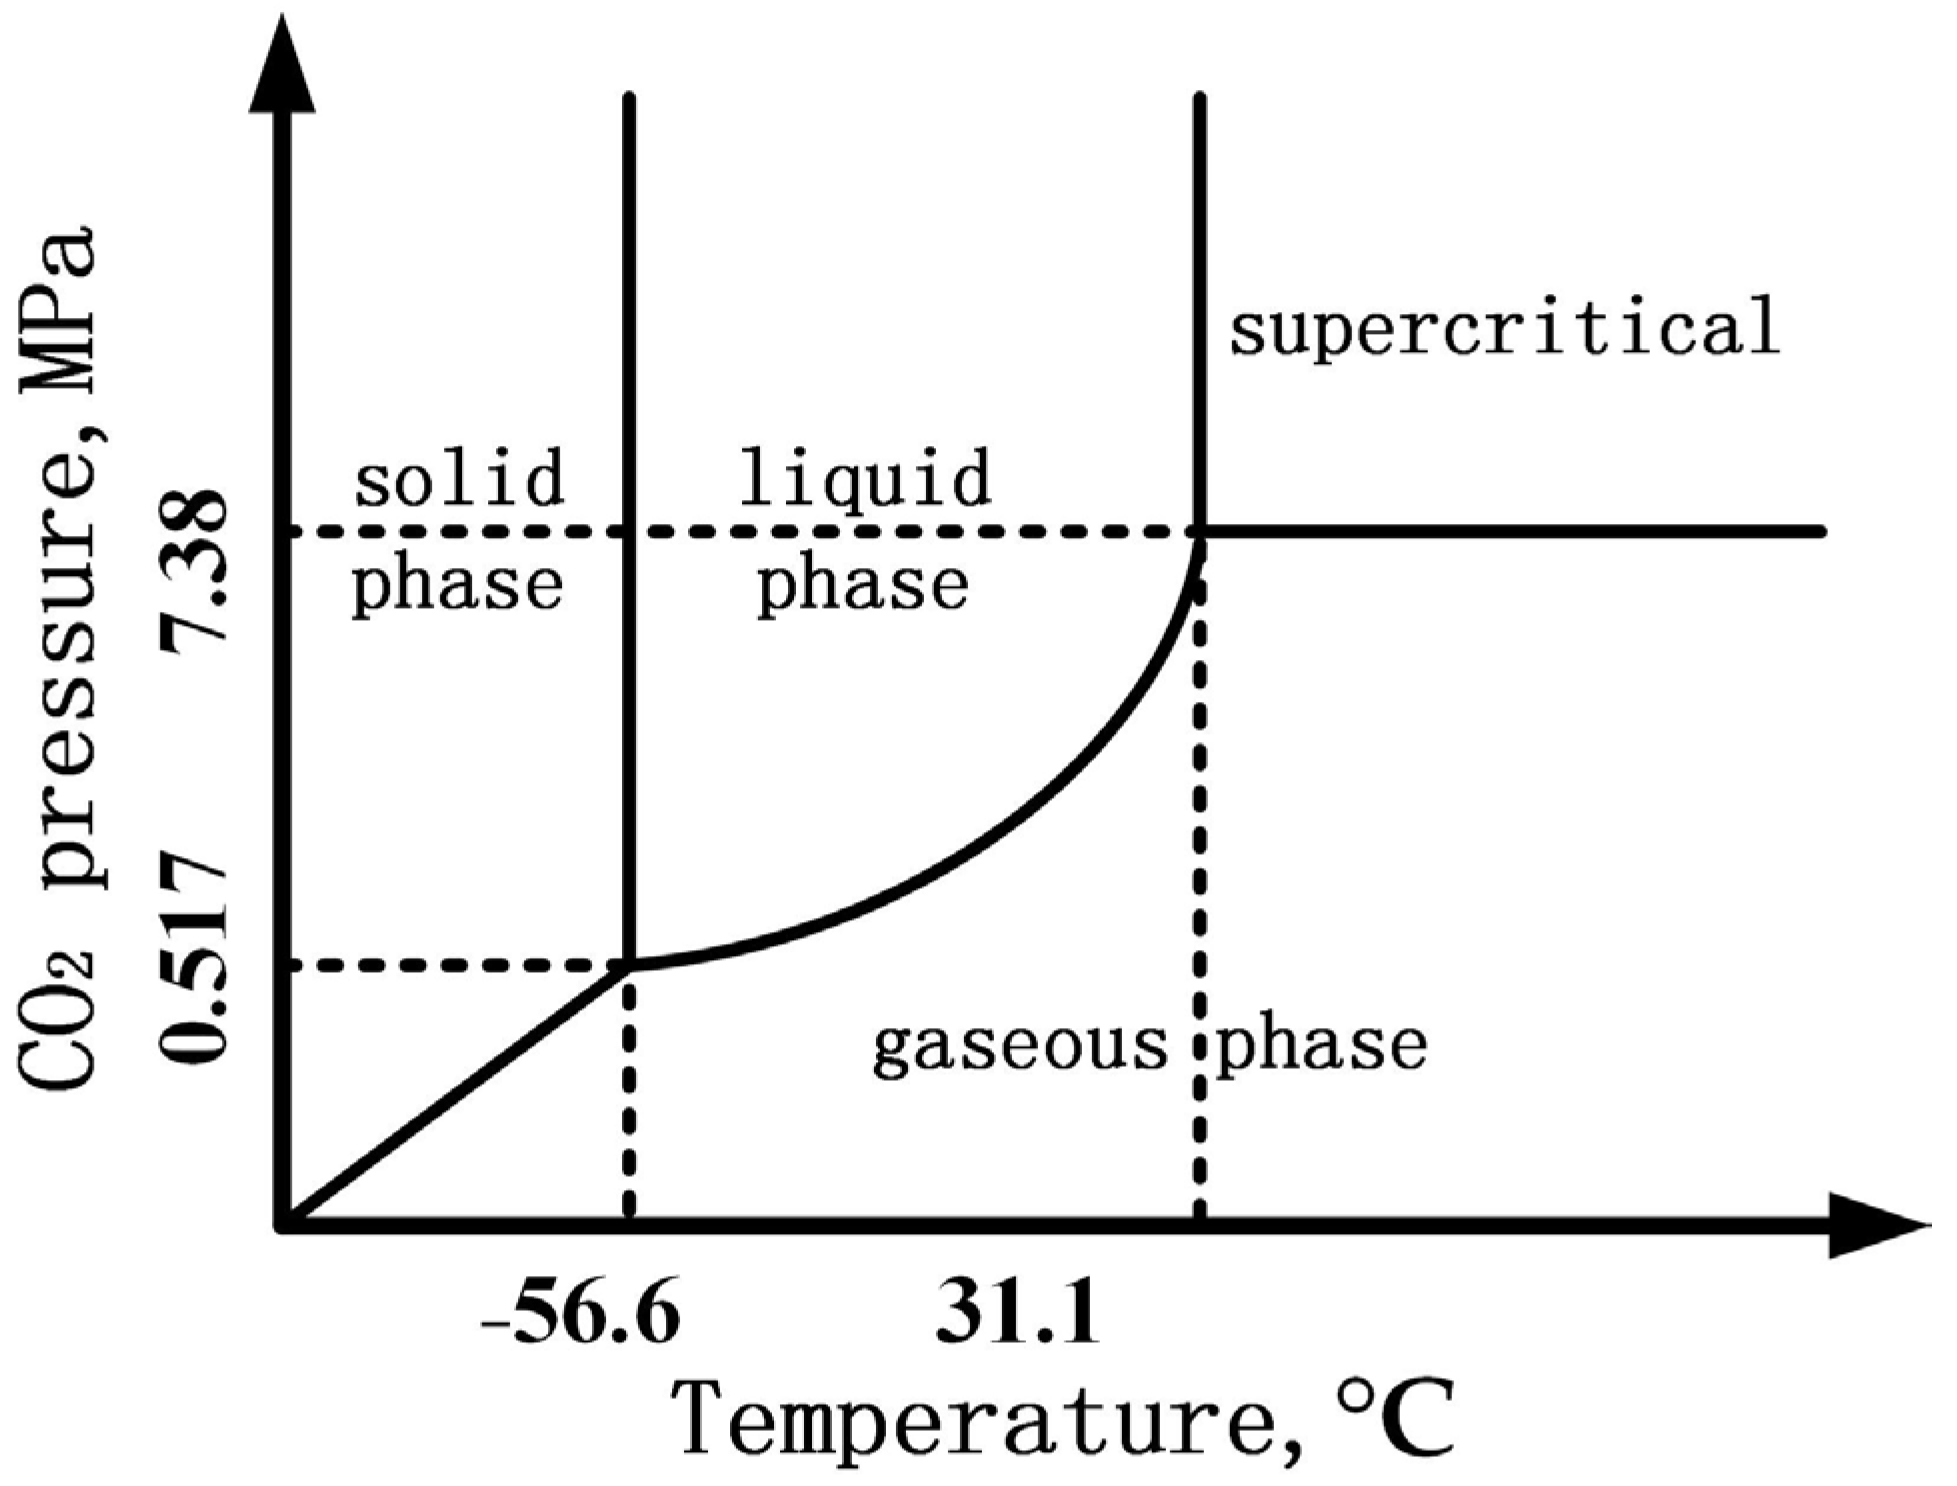
Figure 4.
XRD spectra of corrosion product films under different CO2 pressures.
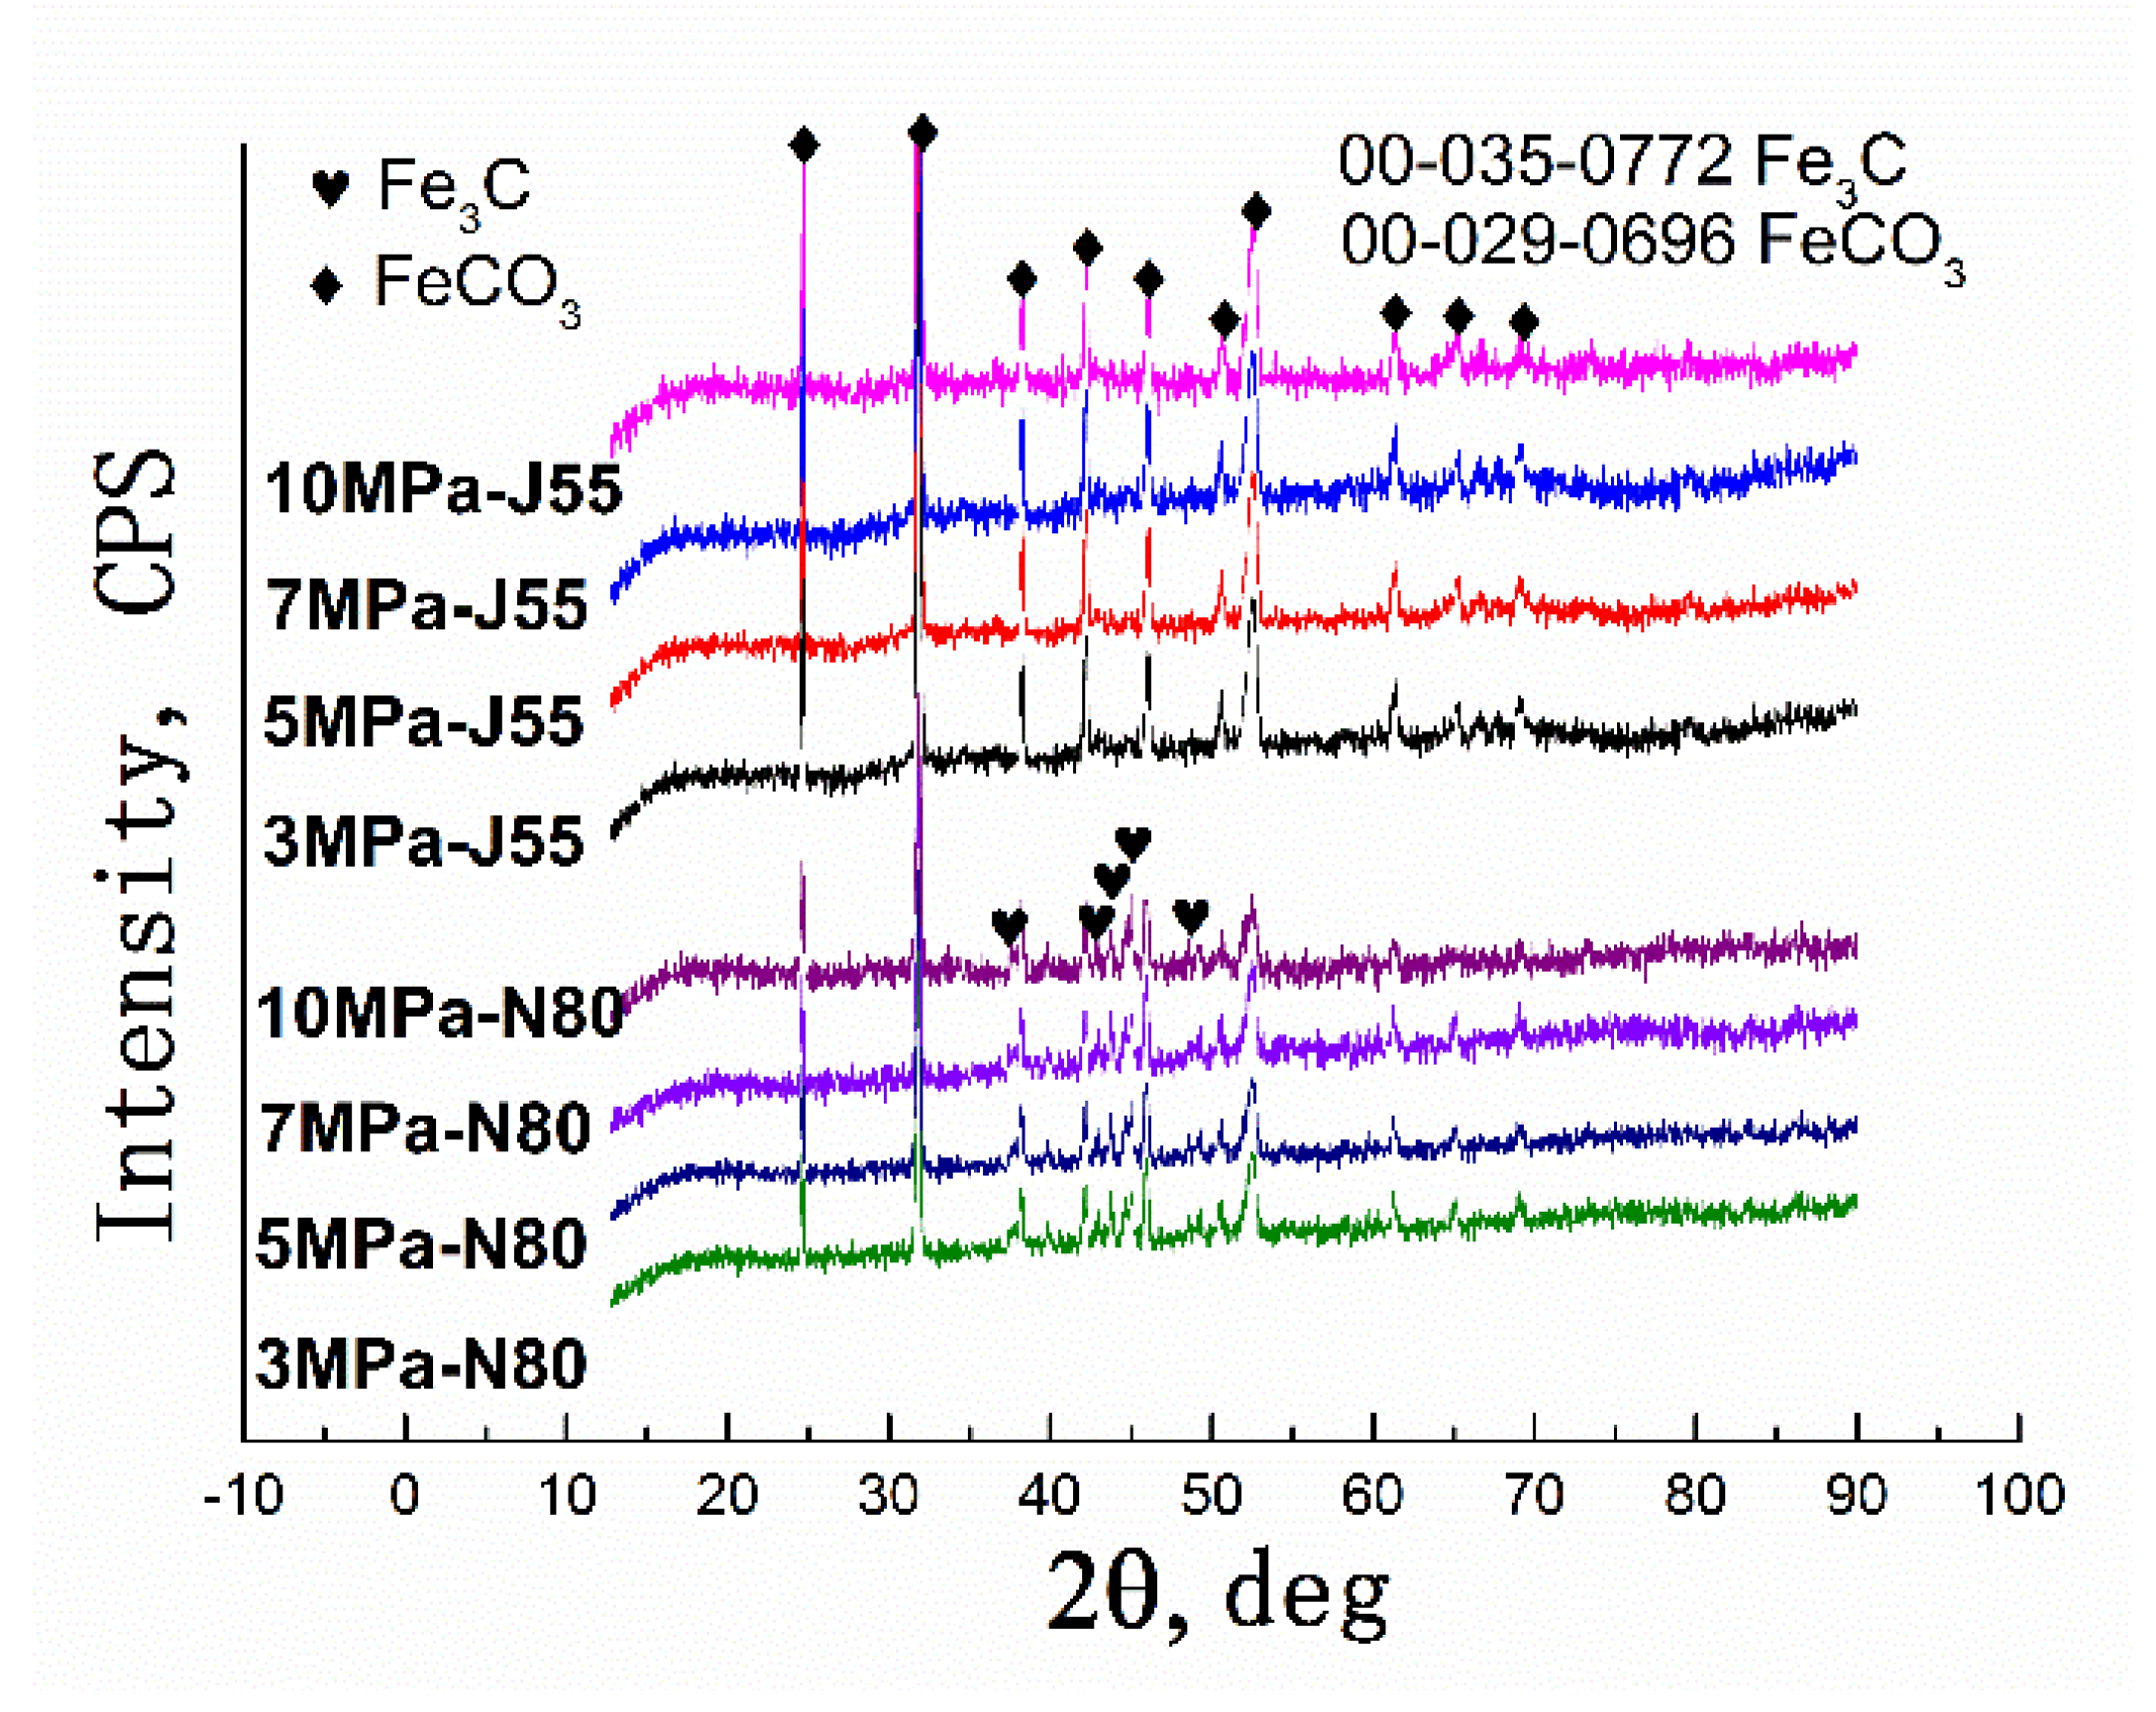
Figure 5.
Surface morphologies of J55 steel at various CO2 partial pressures (200×).

Figure 6.
Cross-section morphologies of J55 steel at various CO2 partial pressures: 0.1, 3 MPa, 1000×; 5, 7, 10, 15 MPa, 500×; O (the outer layer); M (the middle layer); I (the inner layer).
Figure 6.
Cross-section morphologies of J55 steel at various CO2 partial pressures: 0.1, 3 MPa, 1000×; 5, 7, 10, 15 MPa, 500×; O (the outer layer); M (the middle layer); I (the inner layer).

Figure 7.
Surface morphologies of N80 steel at various CO2 partial pressures (200×).

Figure 8.
Cross-section morphologies of N80 steel at various CO2 partial pressures (1000×): O (the outer layer); M (the middle layer); I (the inner layer).
Figure 8.
Cross-section morphologies of N80 steel at various CO2 partial pressures (1000×): O (the outer layer); M (the middle layer); I (the inner layer).
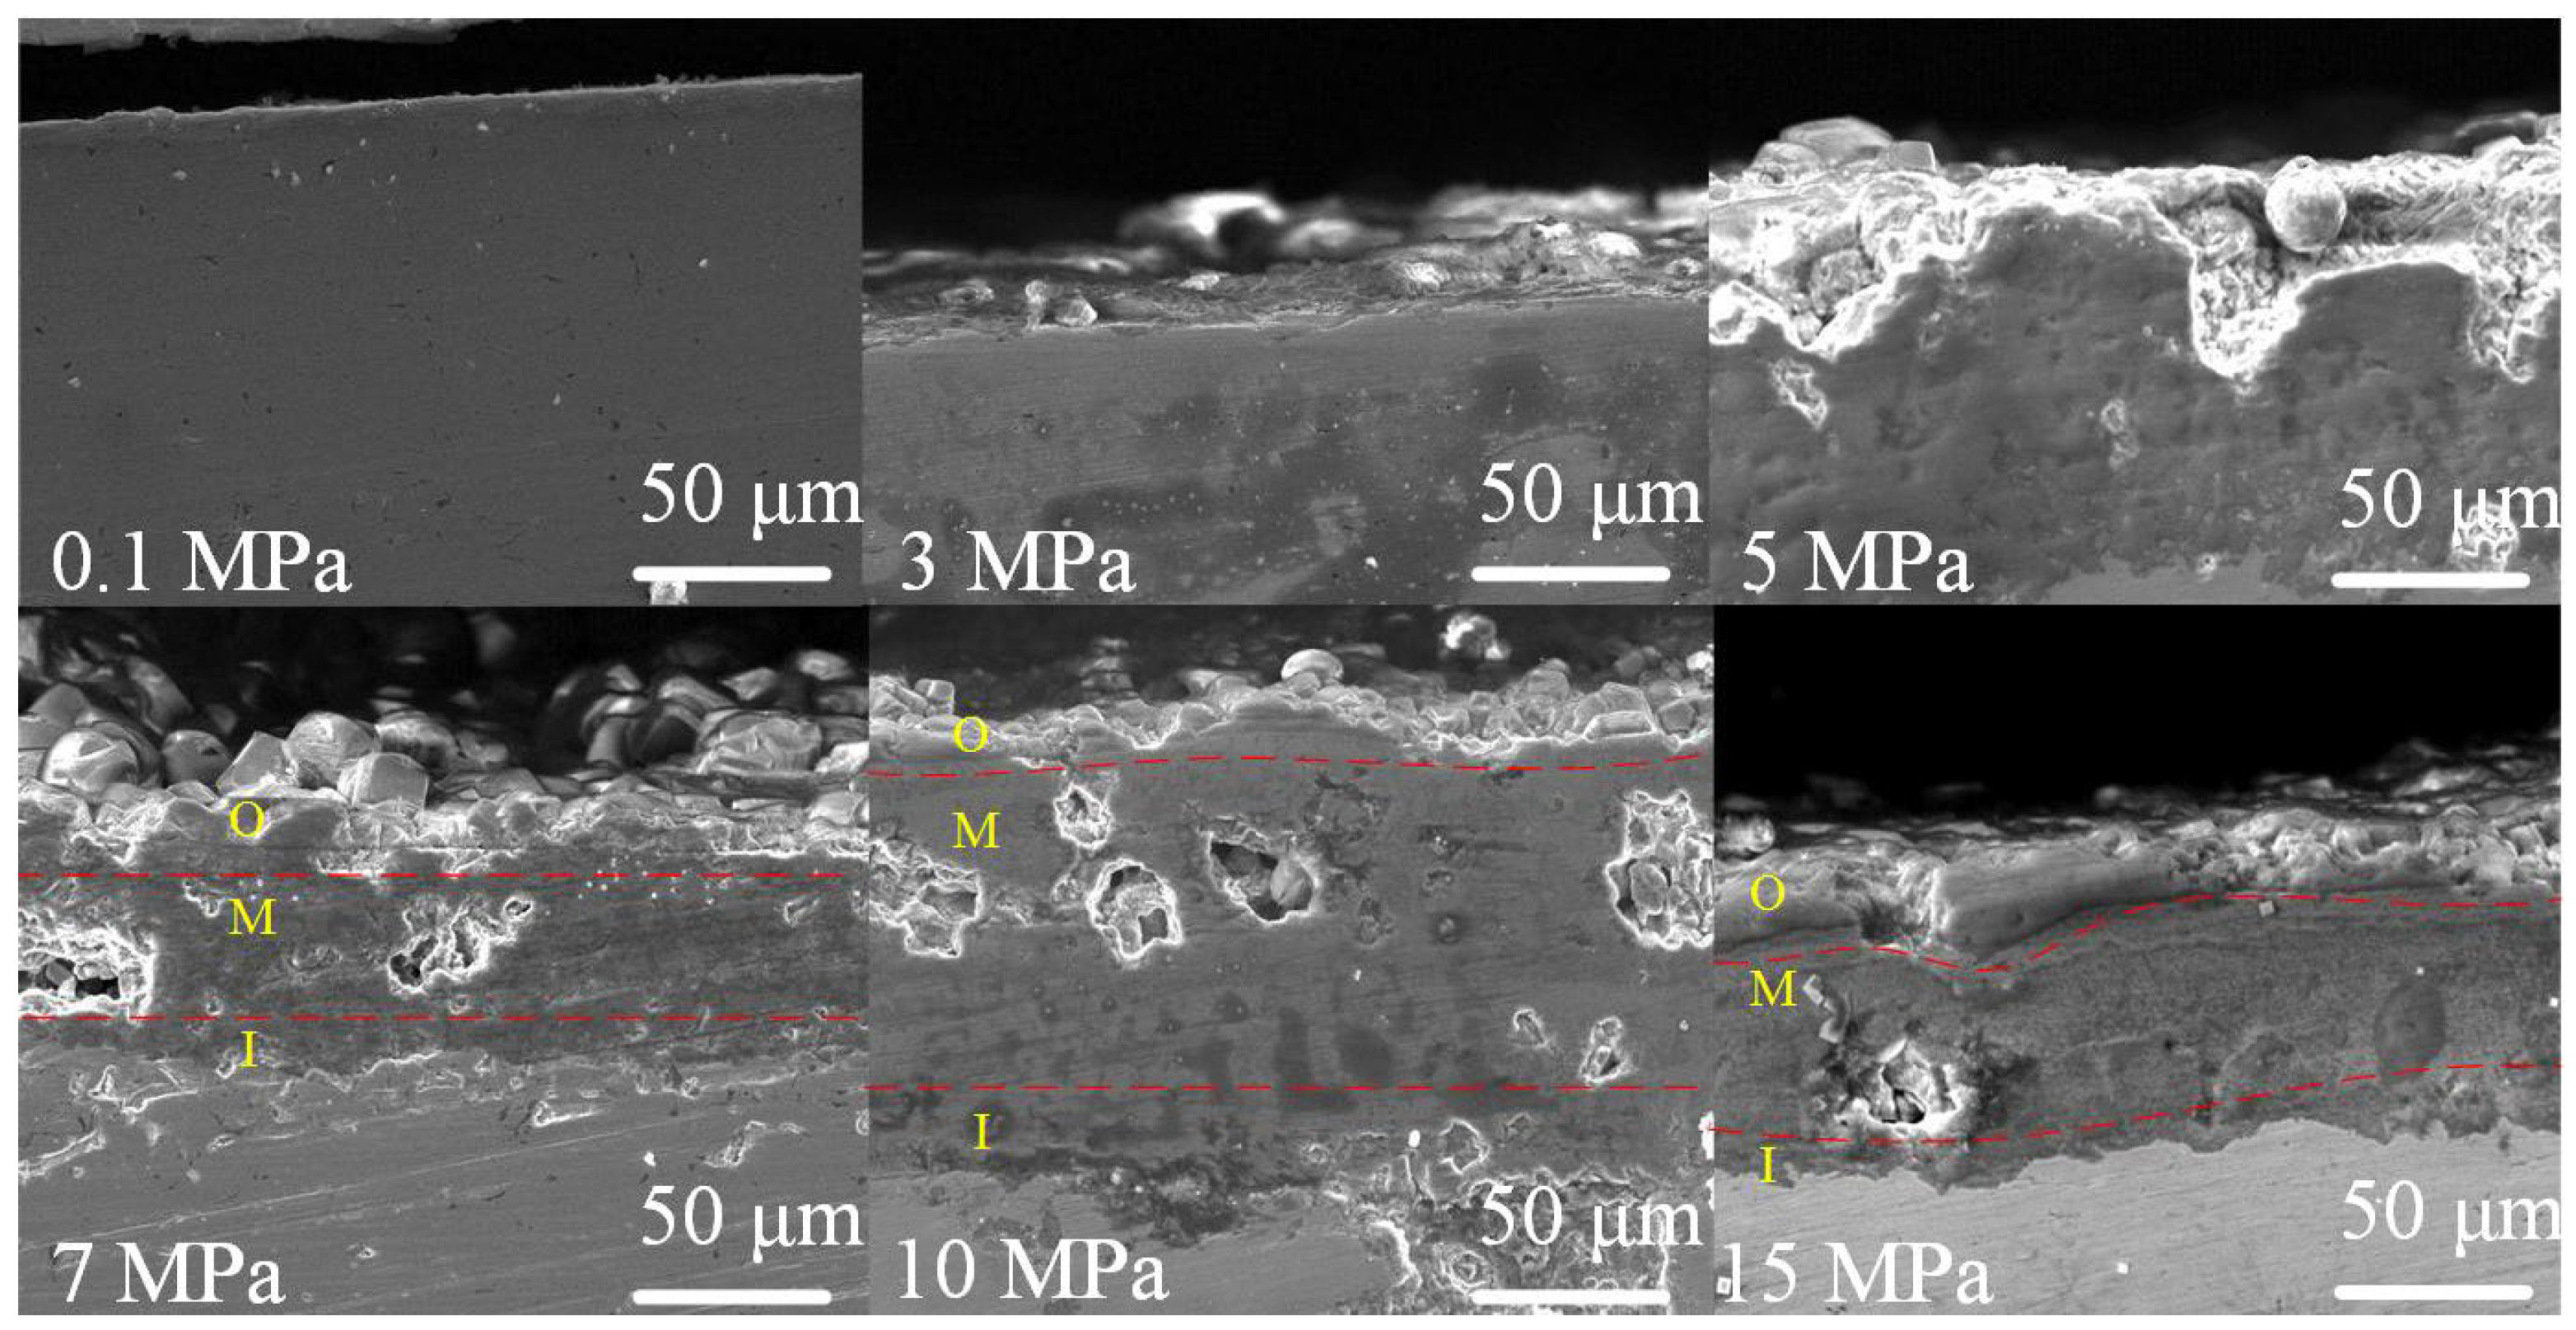
Figure 9.
Corrosion rates of J55 and N80 steels at different immersion times.
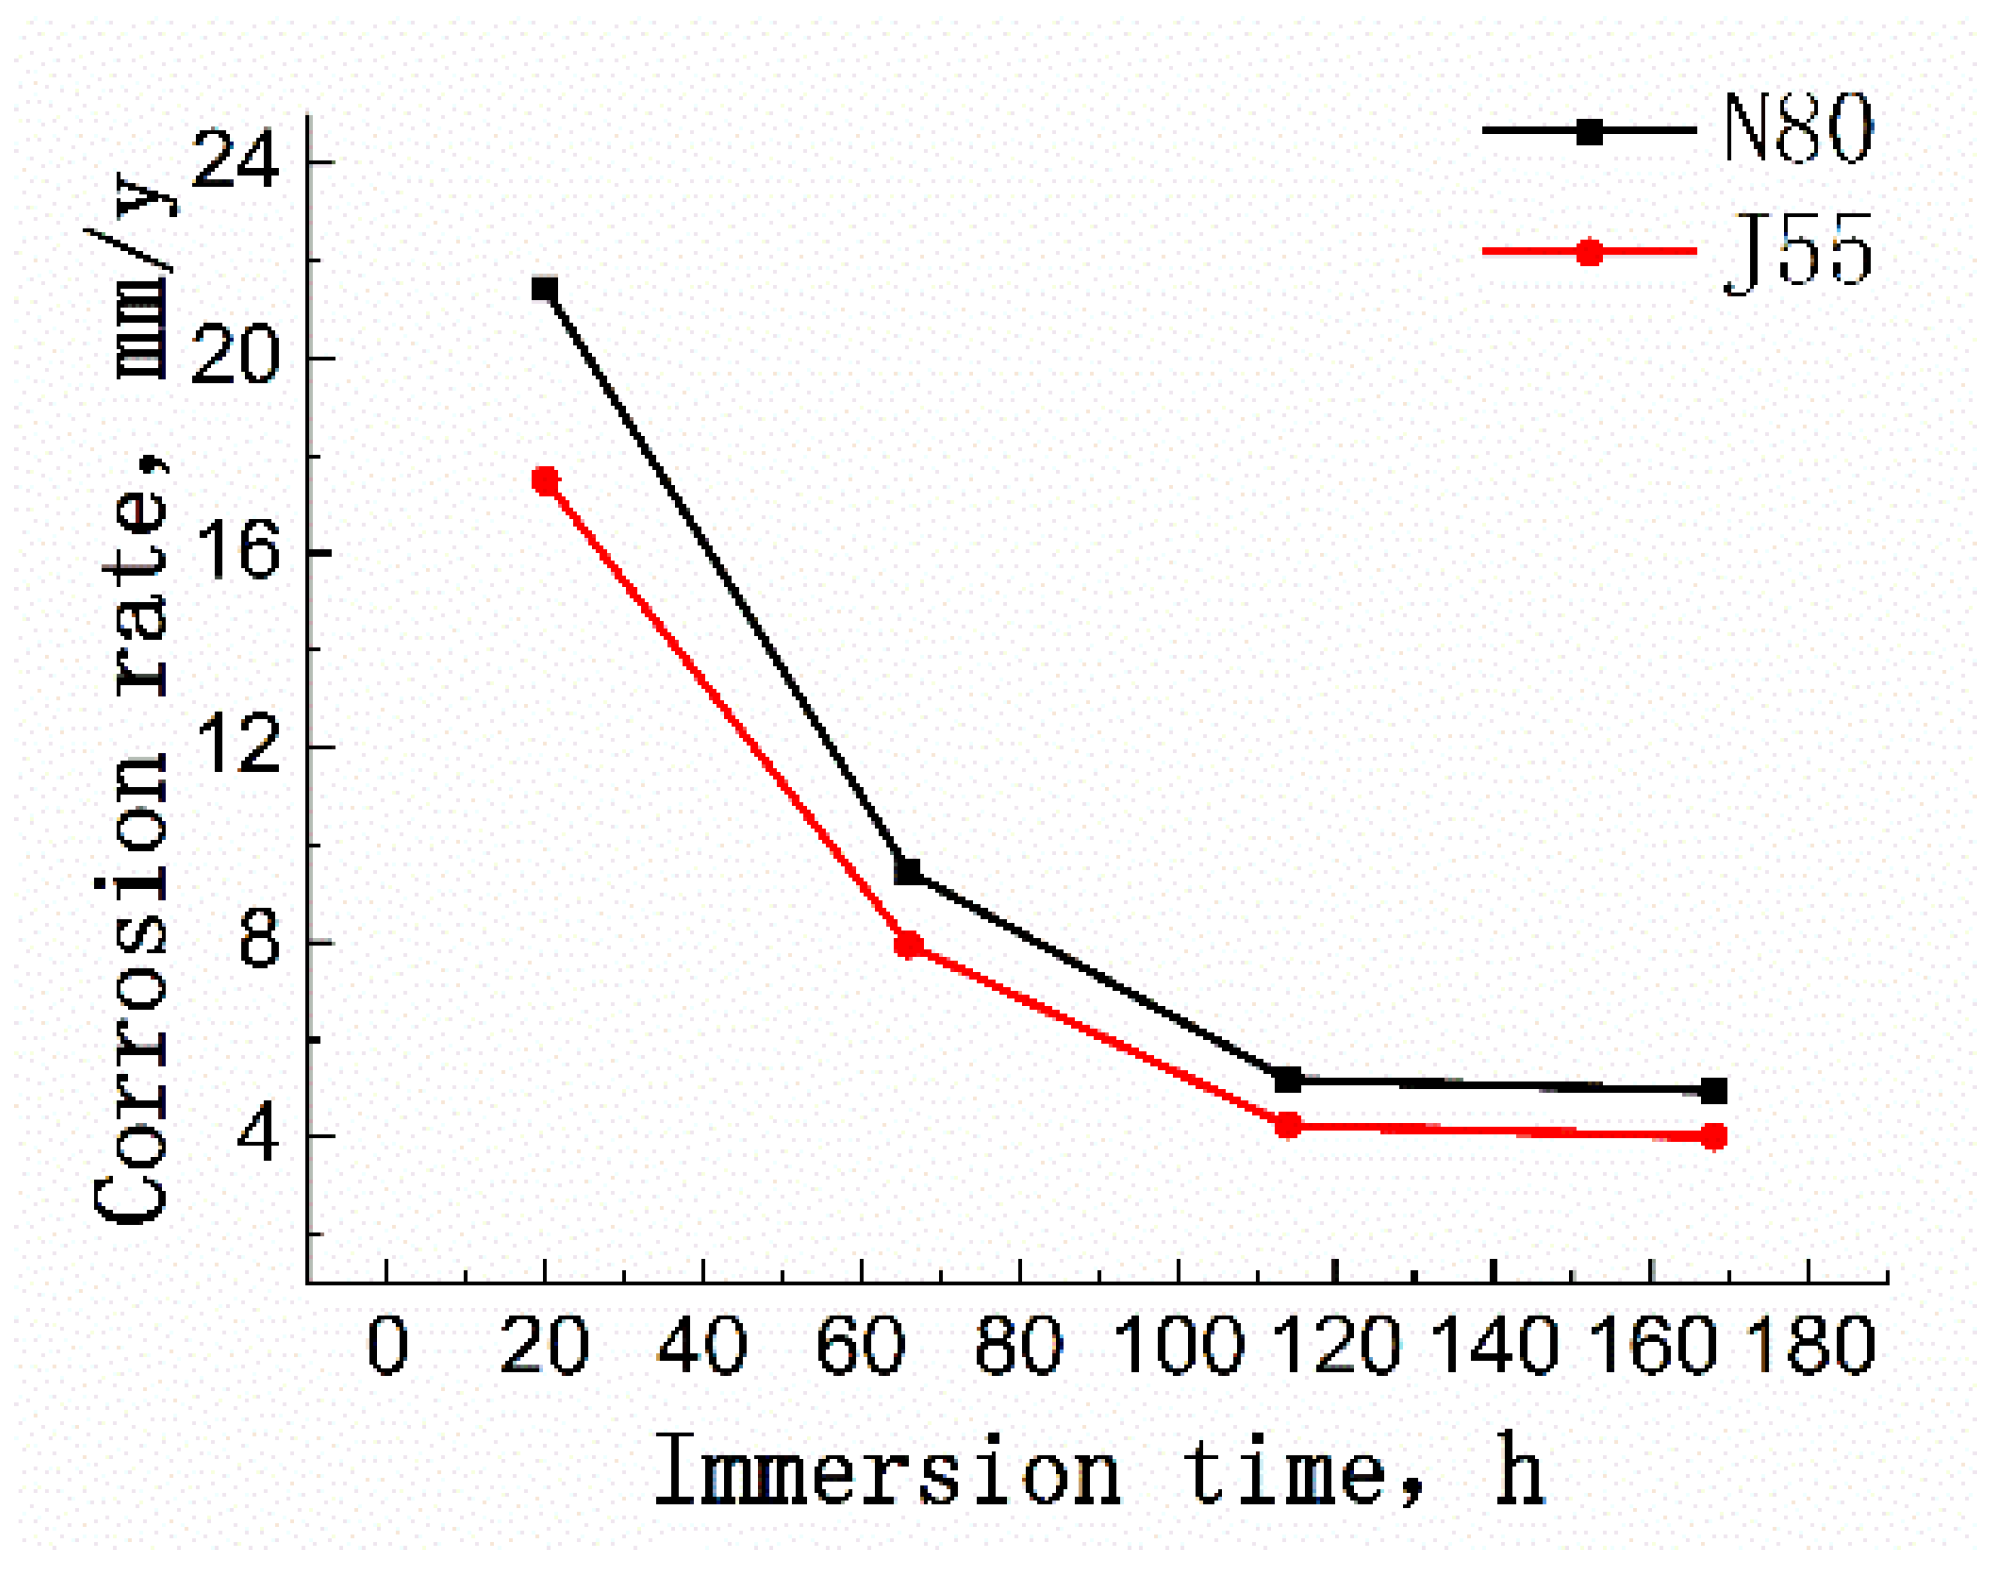
Figure 10.
Surface and cross-section morphologies of J55 steel at different immersion times: surface morphologies, 1000×; cross-section morphologies 20 h and 66 h, 3000×; cross-section morphologies 114 h, 500× and 168 h, 1000×.
Figure 10.
Surface and cross-section morphologies of J55 steel at different immersion times: surface morphologies, 1000×; cross-section morphologies 20 h and 66 h, 3000×; cross-section morphologies 114 h, 500× and 168 h, 1000×.

Figure 11.
Surface and cross-section morphologies of N80 steel at different immersion times: surface morphologies, 1000×; cross-section morphologies 20 h and 66 h, 3000×; cross-section morphologies 114 h, 1000×; cross-section morphologies 168 h, 500×.
Figure 11.
Surface and cross-section morphologies of N80 steel at different immersion times: surface morphologies, 1000×; cross-section morphologies 20 h and 66 h, 3000×; cross-section morphologies 114 h, 1000×; cross-section morphologies 168 h, 500×.
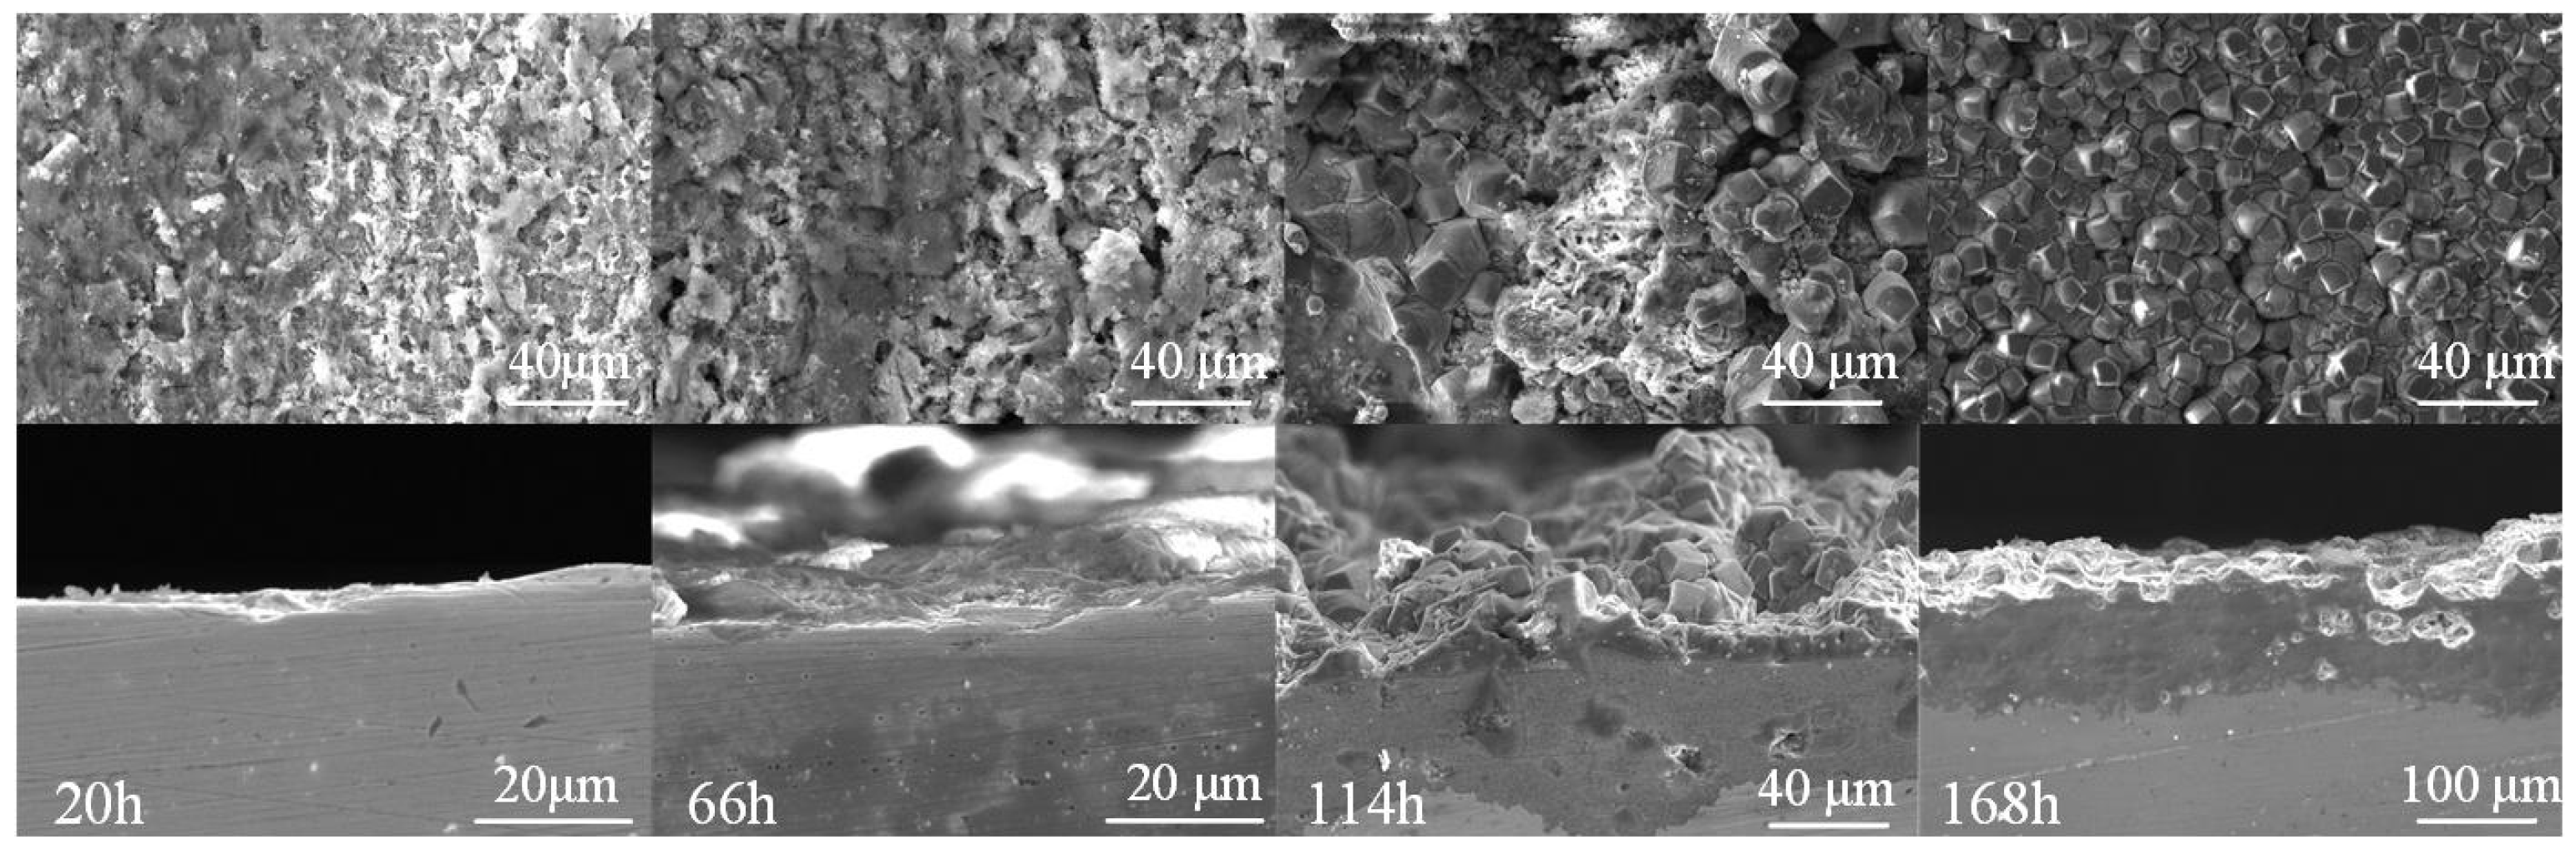
Figure 12.
Surface morphologies of J55 steel at various CO2 partial pressures (1000×).
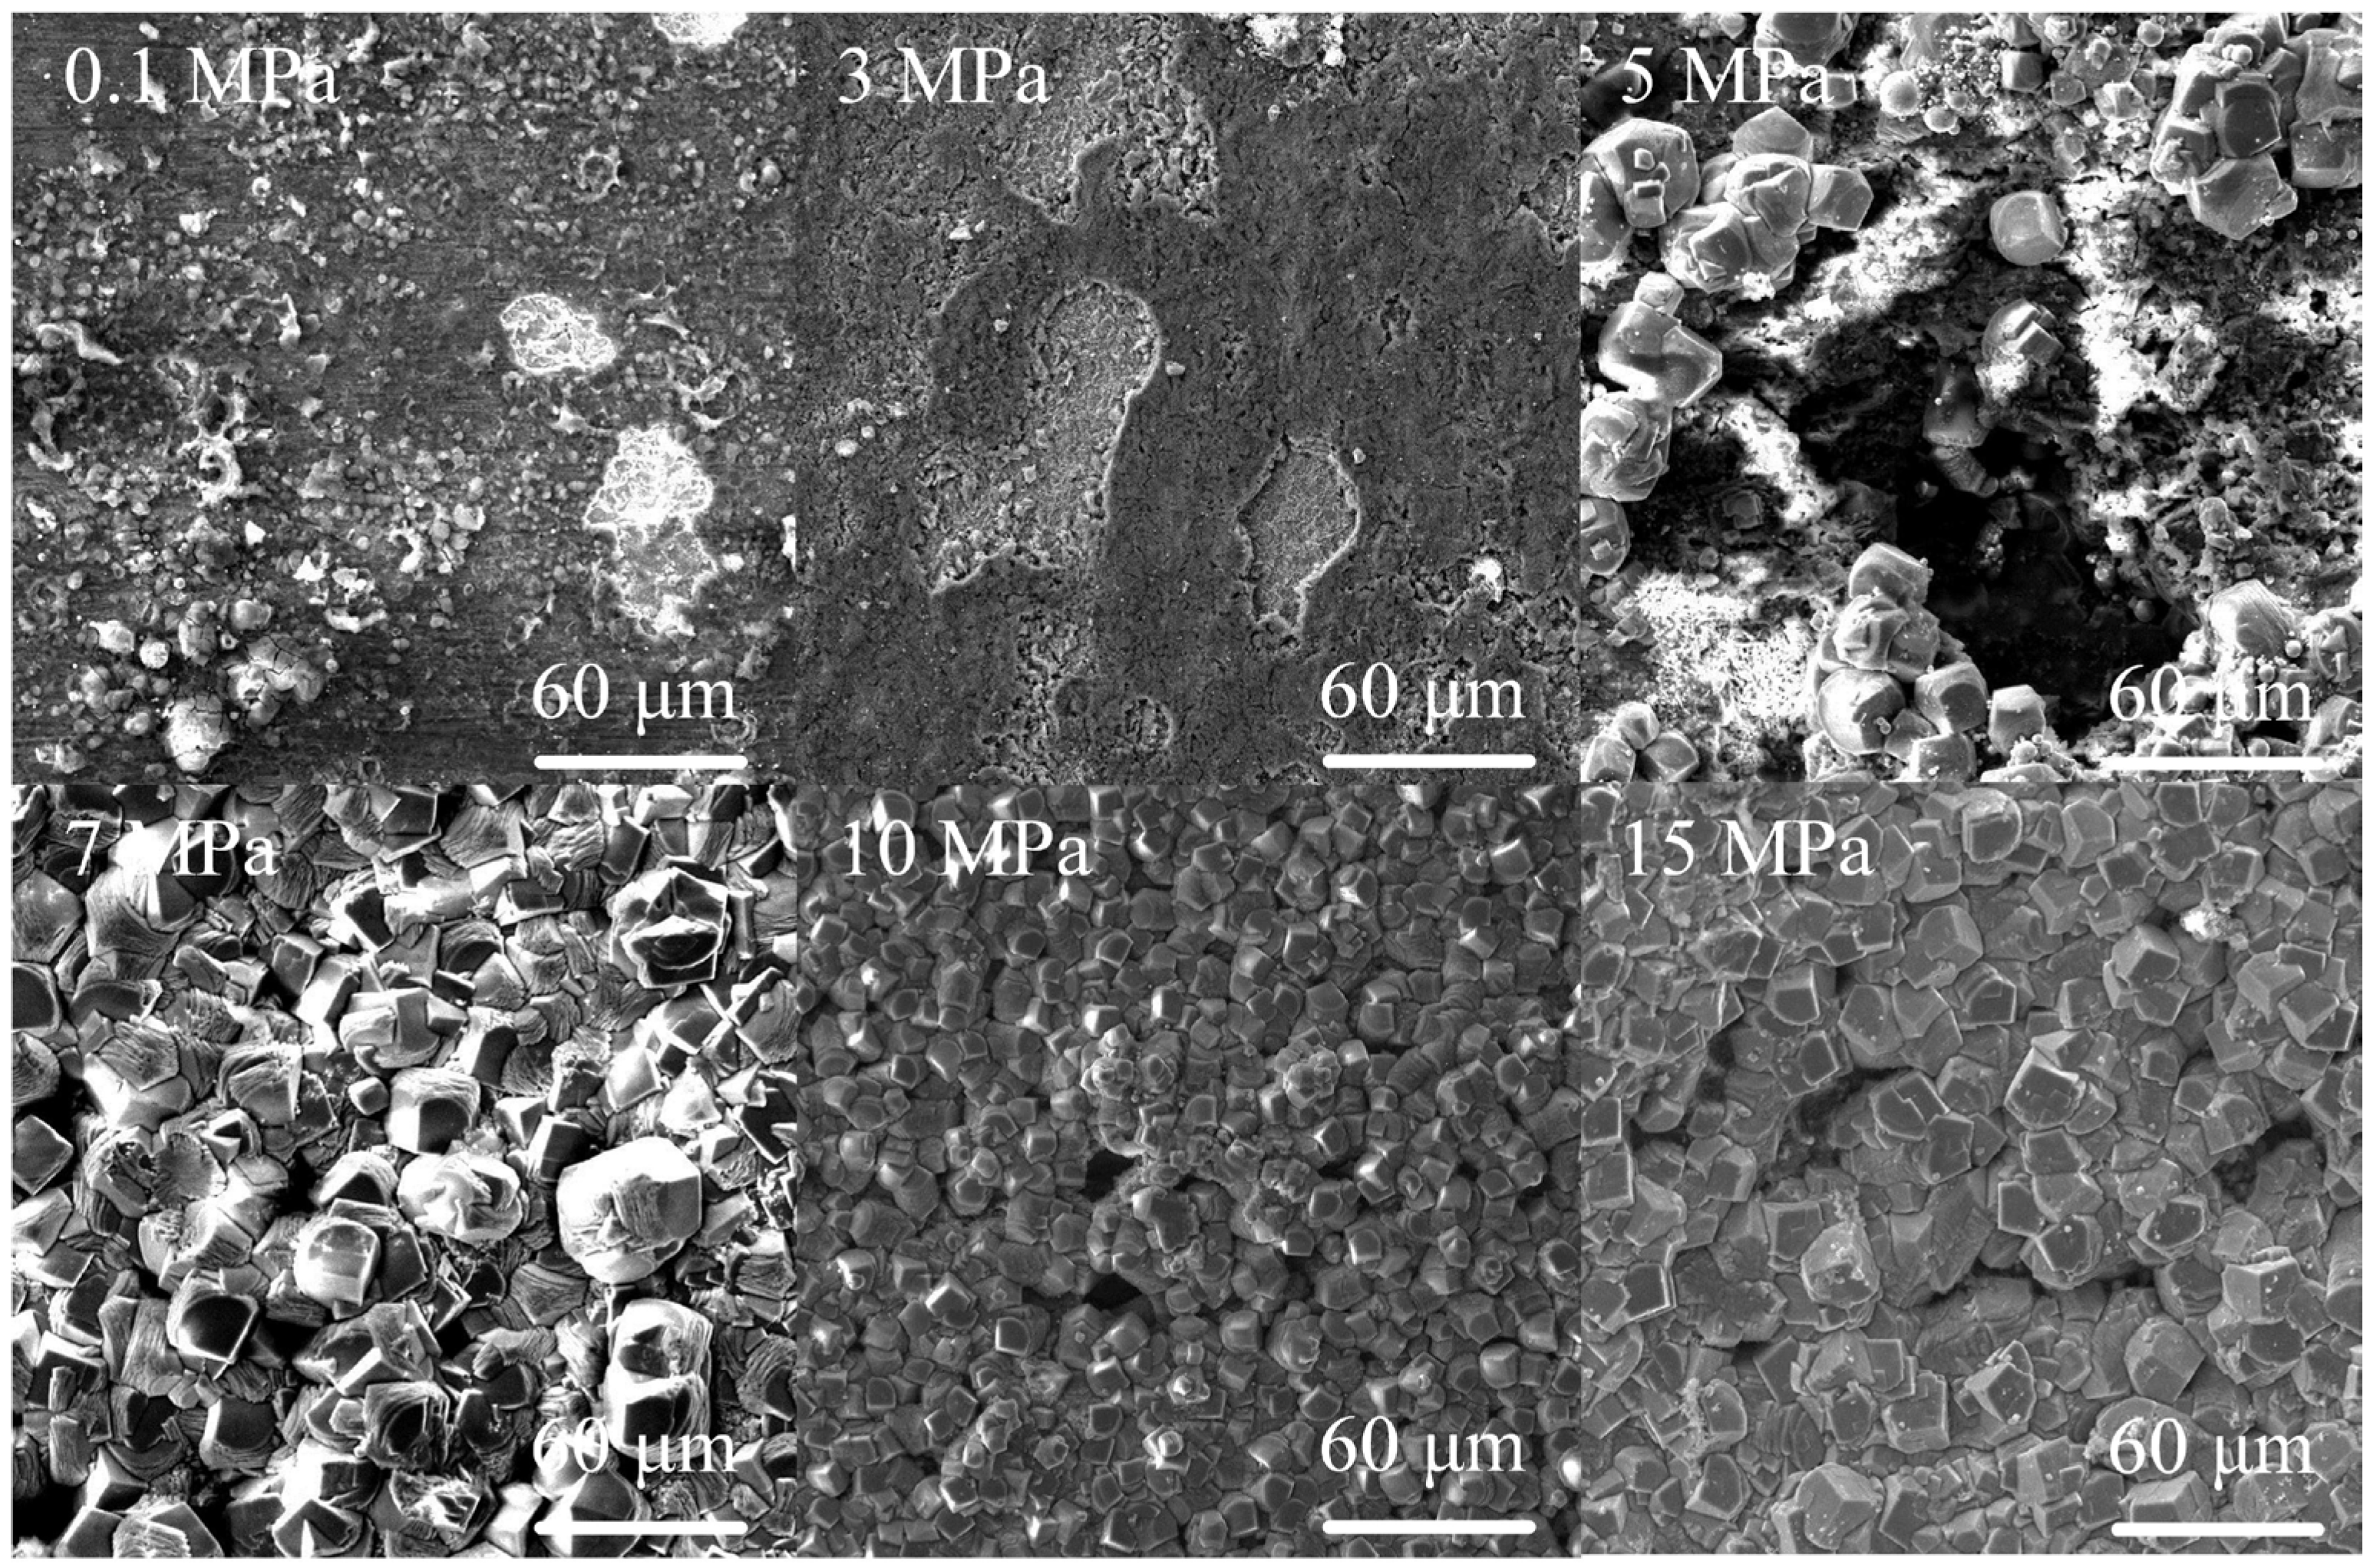
Figure 13.
Surface morphologies of N80 steel at various CO2 partial pressures (1000×).
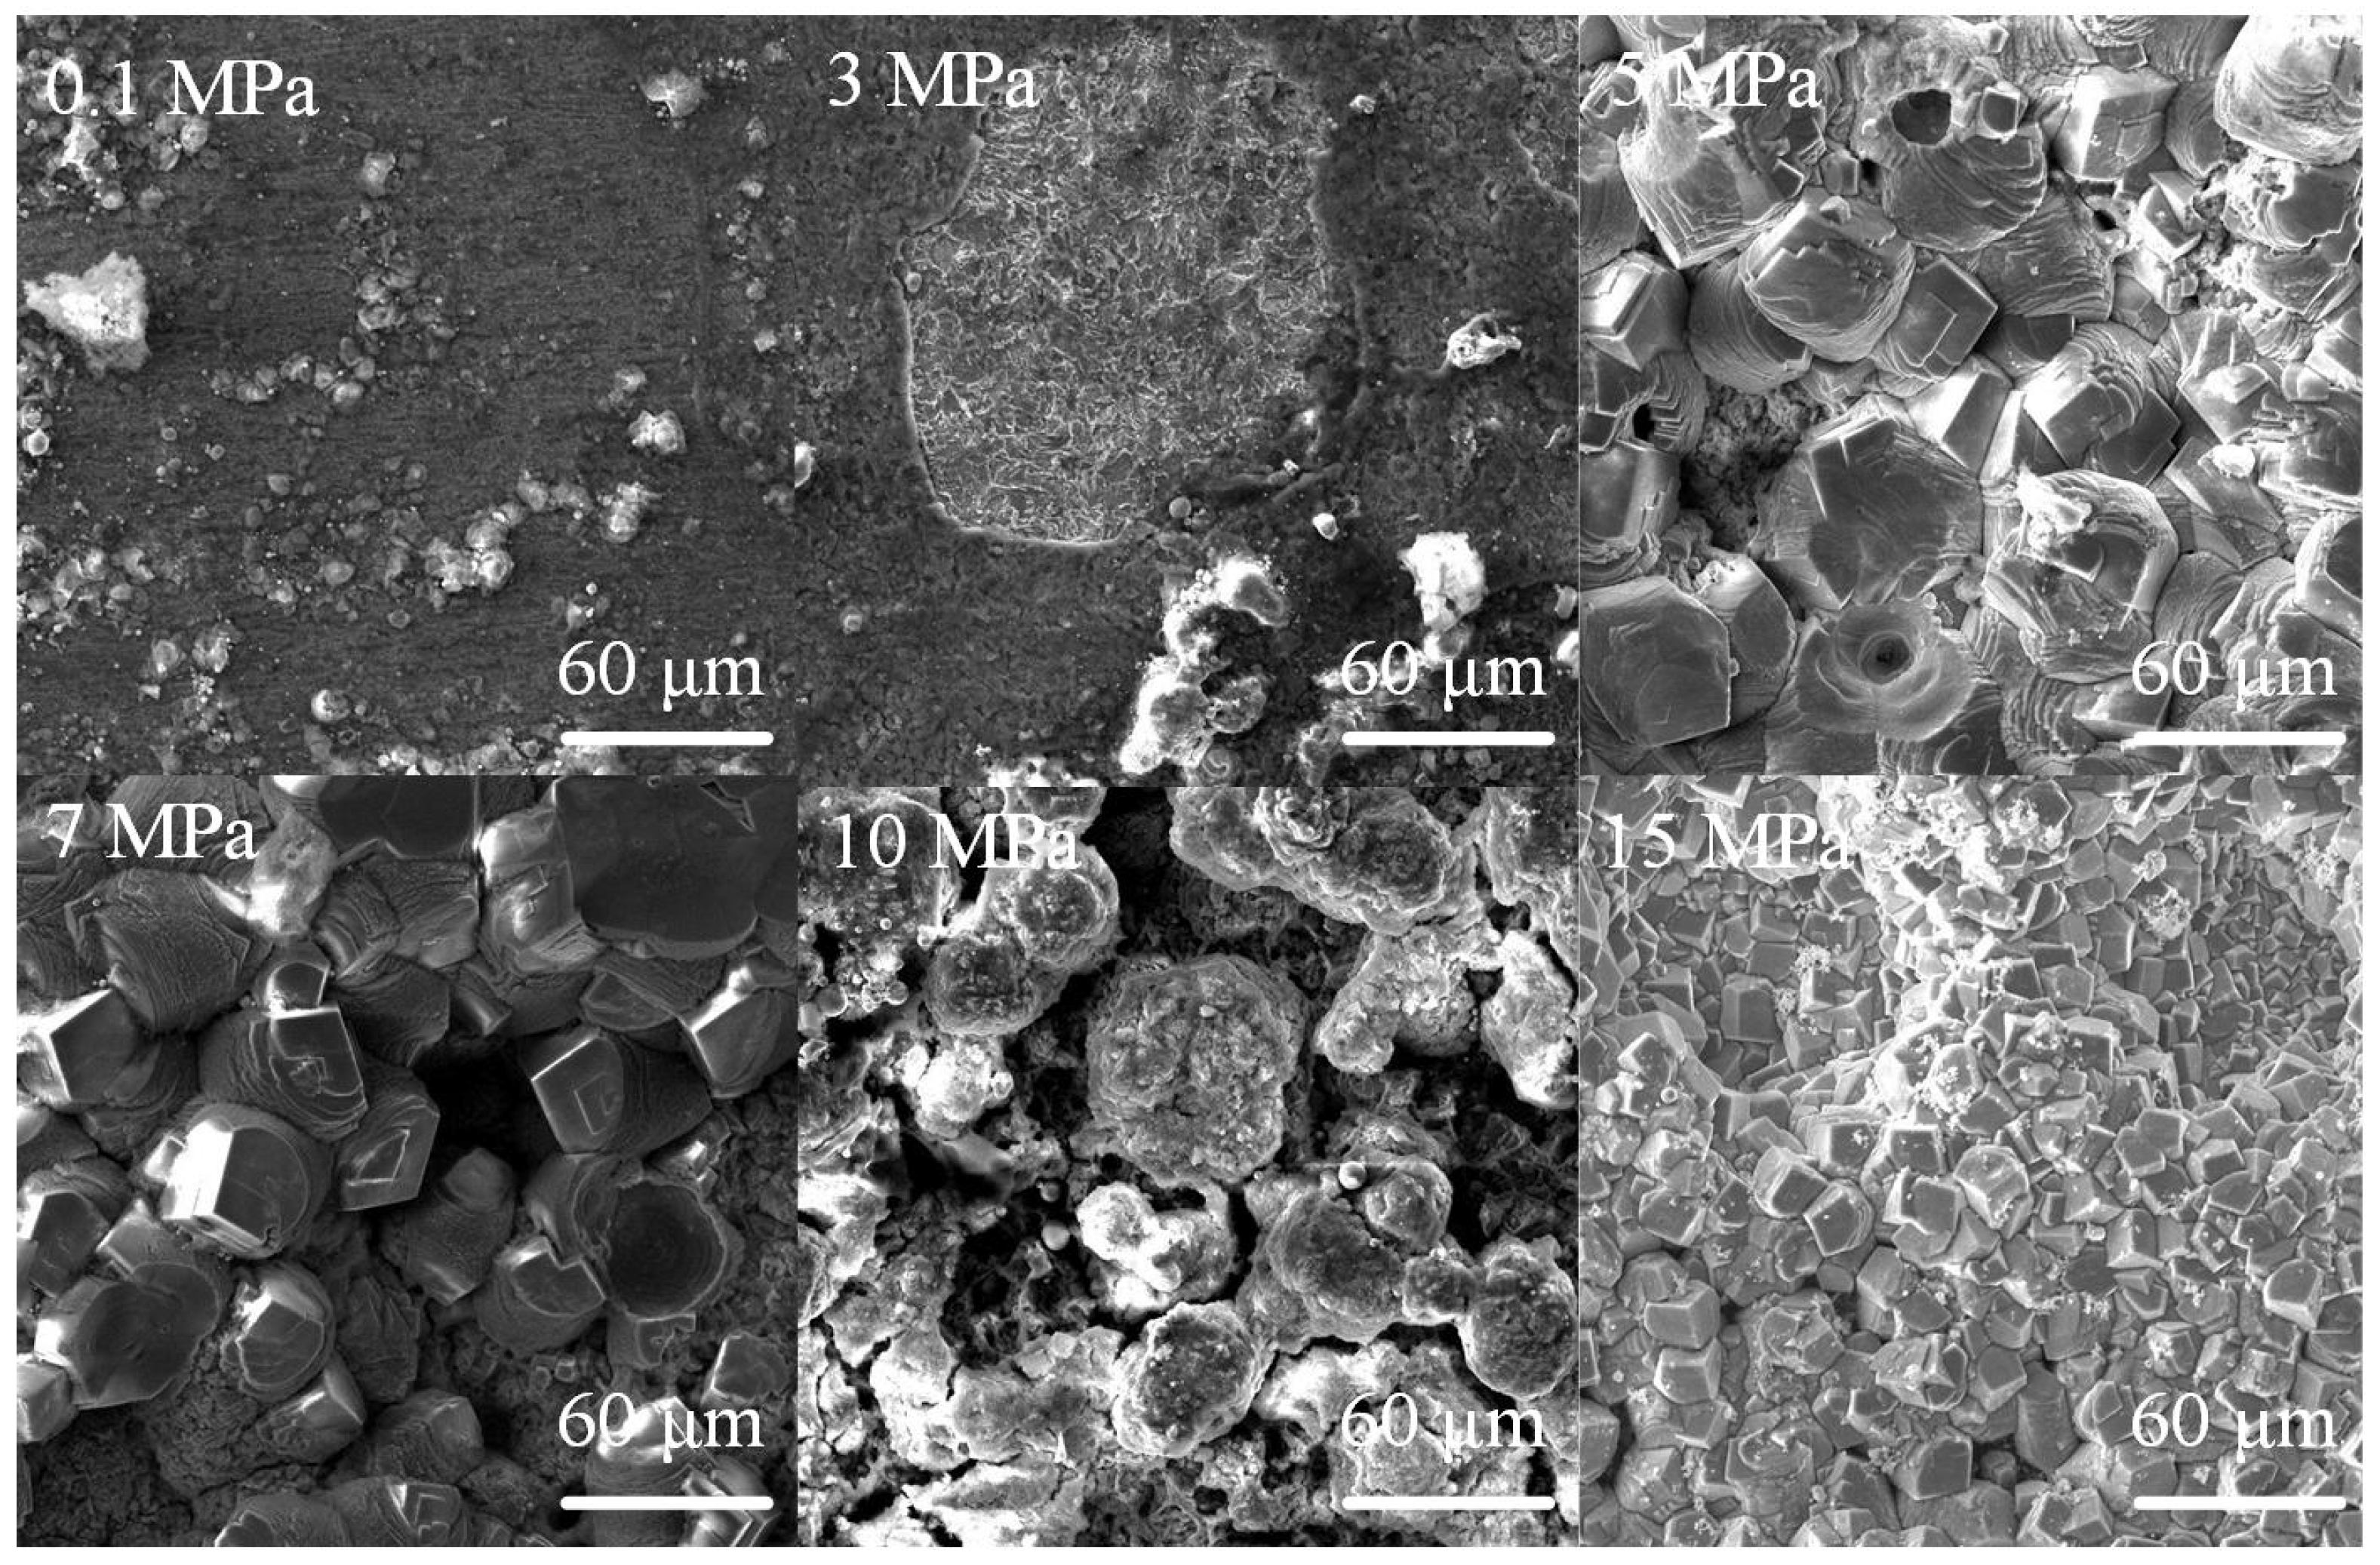
Figure 14.
XRD spectra of corrosion product films of J55 steel at different immersion times.

Figure 15.
XRD spectra of corrosion product films of N80 steel at different immersion times.

Figure 16.
Structure of corrosion product film of J55 steel at 15 MPa (500×): O (the outer layer); M (the middle layer); I (the inner layer).
Figure 16.
Structure of corrosion product film of J55 steel at 15 MPa (500×): O (the outer layer); M (the middle layer); I (the inner layer).
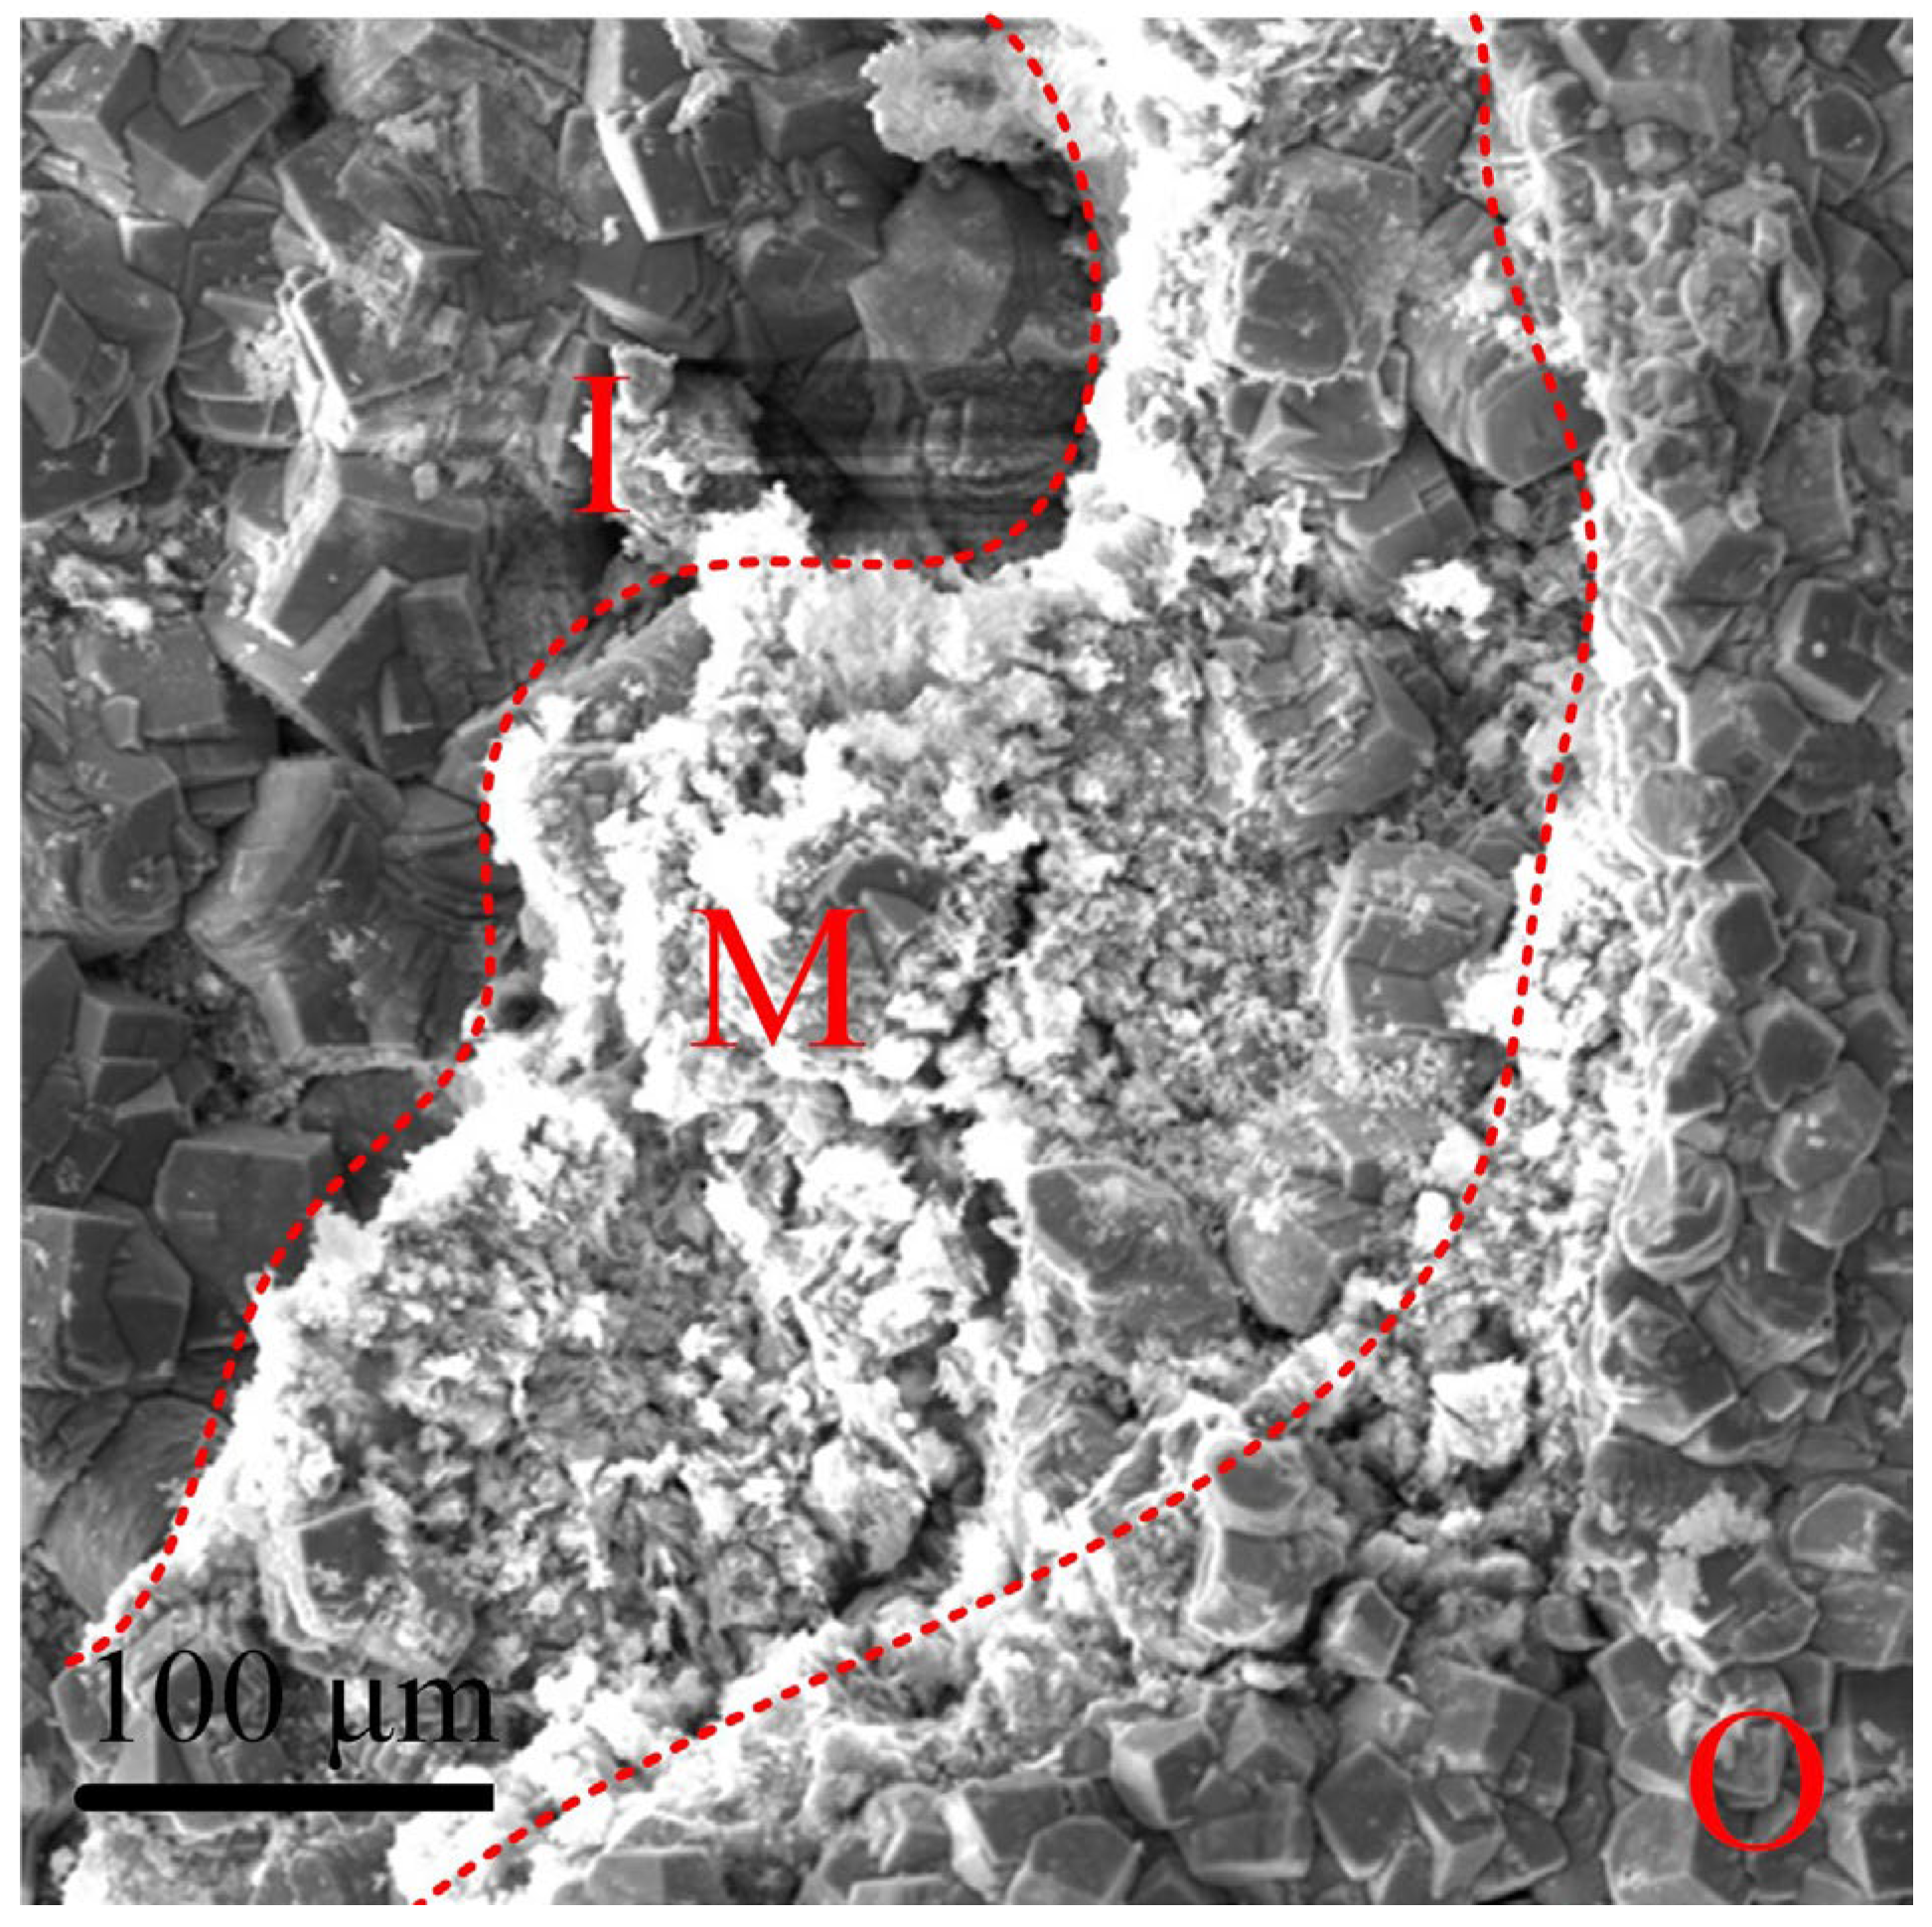
Figure 17.
Structure of corrosion product film of N80 steel at 15 MPa (1000×; 100×; 1000×): O (the outer layer); M (the middle layer); I (the inner layer).
Figure 17.
Structure of corrosion product film of N80 steel at 15 MPa (1000×; 100×; 1000×): O (the outer layer); M (the middle layer); I (the inner layer).
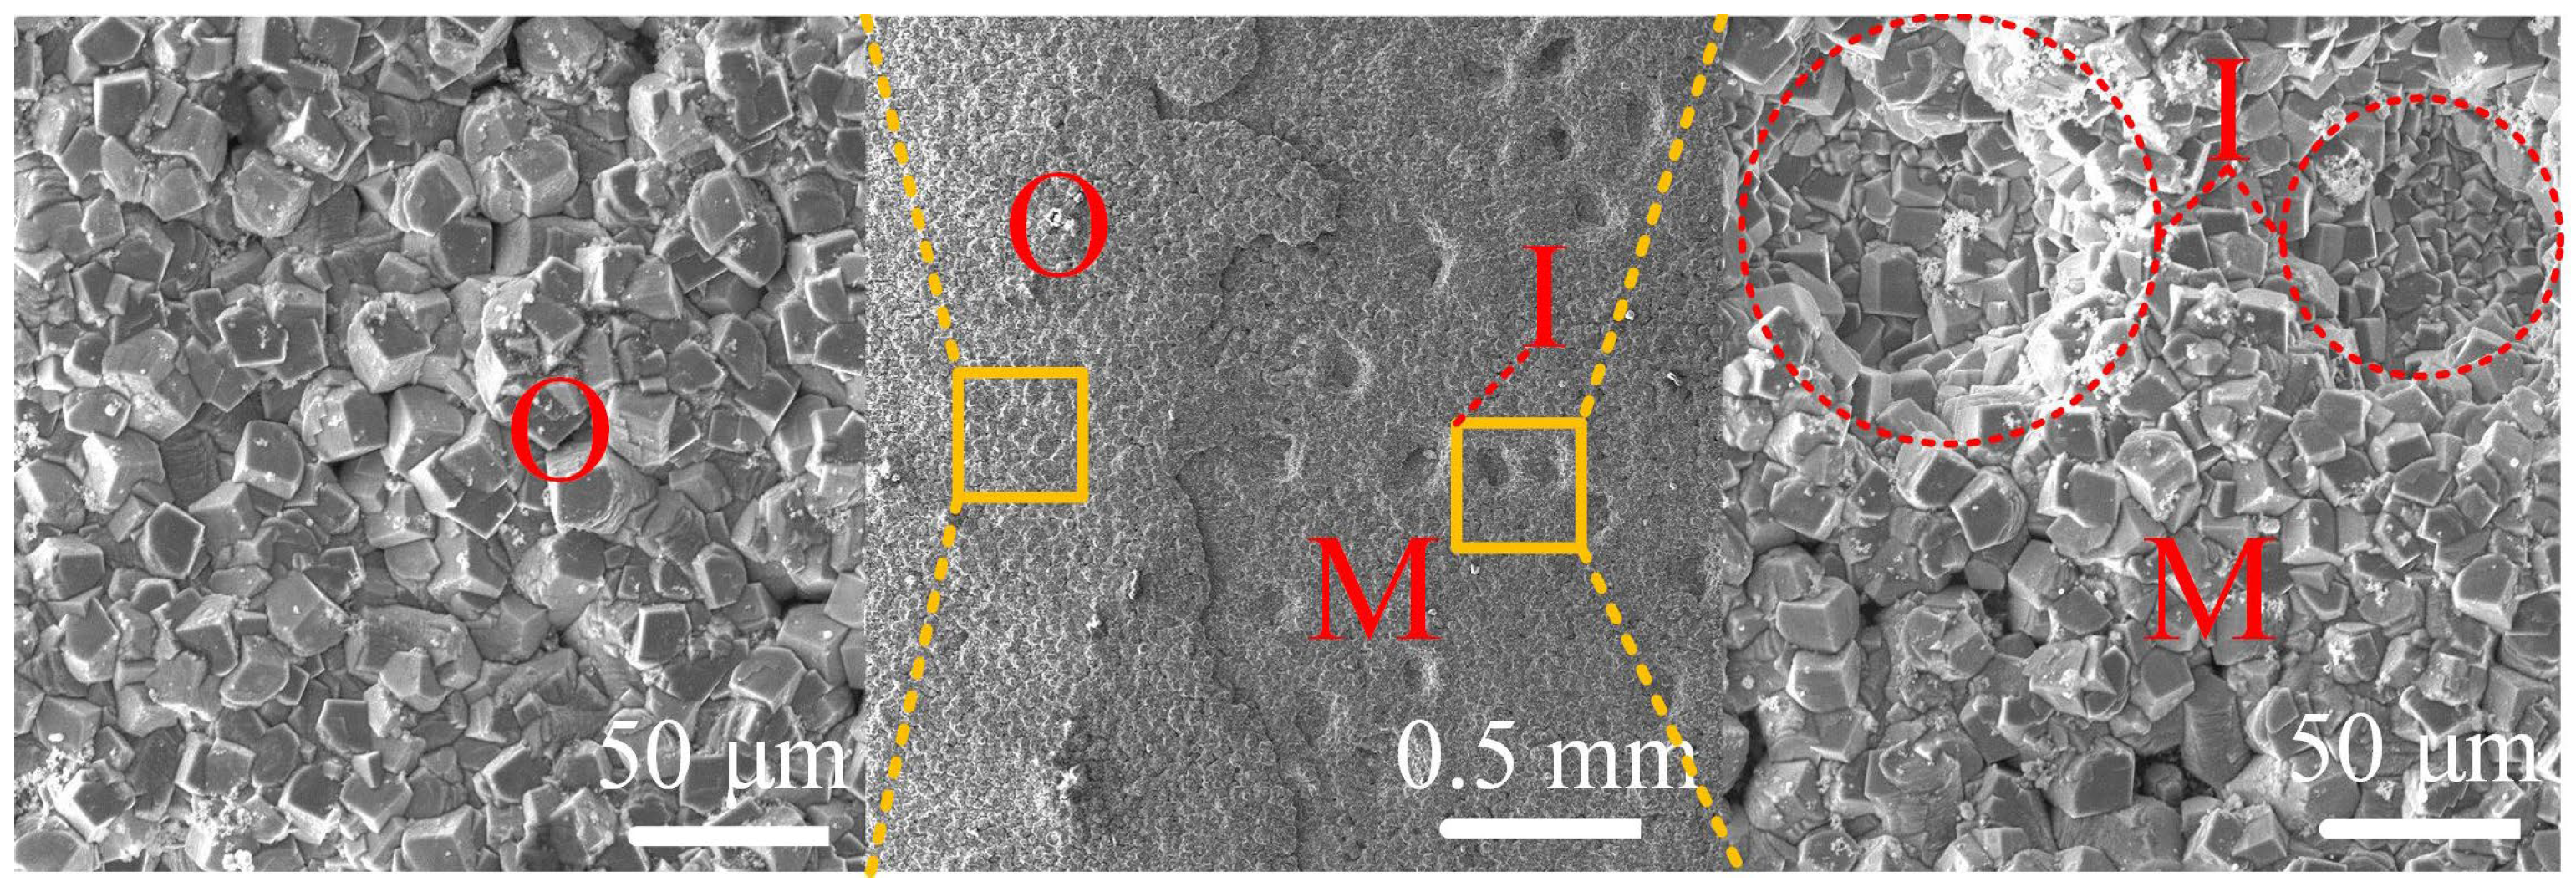
Figure 18.
Schematic diagram of the corrosion mechanism of J55 steel. (a) is the Schematic diagram of microstructure; (b) is the dissolution of ferrite; (c) is the beginning of FeCO3 deposit; (d) is the formation of FeCO3 film; (e) is the increase of the thickness of FeCO3 film; (f) is the formation of outer and inner layers.
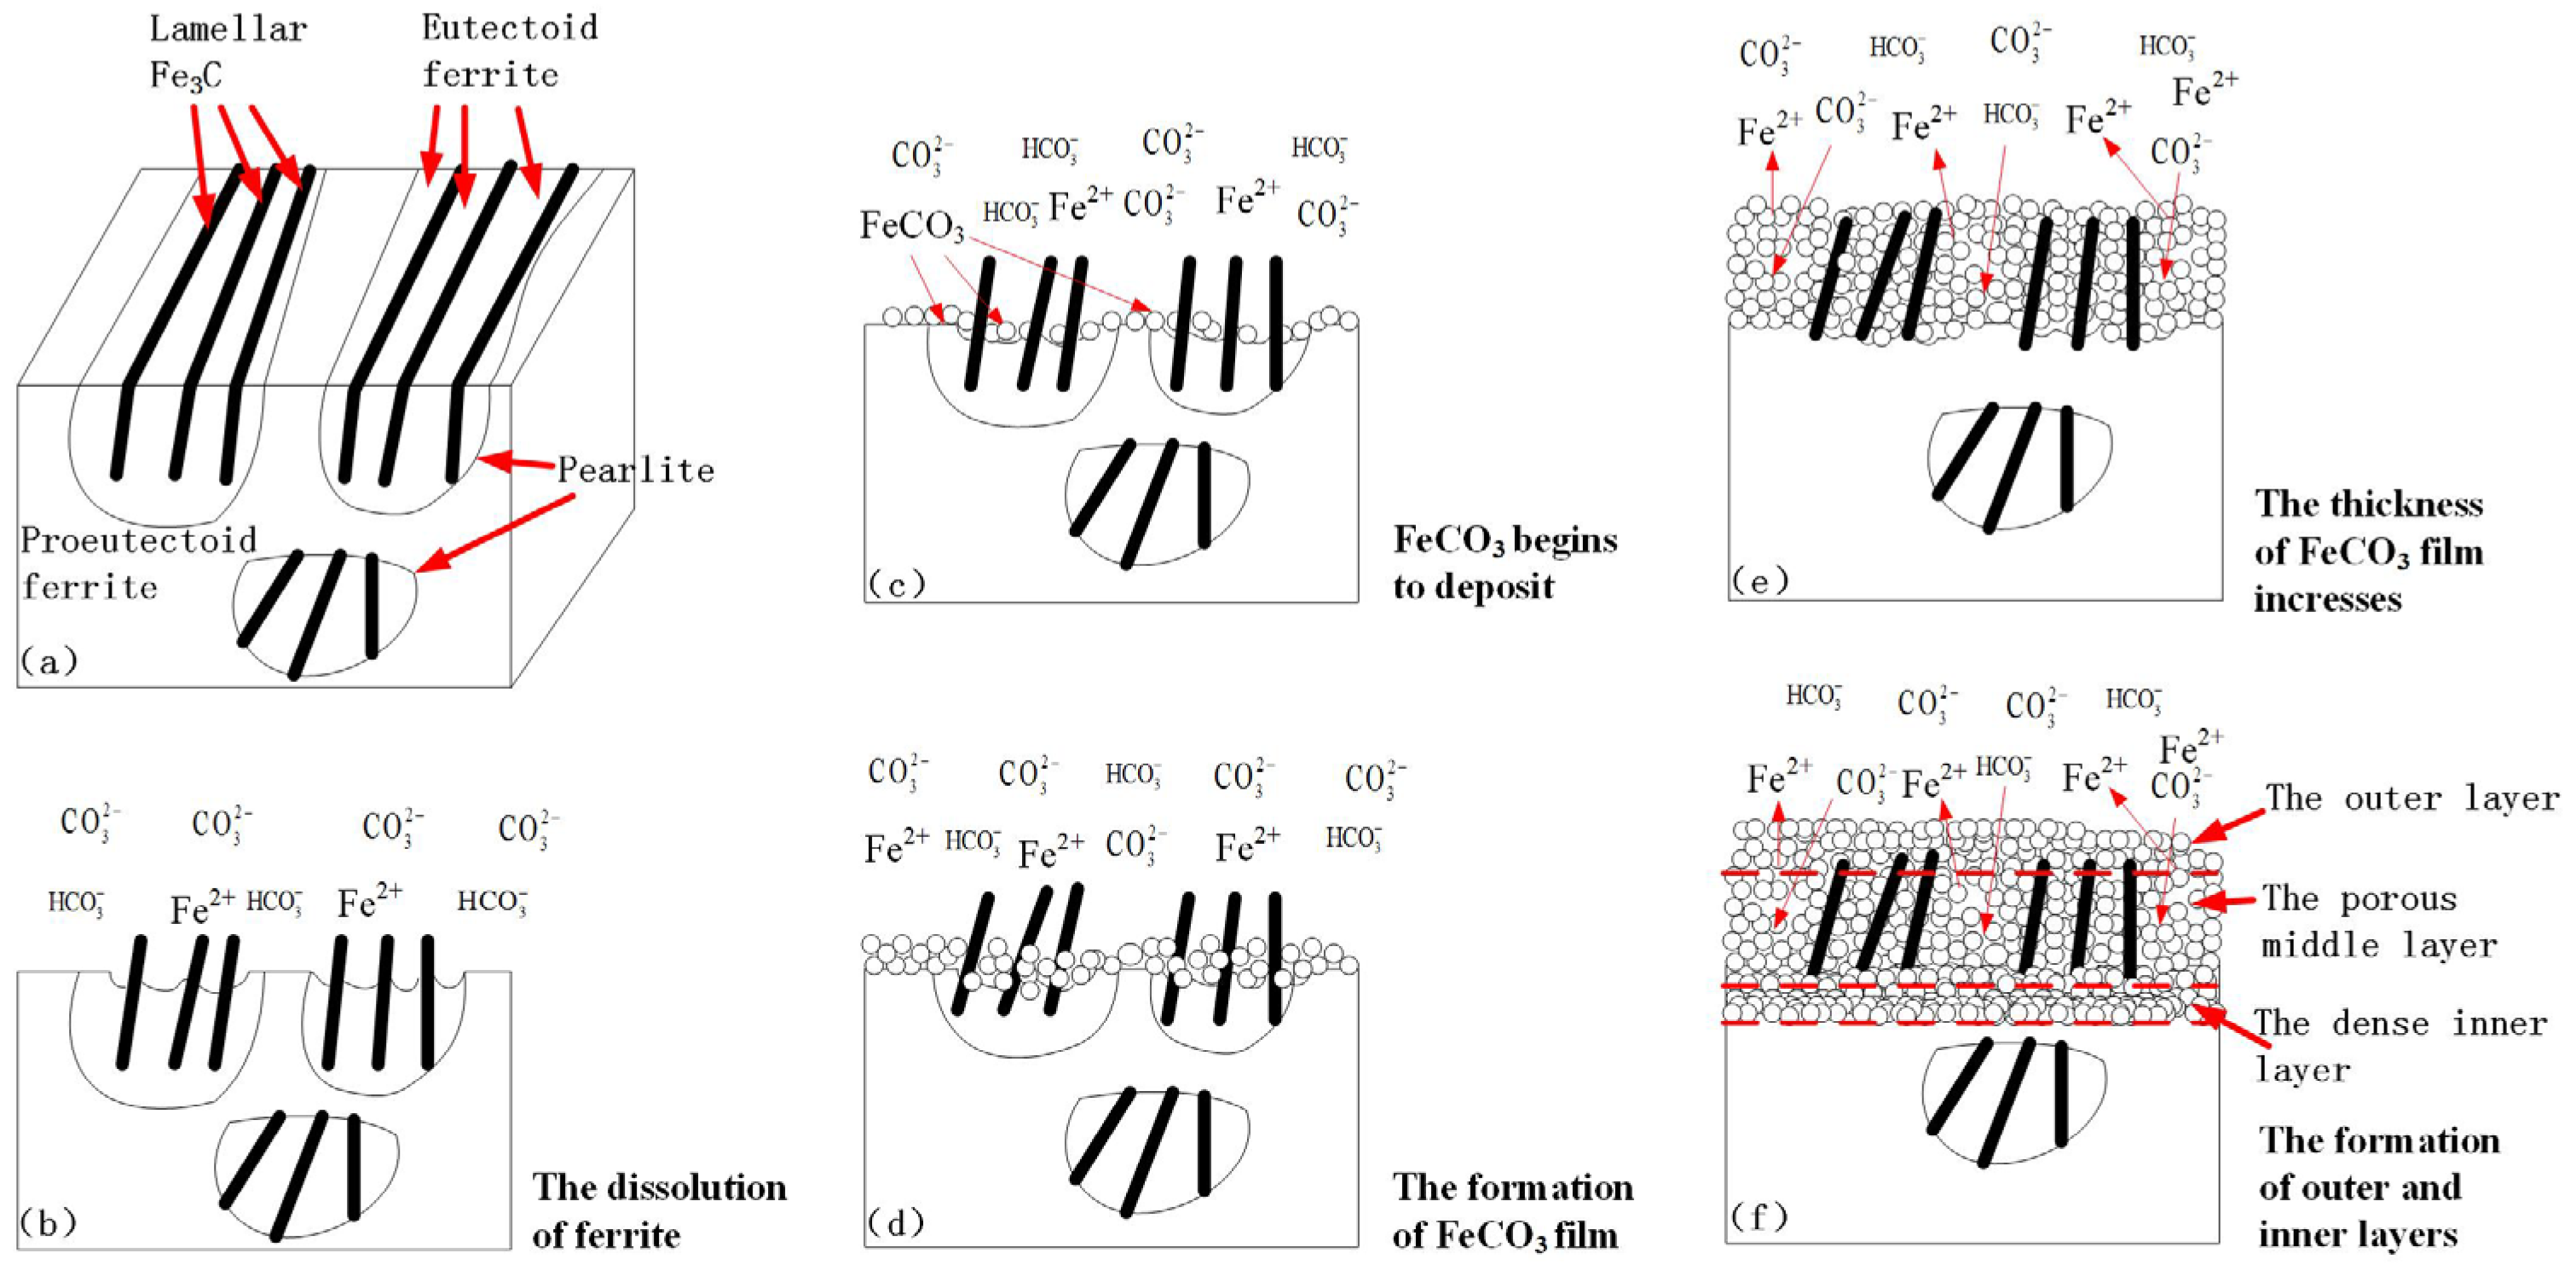
Figure 19.
Schematic diagram of the corrosion mechanism of N80 steel. (a) is the Schematic diagram of microstructure; (b) is the dissolution of ferrite; (c) is the beginning of FeCO3 deposit; (d) is the formation of FeCO3 film; (e) is the falling off of Fe3C; (f) is the formation of outer and inner layers.
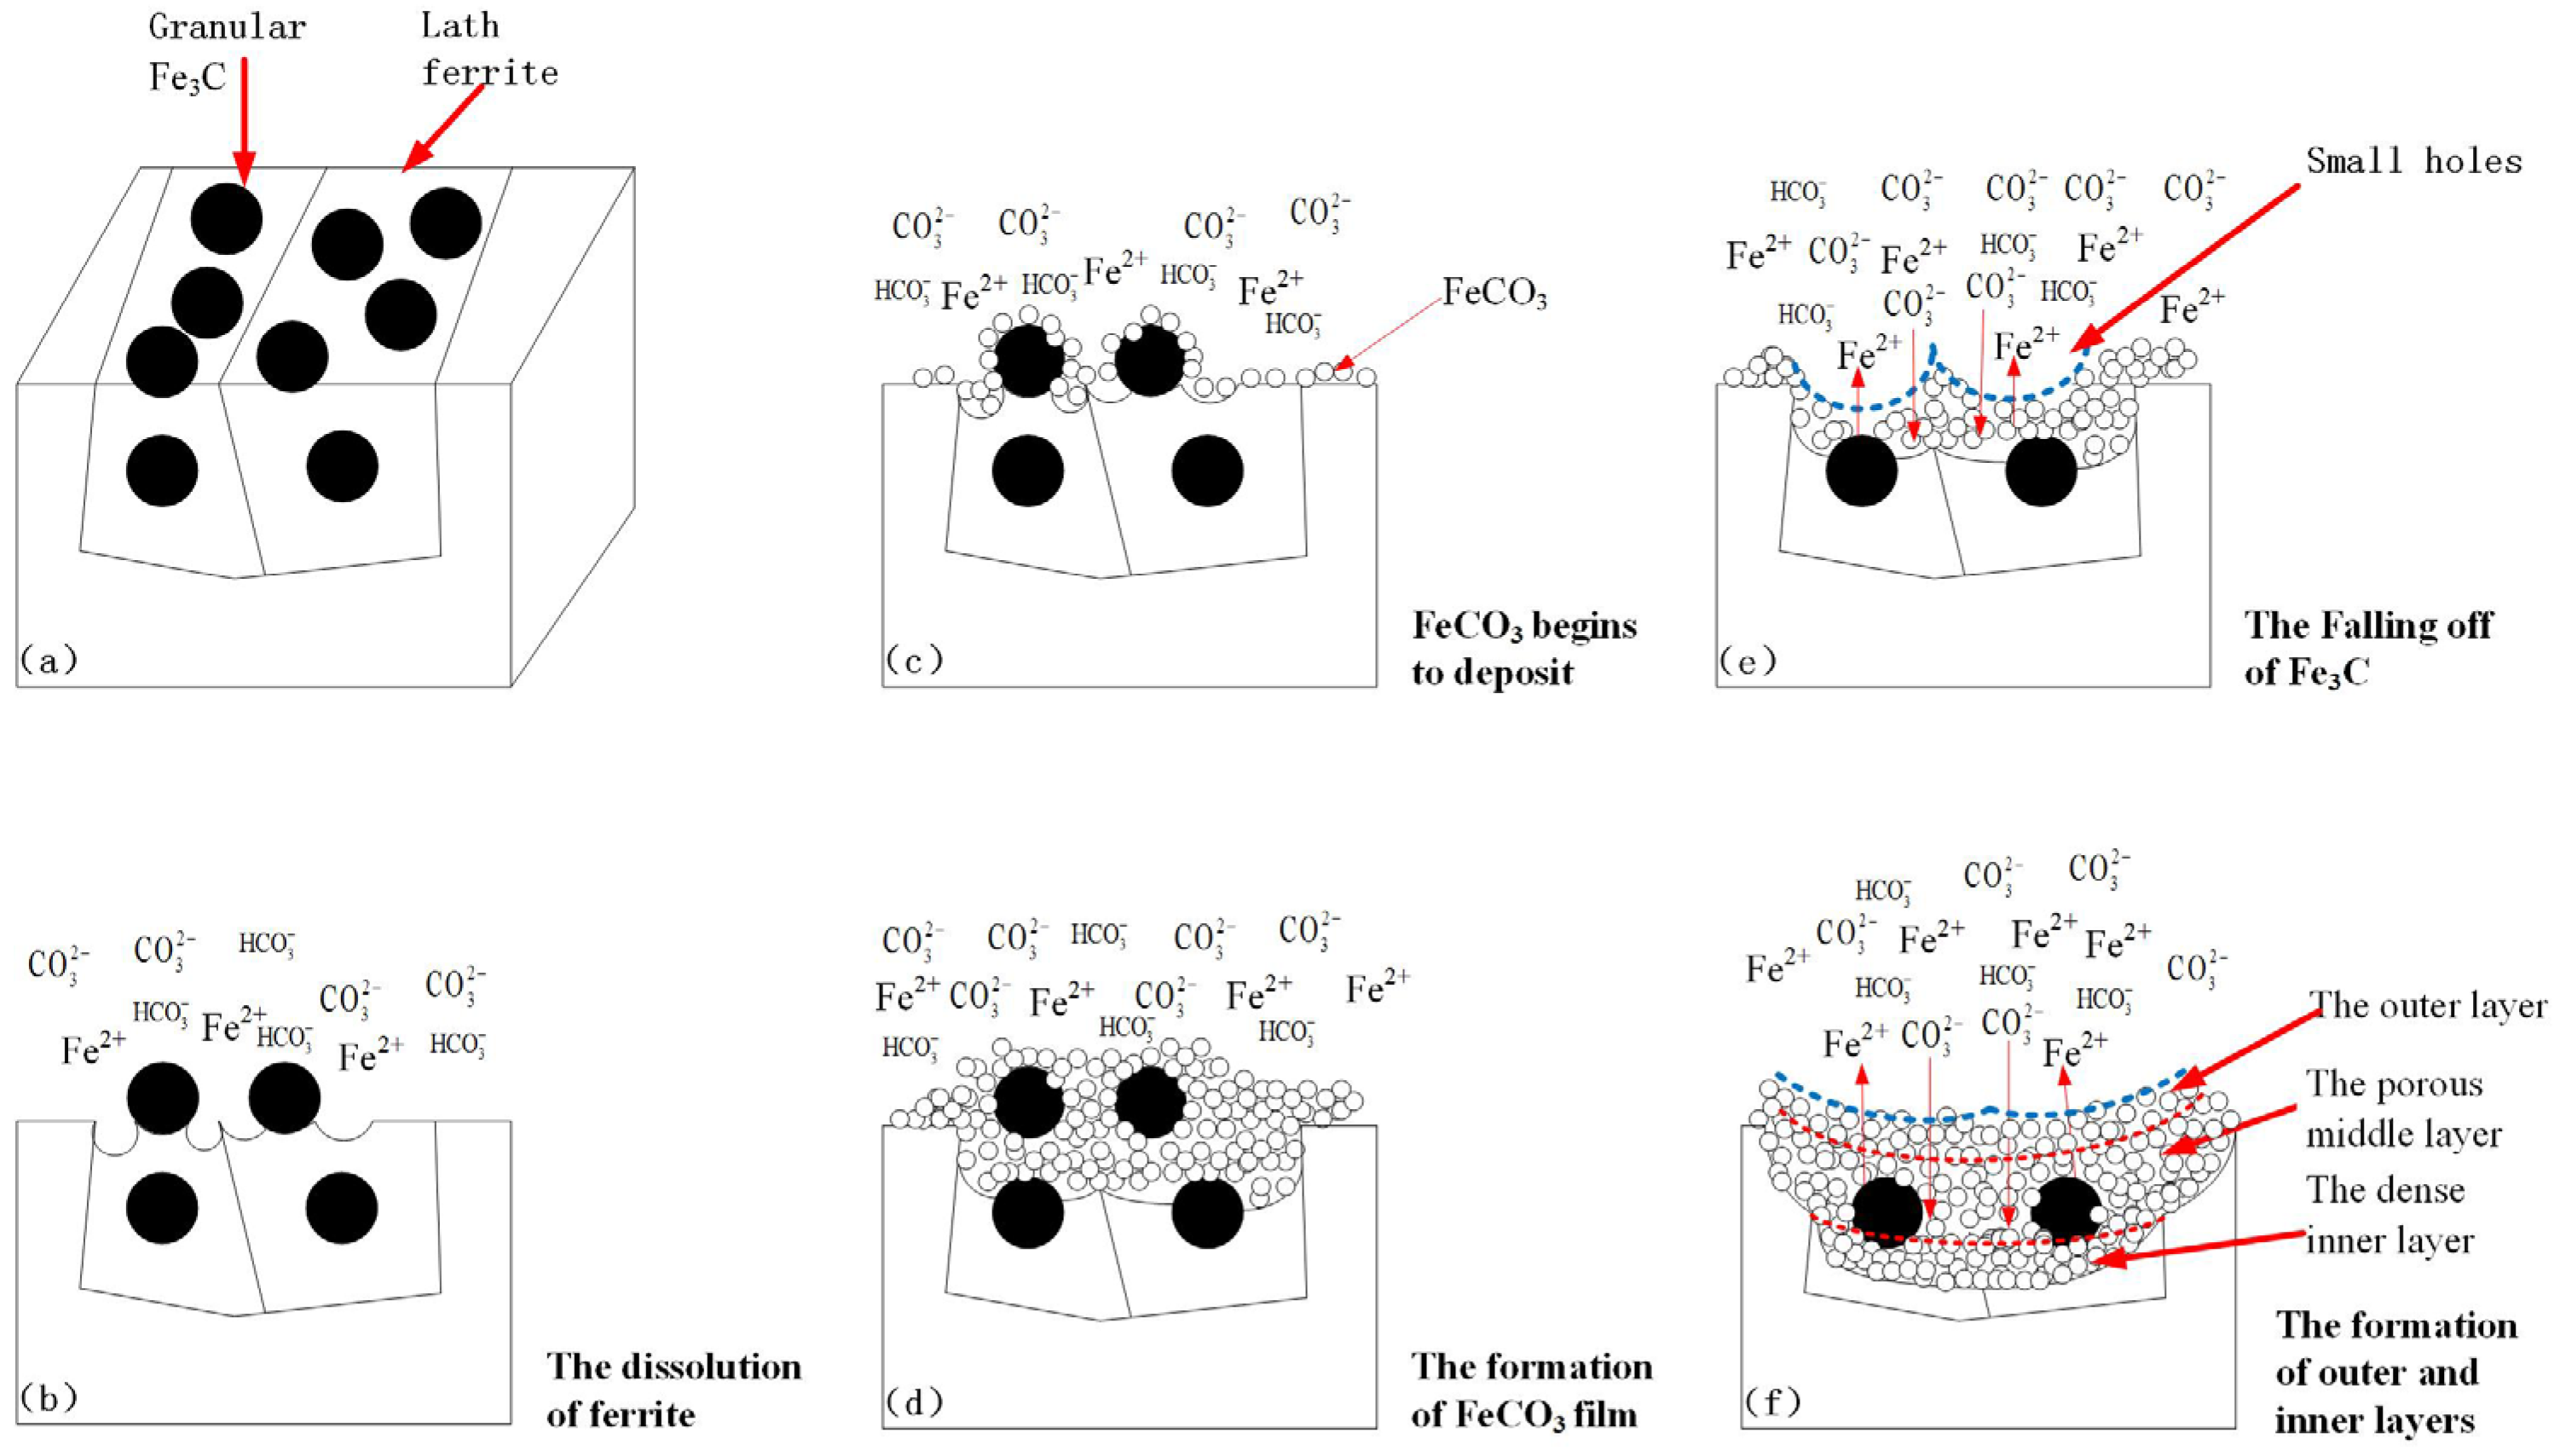
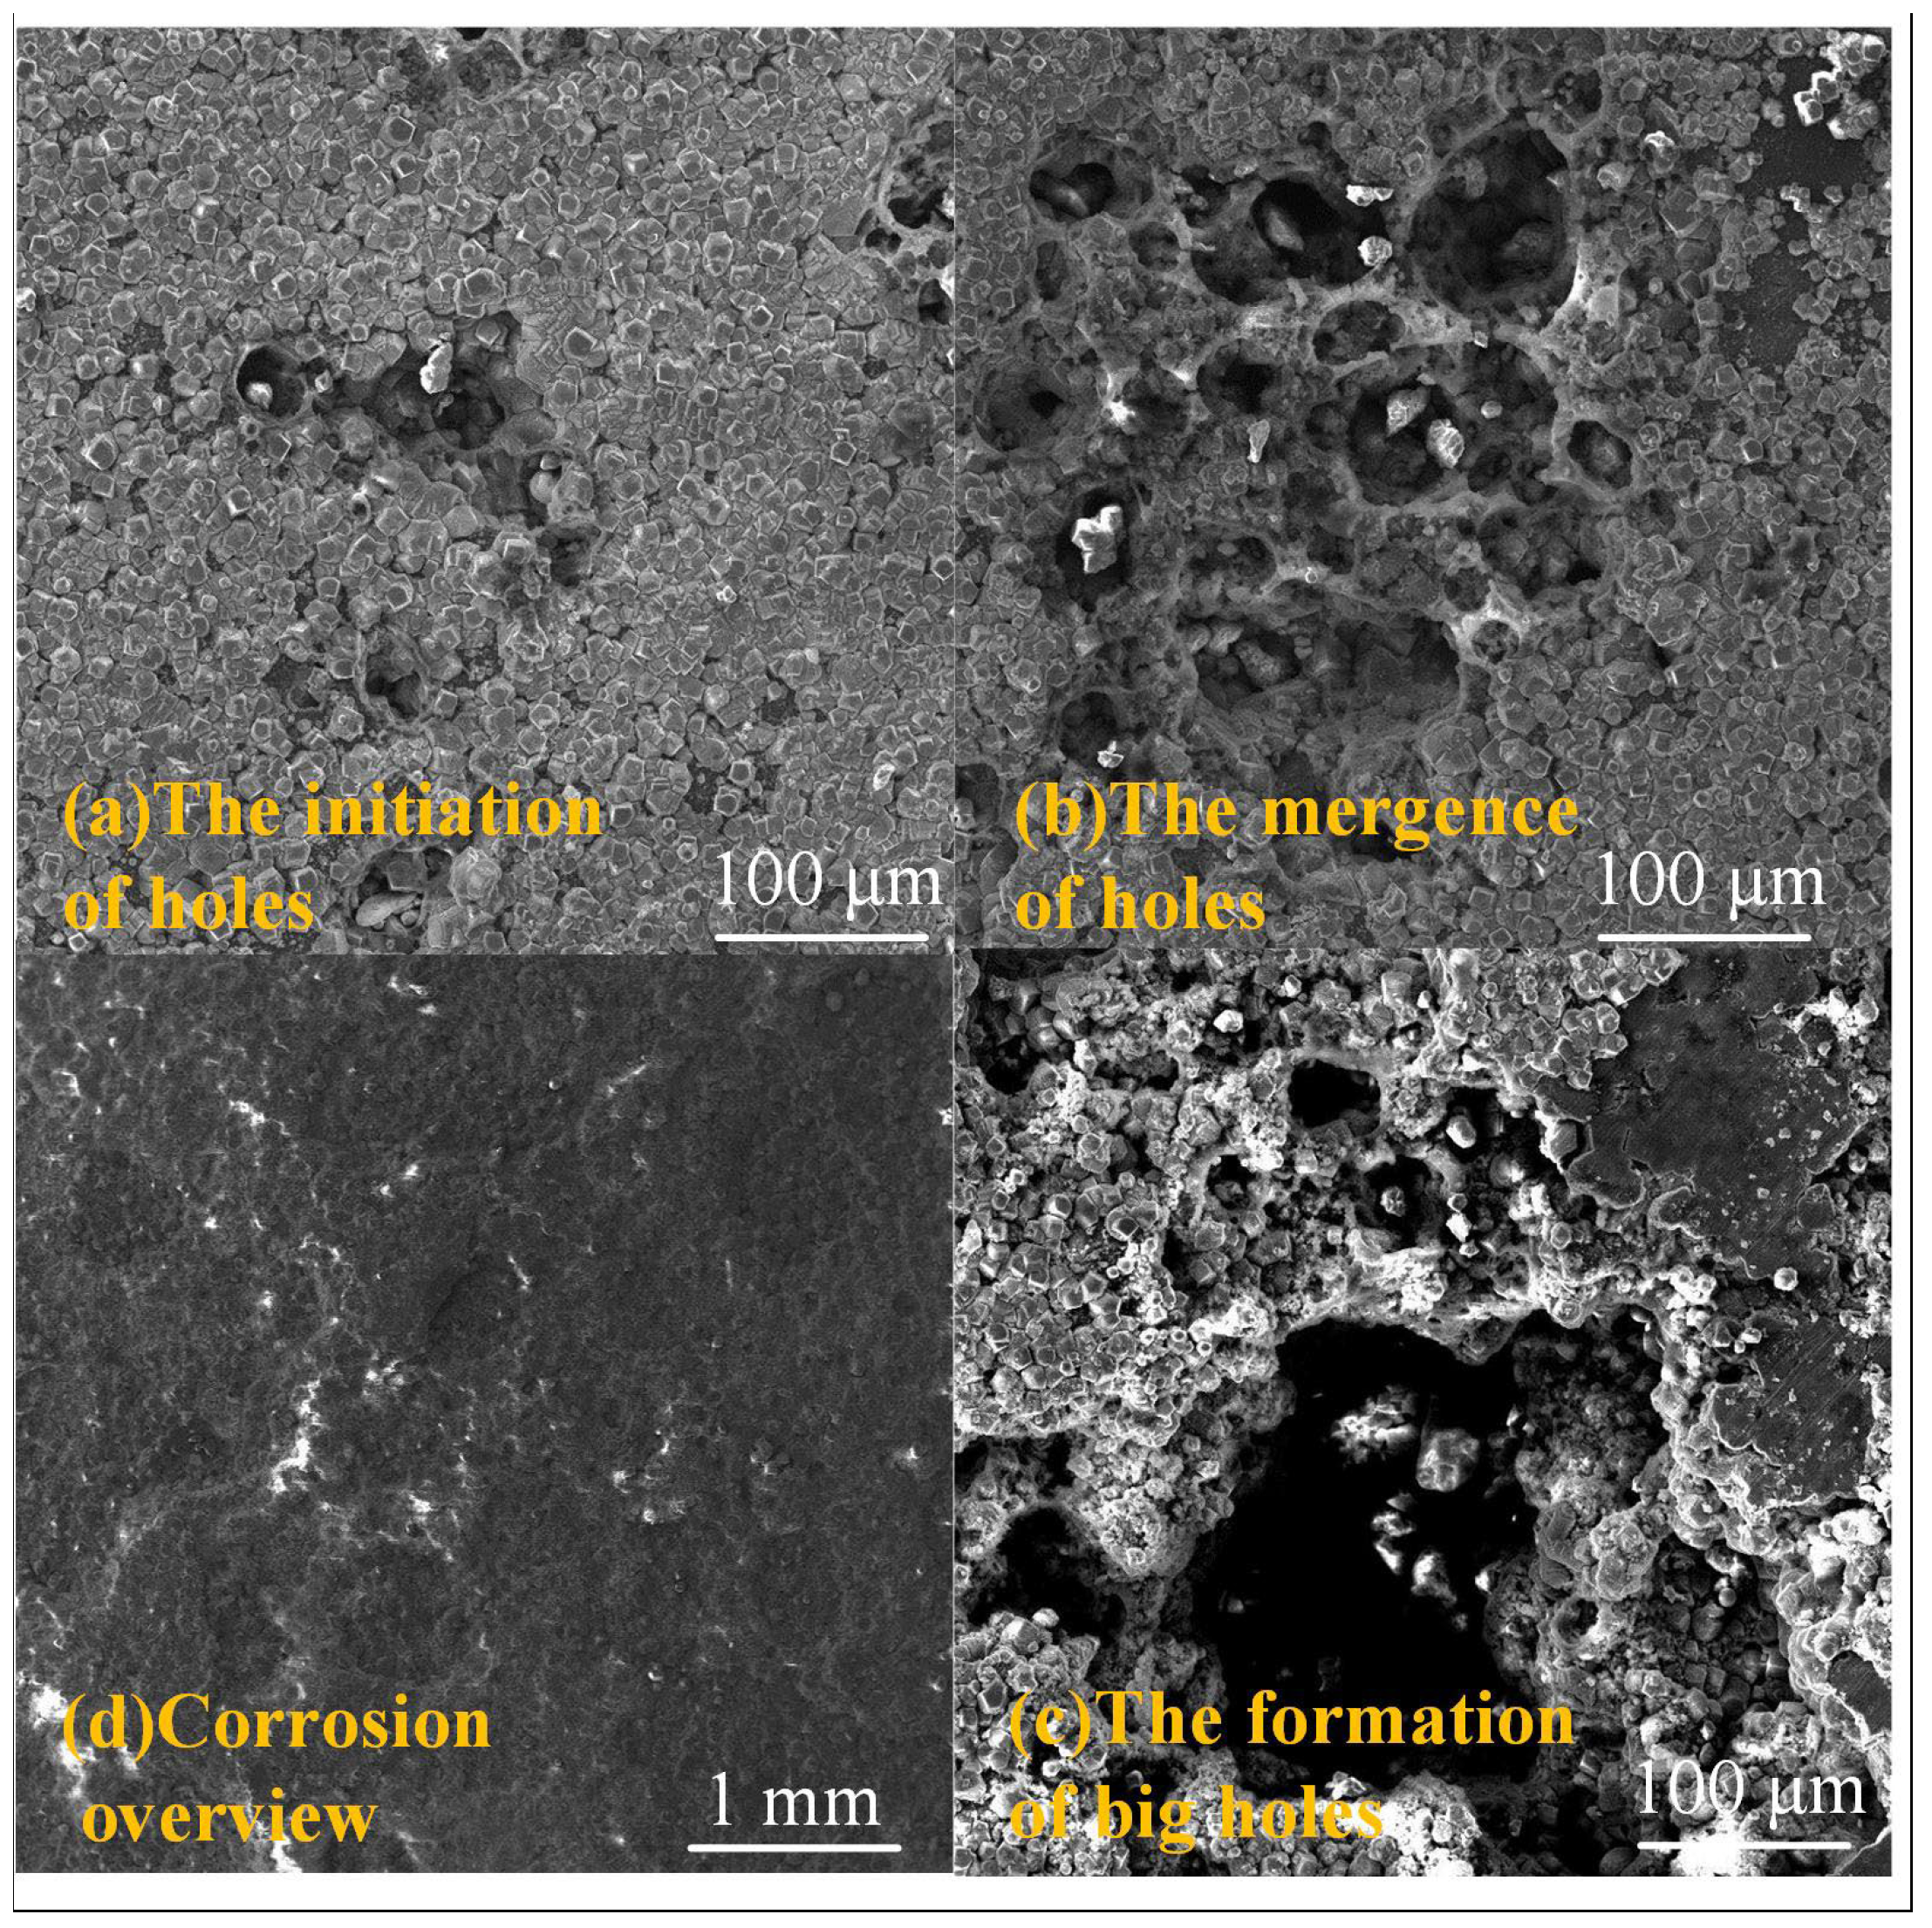
Figure 20.
The formation process of big holes in N80 steel (7 MPa): (a–c) (500×); (d) (50×). (a) is the intiation of holes; (b) is the mergence of holes; (c) is the formation of big holes; (d) is the corrosion overview.
Figure 20.
The formation process of big holes in N80 steel (7 MPa): (a–c) (500×); (d) (50×). (a) is the intiation of holes; (b) is the mergence of holes; (c) is the formation of big holes; (d) is the corrosion overview.

Table 1.
Chemical compositions of the experimental steels (wt, %).
| Materials | C | Si | Mn | P | S | Mo | Cr | Ni | Cu |
|---|---|---|---|---|---|---|---|---|---|
| J55 | 0.40 | 0.26 | 1.53 | 0.012 | 0.012 | 0.0024 | 0.015 | 0.008 | 0.012 |
| N80 | 0.31 | 0.29 | 1.64 | 0.010 | 0.0034 | 0.013 | 0.044 | 0.021 | 0.037 |
Table 2.
Experimental conditions under different CO2 pressures.
| No. | CO2 Partial Pressure, MPa | Corrosion Rate of J55, mm/y | Corrosion Rate of N80, mm/y |
|---|---|---|---|
| 1 | 0.1 | 0.096 | 0.081 |
| 2 | 3 | 1.524 | 1.095 |
| 3 | 5 | 1.788 | 2.184 |
| 4 | 7 | 2.482 | 2.679 |
| 5 | 10 | 4.570 | 6.549 |
| 6 | 15 | 5.599 | 5.279 |
Table 3.
Chemical compositions of simulated formation water (mg/L).
| 15,610.05 | 113.59 | 114.67 | 305.41 | 1109.32 | 9479.99 |
Table 4.
Experimental conditions at different immersion times.
| No. | Immersion Times, h | Corrosion Rate of J55, mm/y | Corrosion Rate of N80, mm/y |
|---|---|---|---|
| 7 | 20 | 17.485 | 21.425 |
| 8 | 66 | 7.949 | 9.451 |
| 9 | 114 | 4.239 | 5.178 |
| 10 | 168 | 4.002 | 4.946 |
Table 5.
References of corrosion product film.
| Reference | Steel | Temperature, °C | CO2 Pressure, MPa | Solution | Structure | Mechanism |
|---|---|---|---|---|---|---|
| [8] | N80 | 90 | 1 | simulated formation water | inner and outer layers | outer layer was formed first |
| [9] | X65 | 80 | 1, 9.5 | 3.5% NaCl solution | inner and outer layers | inner layer was formed first |
| [10] | N80 | 78 | 1 | simulated formation water | three-layer structure | formed at the same time |
| [11] | X65 | 60 | 1 | simulated formation water | three-layer structure | middle layer was formed first |
| [12] | X65 | 50, 80 | 1, 9.5 | simulated formation water | three-layer structure | / |
Publisher’s Note: MDPI stays neutral with regard to jurisdictional claims in published maps and institutional affiliations. |
© 2022 by the authors. Licensee MDPI, Basel, Switzerland. This article is an open access article distributed under the terms and conditions of the Creative Commons Attribution (CC BY) license (https://creativecommons.org/licenses/by/4.0/).
Share and Cite
MDPI and ACS Style
Cheng, S.; Zhao, X.; Fu, A.; Li, D.; Yin, C.; Feng, Y. Corrosion Behavior of J55 and N80 Carbon Steels in Simulated Formation Water under Different CO2 Partial Pressures. Coatings 2022, 12, 1402. https://doi.org/10.3390/coatings12101402
AMA Style
Cheng S, Zhao X, Fu A, Li D, Yin C, Feng Y. Corrosion Behavior of J55 and N80 Carbon Steels in Simulated Formation Water under Different CO2 Partial Pressures. Coatings. 2022; 12(10):1402. https://doi.org/10.3390/coatings12101402
Chicago/Turabian StyleCheng, Shixia, Xuehui Zhao, Anqing Fu, Dejun Li, Chengxian Yin, and Yaorong Feng. 2022. "Corrosion Behavior of J55 and N80 Carbon Steels in Simulated Formation Water under Different CO2 Partial Pressures" Coatings 12, no. 10: 1402. https://doi.org/10.3390/coatings12101402
Note that from the first issue of 2016, this journal uses article numbers instead of page numbers. See further details here.