Article

Effects of Different Degrees of Hydrophobic Treatment on Soil–Water Characteristic Curves and Infiltration Coefficients of Hygroscopic Soils

1
College of Civil Engineering, Northeast Forestry University, Harbin 150040, China
2
Heilongjiang Provincial Highway Survey and Design Institute, Harbin 150080, China
3
Heilongjiang Provincial Highway Construction Center, Harbin 150001, China
4
Construction Project Office of Jihei Expressway Shanhe to Harbin Section, Harbin 150221, China
*
Authors to whom correspondence should be addressed.
Coatings 2022, 12(10), 1424; https://doi.org/10.3390/coatings12101424
Submission received: 25 August 2022 / Revised: 15 September 2022 / Accepted: 24 September 2022 / Published: 28 September 2022
(This article belongs to the Special Issue Preparation and Characterization of Superhydrophobic Coatings)

Abstract

:
Soil treated with silicone hydrophobic material for a long time can effectively improve the saturated permeability of the ground, which has been confirmed. However, the long time will increase the cost in engineering construction. Secondly, the mechanism of alteration of soil–water properties by silicone hydrophobic materials is not understood. This lack of understanding is not conducive to the engineering application of silicone hydrophobic materials. Therefore, variable-head permeability and matrix suction tests under 15 different test conditions were conducted with different hydrophobic material dosage and action time as variables in this paper. The soil–water characteristic curve (SWCC) was plotted according to the test results, the unsaturated permeability coefficient was calculated, and curve fitting was performed. It can be seen from the test data that, with the increase in the dosage of hydrophobic materials and the action time, the permeability coefficient and the air-entry value showed a downward trend. Nevertheless, as the reaction proceeded, a mutation occurred at 4 h. When the minimum dosage and action time were used, the soil’s permeability coefficient and air-entry value decreased by 80.65% and 71.09%. The test results show that, even when the action time was 2 h, the hydrophobic material could maintain the permeability of the soil and reduce its air-entry value; thus, the hydrophobic material could effectively reduce the rise of capillary water in the soil and protect the roadbed.

1. Introduction

Studies have shown that moisture migration will lead to changes in moisture distribution, compactness, temperature, and humidity fields in the subgrade, which will change the overall strength and stability of the subgrade and affect the working performance [1,2,3]. However, at present, the replacement method for subgrade treatment, the isolation layer method, and the geotextile laying method all have the disadvantages of a long construction cycle and high cost [4,5,6]. Many scholars have explored new roadbed methods to shorten the construction period, reduce the cost, and achieve green sustainable development. Organosilicon materials have been widely used in aerospace, military, and construction industries. Since French chemist Charles Friedel first synthesized silicone compounds containing Si–C bonds at high temperatures, many scholars [7,8,9,10] have begun to explore the improvement and application of silicone compounds. Currently, silicone materials are widely used in aerospace, military, construction, and other industries, and they have been successfully introduced into the geotechnical engineering industry. Soil treated with silicone hydrophobic materials can generate a permanent hydrophobic film of 4–6 nm thickness and effectively reduce the amount of frost swelling [9], improve the internal structure and microporosity of the soil [11], reduce the migration of water to the freezing front [12,13], improve the internal friction angle and cohesion of clay [14], improve the overall stability of the slope of the subgrade [15], and reduce the height of capillary water rise [16].
The soil–water characteristic curve (SWCC) originated from soil science. It is used to characterize the constitutive relationship between soil suction (mainly matrix suction) and its moisture content (mass moisture content, ω, volumetric moisture content, θω, saturation, Sr, etc.) [17,18] which has important reference significance for the study of water holding capacity and hydraulic–mechanical properties of soil [19,20,21]. Therefore, scholars have conducted in-depth research on SWCC, including the main influencing factors [22,23], curve fitting [24,25,26,27], soil compaction and deformation on the degree of influence [28], and hysteresis effect [29]. Meanwhile, several mathematical models for predicting soil pore distribution on the basis of the soil–water characteristic curve have been proposed [30]. With the wide application of hydrophobic materials in geotechnical engineering, scholars at home and abroad have begun to study the SWCC of soil after hydrophobic treatment and have made remarkable achievements. The study by Bauter found that soil saturation after hydrophobic treatment varied significantly with the same suction, and the wetting front changed with the change of hydrophobic degree [31,32]. Lamparter and Diamantopoulos compared the relationship between SWCC and the contact angle of sand and hydrophilic sand with different hydrophobic degrees. It was found that the hydrophobic degree had a significant effect on the hydraulic–mechanical properties of the soil, and the air-entry value and saturated hydraulic conductivity had an excellent linear relationship with the contact angle [33,34]. By measuring the moisture absorption and desorption curves of soil under different hydrophobic degrees, Czachor found that the influence of hydrophobic degree on the moisture absorption curve was more prominent [35].
The determination methods of the soil–water characteristic curve can be roughly divided into direct measurement methods and predictive analysis methods. The direct measurement methods include the filter paper method, tension meter method, and axial translation method [36]. The prediction analysis methods include prediction based on pore size distribution data [37], prediction based on machine learning algorithm [38], geometric derivation, and empirical equation improvement [39].
The determination of matrix suction using the filter paper method is based on thermodynamics, and the soil suction value [40] is reflected by the humidity balance between soil and filter paper. The method is simple and accurate, and it has a wide measurement range. Therefore, Gardner [41] proposed the filter paper method to determine the matrix suction of soil, which was adopted by the American Society of Materials and Tests (ASTM), with relevant standards. Moreover, Feuerharmel found that the filter paper method had high accuracy in determining the suction by comparing it with other matrix suction methods [42]. Since then, the filter paper method has been introduced into the field of geotechnical engineering and applied widely [43,44,45].
According to the above description, it can be found that silicone hydrophobic material has the advantages of low cost, convenient construction, and excellent hydrophobicity, significantly improving the working performance of subgrade, with little environmental pollution. Therefore, it has a good application prospect in subgrade engineering. However, most of the studies on silicone hydrophobic materials focused on comparing their hydrophobic properties with other materials with the same efficacy, ignoring that reaction time is also essential. In addition, as a new type of soil improvement material, silicone hydrophobic material is promising to be applied to roadbed engineering. However, previous studies have not reported the effect of silicone hydrophobic materials on soil permeability and soil water properties, which is not conducive to the application of silicone hydrophobic materials in engineering. Therefore, this paper measured the saturated permeability coefficient and matrix suction of the soil under different dosages and action times of silicone hydrophobic material to explore the effect of silicone hydrophobic material on soil permeability and soil water characteristics. The VG model was used to fit and obtain the corresponding parameters. The effects of different dosages and action times on SWCC, air-entry value, and permeability coefficient of soil were analyzed. We explored the effect of silicone hydrophobic materials on soil permeability and soil water properties to facilitate its application in engineering practice.

2. Materials and Methods

2.1. Materials

The basic physical parameters of the soil used in this experiment are shown in Table 1. The hydrophobic material used in this experiment was silicone hydrophobic material. The main component of the hydrophobic material is sodium methyl silicate (SMS), which appears as a white powder and has a certain irritant odor. Its fineness is 200 mesh, density is 1.24 g/cm3, and maximum solubility is 30%. The chemical structure is shown in Figure 1.

2.2. Methods

2.2.1. Treatment of Hydrophobic Materials

In this paper, different amounts (50, 70, and 90 g) of hydrophobic materials were dissolved in water to form a total mass of 500 g of hydrophobic material solution. For example, 50 g of silicone hydrophobic material was dissolved in 450 g of water to form 500 g of silicone hydrophobic material solution.

2.2.2. Preparation of Sample

The test soil was dried in an oven and then sieved using a sieve with a pore size of 0.2 cm. Finally, the soil through the sieve was mixed with water. Considering the hysteresis effect of the soil–water characteristic curve (SWCC), this paper only studied the effect of hydrophobic treatment on the moisture absorption curve; hence, the specimens used in this paper were selected to mix with 7% initial moisture content. After mixing evenly, the stuffing was sealed for more than 12 h to ensure that the water was evenly dispersed in the soil. Next, 6.18 × 2 cm3 discoid samples with a maximum dry density of 1.91 g/cm2 and compactness of 96% were prepared using static pressure.

2.2.3. Sample Treatment

The prepared hydrophobic material solution was uniformly sprayed on the surface of the sample, with 1.5 g of hydrophobic material solution sprayed on each sample surface. After the hydrophobic material was treated with the sample for a certain time, the sealing spraying surface prevented the reaction of hydrophobic material with water and carbon dioxide from continuing [46], and then the sample was vacuum-humidified. After a certain time of humidification treatment, the whole sample was sealed for 12 h to ensure the uniform dispersion of water in the sample. Plain soil samples received the same humidifying treatment. According to existing research [47], the dosage of hydrophobic materials and the action time were divided in more detail, as shown in Table 2.

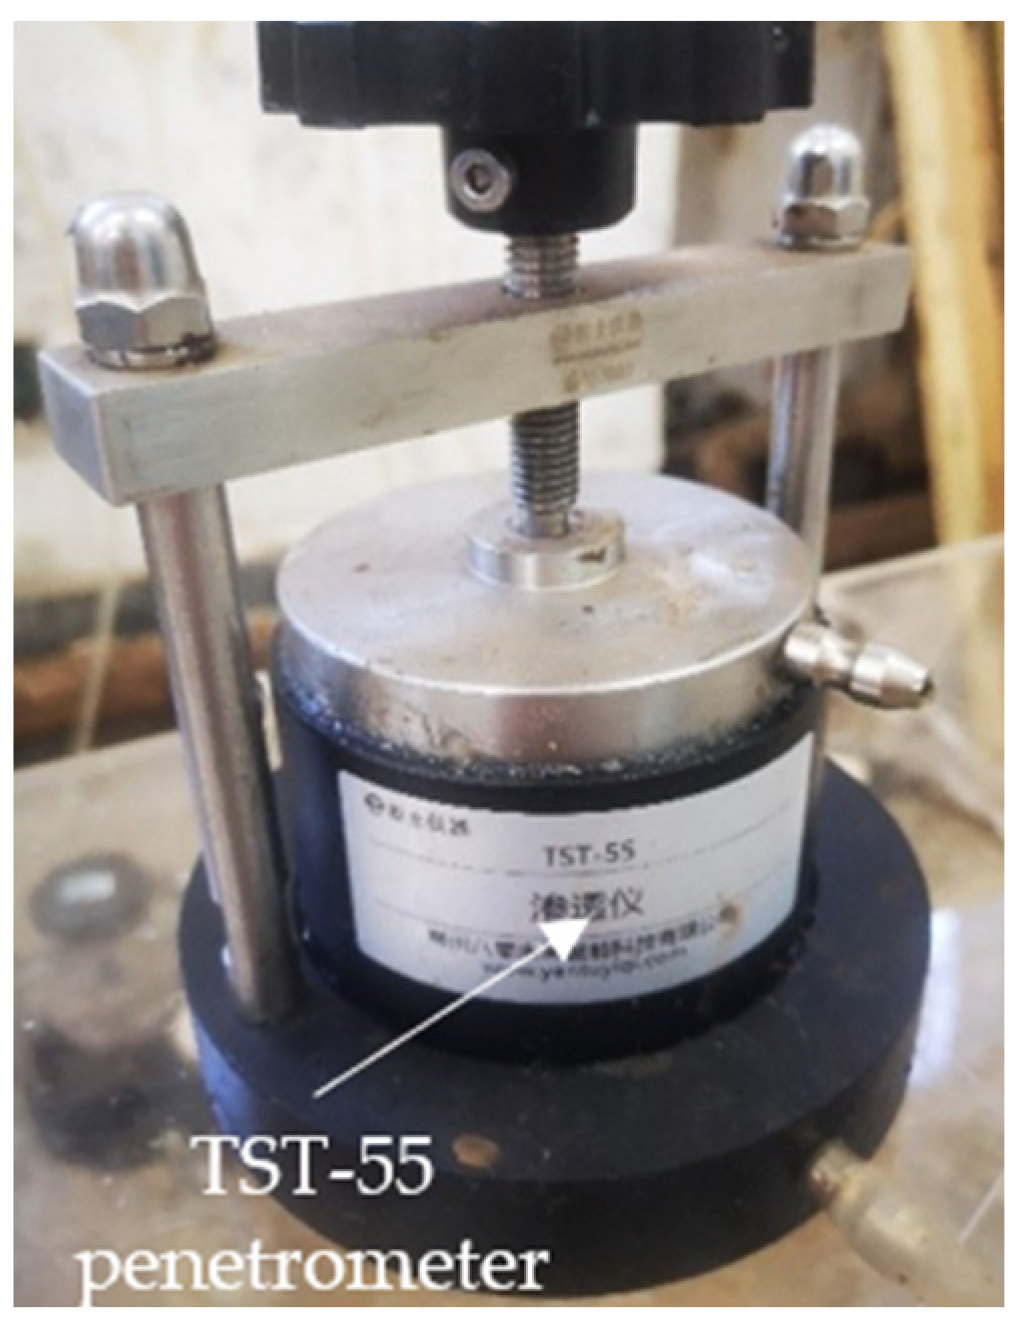
2.2.4. Test of Matrix Suction and Fitting of Soil–Water Characteristic Curve

In this paper, the filter paper method proposed by ASTM was used to determine the matrix suction. According to recommendations by ASTM, WhatMan No.42 filter paper was selected for testing because of its accuracy during measuring and fitting [44,48]. In order to avoid the contamination of filter paper or the breeding of bacteria and fungi during the experiment, the filter paper was dried before the experiment, and the sample was adequately sealed [49]. The calibration curve of different batches of quantitative filter paper produced by the same manufacturer has little difference, and previous research results can be used [50]. The calibration curve used in this paper was derived from Equation (1).
l g ψ = { 4.945 0.0673 ω f ,   ω f < 47 % 2.909 0.0229 ω f ,   ω f 47 % ,
where ψ is matrix suction (kPa), and ωf is the moisture content of filter paper after moisture balance between filter paper and soil.
In this paper, the two samples and filter paper (protective filter paper and test filter paper) that were removed and sealed after 12 h of static sealing were tightly bonded according to Figure 2 and sealed in the sealing tank. The sealing tank was placed in a thermostat at 20 °C. When the sample and the filter paper reached a hydrological equilibrium [51], the filter paper in the middle of the three layers of filter paper was quickly placed in an aluminum box and weighed using an electronic analytical balance with an accuracy of 0.0001 g. Then, the aluminum box containing filter paper was placed in the oven to dry for 10 h and weighed. Lastly, the quality of the aluminum box was evaluated separately. The moisture content of the filter paper was calculated using the three masses measured above. Due to the high moisture sensitivity of filter paper, the filter paper was quickly clipped using tweezers and weighed during the test to avoid any change in moisture content affecting the experimental results.
There are many models for fitting the soil–water characteristic curve (SWCC), such as VG, GA, BC, and FX. According to existing research, among the above models, the VG model [26] has a high fitting degree for SWCC. On the basis of the results of this study, this paper used the VG model to fit SWCC, which is expressed in Equation (2).
ω = ω s [ 1 + ( ψ α ) n ] m ,
where ω is the mass moisture content when the matrix suction is ψ (%), ωs is the saturated mass moisture content (%), and α, n, and m are parameters of the model, where α is considered as the air-entry value (kPa), n is the shape parameter related to the slope of the curve, and m = 1 − 1/n. It should be pointed out that the water content, ω, in the above equation was the water content within the range of solution infiltration depth, i.e., the soils within 3 mm of the sample surface were taken for measurement.

2.2.5. Statistics

The fitting of the SWCC model can be realized using RETC, Origin, Matlab, Excel [52] and other software, all of which have high goodness of fit (R2). In this paper, the self-defined function in Origin was used for fitting.

2.2.6. Falling Head Permeability Test

The preparation and treatment methods of the samples used in this experiment are the same as the matrix suction measurement. In accordance with the ‘Standard for Geotechnical Testing Method’ (GB/T50123-2019), the prepared samples were double-layered and placed into a TST-55 permeameter (Changzhou Yinganyang Instrument Co., Ltd., Changzhou, China) (Figure 3) for the variable-head permeability test (Figure 4). The cutting ring containing the soil sample to be tested was placed in a TST-55 penetrometer, and a sufficient amount of Vaseline was smeared between the outer side of the cutting ring and the inner wall of the penetrometer. The lid was fitted and tightened with screws. Then, the water supply device was used to fill the inlet pipe with water, opening the exhaust valve, and then closing it when there were no bubbles in the overflow water. Multiple sets of head height and inlet and outlet water temperature data were recorded when the water flow started from the outlet. The permeability coefficient was calculated using Equations (3) and (4).
k t = 2.3 a L A ( t 2 t 1 ) lg H 1 H 2 ,
k 20 = k t η t η 20 ,
where kt is the permeability coefficient of the sample at t °C (cm/s), with three-digit valid numbers, A is the inner diameter area of variable head pipe (cm2), 2.3 is the transformation factor for ln and lg, L is the seepage path (height of sample), t1 and t2 are the starting and ending time of measuring head (s), H1 and H2 are the starting and ending position of water head, k20 is the permeability coefficient of the sample at 0 °C (cm/s), with three-digit valid numbers, ηt and η20 are the coefficient of dynamic viscosity of water at t °C and 20 °C (kPa∙s), and ηt20 is the ratio of the viscosity coefficient.

3. Results and Discussion

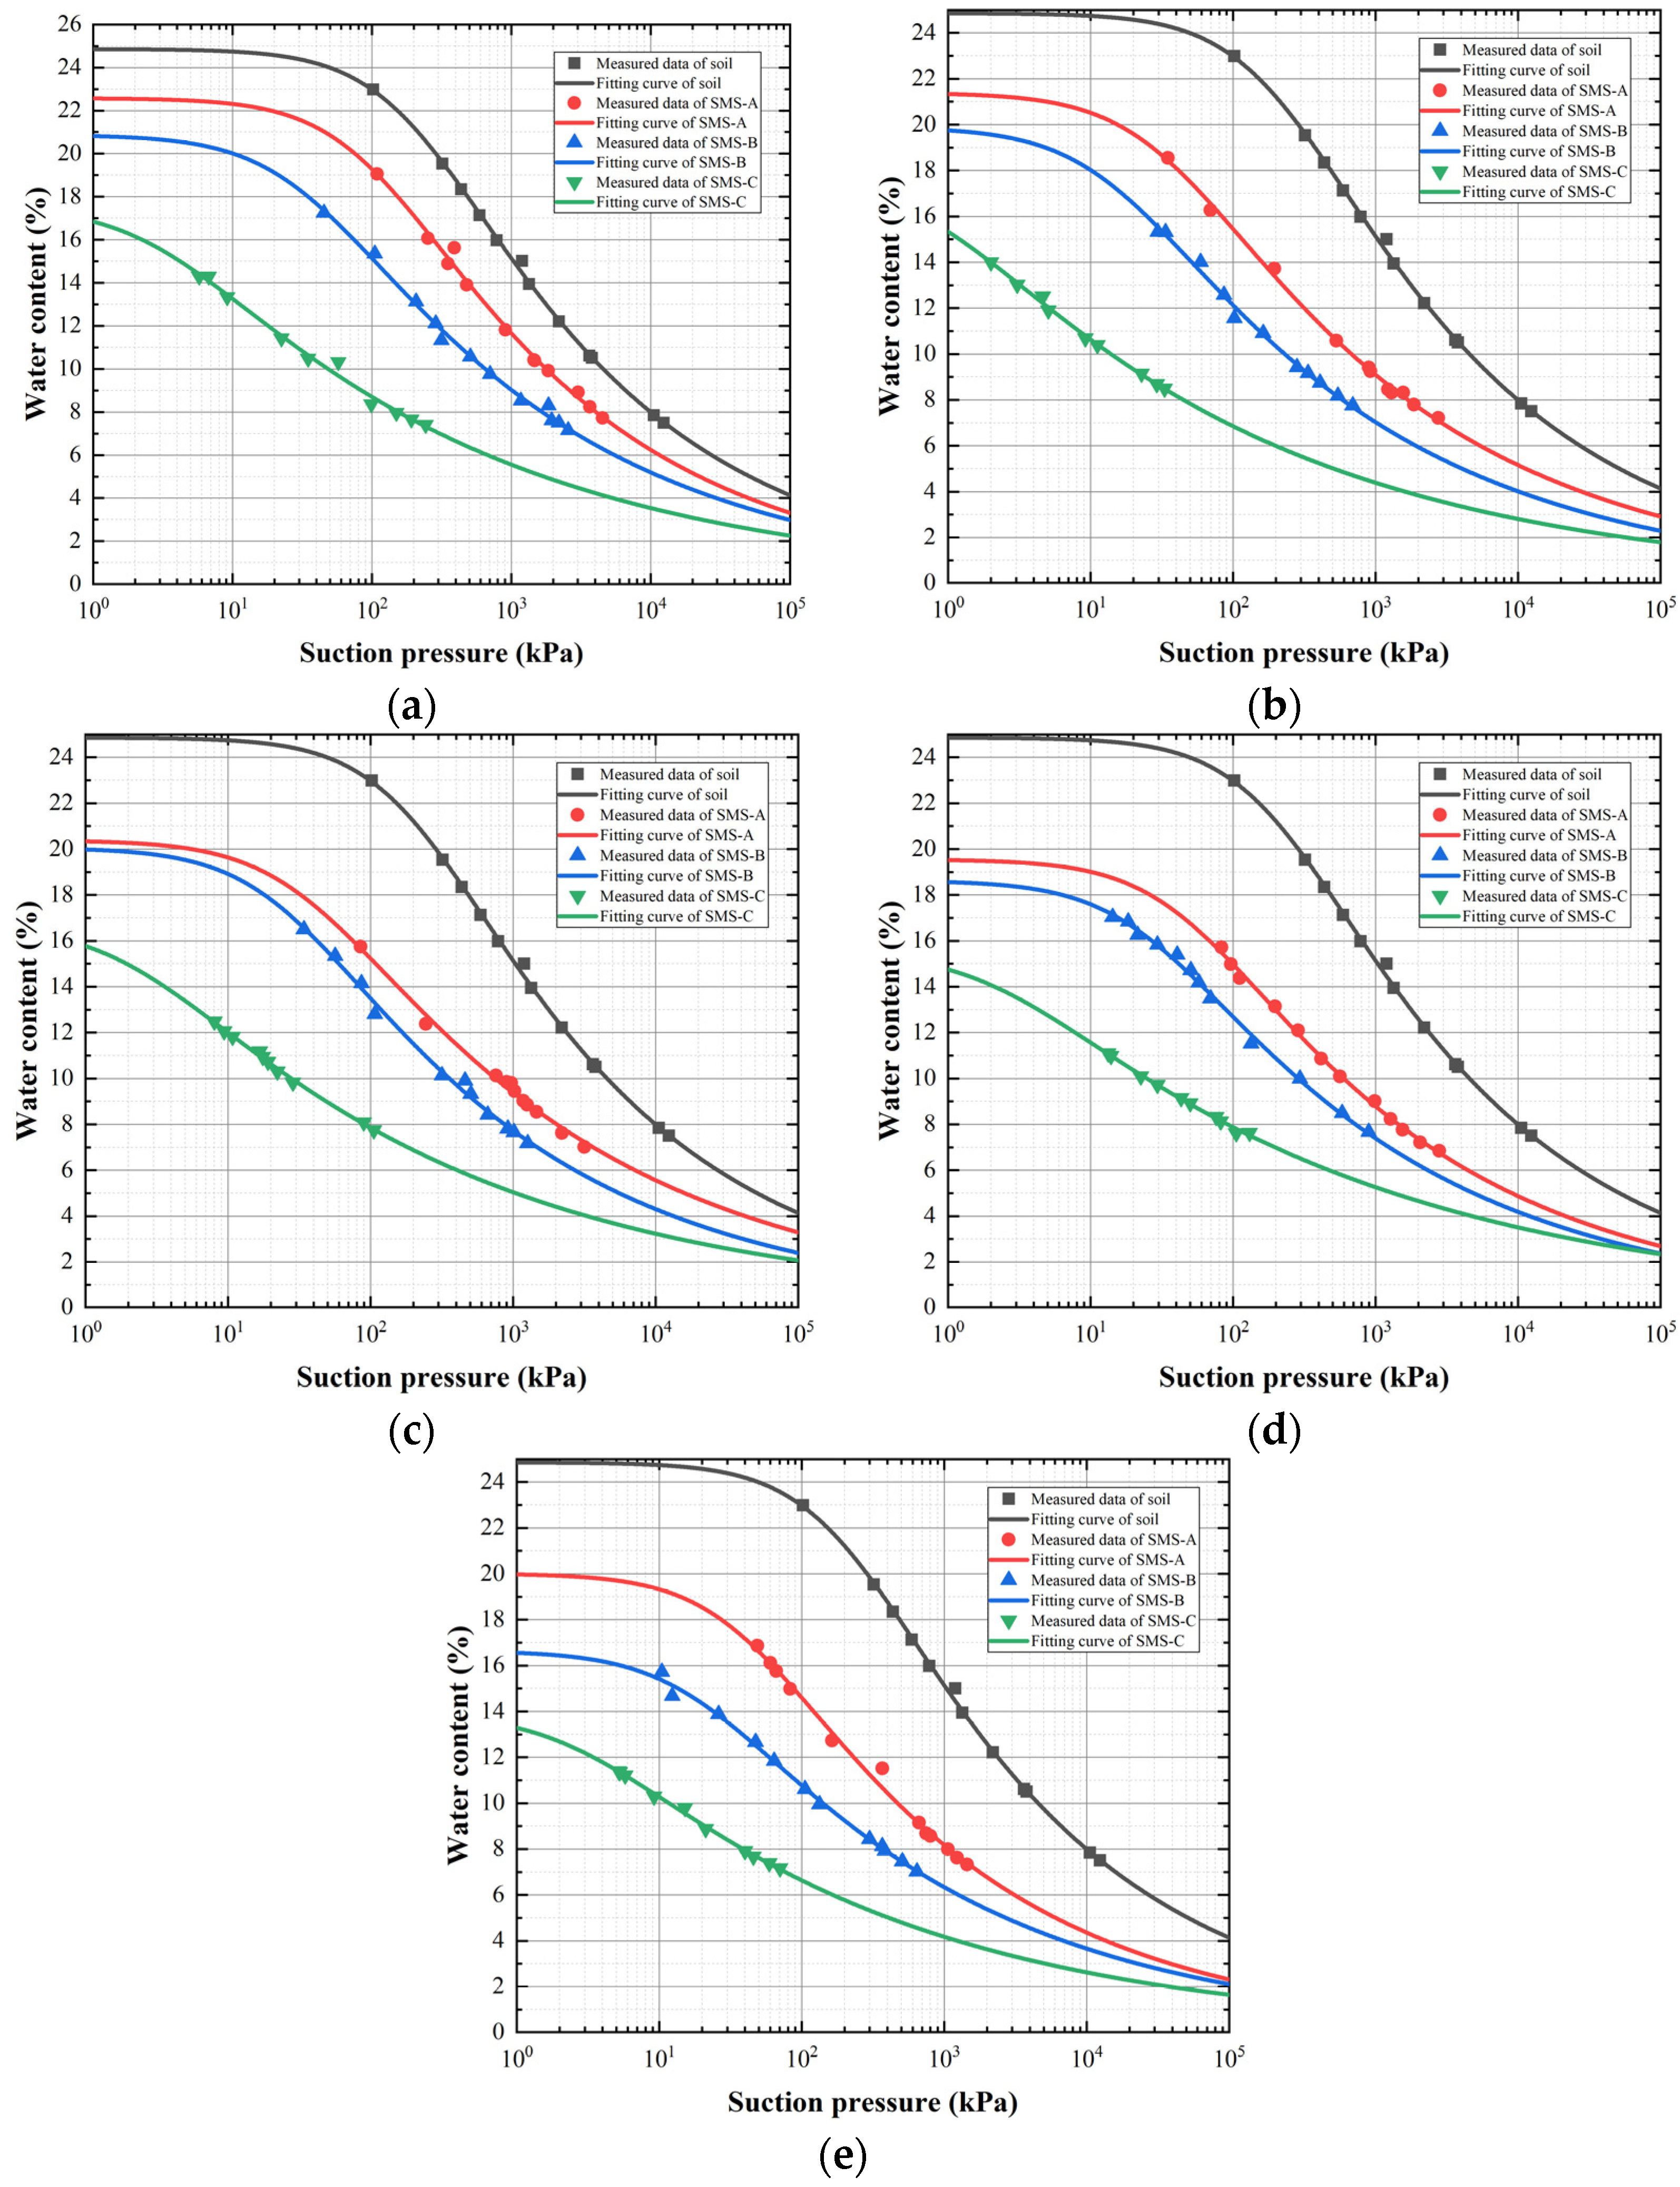
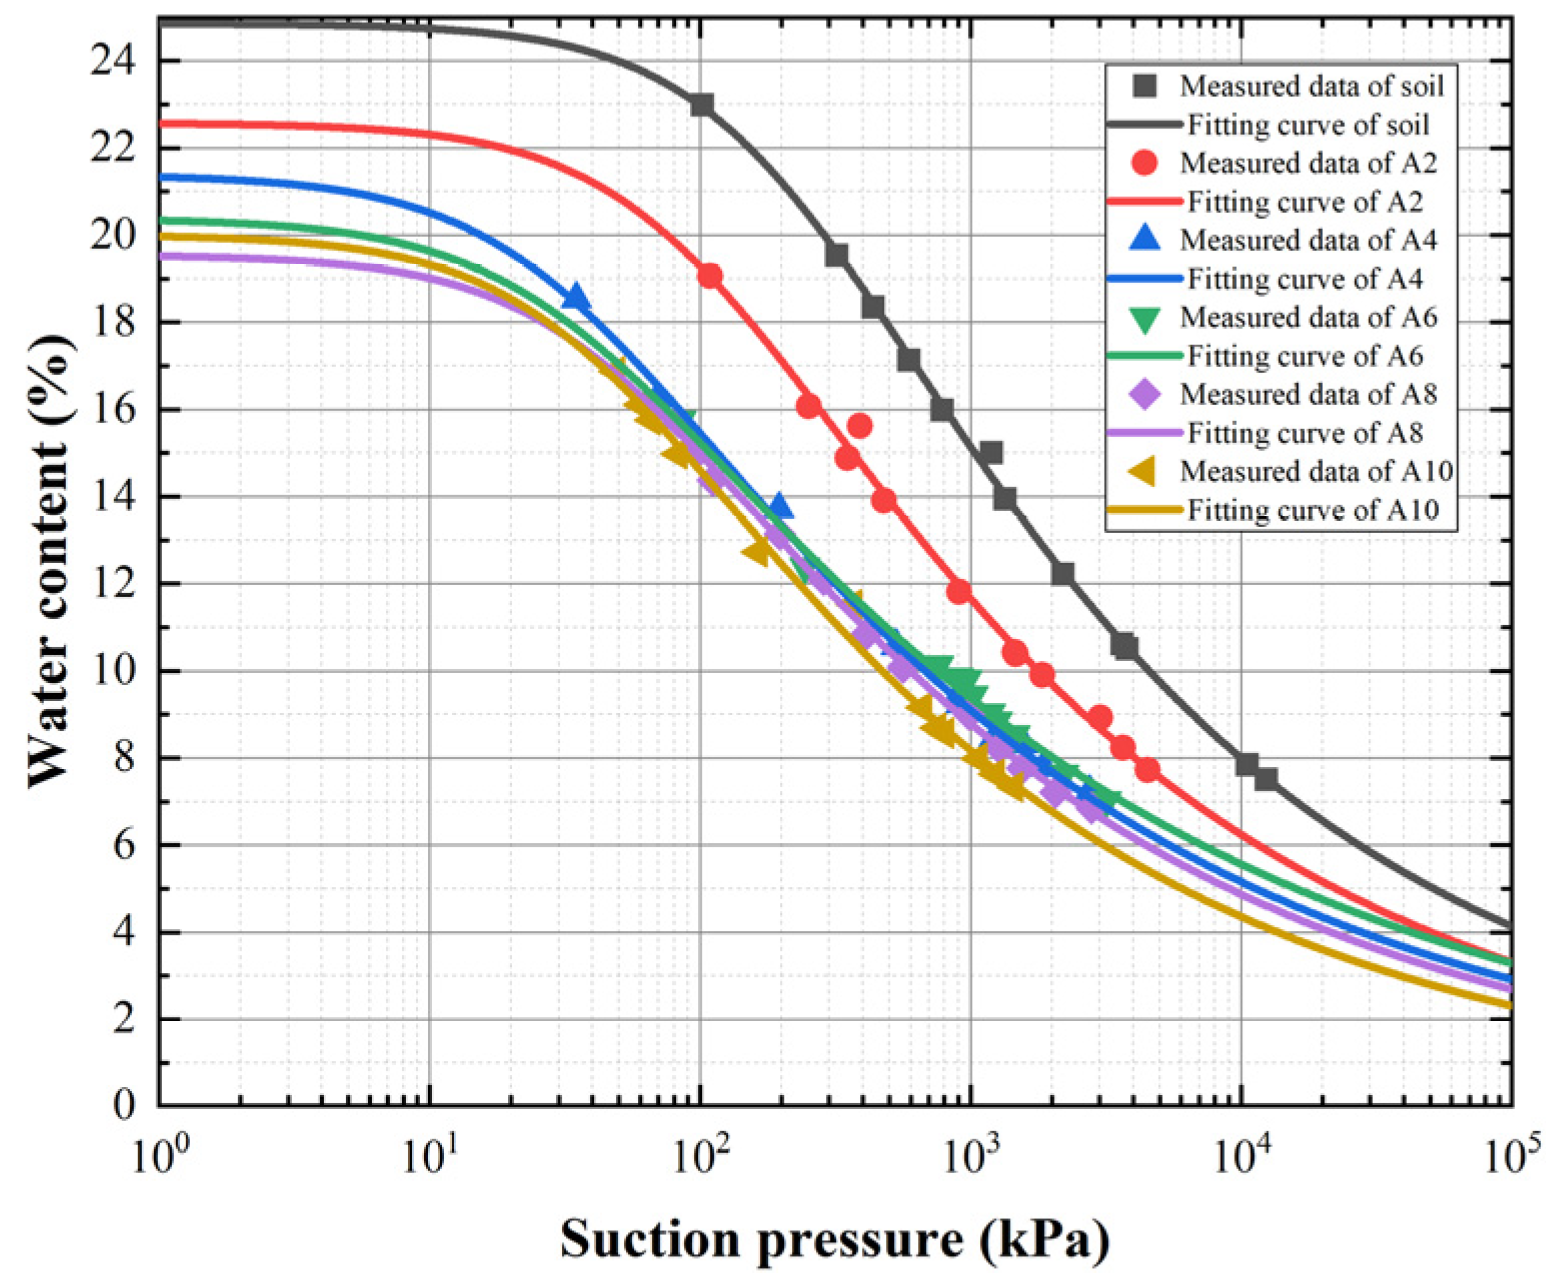
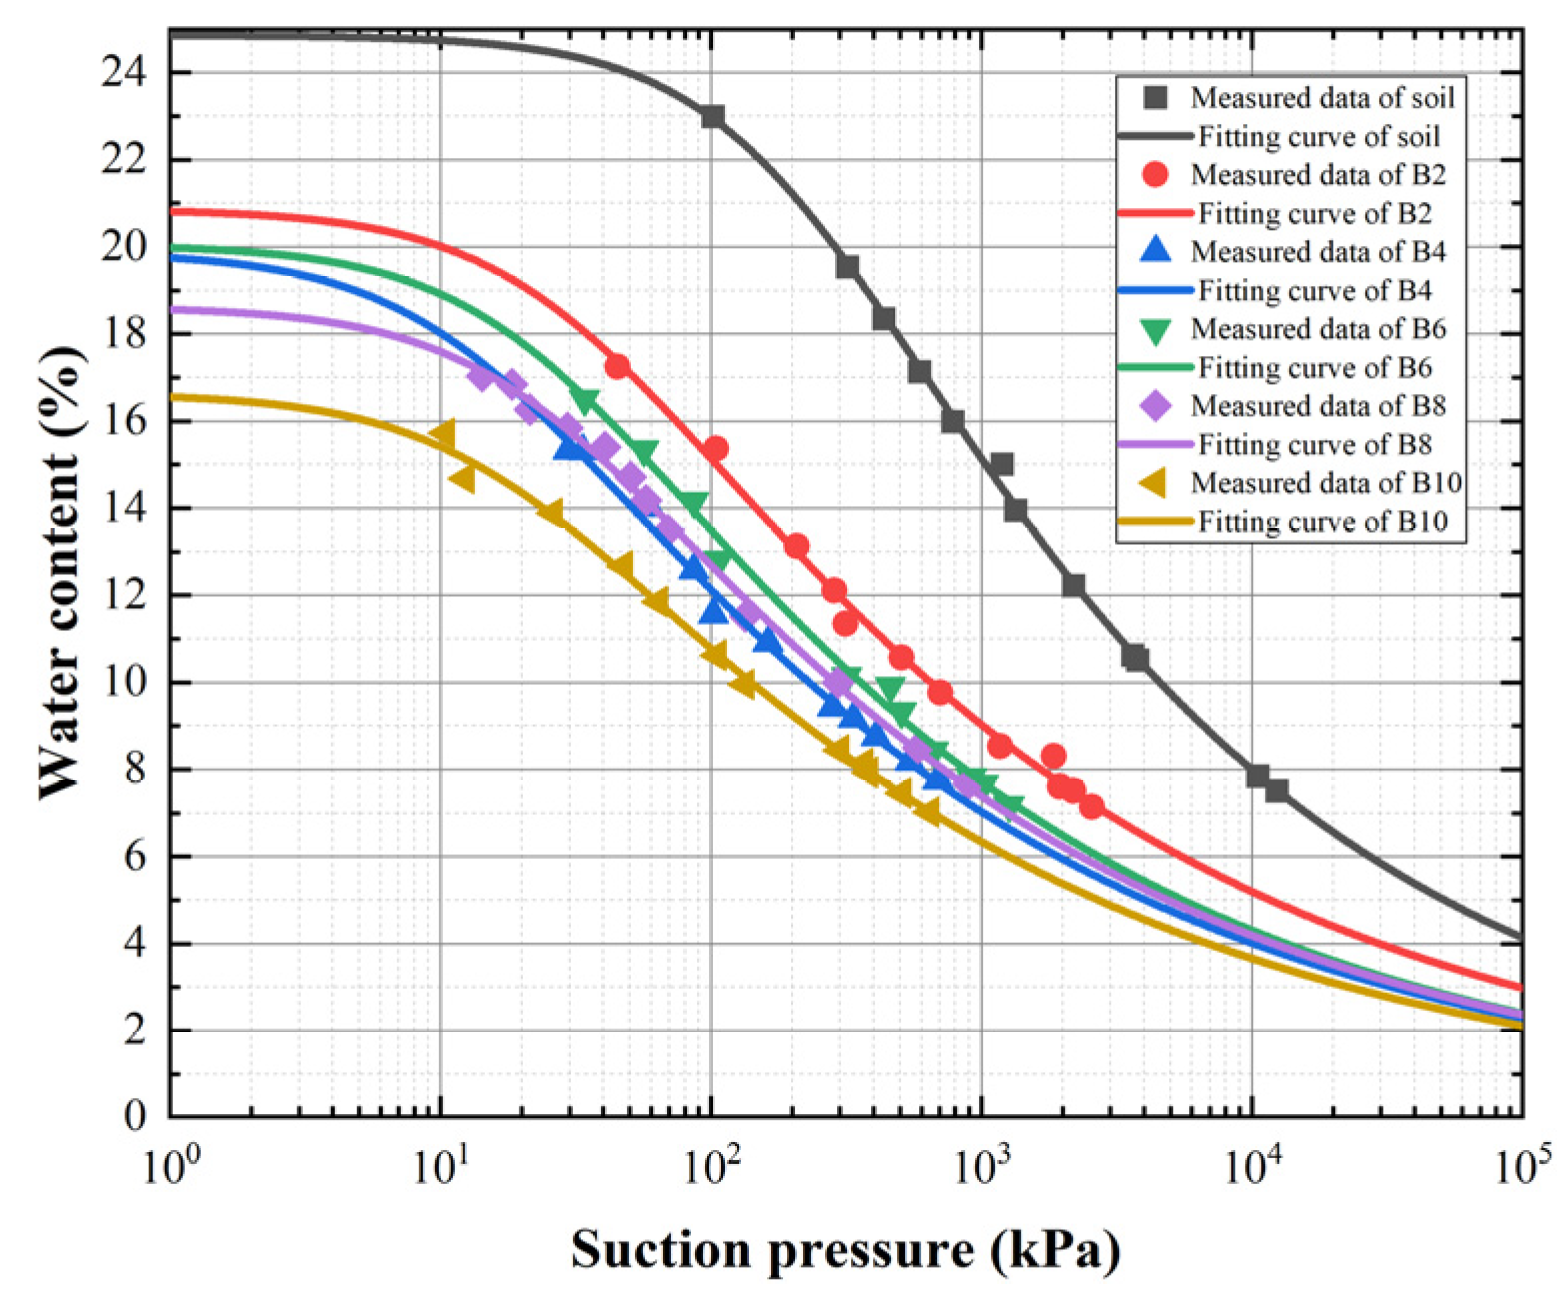
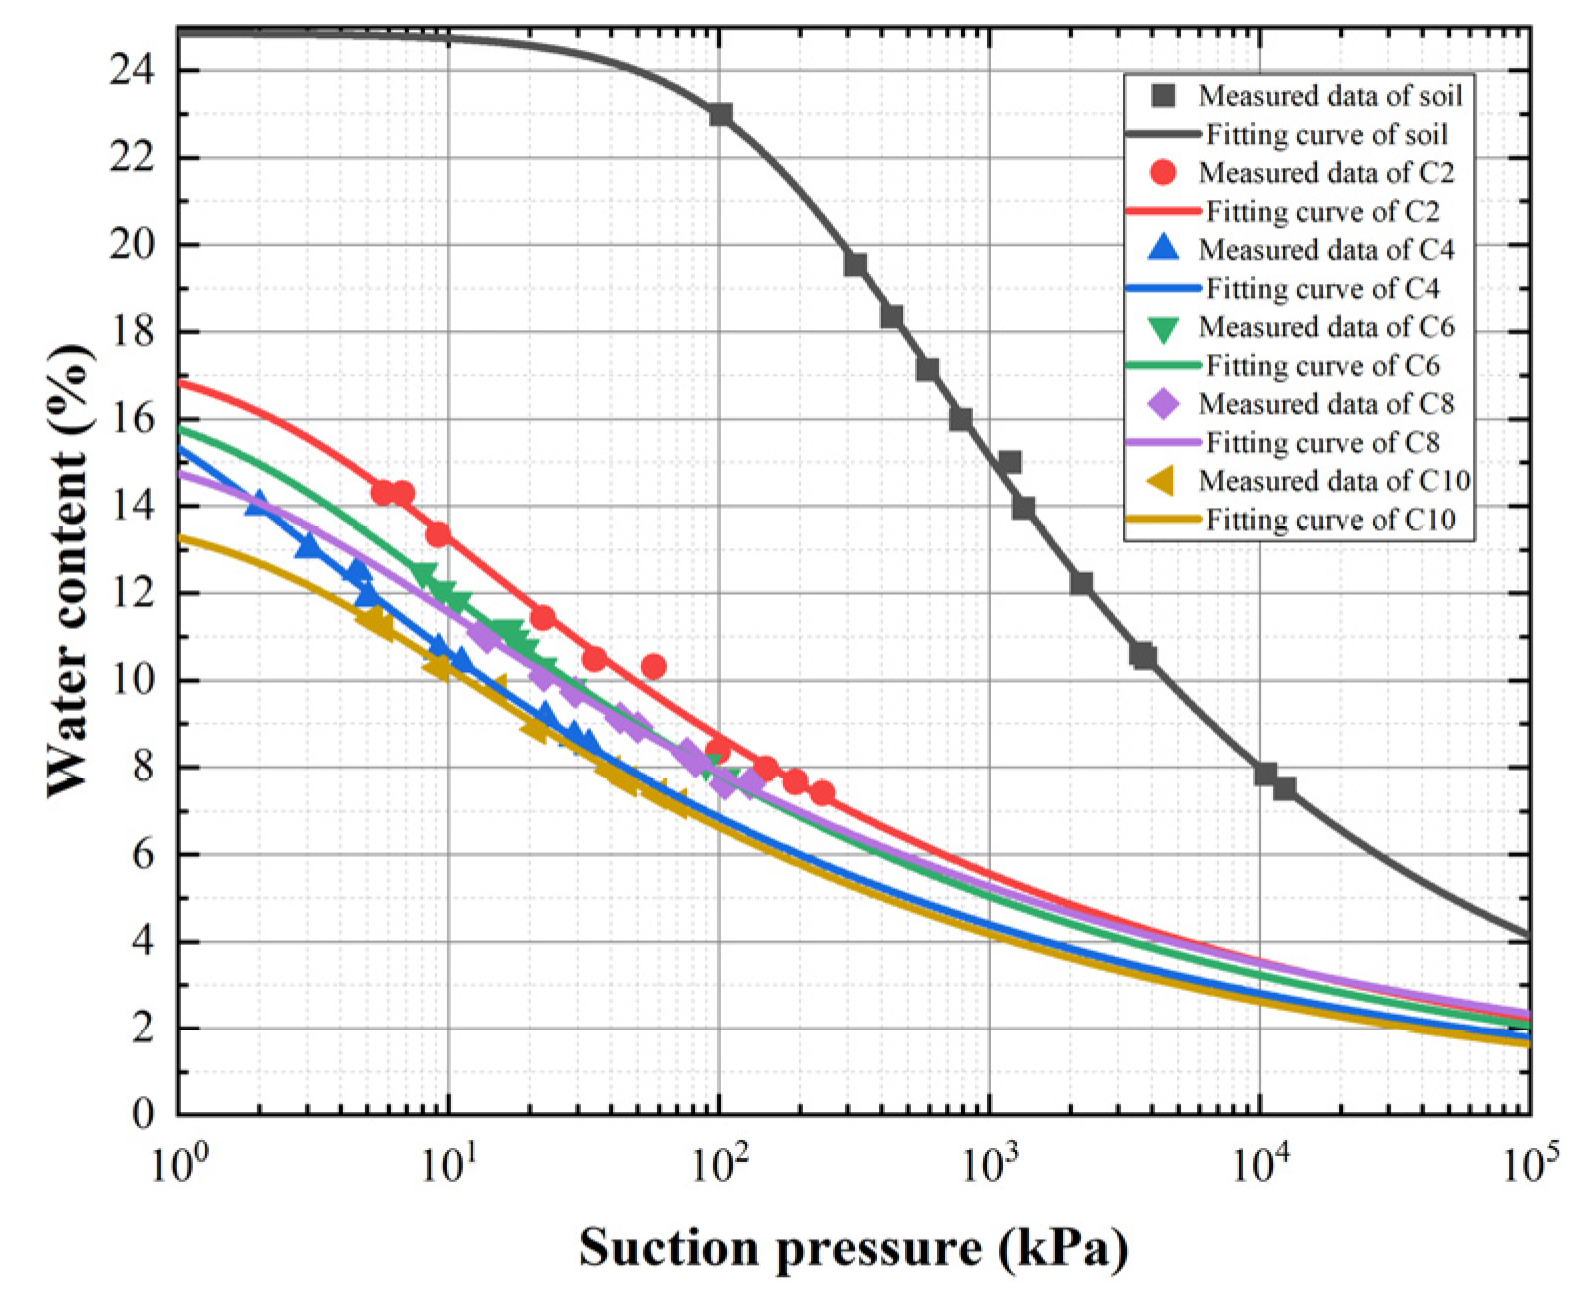
3.1. Fitting Results of Soil–Water Characteristic Curves

The model parameters are shown in Table 3.

3.2. Effect of Hydrophobicity on SWCCs

The soil–water characteristic curve of humidified samples after different hydrophobic treatments is shown in Figure 5. It can be seen from the figure that, when the matrix suction was the same, the amount of hydrophobic material and the action time had a significant effect on the reduction of soil moisture content. When the degree of hydrophobicity increased, the soil–water characteristic curve showed a downward trend, and, with the increase in matrix suction, the moisture content decreased. When the suction was about 100 kPa, the SWCC of the plain soil began to change significantly, and the moisture content of the soil after hydrophobic treatment was 24%–72% lower than that of the plain soil.
The SWCCs of the samples treated with different amounts of hydrophobic materials at the same action time are shown in Figure 5. It can be seen from the diagram that the moisture content of the sample before and after treatment decreased with the increase in matrix suction and showed an inverted ‘S’ shape; at the same time, under the same action time, with the increase in dosage, SWCC showed an obvious trend of shifting left. McQueen and Miller [53] divided SWCC into three sections: capillary action (0–102 kPa), water film adsorption (102–104 kPa), and solid adsorption (104–106 kPa); in the above suction sections, the main adsorption modes of pore water by soil are capillary action, film adsorption, and hydrogen bonding. The SWCC of the soil is modified by hydrophobic materials with the same action time and different amounts attached to the surface of the soil particles due to the formation of methyl silicate or polymethylsiloxane (Figure 6) after the reaction of hydrophobic materials in the capillary action section, resulting in enhanced hydrophobicity of the soil and a reduced air-entry value. Hence, the suction capacity of soil to pore water was reduced, i.e., the capillary force was reduced, and the pore water infiltrated the macropores under gravity. Therefore, in the capillary action section, with the increase in hydrophobic materials, the slight change in matrix suction also led to significant changes in water content. In the water film adsorption section and the solid adsorption section, the water adsorption capacity of the soil was enhanced, and the water existed in tiny pores. Therefore, in the water film adsorption section and the solid adsorption section, the moisture content of soil did not decrease sharply in the capillary adsorption section with the increase in matrix suction, even when the hydrophobic materials increased to a certain extent.
The images of SWCCs treated with the same amount of hydrophobic material at different times are shown in Figure 7, Figure 8 and Figure 9. It can be seen that, with the increase in action time, the SWCCs after hydrophobic treatment showed a trend of first decreasing and then increasing, before continuing to decline compared with the plain soil. There were several possible reasons. the test sample underwent a certain degree of volumetric deformation at the initial stage after hydrophobic and humidifying treatment, i.e., the internal pore development of the sample increased. In the early stage of treatment (2–4 h), the main component of hydrophobic materials, i.e., methyl sodium silicate, reacted with water and carbon dioxide to form methane-siliconic acid (CH3Si(OH)3) and sodium carbonate (Na2CO3) [46]; at this stage, due to the existence of hydrophobic groups, i.e., methyl groups, in methane-siliconic acid and the increase in pores, the matrix suction and SWCCs of soil showed a downward trend. In the middle of treatment (4–6 h), the change in volume of the sample caused by humidification stabilized. The dehydration polymerization of methane-siliconic acid resulted in the formation of water and polymethylsiloxane attached to the surface of soil particles through chemical bonds (Figure 6). The dense membrane structure [54] formed by polymethylsiloxane attached to the surface of soil particles changed the pore radius. The water generated in the dehydration polymerization process could adsorb a certain amount of pore water due to the effect of surface tension. Therefore, the matrix suction and SWCCs showed an upward trend at this stage. In the later stage of treatment (6–10 h), more polymethylsiloxanes were formed on the surface of soil particles in the sample, and a certain amount of water was accumulated. When the accumulated pore water could not be continued to be adsorbed, it infiltrated under the action of gravity [7]. Thus, the hydrophobic group composed of polysiloxane was exposed; soil matrix suction and SWCCs then showed a downward trend again.

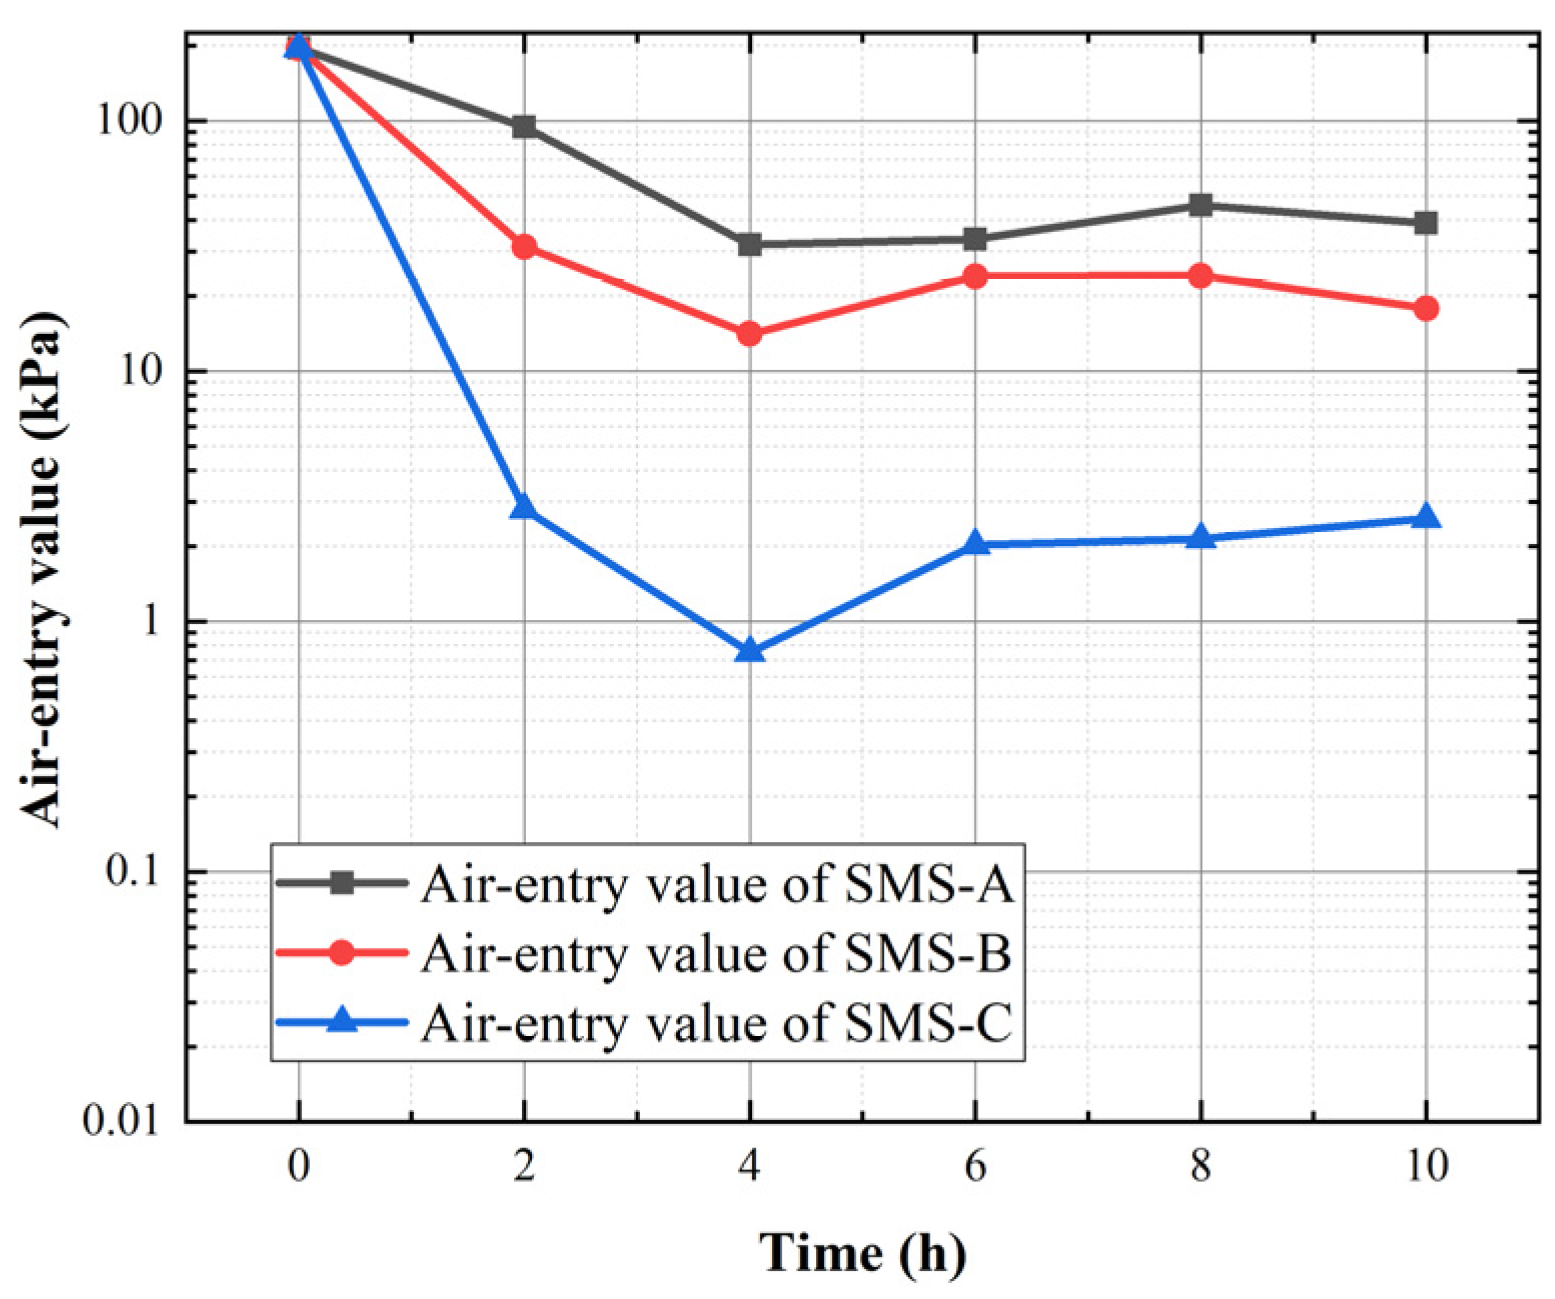
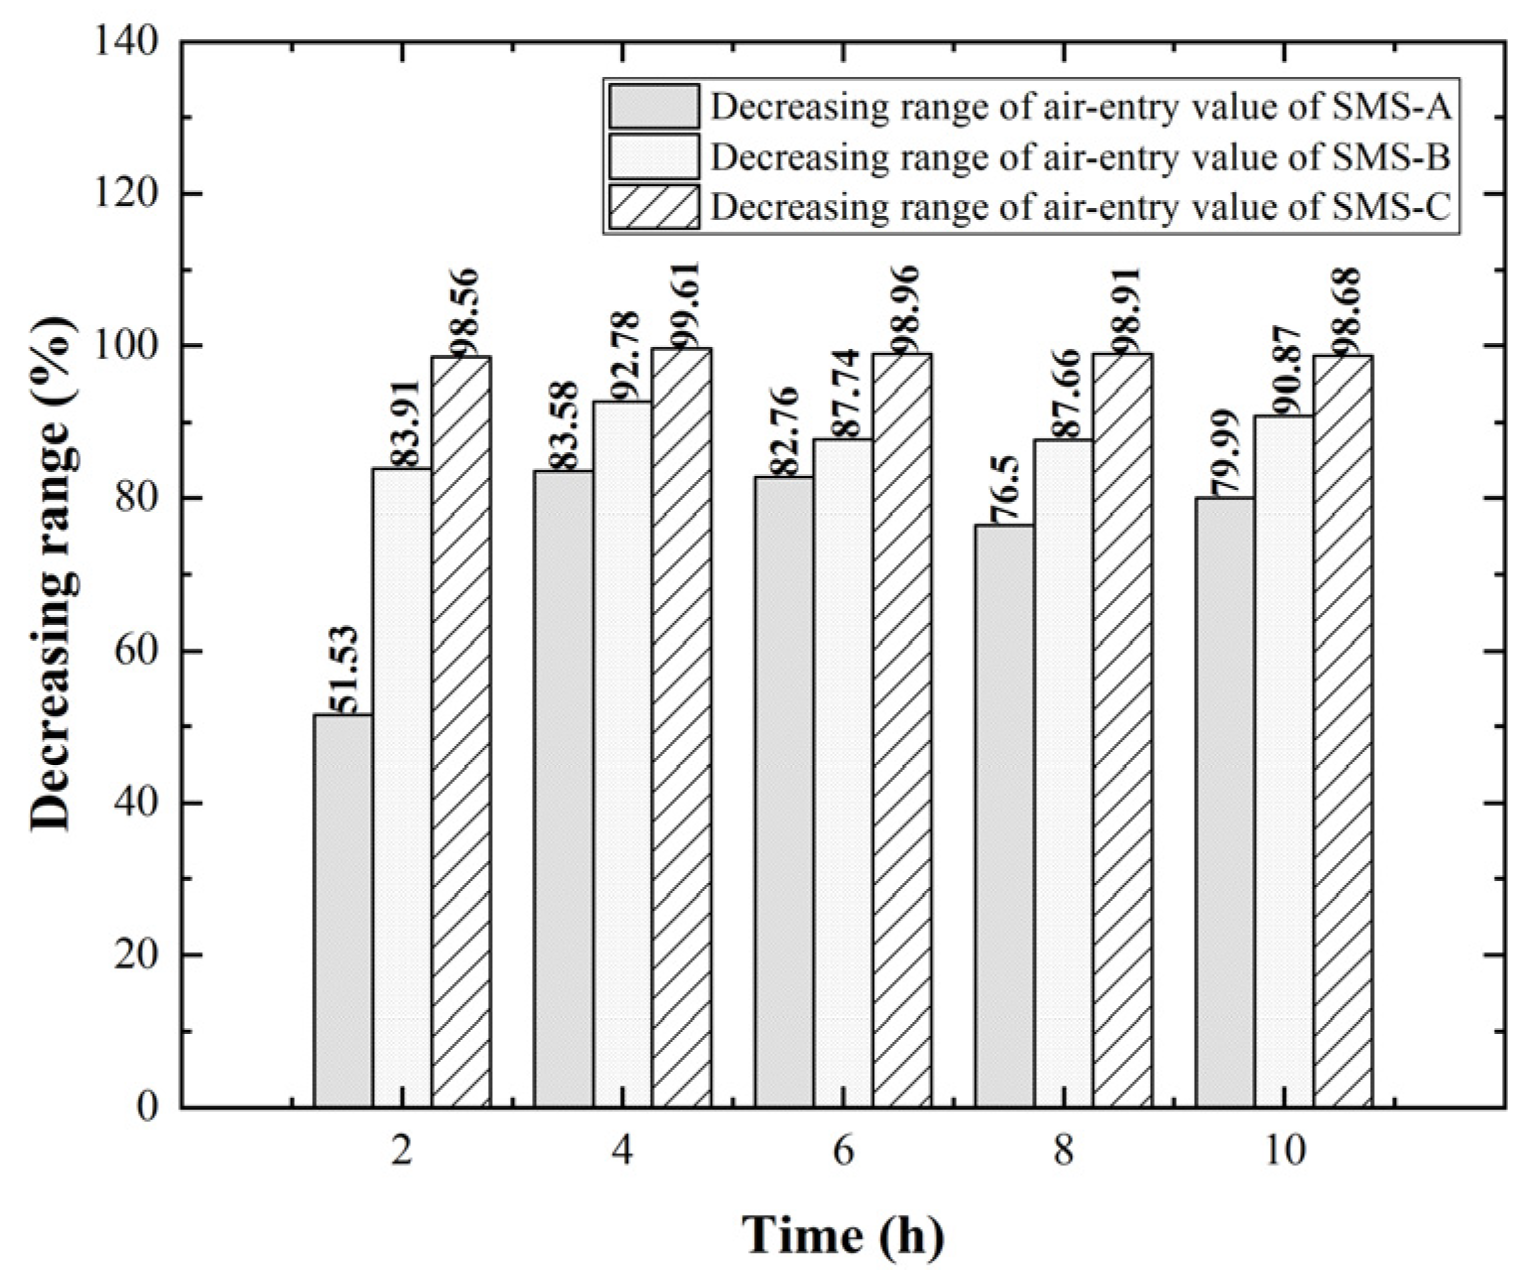
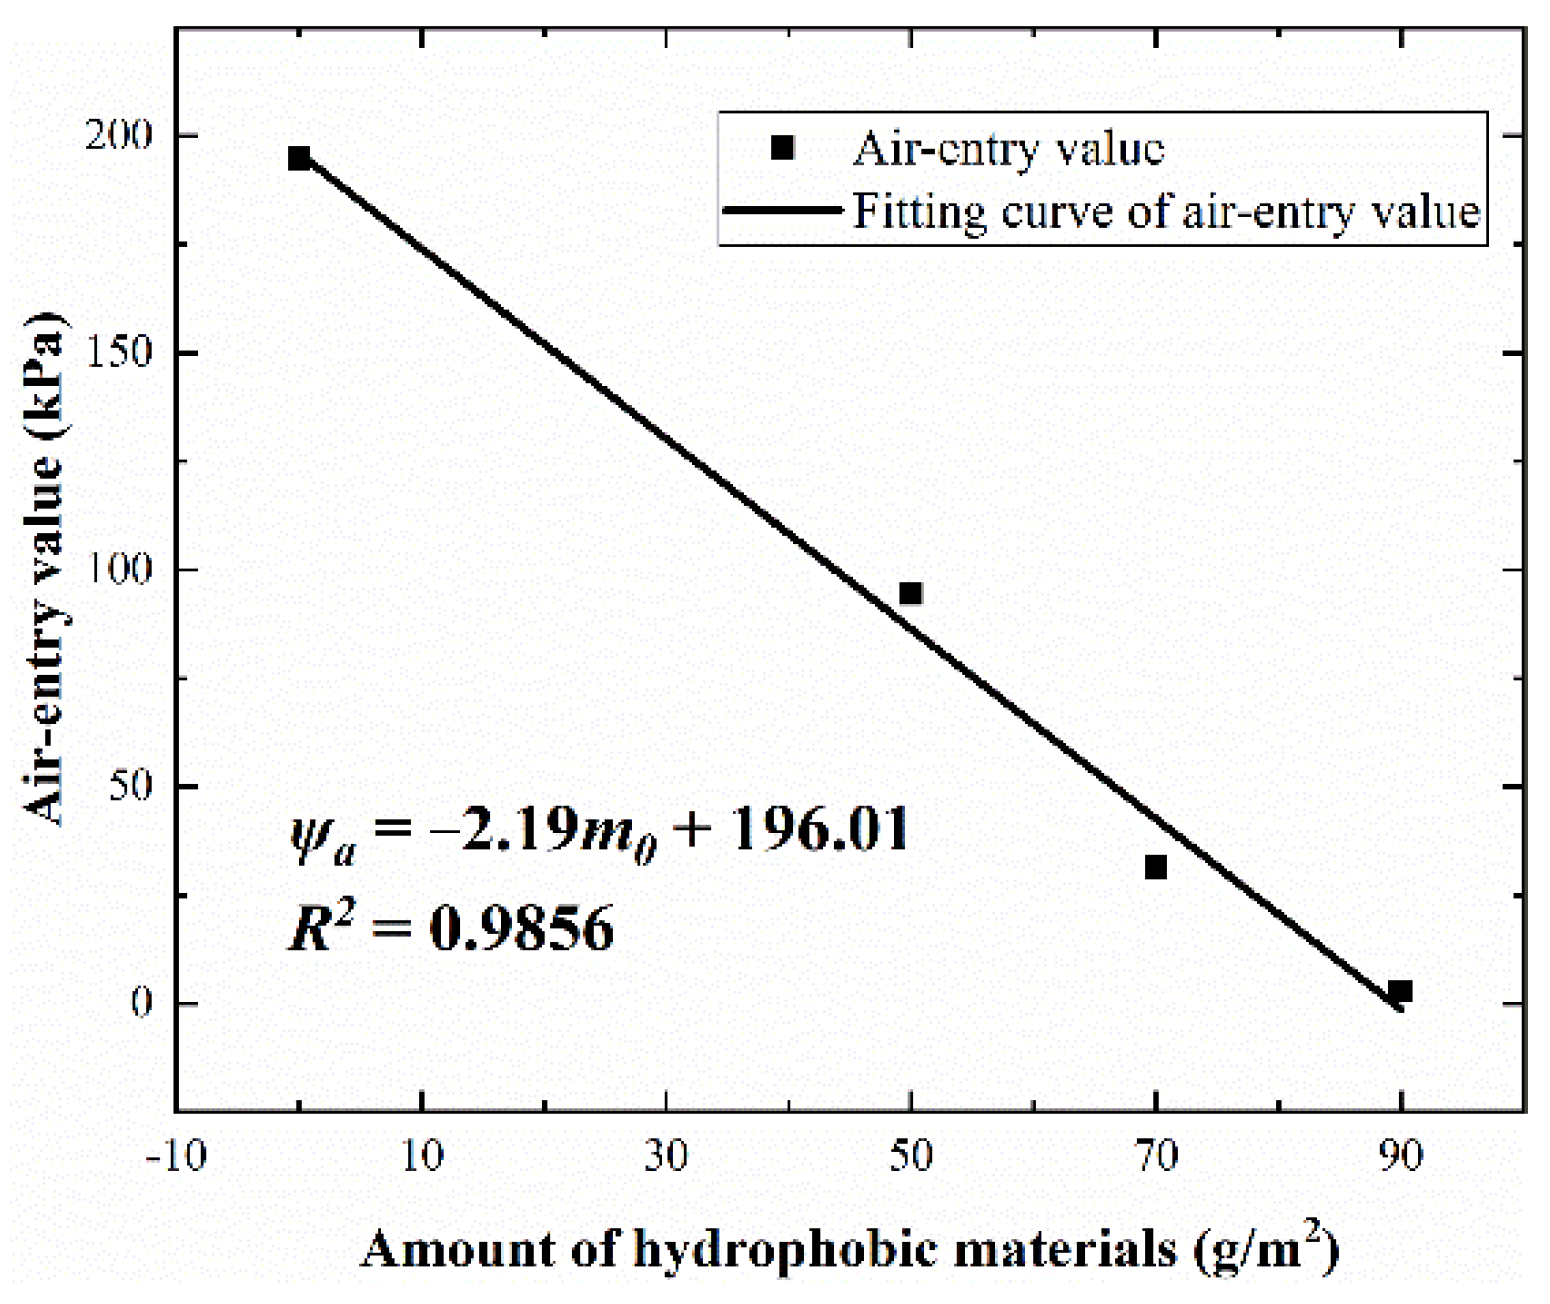
3.3. Effect of Hydrophobicity on Air-Entry Value

The air-entry value is the matrix suction value when air enters the pores between soil particles, and it is an important index to study the hydraulic characteristics of unsaturated soil. The value of α in the VG model can be approximately considered as the air-entry value. Figure 10 shows the variation curves of the logarithm of air-entry values of soils under different hydrophobic degrees. It can be seen from the figure that, under the same action time, the air air-entry value of soil decreased with the increase in the amount of hydrophobic material, which is similar to the research results of Lamparte [33]. However, it is contrary to the results of Huang et al. [43]. The reason is that the nano-aqueous adhesive (NAA) added by Huang in the soil did not have hydrophobicity, and the primary purpose of adding NAA was to improve the internal pore structure of the soil, reduce the inner pore, and increase the number of capillary pores. The reason for the changing trend of soil air-entry value after the same amount of hydrophobic material treated at different times is consistent with the analysis of the influence of time on SWCCs.
Figure 11 shows the decrease in the air-entry values of the soils after different hydrophobic treatments compared with that of the plain soil. As shown in the figure, under the same action time, with the increase in the dosage, the change rate of the decline in the air-entry value gradually decreased, while the change in air-entry value of soil treated with the same dosage and action times showed the same trend. Therefore, it was believed that, under the same dosage, the reaction of the active ingredient sodium methylsilicate in the hydrophobic material was nearly completed at 2 h, and the soil showed obvious hydrophobicity, while the change in its air-entry value was more obvious. This conclusion is similar to the conclusion obtained by Li Qiaozhen [46]. According to this selection, the relationship between the amount of hydrophobic material and the air-entry value of the soil under the action of 2 h was analyzed. The results are shown in Figure 12. From the figure, we can see that, when the hydrophobic material acted for 2 h, its dosage showed a linear relationship with the air-entry value, expressed as follows:
ψ a = 2.19 m 0 + 196.01 ,
where ψa is air-entry value (kPa), and m0 is amount of hydrophobic material per unit area (10−4 g/cm2).

3.4. Influence of Hydrophobic Degree on Saturated Permeability Coefficient

Table 4 is a summary table of the saturated permeability coefficients of soil after different hydrophobic treatments. Figure 13 shows the changing trend of saturated permeability coefficient of soil after different hydrophobic treatments. It can be seen that the saturated permeability coefficient of the sample after hydrophobic treatment was significantly reduced, and the changing trend was the same as that of the air-entry value. The saturated permeability coefficient generally showed a decreasing trend with the increase in material dosage and action time. After SMS-C10 treatment, the saturated permeability coefficient reached the minimum value of 0.5681 × 10⁻⁸ cm/s.
Under the same action time, the saturated permeability coefficient of soil decreased with the increase in the amount of hydrophobic material. Hydrophobic treatment was achieved by spraying hydrophobic water solution on the surface of the sample. Therefore, in the process of solution infiltration, this would lead to a tiny body change in the sample and increase the internal porosity [43]. When the action time was 2–4 h, the soil porosity increased, and the saturated permeability coefficient increased, but the hydrophobic membrane [54] covering the surface of the soil particles reduced the saturated permeability coefficient in a more intense form; hence, the saturated permeability coefficient showed a downward trend at this stage. When the action time was 4–6 h, the volumetric deformation of the sample was stabilized. At this stage, due to the formation of a certain amount of water in the reaction process of hydrophobic materials, the saturated permeability coefficient showed an increasing trend. In the later stage of the reaction (6–10 h), the reaction was close to completion. Due to the existence of a dense membrane structure, the saturated permeability coefficient displayed a downward trend again.
Figure 14 shows the decrease in saturated permeability coefficients compared with that of plain soil under different treatments. It can be seen from the figure that the decrease gradually increased with the increase in hydrophobicity, and the decrease range was 80.65%–98.23%. When the treatment method was SMS-C10, the decrease reached the maximum value.

3.5. Prediction of Unsaturated Permeability Coefficient

The unsaturated permeability coefficient is important for studying the seepage, settlement, and stability of unsaturated soil [51]. Therefore, many scholars devoted energy to the study and improvement of unsaturated permeability coefficient theory and measuring devices. Klute designed equipment for measuring the permeability coefficient using the steady-state test method, but it was challenging to measure drainage volume. Hamilton [55] used the transient profile method to measure the unsaturated permeability coefficient, but the control of variables in the test process was not suitable for the study of mechanical properties of soil. Until recent years, with the progress of science and technology, scholars at home and abroad on the determination of unsaturated permeability coefficient made significant breakthroughs, with their improved measurement devices able to simulate and measure the unsaturated permeability coefficient of soil under different engineering conditions. Nevertheless, there were still a series of problems in the direct measurement of the unsaturated permeability coefficient, with too long a test period in high-suction sections, measurement errors of drainage volume, and shrinkage of soil deformation in high-suction sections [56].
On the basis of the above factors, some scholars proposed indirect prediction methods of the unsaturated soil permeability coefficient, which can be roughly divided into empirical models such as the macro model and statistical models. The Childs and Collis-Geroge (CCG) model is a commonly used statistical model for predicting the unsaturated permeability coefficient using the SWCC, which has been improved and modified by scholars [57]. Some scholars compared the measured values of the unsaturated permeability coefficient with the calculated values of the CCG model. The results showed that the CCG model had higher goodness of fit [58].
The CCG model divides the SWCC into m fractions and calculates the permeability coefficient on the basis of the matrix suction corresponding to each fraction midpoint according to the pore size distribution. The specific formulas are as follows:
k ( θ ω ) i = k s k s c A d j = i m [ ( 2 j + 1 2 i ) ψ j 2 ] ,
i = 1, 2, 3, …, m,
k s c = A d j = i m [ ( 2 j + 1 2 i ) ψ j 2 ] ,  
i = 0,
A d = T s 2 ρ ω g 2 μ ω θ s p N 2 ,  
where k(θω)i is the permeability coefficient of volumetric water content (θω) at the midpoint of the i division (cm/s), ks is the saturated permeability coefficient measured using the variable-head permeability experiment (cm/s), ksc is the saturated permeability coefficient calculated (cm/s), Ad is a regulation factor (100 cm·kPa2/s), i is the number of equal points, j is counted from i to m, where m is the number of segments (m = 20), ψj is the matrix suction value corresponding to the j-th equipartition midpoint (kPa), Ts, ρω, and μω are surface tension of water (7.28 × 10⁻⁷ kN/cm), density of water (10−3 g/cm3), and absolute viscosity of water (1.01 × 10⁻⁷ N·s/m2), θs is the saturated volumetric moisture content (%), p is the interaction coefficient between pores of different radius (p = 2), N is the total number of discontinuities between θs and θl (N = s/(θsθl)), and θl is the minimum volumetric water content in SWCC (%).
Figure 15 describes the variation trend of unsaturated permeability coefficient with matrix suction after different hydrophobic treatments. It can be seen that, when the soil was transformed into the unsaturated state, the permeability coefficient changed significantly, i.e., it gradually decreased with the increase in matrix suction, presenting a specific linear relationship in the double-logarithmic coordinate system.
l g k i = a ( l g ψ j ) + b ,
where ki is unsaturated permeability (cm/s), ψj is matrix suction (kPa), and a and b are fitting parameters.
The fitting parameters are shown in Table 5, where it can be seen that the goodness of fit was better than 0.97. However, the fitting effect was poor in the low-suction section, because the soil was close to saturation, and the permeability coefficient changed slowly. Under the same matrix suction, the permeability coefficient of plain soil was higher than that of hydrophobic soil, and the ratio was up to 105. It can be seen from the permeability coefficient curve that the soil after hydrophobic treatment has good impermeability.

3.6. The Influence of Hydrophobic Materials on the Hydrophobicity of Soil

Since SWCC and the permeability coefficient are essential indicators for studying the hydraulic and mechanical properties of soil, the matrix suction and saturated permeability coefficient of soil treated with hydrophobic materials were measured in this paper. On this basis, the SWCC and unsaturated permeability coefficient of soil were fitted and predicted using the model. The experimental data and model parameters were further analyzed, and the conclusion that the soil treated with hydrophobic materials had a noticeable hydrophobic effect was obtained. With the increase in the dosage of hydrophobic materials, the saturated permeability coefficient, SWCC, and air-entry value showed a downward trend. With the increase in action time, the saturated permeability coefficient, SWCC, and air-entry value showed a trend of the first decreasing, then increasing, and finally decreasing again.

4. Conclusions

In order to clarify the influence of silicone hydrophobic material on the hydraulic characteristics and permeability characteristics of soil, the changes in the soil–water characteristic curve and saturated permeability coefficient of soil treated with different dosage and action time were studied, and the changes in the unsaturated permeability coefficient of soil treated with different treatment methods were discussed. The following conclusions could be drawn:
(1)
The soil–water characteristic curve of soil treated with silicone hydrophobic material decreased obviously. In other words, when the matrix suction was the same, the water content of the soil after hydrophobic treatment was significantly reduced, and, with the increase in the amount of silicone hydrophobic material, the decrease in water content was more obvious. When the matrix suction was 100 kPa, the water content of soil after hydrophobic treatment decreased by 24%–72% compared with that of plain soil.
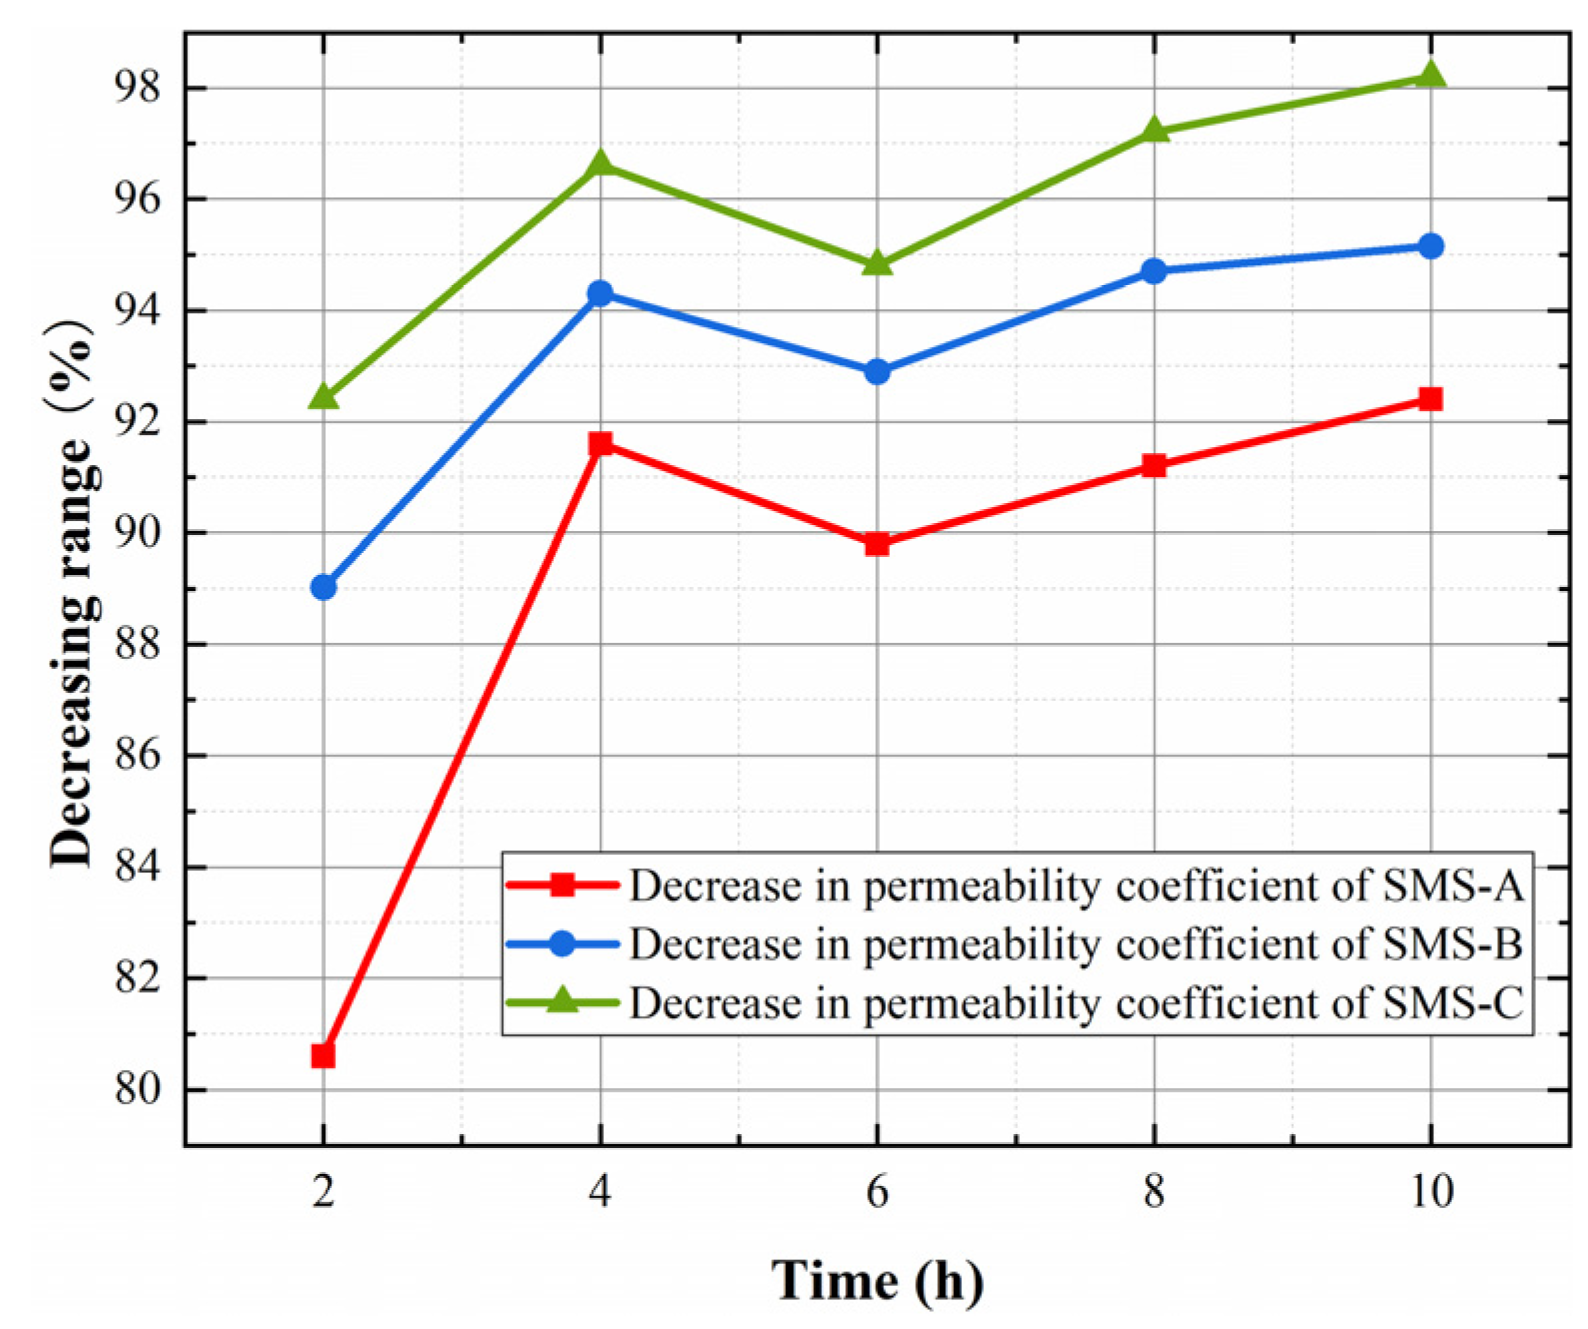
(2)
With the increase in the amount of silicone hydrophobic material, the water holding capacity of soil particles decreased; the maximum decrease in the saturated water content and air-entry value of soil is 44% and 98.96% respectively. When the action time was 2 h, the logarithm of the air-entry value was significantly negatively correlated with the amount of silicone hydrophobic material (correlation coefficient R2 = 0.9856). When the action time was 2 h, the amount of hydrophobic material increased from 0 to 50 g/m2, 70 g/cm2, and 90 g/m2, and the saturated permeability coefficient decreased by 80.6%, 89.02%, and 92.4%.
(3)
When the amount of hydrophobic materials was the same and the action time was different, the changes in the soil–water characteristic curve, saturated permeability coefficient, and air-entry value were mainly affected by the water generated during the reaction of hydrophobic materials, and the inflection points appeared at 4 h and 6 h.
(4)
The CCG model was used to predict the unsaturated permeability coefficient of soil with different hydrophobic treatments. The results show that the unsaturated permeability coefficient and the matrix suction were significantly negatively correlated in the double-logarithmic coordinate system (correlation coefficient R2 ≥ 0.97).

Author Contributions

X.L., H.Z., C.H., and X.S. designed the study; J.Z., G.Y., and Y.Z. analyzed the feasibility of the experiment; X.L., H.Z., Y.L., and B.C. analyzed the data; X.L., J.Z., and Z.L. collected the data; X.L. drafted the paper; Q.L. and C.H. proofread the manuscript. All authors have read and agreed to the published version of the manuscript.

Funding

This research was funded by the Chinese Fundamental Research Funds for the Central Universities, Grant No. 2572019BJ02.

Institutional Review Board Statement

Not applicable.

Informed Consent Statement

Not applicable.

Data Availability Statement

The data that support the findings of this study are available from the corresponding author upon reasonable request.

Acknowledgments

The authors thank Jian Zhao, Guohong Yin, Yuling Li, and Yuncui Zong for the financial support for this study.

Conflicts of Interest

The authors declare no conflict of interest.

References

  1. Weiming, L.; Zhiyong, L.; Cheng, D.; Zhuo, L. Study on Prediction Model of Dynamic Resilient Modulus of Cohesive Subgrade Soils Considering under Different Moisture. Highw. Eng. 2013, 38, 6–9, 48. [Google Scholar]
  2. Jin-Song, Q.; Jia-Yang, L.; Ding, Z.; Jian-Ming, L. Prediction model of resilient modulus for unsaturated clay soils considering the effect of matric suction. Rock Soil Mech. 2018, 39, 123–128. [Google Scholar] [CrossRef]
  3. Xin, Q.; Jin-Song, Q.; Shi-Zhou, Z. Research on prediction model of dynamic resilient modulus of subgrade soil based on matric suction. Hydrogeol. Eng. Geol. 2011, 38, 49–53, 58. [Google Scholar] [CrossRef]
  4. Arroyo, M.; Amaral, M.F.; Romero, E.; Fonseca, A. Isotropic yielding of unsaturated cemented silty sand. Can. Geotech. J. 2013, 50, 807–819. [Google Scholar] [CrossRef]
  5. Henry, K.S.; Holtz, R.D. Geocomposite capillary barriers to reduce frost heave in soils. Can. Geotech. J. 2001, 38, 678–694. [Google Scholar] [CrossRef]
  6. Henry, K.S.; Stormont, J.C.; Holtz, R.D. Geosynthetic capillary barriers in pavements. In Performance Confirmation of Constructed Geotechnical Facilities; University of Massachusetts: Amherst, MA, USA, 2000; pp. 350–364. [Google Scholar] [CrossRef]
  7. Junying, C.; Chang, L.; Lin, Z.; Youzhen, X.; Gillerman, L.; Hongyang, C. Impact of repellent levels on drainage soil water characteristic curve. Trans. Chin. Soc. Agric. Eng. (Trans. CSAE) 2017, 33, 188–193. [Google Scholar]
  8. Denmark, S.E.; Sweis, R.F. Cross-coupling reactions of organosilicon compounds: New concepts and recent advances. ChemInform 2003, 34, 1531–1541. [Google Scholar] [CrossRef]
  9. Mahedi, M.; Satvati, S.; Cetin, B.; Daniels, J.L. Chemically Induced Water Repellency and the Freeze-Thaw Durability of Soils. J. Cold Reg. Eng. 2020, 34, 04020017. [Google Scholar] [CrossRef]
  10. Ma, J.; Porath, L.E.; Haque, M.F.; Sett, S.; Rabbi, K.F.; Nam, S.; Miljkovic, N.; Evans, C.M. Ultra-thin self-healing vitrimer coatings for durable hydrophobicity. Nat. Commun. 2021, 12, 5210. [Google Scholar] [CrossRef]
  11. Liu, J.; Chen, Z.; Kanungo, D.P.; Song, Z.; Bai, Y.; Wang, Y.; Li, D.; Qian, W. Topsoil reinforcement of sandy slope for preventing erosion using water-based polyurethane soil stabilizer. Eng. Geol. 2019, 252, 125–135. [Google Scholar] [CrossRef]
  12. Daniels, J.L.; Hourani, M.S. Soil improvement with organo-silane. In Advances in Ground Improvement: Research to Practice in the United States and China; American Society of Civil Engineers: Orlando, FL, USA, 2009; pp. 217–224. [Google Scholar] [CrossRef]
  13. Daniels, J.L.; Hourani, M.S.; Harper, L.S. Organo-silane chemistry: A water repellent technology for coal ash and soils. In Proceedings; 2009 World of Coal Ash (WOCA) Conference: Lexington, KY, USA, 2009; pp. 4–7. [Google Scholar]
  14. Junhua, W.; Hui, L.; Xiaoyu, Z.; Yichao, D.; Song, Y. Measurement of shear strength and its change in unsaturated soils modified by hydrophobic agent. Trans. Chin. Soc. Agric. Eng. (Trans. CSAE) 2019, 35, 123–129. [Google Scholar]
  15. Zheng, S.; Lourenço, S.D.; Cleall, P.J.; Chui, T.F.M.; Ng, A.K.; Millis, S.W. Hydrologic behavior of model slopes with synthetic water repellent soils. J. Hydrol. 2017, 554, 582–599. [Google Scholar] [CrossRef]
  16. Qingjie, D.; Chunpeng, H. Experimental study on capillary water rise of subgrade soil under the action of organic silicon materials. Shanxi Archit. 2021, 47, 118–120. [Google Scholar] [CrossRef]
  17. Romero, E.; Della Vecchia, G.; Jommi, C. An insight into the water retention properties of compacted clayey soils. Géotechnique 2011, 61, 313–328. [Google Scholar] [CrossRef]
  18. Fredlund, D.G. State of practice for use of the soil-water characteristic curve (SWCC) in geotechnical engineering. Can. Geotech. J. 2019, 56, 1059–1069. [Google Scholar] [CrossRef]
  19. Fredlund, D.G.; Morgenstern, N.R.; Widger, R.A. The shear strength of unsaturated soils. Can. Geotech. J. 1978, 15, 313–321. [Google Scholar] [CrossRef]
  20. Gan, J.; Fredlund, D.; Rahardjo, H. Determination of the shear strength parameters of an unsaturated soil using the direct shear test. Can. Geotech. J. 1988, 25, 500–510. [Google Scholar] [CrossRef]
  21. Fang-Zhi, Z.; Xiao-Ping, C. Influence of repeated drying and wetting cycles on mechanical behaviors of unsaturated soil. Chin. J. Geotech. Eng. 2010, 32, 41–46. [Google Scholar]
  22. Brooks, R.H. Hydraulic Properties of Porous Media; Colorado State University: Fort Collins, CO, USA, 1965; pp. 2–27. [Google Scholar]
  23. Li-Zhou, W. Constitutive Model and Slope Stability Evaluation and Its Application for Unsaturated Expansive Soil. Ph.D. Thesis, Chengdu University of Techology, Chengdu, China, 2006. [Google Scholar]
  24. Brooks, R.H.; Corey, A.T. Hydraulic properties of porous media and their relation to drainage design. Trans. ASAE 1964, 7, 26–0028. [Google Scholar] [CrossRef]
  25. Gardner, W. Some steady-state solutions of the unsaturated moisture flow equation with application to evaporation from a water table. Soil Sci. 1958, 85, 228–232. [Google Scholar] [CrossRef]
  26. Van Genuchten, M.T. A closed-form equation for predicting the hydraulic conductivity of unsaturated soils. Soil Sci. Soc. Am. J. 1980, 44, 892–898. [Google Scholar] [CrossRef]
  27. McKee, C.; Bumb, A. Flow-testing coalbed methane production wells in the presence of water and gas. SPE Form. Eval. 1987, 2, 599–608. [Google Scholar] [CrossRef]
  28. Xue-Dong, Z.; Cheng-Gang, Z.; Guo-Qing, C.; Yan, L. Research on influence of soil density on soil-water characteristic curve. Rock Soil Mech. 2010, 31, 1463–1468. [Google Scholar] [CrossRef]
  29. Wheeler, S.; Sharma, R.; Buisson, M. Coupling of hydraulic hysteresis and stress–strain behaviour in unsaturated soils. Géotechnique 2003, 53, 41–54. [Google Scholar] [CrossRef]
  30. Wang, H.-M.; Ni, W.-K.; Li, X.; Li, L.; Yuan, K.-Z.; Nie, Y.-P. Predicting the pore size distribution curve based on the evolution mechanism of soil–water characteristic curve. Environ. Earth Sci. 2021, 81, 23. [Google Scholar] [CrossRef]
  31. Bauters, T.; Steenhuis, T.; DiCarlo, D.; Nieber, J.L.; Dekker, L.; Ritsema, C.; Parlange, J.-Y.; Haverkamp, R. Physics of water repellent soils. J. Hydrol. 2000, 231, 233–243. [Google Scholar] [CrossRef]
  32. Bauters, T.W.; Steenhuis, T.S.; Parlange, J.Y.; DiCarlo, D.A. Preferential flow in water-repellent sands. Soil Sci. Soc. Am. J. 1998, 62, 1185–1190. [Google Scholar] [CrossRef]
  33. Lamparter, A.; Bachmann, J.; Deurer, M.; Woche, S. Applicability of ethanol for measuring intrinsic hydraulic properties of sand with various water repellency levels. Vadose Zone J. 2010, 9, 445–450. [Google Scholar] [CrossRef]
  34. Diamantopoulos, E.; Durner, W.; Reszkowska, A.; Bachmann, J. Effect of soil water repellency on soil hydraulic properties estimated under dynamic conditions. J. Hydrol. 2013, 486, 175–186. [Google Scholar] [CrossRef]
  35. Czachor, H.; Doerr, S.; Lichner, L. Water retention of repellent and subcritical repellent soils: New insights from model and experimental investigations. J. Hydrol. 2010, 380, 104–111. [Google Scholar] [CrossRef]
  36. Tao, G.; Gu, K.; Zhong, C.; Chen, Y.; Lei, D.L.K.; Li, Z.X. The test and fitting analysis of Hunan clay soil–water characteristic curve in full suction range. Arab. J. Geosci. 2021, 14, 2501. [Google Scholar] [CrossRef]
  37. Yan, W.L.; Birle, E.; Cudmani, R.O. A simple approach for predicting soil water characteristic curve of clayey soils using pore size distribution data. MATEC Web Conf. 2021, 337, 02012. [Google Scholar] [CrossRef]
  38. Yang, S.; Zheng, P.Q.; Yu, Y.T.; Zhang, J. Probabilistic analysis of soil-water characteristic curve based on machine learning algorithms. IOP Conf. Ser. Earth Environ. Sci. 2021, 861, 062030. [Google Scholar] [CrossRef]
  39. Zhou, J.; Ren, J.; Li, Z. An Improved Prediction Method of Soil-Water Characteristic Curve by Geometrical Derivation and Empirical Equation. Math. Probl. Eng. 2021, 2021, 9956824. [Google Scholar] [CrossRef]
  40. Houston, S.L.; Houston, W.N.; Wagner, A.-M. Laboratory filter paper suction measurements. Geotech. Test. J. 1994, 17, 185–194. [Google Scholar] [CrossRef]
  41. Gardner, R. A method of measuring the capillary tension of soil moisture over a wide moisture range. Soil Sci. 1937, 43, 277–284. [Google Scholar] [CrossRef]
  42. Feuerharmel, C.; Gehling, W.; Bica, A. The use of filter-paper and suction-plate methods for determining the soil-water characteristic curve of undisturbed colluvium soils. Geotech. Test. J. 2006, 29, 419–425. [Google Scholar] [CrossRef]
  43. Huang, W.; Zhou, C.; Liu, Z.; Sun, H.; Du, J.; Zhang, L. Improving Soil-Water Characteristics and Pore Structure of Silty Soil Using Nano-aqueous Polymer Stabilisers. KSCE J. Civ. Eng. 2021, 25, 3298–3305. [Google Scholar] [CrossRef]
  44. Leong, E.C.; He, L.; Rahardjo, H. Factors affecting the filter paper method for total and matric suction measurements. Geotech. Test. J. 2002, 25, 322–333. [Google Scholar] [CrossRef]
  45. Deka, R.; Wairiu, M.; Mtakwa, P.; Mullins, C.; Veenendaal, E.; Townend, J. Use and accuracy of the filter-paper technique for measurement of soil matric potential. Eur. J. Soil Sci. 1995, 46, 233–238. [Google Scholar] [CrossRef]
  46. Qiaozhen, L. Improving Rainwater Harvesting Efficiency of Loess Soil with Organic Silicon Materials. Master’s Thesis, Northwest Sci-Tech University, Yanglin, China, 2004. (In Chinese). [Google Scholar]
  47. Qingjie, D. Experimental Study on Water Isolation Effect of Hydrophobic Material Subgrade Waterproof Layer under Freezing and Thawing Action. Master’s Thesis, Northeast Forestry University, Harbin, China, 2021. (In Chinese). [Google Scholar]
  48. Jianhong, C. Experimental Study on Soil-Water Characteristic Curve of Loess Using Filter Paper Method. Master’s Thesis, Chang’an University, Xi’an, China, 2017. (In Chinese). [Google Scholar]
  49. McQueen, I.S.; Miller, R.F. Calibration and evaluation of a wide-range gravimetric method for measuring moisture stress. Soil Sci. 1968, 106, 225–231. [Google Scholar] [CrossRef]
  50. Hamblin, A. Filter-paper method for routine measurement of field water potential. J. Hydrol. 1981, 53, 355–360. [Google Scholar] [CrossRef]
  51. Zhi-Xiang, T.; Zheng-Zhong, W.; Jian-Rui, G.; Hao-Yuan, J.; Quan-Hong, L.; Xiao-Dong, M. Experimental study on soil-water characteristic curve and permeability curve of white sandstone and mudstone in northern Xinjiang. Chin. J. Geotech. Eng. 2020, 42, 229–233. [Google Scholar]
  52. Xiao-Hui, T.; Wei, Y.; Meng-Fen, S.; Na, H. Experimental study and curve fitting of soil-water characteristic curve. Rock Soil Mech. 2013, 34, 51–56. [Google Scholar] [CrossRef]
  53. McQueen, I.S.; Miller, R.F. Approximating soil moisture characteristics from limited data: Empirical evidence and tentative model. Water Resour. Res. 1974, 10, 521–527. [Google Scholar] [CrossRef]
  54. Shuang-Hong, Z.; Bo, Y.; Wei, Z.; Shuang, L.; Gang, K. Composition and properties of methyl silicate/ silicate composite coatings. J. Mater. Eng. 2021, 49, 163–170. [Google Scholar]
  55. Hamilton, J.; Daniel, D.E.; Olson, R.E. Measurement of hydraulic conductivity of partially saturated soils. ASTM Spec. Tech. Publ. 1981, 746, 182–196. [Google Scholar] [CrossRef]
  56. Aimin, L. Experimental Study on Permeability of Unsaturated Soil and Mechanism of Saturation Infiltration. Ph.D. Thesis, Dalian University of Technology, Dalian, China, 2008. (In Chinese). [Google Scholar]
  57. Marshall, T. A relation between permeability and size distribution of pores. J. Soil Sci. 1958, 9, 1–8. [Google Scholar] [CrossRef]
  58. Roy, S.; Rajesh, S. Influence of confining pressure on water retention characteristics of compacted soil. Indian Geotech. J. 2018, 48, 327–341. [Google Scholar] [CrossRef]
Figure 1. Chemical structure of SMS.
Coatings 12 01424 g001
Figure 2. Preparation process of test samples: (a) diagram of sample; (b) sealed sample; (c) sample stored in sealed tanks.
Coatings 12 01424 g002
Figure 3. TST-55 penetrometer.
Coatings 12 01424 g003
Figure 4. Falling head permeability test.
Coatings 12 01424 g004
Figure 5. Changes in SWCCs after hydrophobic treatment with different dosages at the same time: (a) 2 h; (b) 4 h; (c) 6 h; (d) 8 h; (e) 10 h.
Coatings 12 01424 g005
Figure 6. Reaction process of SMS with H2O and CO2 and bond diagram with soil.
Coatings 12 01424 g006
Figure 7. Changes in SWCCs under different action times of SMS-A.
Coatings 12 01424 g007
Figure 8. Changes in SWCCs under different action times of SMS-B.
Coatings 12 01424 g008
Figure 9. Changes in SWCCs under different action times of SMS-C.
Coatings 12 01424 g009
Figure 10. Logarithmic variations of air-entry values of soil after different hydrophobic treatments (the air-entry value at 0 is the air-entry value of plain soil).
Coatings 12 01424 g010
Figure 11. Decreases in air-entry values of soil with different hydrophobic treatments.
Coatings 12 01424 g011
Figure 12. Fitting curve of air-entry value after hydrophobic treatment with different dosages in 2 h.
Coatings 12 01424 g012
Figure 13. Changes in permeability coefficient of soils after different hydrophobic treatments.
Coatings 12 01424 g013
Figure 14. Decrease in permeability coefficients of soils after different hydrophobic treatments.
Coatings 12 01424 g014
Figure 15. Fitting curves of unsaturated permeability coefficients of soils after different hydrophobic treatments: (a) the permeability coefficients and fitting curves of SMS-A under different times; (b) the permeability coefficients and fitting curves of SMS-B under different times; (c) the permeability coefficients and fitting curves of SMS-C under different times.
Coatings 12 01424 g015
Table 1. Basic physical properties of soil and standard deviation (the numbers in brackets are the standard deviations of corresponding indicators).
Natural Water Content
w (%)
Liquid Limit
wL (%)
Plastic Limit
wP (%)
Plasticity Index
Ip (%)
Optimum Moisture Content
w (%)
Maximum Dry Density
ρd (g/cm3)
24.6 (0.45)30.7 (0.35)19.0 (0.17)11.713.341.91
Table 2. Dosage and action time of hydrophobic material.
Soil TypeAmount of Hydrophobic Material
(g/m2)
Amount of Hydrophobic Material Solution
(g)
Weight of Hydrophobic Material in Solution
(g)
Action Time
(h)
Plain soil0000
SMS-A2501.50.152
SMS-A44
SMS-A66
SMS-A88
SMS-A1010
SMS-B2700.212
SMS-B44
SMS-B66
SMS-B88
SMS-B1010
SMS-C2900.272
SMS-C44
SMS-C66
SMS-C88
SMS-C1010
Table 3. Parameter summaries of VG model under different hydrophobic treatments.
Soil TypeSaturated Water Content
ω s (%)
α
(kPa)
n R 2
Plain soil24.86194.891.28750.9983
SMS-A222.5894.471.27550.9916
SMS-A421.3932.001.24750.9970
SMS-A620.3933.691.22800.9892
SMS-A819.5545.791.25780.9971
SMS-A1020.0139.001.27480.9921
SMS-B220.8731.361.24120.9925
SMS-B419.8914.071.24370.9918
SMS-B620.0623.891.25480.9922
SMS-B818.6324.051.24750.9957
SMS-B1016.6417.791.23920.9950
SMS-C217.562.811.19590.9874
SMS-C417.670.751.19370.9946
SMS-C616.712.021.19320.9946
SMS-C815.532.131.17590.9947
SMS-C1013.922.581.20190.9951
Table 4. Summary table of permeability coefficients of soils under different hydrophobic treatments (×10−8 cm/s).
Time (h)246810
Dosage (g/m2)
032.01132.01132.01132.01132.011
506.19312.68223.25922.81632.4425
703.51601.82802.27141.70511.5532
902.42911.09831.67260.89220.5681
Table 5. Parameters of fitting curves of unsaturated permeability coefficients after different hydrophobic treatments.
Soil TypeabR2
Plain soil−2.17−3.020.97
SMS-A2−2.16−4.870.97
SMS-A4−2.16−6.130.98
SMS-A6−2.16−5.880.98
SMS-A8−2.16−6.30.98
SMS-A10−2.16−6.280.98
SMS-B2−2.15−6.400.98
SMS-B4−2.15−7.700.98
SMS-B6−2.15−7.130.98
SMS-B8−2.15−7.560.98
SMS-B10−2.15−8.30.98
SMS-C2−2.13−9.980.99
SMS-C4−2.12−11.640.99
SMS-C6−2.24−10.870.98
SMS-C8−2.12−11.490.99
SMS-C10−2.12−12.110.99
Publisher’s Note: MDPI stays neutral with regard to jurisdictional claims in published maps and institutional affiliations.

