
The Photocatalytic Performance of Ag-Decorated SiO2 Nanoparticles (NPs) and Binding Ability between Ag NPs and Modifiers


Department of Resources Engineering, National Cheng Kung University, No.1, Daxue Rd., East Dist., Tainan 70101, Taiwan
*
Authors to whom correspondence should be addressed.
Coatings 2022, 12(2), 146; https://doi.org/10.3390/coatings12020146
Submission received: 27 December 2021
/
Revised: 24 January 2022
/
Accepted: 25 January 2022
/
Published: 26 January 2022
(This article belongs to the Special Issue Surface Chemical Modification II)
Abstract
:This study demonstrates a method for synthesizing Ag-decorated SiO2 NPs, which combined surface modification and electroless plating. The binding ability between the Ag NPs and modifiers was also investigated for the first time. The resulting products were characterized by electron microscopy and a UV–Visible spectrophotometer, which confirmed that OH− modified composite has the most uniform coating of Ag NPs and the largest Ag elemental composition. The efficiency of degrading methylene blue (MB) under visible light for 60 min was above 99%. The normalized reaction constant also confirmed the experimental results. In brief, this study verifies an optimal surface modifier of the binding ability with Ag NPs and the feasibility of this structure to effectively absorb the solar spectrum and further apply it to the photodegradation reaction.
1. Introduction
The metal-decorated dielectric structure (or so called dielectric-metal core-shell structure) can be extensively applied in optical [1,2], electrical [3,4], catalytic [5,6,7], and magnetic [8] domains due to its particular properties and potential. Among them, the most abundant dielectric material in the crust is silica. Silica, a dielectric material with high thermal stability, inertness, excellent electrical properties, and low dielectric loss (DF, dissipation factor), is often used as the core of decorative metals [9,10,11,12,13], or as a shell for stable metal NPs [13,14,15]. Therefore, metal NPs are also decorated on the SiO2, or precious metals like gold and silver. When they exist on the surface of SiO2, an interesting phenomenon called surface plasmon resonance (SPR) will occur. The reason is that the free electrons on the metal surface can drive their oscillations under the excitation of electromagnetic waves (e.g., optical wave) with frequency ω and amplitude E. The periodic oscillation will cause the instantaneous charge separation in the metal particles, and then produce the induced dipole superposed on it. The consequence is to produce an increase in the electric field near the metal-dielectric medium surfaces, which is produced by the superposition of the incident and induced electric fields due to the presence of the metal particles [16]. This phenomenon is widely used in photocatalysis, and further applied in the decolorization of dyes [17].
Organic dyes released by the textile industry are environmentally harmful substances that cause eutrophication and pollution, harming water quality and ecosystems. As one of these organic dyes, methylene blue (MB) is an organic basic cationic dye used in the textile industry for cotton, wool, and silk [18,19]. However, its complex organic aromatic structure [20], has high stability to various physical and chemical conditions. This makes MB challenging to degrade by traditional wastewater treatment processes. Among many solutions, photocatalysis is an advantageous method to solve this issue due to its high efficiency, environmental protection, low cost, and reusability.
However, there are numerous silanol groups (-Si-O-H) on the surface of silica, it is in neutral or alkaline media, and the surface is negatively charged (isopotential point is about pH 2–3). Thus, it is difficult to adsorb metal NPs with a surface being negatively charged. Before metal NPs deposition on SiO2, the matrix needs to be modified. Some reports [12,21,22,23,24,25] mentioned that various silane coupling agents are used. The silane coupling agent is an organosilicon compound, which contains two groups of different chemical properties in the molecule at the same time, one of which is a hydrolysis group, including an alkoxy group, vinyl, etc., and the other end has NH2, SH, COOH, CH3, and other functional groups. Because the silanes group easily forms a covalent bond with the alkoxy group at the one end, the other end has a reactive functional group. It can effectively capture metal NPs and make them adhere to the SiO2. Lu Zhang et al. have used amine-terminated silane coupling agents 3-aminopropyltriethylsilane (APTES) and 3-aminopropyltrimethoxysilane (APTMS) to increase the binding ability of the surface of silica to metal NPs [12,21]. Toshio SAKAI et al. used thiol-terminated coupling. (3-mercaptopropyl)trimethoxysilane (MPTMS), mercaptopropyltriethoxy-silane (MPTES), which causes the surface of the dielectric to more easily adsorb metal NPs or adsorb o-phthaldialdehyde (OPA) to determine various biogenic amines [22,23,24]. Other reports also applied positively charged Sn+ to sensitive silica and reduced metal from ions into atoms [13,25]. These reports confirm that SiO2 surface modification is effective and feasible. However, reports about selecting the types of metal NPs by functional groups or ionic bonds are rare.
In this report, the Ag-decorated SiO2 NPs synthesis consisted of the three steps below. First, the classic SiO2 spherical particle synthesis method was applied. The Stöber method was used to synthesize SiO2 spherical particles with a single-particle size and good substrate dispersibility. Second, various modifiers were used to generate OH−, -NH2, -SH, and -COOH on the SiO2 surface. Last, AgNPs were coated on the modified SiO2 surface. The results were characterized by electron microscopy and a UV–Visible spectrophotometer, and we further utilized the uniformity of the Ag NPs on the silica surface and photocatalytic performance of the MB as the indexes to confirm which modifier had the best binding ability with Ag NPs.
2. Materials and Methods
2.1. Reagents and Material
Tetraethoxysilane (TEOS) (99.5%), ammonia (99%), and ethanol were obtained from Sigma Aldrich (St. Louis, MO, USA), which synthesized uniform silica NPs in this research. (3-Aminopropyl)triethylsilane (APTES), (3-mercaptopropyl)trimethoxysilane (MPTMS), succinic anhydride (99.5%), dimethylformamide (DMF) (99%), and sodium hydroxide (99.5%) were purchased from Sigma Aldrich to be applied as a surface modifier. Silver nitrate (99.5%), triethanolamine (TEOA) (99%), and sodium citrate (99%) were both acquired from Sigma Aldrich. These were used to synthesize Ag-coated silica structures. Hydrofluoric acid (HF) (aqueous solution, 49%) and methylene blue (MB), (99.5%) were purchased from Sigma Aldrich. All reagents and materials were analyzed gradually and used without further purification. The ethanol and deionized water were applied in all processes.
2.2. Characterization Methods
The concentration and purity of SiO2 were measured by inductively coupled plasma optical emission spectrometry (ICP-OES), by applied Varian Vista-MPX CCD Simultaneous ICP-OES (Agilent Technologies Inc., Palo Alto, CA, USA). The particle sizes distribution of nano-SiO2 was determined by a laser diffraction particle size analyzer by employing COULTER LS230 (Beckman Coulter Inc., Brea, CA, USA). For the surface functional groups or ionic bond determinations, the modified silica particles were examined by Fourier transform infrared spectroscopy (FT-IR) spectra using a Nicolet 6700 (Thermo Fisher Scientific, Waltham, MA, USA) (Trasmittace) at room temperature and a frequency range of 500–4000 cm−1. To confirm the overall morphology and uniformity of the particles, products were inspected by a multi-function environmental field emission scanning electron microscope (FE-SEM) (Carl Zeiss AG, Jena, Germany) operating at 10 kV. To achieve the high-resolution images, the nanoscale products were placed on a carbon-coated copper grid and dried at 60 °C. Higher-resolution images were obtained by transmission electron microscopy (TEM) using a JEOL JEM-2100F CS STEM (JEOL, Ltd., Akishima, Tokyo, Japan) instrument at an accelerating voltage of 200 kV and equipped with element mapping through energy-dispersive X-ray spectroscopy (EDX) (JEOL, Ltd., Akishima, Tokyo, Japan). To demonstrate the presence of chemical bonds on the surface and accurate atomic % on the surface, the end products were analyzed by X-ray photoelectron spectroscopy (XPS) applied with a PHI 5000 VersaProbe (A & B ANALYTICAL & BIO SCIENCE INSTRUMENTS Co., Ltd., Taipei, Taiwan). UV−visible absorption spectra were taken using a HITACHI U4100 (E HONG INSTRUMENTS Co., Ltd., Taipei, Taiwan) at room temperature.
2.3. Preparation of SiO2 Nanoparticles (NPs)
Silica NPs were synthesized following the well-known Stöber method [26,27,28,29], which involved the TEOS being catalyzed by ammonia in the mixture of deionized water and ethanol, undergoing a series of condensation and hydrolysis reactions [29]. Briefly, 5 mL of tetraethyl orthosilicate (Si(OC2H5)4, abbreviated as TEOS) was added to a round-bottom flask which was a mixture of 50 mL deionized water and 30 mL of ethanol with ultrasound instrument for 10 min and after that 10 mL of ammonia was then added, the mixture was stirred 24 h at room temperature. The resulting NPs were purified by centrifugation, washed with ethanol several times, and dried at 60 °C. The dimensions and morphology of the resulting particles were determined with the FE-SEM and HR-TEM.
2.4. Surface Modification of SiO2 NPs
For the surface modification-NH2 of SiO2 NPs, 0.2 g of SiO2 NPs was suspended in 50 mL of deionized water and ultrasonic treatment for 10 min. After adding 0.3 g APTES, the reaction was undertaken at room temperature and stirred for 12 h. For the surface modification-SH SiO2 NPs, 0.2 g of SiO2 NPs was suspended in 50 mL of deionized water and ultrasonic treatment for 10 min. After counting 0.3 g MPTMS in the silica colloidal, the reaction was maintained at 90 °C and stirred for 4 h. For the surface modification OH− of SiO2 NPs, 0.2 g of SiO2 NPs was suspended in 50 mL of deionized water and given ultrasonic treatment for 10 min. After adding 2 mL NaOH (0.2 M) that fixed the pH value of the solution to a strong base (about 10–11), the reaction was kept at 80 °C and stirred for 2 h. For the surface modification-COOH of SiO2 NPs, 0.2 g modified-NH2 of silica NPs was added to a beaker, including the mixture of 10 mL (0.2 M) succinic anhydride and 10 mL DMF. The reaction was kept at room temperature and stirred for 24 h. This reaction involved amino-modified into carboxylic acid modified by a ring-opening linker reaction of the amine functions with succinic anhydride [30]. The above procedures were purified by centrifugation, washed with ethanol several times, and dried at 60 °C. The resulting products were characterized by FT-IR and denoted as NH2-SiO2, SH-SiO2, OH−-SiO2, COOH-SiO2, respectively.
2.5. Preparation of Ag-Coated Modification SiO2 NPs
We redispersed 0.2 g four types of modification SiO2 NPs in 50 mL of deionized water by ultrasonic treatment for 10 min, respectively. The above silica colloidal solution was kept at room temperature, at which 3 mL of AgNO3 aqueous solution (0.1 M) and 10 mL of TEOA (7 M) were added to the mixture. The complexation of TEOA and Ag+ could increase the availability of Ag+ in the reduction reaction [31,32]. After stirring for 1 h, 20 mL of ethanol was injected into the solution to reduce by Ag+ to form Ag seed on the surface of the four kinds of modified SiO2 [33]. After the seed generation reaction was carried out for 1 h, we added 0.5 mL of AgNO3 aqueous solution (0.1 M) and 0.5 mL of sodium citrate aqueous solution (0.2 M) to grow Ag NPs on the Ag seed [33]. The growth, as mentioned above, was duplicated five times to reach the required Ag particle size and coating morphology. The aforementioned products were purified by centrifugation, washed with ethanol several times, dried at 60 °C, and individually marked as Ag-NH2-SiO2, Ag-SH-SiO2, Ag-OH−-SiO2, Ag-COOH-SiO2. To demonstrate the overall morphology and uniformity, the resulting products were analyzed by using FE-SEM, HR-TEM, and elemental mapping.
2.6. Photocatalysis Analysis
The photocatalysis property of Ag-coated modified SiO2 NPs was evaluated by the degradation rate of MB under visible light (400 W Xenon lamp, light intensity was 150 mW/cm2). The experiment involved adding 5 mg of four kinds of photocatalysts in the 10 mL of MB aqueous solution (1 × 10⁻³ M), respectively, and stirring for 30 min in the dark environment to reach the adsorption equilibrium of MB with photocatalyst. After that, we withdrew 1 mL of the reaction solution and separated the photocatalysts. The Uv–visible absorption spectra of 1 mL reaction solution were examined at 10, 20, 30, 40, 50, 60 min with the concentration variation of the corresponding absorbance at 665 nm (characteristic peak of MB). The photocatalysis activity was also investigated by the normalized rate constant (kn), which was obtained from the apparent rate constant. The apparent rate constant (ka) of the degradation reaction was followed by a pseudo first-order equation and calculated by Equation (1) [34]:
where C0 is the initial concentration of MB, Ct is the concentration at a certain minute of MB, and t is time (min).
Considering the influence of the specific surface area of the composites, this can better compare their photocatalytic activities. We divided the apparent rate constant (ka) for each composite by the specific surface area of the corresponding composite to obtain the normalized rate constant (kn) given by Equation (2) [33]:
where SBET is specific surface area (BET surface area) of each composite (m2 g−1).
The % degradation used Equation (3) [34]:
3. Results and Discussion
3.1. Characterization of Nano-SiO2
The nano-SiO2 were prepared by the Stöber method. In this method, three parameters must focus on H2O, TEOS, and ammonia concentrations, and these parameters play an essential role in the resulting particle size. The most significant impact on the particle size was the amount of added TEOS (silica precursor). In previous studies, Chen. [35] obtained various particle sizes from 73 to 730 nm by adjusting TEOS concentrations from 0.068 to 0.22 M to prove that the smaller particle sizes were obtained from the lower amount of TEOS addition. The concentration of water and ammonia also needs to be controlled. The concentration of water could not be too low or too high. A low concentration of water catalyzes TEOS hydrolysis and the formation of the smaller particle. High concentrations of water dilute oligomers and result in smaller particles. Similarly, symptoms of water were observed for ammonia. At lower ammonia concentrations, silica NPs would not form or require a longer reaction time. At higher concentrations, the resulting particles coagulated easily [26]. In our approach, lower concentrations of TEOS, H2O, and ammonia were adopted, resulting in nano-SiO2. The particle size distribution was normally distributed, D50 was 125.2 nm, and D90 was 234.6 nm, which is displayed in Figure 1 and Figure 2, and Table 1. The results show that 50% of the nano-SiO2 spheres have a size less than 125.2 nm, and 90% of the nano-SiO2 spheres have a size less than 234.6 nm. The FE-SEM and the HR-TEM images show the smooth surface of nano-SiO2. The purity of the nano-SiO2 was determined by ICP-OES, which dissolved SiO2 spheres in 10% HF. The concentration and weight percent of silicon are listed in Table 2, which illustrates SiO2 with extremely high purity. Moreover, for the other impurities such as Al, Mg, Fe, etc., these concentrations were less than 1 ppm.
3.2. Fourier Transform Infrared (FT-IR) Analysis
The typical FT-IR spectra of bare-SiO2 and four types of modified SiO2 are indicated in Figure 3 (a) bare-SiO2, (b) NH2-SiO2, (c) COOH-SiO2, (d) SH-SiO2, and (e) OH−-SiO2. For bare-SiO2 in Figure 3a. observed the absorption peak of 800 cm−1, and 1100 cm−1 existed Si-O-Si bending and stretching, respectively [36]. It was the SiO2 standard absorption peak. In Figure 3b, the absorption peaks of 1080–1120 cm−1, 1240 cm−1, 1570 cm−1, and 3300 cm−1 corresponding to Si–O–R stretching, Si–CH2–R stretching, N–H stretching, and NH2 group, confirmed the presence of -NH2 on silica surface [37]. In Figure 3c, the absorption peaks observed at 1700 cm−1 and 1320 cm−1 correspond separately with C=O absorption, and C–O stretching, ascribed to the existence of -COOH on silica surface [38]. In Figure 3d, the absorption peaks are observed at 3000–3400 cm−1, revealing the presence of OH−. In Figure 3e, the absorption peaks of 689 cm−1, 2549 cm−1, 2950 cm−1 demonstrated C–S stretching, –SH group, and C–H stretching, respectively [24], verifying that –SH was located on the silica surface. According to the FT-IR analysis, it could be confirmed that these functional groups or ionic bonds exist on the surface of SiO2. On the other hand, the binding ability to Ag NPs could be sequentially evaluated by the uniformity of the deposition and photocatalysis performance.
3.3. Surface Morphologies and Elemental Distribution
The Ag-decorated nano-SiO2 was manufactured with electroless plating [39]. There were two mechanisms among these. (1). Creating the covalent bond combination on one side of the SiO2 surface by using various silane coupling agents and then another side captured Ag NPs tightly. (2). Negatively charged OH− groups formed on the surface of nano-SiO2. On that site Ag+ ions are combined, and then the absorbing Ag+ ions are reduced immediately by adding ethanol. The HR-TEM images are shown in Figure 4, as mentioned in the experimental section. Four resulting products were examined and compared for those elements deposited. Figure 4a reveals the HR-TEM image of Ag-NH2-SiO2 with around 12–15 nm diameter of Ag NPs deposited on it. Furthermore, agglomerated particles accompanied by non-uniform coverage can be observed in the elemental mapping of Ag-NH2-SiO2. Figure 4b illustrates the HR-TEM image of Ag-SH-SiO2 and a few Ag NPs with a diameter of about 8–20 nm deposited on it. Besides, more agglomerate phenomena and more non-uniformity by comparison with Ag-NH2-SiO2 were inspected on the elemental mapping of Ag-SH-SiO2. Figure 4c,e indicates the HR-TEM image of Ag-OH−-SiO2 with the diameter of approximately 5–7 nm Ag NPs located on it, which showed the best uniformity and the most Ag NPs as confirmed in the elemental mapping of Ag-OH−-SiO2. Figure 4d demonstrates the HR-TEM image of Ag-COOH-SiO2 and diameters of about 12–22 nm Ag NPs located on it. Similar results with Ag-SH-SiO2 are observed in the elemental mapping of Ag-COOH-SiO2. In a distinction with previous research on modified APTES [21] or MPTMS [23], sensitive Sn+ [25], and modified OH− (present study) was that those modified with a terminal amine or thiol group appear with larger metal NPs and slightly non-uniform coverage, a similar result between Sn+ sensitive and this study, which presents minor metal NPs and uniformity combined with Ag NPs. The addition of the citrate and TEOA in the reaction not only increases the availability of Ag+ in the solution but will not form the larger Ag NPs and the bridge between the Ag NPs. It plays a crucial role in determining the topography of the silver coatings formed during the reaction [25,31,32]. Based on these images and elemental distribution, OH− modified-SiO2 indicated the best uniformity, followed by the -NH2 and then -SH and -COOH.
3.4. X-ray Photoelectron Spectroscopy (XPS) Analysis
The XPS survey of the Ag decorated OH− modified SiO2 (AdOHmS) is depicted in Figure 5a. The XPS multiplex of Si is shown in Figure 5b, and the peak is around 108.5 eV. The XPS multiplex of O is presented in Figure 5c, and the peak was at approximately 535.6 eV. The XPS multiplex of Ag is demonstrated in Figure 5d, with one peak at around 368.2 eV and another at about 374.5 eV. Figure 5a also illustrates the surface composition of AdOHmS; the Ag atomic % was the highest compared with three types of composite (shows in Table 3) and achieved 11.8%. Compared with HR-TEM images and elemental mapping, the OH− modified SiO2 has the dense distribution of Ag NPs and excellent uniformity.
Referring to the previous research [40], during the formation of the compound, the atoms in the compound produced the phenomenon of electronic interaction presented as being non-electrically neutral, which resulted from the participation of valence electrons in the procedure of binding. Owing to this inference, the binding energy between bare-SiO2 and SiO2 coated with Ag NPs is displayed in the following images. Figure 6 displays the XPS transform between bare silica and Ag-coated silica. O 1s and Si 2p are shown in Figure 6a,b. The Si 2p and O 1s binding energy shifted from strong to weak after coating Ag NPs, O 1s shifted from 103.40 eV to 103.14 eV, Si 2p shifted from 532.55 eV to 532.23 eV. These images illustrate electrons on silver transfer to oxygen and silicon after the deposition process, which tends to form Ag–O or Ag–Si bonding. The O and Si exhibit negative charges. These charges conversion caused the kinetic energy of optoelectronics to increase, and concomitantly the energy level was changed so that the optoelectronics binding energy transformed from the higher level to lower in our measurement. It can be confirmed that the combination of silver and SiO2 surface exist chemical bond, rather than unilateral physical adsorption, which was based on the shift of the binding energy measurement.
3.5. Ultraviolet (UV)−Visible Absorption Spectra and Photocatalysis Analysis
The UV−visible absorption spectra of four types of resulting products are displayed in Figure 7, and the dispersed Ag NPs in a narrow SPR absorption peak were discovered at about 445 nm. Equation (4) describes the shape of SPR (K) in a two-particle system of dipole coupling given as [17,41]:
where D is the size of the metal NPs and s is the interparticle surface-to-surface separation.
Equation (5) indicates the effect of the medium on the frequency of the SPR is followed by the expression (λsp is the wavelength of SPR) [17,41]:
where e is the electron mass, N is the electron density of the metal, is the refractive index of the medium, is the high-frequency contribution to the dielectric function, is the effective electron mass, is the permittivity of free space, c is the velocity of light, and K is the same as in Equation (4) [17]. The UV–visible test by the four composites is under the same conditions, including the added amount of the composites and the dye’s concentration. Thus, , , s, , , and N in Equations (4) and (5) can be considered as constants. Therefore, according to Equation (4), decreasing the D results leads to the increase of the K. Based on Equation (5), increasing K also caused the increase of the λsp. By the above equations, when Ag NPs were coated on SiO2, the absorption peak would shift (shows in Figure 7), and -SH and -COOH modified composites were shifted to 490 and 465, respectively. However, their D was not small enough. The -NH2 and OH− modified composites presented spacious absorption bands and, peculiarly, the Ag-OH−-SiO2 revealed a significant absorption band due to its smallest D, and hence the shape of the SPR (K) would increase. Increasing the K, also increases the λsp. Thus, Figure 7 shows evidence that the SPR of Ag-OH−-SiO2 has a red-shift and broadening.
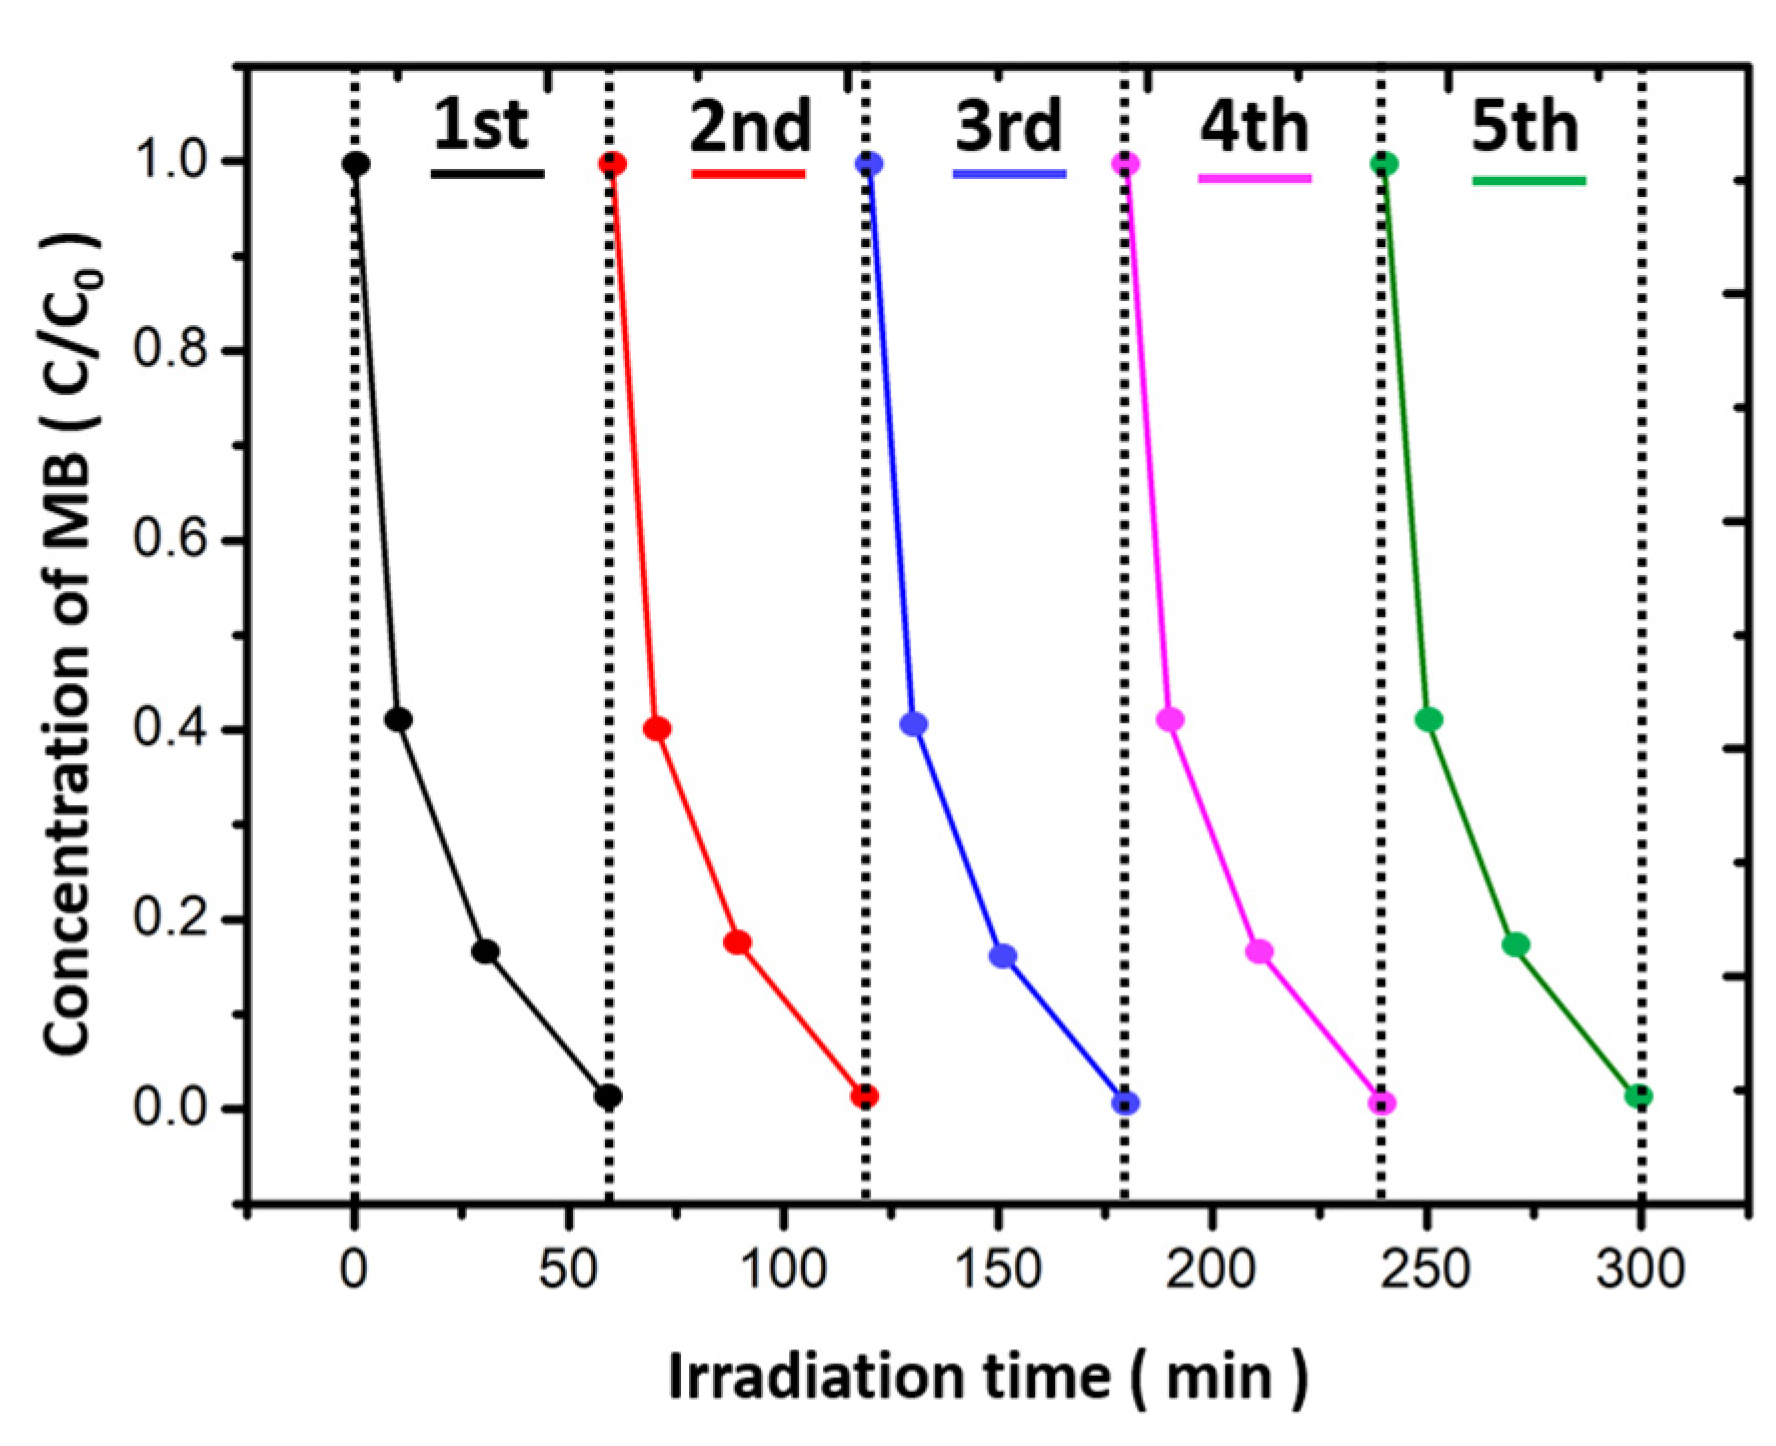
The MB dye was photodegraded by four types of catalysts and investigated the relationship between the concentrations of MB and irradiation time, which is illustrated in Figure 8. The % degradation of the four types of composites that degraded MB after 60 min of Xe lamp irradiation, which was calculated by Equation (3). As 57%, 64%, 82%, and 99.5% for Ag-COOH-SiO2, Ag-SH-SiO2, Ag-NH2-SiO2, and Ag-OH−-SiO2, respectively. Table 4 compares Ag-OH−-SiO2 and Ag-NH2-SiO2 with better photocatalytic efficiency in this study with other studied materials. It is worth noting that although Ag-OH−-SiO2 has the highest Ag concentration (Ag element percentages), the concentrations of the four composites are very close. However, Ag-OH−-SiO2 displays the highest efficiency of photocatalysis. That is because its size of Ag NPs and the distance between the particles are both sufficiently minor, resulting in the significant increase of the electromagnetic field among the metal NPs and silica, producing the red-shift of the SPR (presents in Figure 7). Thus, widening the absorption band of the visible light [41,42], which caused more optical energy acquired from the visible light absorption and increased photocatalytic performance. Nevertheless, the size of Ag NPs and the distance between NPs in the composites Ag-SH-SiO2 and Ag-COOH-SiO2 were not small enough; as a result, the above mechanism was not obvious. Evidently, the photocatalytic efficiency of the various composites is not directly related to Ag concentration. In addition, the stability performance of Ag-OH−-SiO2 was also executed five times under the same experimental conditions with Figure 8. As shown in Figure 9, the % degradation of MB with the presence of Ag-OH−-SiO2 composite is maintained stably. The results confirm that the synthesized Ag-OH−-SiO2 composite is an efficient and stable photocatalyst for the degradation of MB under visible light irradiation. The apparent rate constants (ka) of MB photodegradation were calculated by the pseudo first-order equation, using the results in Figure 8. The ka of Ag-COOH-SiO2, Ag-SH-SiO2, Ag-OH−-SiO2, and Ag-NH2-SiO2 were 2.81, 3.4, 17.6, and 5.71 min−1 g−1, respectively. The BET surface area (SBET) of each composite was 4.8, 5.5, 11.3, and 7.4 m2 g−1. This corresponds to Ag-COOH-SiO2, Ag-SH-SiO2, Ag-OH−-SiO2, and Ag-NH2-SiO2. The normalized rate constant of each composite was obtained from Equation (2). Finally, kn is obtained as 0.585, 0.618, 1.55, and 0.77 min−1 m−2, respectively for Ag-COOH-SiO2, Ag-SH-SiO2, Ag-OH−-SiO2, and Ag-NH2-SiO2. It is obvious that with the decrease in the size of Ag NPs, the kn value has an increasing trend, and this simultaneously supports our inferences in Equations (4) and (5). Therefore, the above reaction mechanism was also verified. Combined with analysis and testing from the above, OH− was the best surface modifier with the silica; it prompted a more uniform Ag coating deposited on the silica. These dense, uniform, and small Ag NPs were the principal cause for induced the proceed actively of the photocatalysis reaction.
4. Conclusions
This study appears that the Ag-OH−-SiO2 with the excellent uniformity of Ag NPs distribution and the most amount elemental composition of Ag. Being a photocatalyst and compared with the other composites in this study, it achieved a 99% degradation rate of MB under visible light. Moreover, the stable performance of Ag-OH−-SiO2 exhibited excellent photocatalytic activity for the degradation of MB under visible light irradiation. These tests and analysis also proved that the binding between OH− and Ag NPs was more suitable. In future work, it will also be possible to compare the binding ability between the different metal NPs and surface modifiers and synthesize various metal decorated with dielectric structures. The Ag decorated silica composite could be extensively applied in the fields of photocatalysis, antibacterials [15], and promoting the development of surface-enhanced Raman spectroscopy (SERS) [16] by revising the shape and size of the decorative metal. The various chemical and optical properties were achieved by furthering controling the size and uniformity of the metal NPs on the dielectric, which was significantly influenced the SPR phenomenon between the substrate and metal NPs. This resulted in the increase of the absorption and shift of the SPR. Altering the various surface morphology of Ag NPs broadens the prospects of the field of photodegradation and photoelectrics.
Author Contributions
Conceptualization, H.-R.C. and C.-H.L.; Data curation, H.-R.C.; Formal analysis, H.-R.C.; Investigation, H.-R.C.; Methodology, W.-S.C., H.-R.C. and C.-H.L.; Resources, W.-S.C.; Supervision, W.-S.C. and C.-H.L.; Validation, C.-H.L.; Visualization, H.-R.C.; Writing—original draft, H.-R.C.; Writing—review and editing, C.-H.L. All authors have read and agreed to the published version of the manuscript.
Funding
This research received no external funding.
Institutional Review Board Statement
Not Applicable.
Informed Consent Statement
Not Applicable.
Data Availability Statement
Not Applicable.
Acknowledgments
We are pleased to acknowledge the support of the Laboratory of Resources Circulation (LRC) at the National Cheng Kung University.
Conflicts of Interest
The authors declare no conflict of interest.
References
- Li, Y.; Shao, L.; Zhong, F.; Ding, P.; Chu, B.; Luo, F.; Xu, K.; Zeng, F.; Du, Y. Light control based on unidirectional scattering in metal–dielectric core–shell nanoparticles. Opt. Commun. 2018, 426, 483–489. [Google Scholar] [CrossRef]
- Shafer-Peltier, K.E.; Haynes, C.L.; Glucksberg, M.R.; van Duyne, R.P. Toward a glucose biosensor based on surface-enhanced Raman scattering. J. Am. Chem. Soc. 2003, 125, 588–593. [Google Scholar] [CrossRef] [PubMed]
- Li, X.; Niitsoo, O.; Couzis, A. Electrostatically assisted fabrication of silver-dielectric core/shell nanoparticles thin film capacitor with uniform metal nanoparticle distribution and controlled spacing. J. Colloid Interface Sci. 2016, 465, 333–341. [Google Scholar] [CrossRef] [PubMed]
- Zhang, Y.-S.; Wang, M.; Yang, C.; Shao, Y.-W.; Qi, X.-D.; Yang, J.-H.; Wang, Y. Heterogeneous BaTiO3@Ag core-shell fibers as fillers for polymer dielectric composites with simultaneously improved dielectric constant and breakdown strength. Compos. Commun. 2021, 27, 100874. [Google Scholar] [CrossRef]
- Xu, G.; Zhu, X. A core-shell structured Zn/SiO2@ZSM-5 catalyst: Preparation and enhanced catalytic properties in methane co-aromatization with propane. Appl. Catal. B Environ. 2021, 293, 120241. [Google Scholar] [CrossRef]
- Zhang, C.; He, H. A comparative study of TiO2 supported noble metal catalysts for the oxidation of formaldehyde at room temperature. Catal. Today 2007, 126, 345–350. [Google Scholar] [CrossRef]
- Hirakawa, T.; Kamat, P.V. Charge separation and catalytic activity of Ag@TiO2 core-shell composite clusters under UV-irradiation. J. Am. Chem. Soc. 2005, 127, 3928–3934. [Google Scholar] [CrossRef]
- Yousefi, A.; Kashi, M.A.; Afghahi, S.S.S. Enhancement and recovery of magnetic exchange coupling properties in SrFe11AlO19@NiFe2O4 core-shell structure by multiple TiO2 and SiO2 nanolayer shells. J. Magn. Magn. Mater. 2021, 530, 167932. [Google Scholar] [CrossRef]
- Padovini, D.; Magdalena, A.; Capeli, R.; Longo, E.; Dalmaschio, C.; Chiquito, A.; Pontes, F. Synthesis and characterization of ZrO2@SiO2 core-shell nanostructure as nanocatalyst: Application for environmental remediation of rhodamine B dye aqueous solution. Mater. Chem. Phys. 2019, 233, 1–8. [Google Scholar] [CrossRef]
- Ferreira-Neto, E.P.; Ullah, S.; Simões, M.B.; Perissinotto, A.P.; de Vicente, F.S.; Noeske, P.-L.M.; Ribeiro, S.J.; Rodrigues-Filho, U.P. Solvent-controlled deposition of titania on silica spheres for the preparation of SiO2@TiO2 core@shell nanoparticles with enhanced photocatalytic activity. Colloids Surf. A Physicochem. Eng. Asp. 2019, 570, 293–305. [Google Scholar] [CrossRef]
- Kim, Y.H.; Jo, B.G.; Jeong, J.H.; Kang, Y.S. Preparation and Characterization of Cu-SiO2 Nanoparticles. Solid State Phenom. 2007, 121–123, 255–258. [Google Scholar] [CrossRef]
- Kim, J.-H.; Bryan, W.W.; Lee, T.R. Preparation, characterization, and optical properties of gold, silver, and gold-silver alloy nanoshells having silica cores. Langmuir 2008, 24, 11147–11152. [Google Scholar] [CrossRef] [PubMed]
- Zhu, M.; Qian, G.; Wang, Z.; Wang, M. Fabrication of nanoscaled silica layer on the surfaces of submicron SiO2-Ag core-shell spheres. Mater. Chem. Phys. 2006, 100, 333–336. [Google Scholar] [CrossRef]
- Park, S.-Y.; Han, K.; O’Neill, D.B.; Mul, G. Stability of Ag@SiO2 core–shell particles in conditions of photocatalytic overall water-splitting. J. Energy Chem. 2017, 26, 309–314. [Google Scholar] [CrossRef]
- Xu, K.; Wang, J.-X.; Kang, X.-L.; Chen, J.-F. Fabrication of antibacterial monodispersed Ag–SiO2 core–shell nanoparticles with high concentration. Mater. Lett. 2009, 63, 31–33. [Google Scholar] [CrossRef]
- Chen, X.-J.; Cabello, G.; Wu, D.-Y.; Tian, Z.-Q. Surface-enhanced Raman spectroscopy toward application in plasmonic photocatalysis on metal nanostructures. J. Photochem. Photobiol. C Photochem. Rev. 2014, 21, 54–80. [Google Scholar] [CrossRef]
- Pan, K.-Y.; Liang, Y.-F.; Pu, Y.-C.; Hsu, Y.-J.; Yeh, J.-W.; Shih, H.C. Studies on the photocatalysis of core-shelled SiO2–Ag nanospheres by controlled surface plasmon resonance under visible light. Appl. Surf. Sci. 2014, 311, 399–404. [Google Scholar] [CrossRef]
- Mouni, L.; Belkhiri, L.; Bollinger, J.-C.; Bouzaza, A.; Assadi, A.; Tiri, A.; Dahmoune, F.; Madani, K.; Remini, H. Removal of Methylene Blue from aqueous solutions by adsorption on Kaolin: Kinetic and equilibrium studies. Appl. Clay Sci. 2018, 153, 38–45. [Google Scholar] [CrossRef]
- Pang, J.; Fu, F.; Ding, Z.; Lu, J.; Li, N.; Tang, B. Adsorption behaviors of methylene blue from aqueous solution on mesoporous birnessite. J. Taiwan Inst. Chem. Eng. 2017, 77, 168–176. [Google Scholar] [CrossRef]
- Hou, C.; Hu, B.; Zhu, J. Photocatalytic Degradation of Methylene Blue over TiO2 Pretreated with Varying Concentrations of NaOH. Catalysts 2018, 8, 575. [Google Scholar] [CrossRef] [Green Version]
- Zhang, L.; Feng, Y.-G.; Wang, L.-Y.; Zhang, J.-Y.; Chen, M.; Qian, D.-J. Comparative studies between synthetic routes of SiO2@Au composite nanoparticles. Mater. Res. Bull. 2007, 42, 1457–1467. [Google Scholar] [CrossRef]
- Mondin, G.; Lohe, M.; Wisser, F.; Grothe, J.; Mohamed-Noriega, N.; Leifert, A.; Dörfler, S.; Bachmatiuk, A.; Rümmeli, M.H.; Kaskel, S. Electroless copper deposition on (3-mercaptopropyl) triethoxysilane-coated silica and alumina nanoparticles. Electrochim. Acta 2013, 114, 521–526. [Google Scholar] [CrossRef]
- Sakai, T.; Enomoto, H.; Sakai, H.; Abe, M. Direct Fabrication of Silica-Coated Gold Nanoparticles and Gold Nanoparticle-Deposited Silica Spheres in Aqueous Media. J. Jpn. Soc. Colour Mater. 2009, 82, 387–396. [Google Scholar] [CrossRef] [Green Version]
- Nedeljko, P.; Turel, M.; Košak, A.; Lobnik, A. Synthesis of hybrid thiol-functionalized SiO2 particles used for agmatine determination. J. Sol-Gel Sci. Technol. 2016, 79, 487–496. [Google Scholar] [CrossRef]
- Chen, J.E.; Wang, Q.; Shull, K.R.; Richards, J.J. Control over electroless plating of silver on silica nanoparticles with sodium citrate. J. Colloid Interface Sci. 2020, 576, 376–384. [Google Scholar] [CrossRef] [PubMed]
- Wang, X.-D.; Shen, Z.-X.; Sang, T.; Cheng, X.-B.; Li, M.-F.; Chen, L.-Y.; Wang, Z.-S. Preparation of spherical silica particles by Stober process with high concentration of tetra-ethyl-orthosilicate. J. Colloid Interface Sci. 2010, 341, 23–29. [Google Scholar] [CrossRef]
- Jin, Y.; Lohstreter, S.; Pierce, D.T.; Parisien, J.; Wu, M.; Hall, I.C.; Zhao, J.X. Silica nanoparticles with continuously tunable sizes: Synthesis and size effects on cellular contrast imaging. Chem. Mater. 2008, 20, 4411–4419. [Google Scholar] [CrossRef]
- Shimura, N.; Ogawa, M. Preparation of surfactant templated nanoporous silica spherical particles by the Stöber method. Effect of solvent composition on the particle size. J. Mater. Sci. 2007, 42, 5299–5306. [Google Scholar] [CrossRef]
- Jankiewicz, B.J.; Jamiola, D.; Choma, J.; Jaroniec, M. Silica-metal core-shell nanostructures. Adv. Colloid Interface Sci. 2012, 170, 28–47. [Google Scholar] [CrossRef]
- An, Y.; Chen, M.; Xue, Q.; Liu, W. Preparation and self-assembly of carboxylic acid-functionalized silica. J. Colloid Interface Sci. 2007, 311, 507–513. [Google Scholar] [CrossRef]
- Wang, H.; Zheng, L.; Liu, G.; Zhou, Y. Enhanced adsorption of Ag+ on triethanolamine modified titanate nanotubes. Colloids Surf. A Physicochem. Eng. Asp. 2018, 537, 28–35. [Google Scholar] [CrossRef]
- Chen, D.; Liu, H.-Y.; Liu, J.-S.; Ren, X.-L.; Meng, X.-W.; Wu, W.; Tang, F.-Q. A general method for synthesis continuous silver nanoshells on dielectric colloids. Thin Solid Films 2008, 516, 6371–6376. [Google Scholar] [CrossRef]
- Chen, K.-H.; Pu, Y.-C.; Chang, K.-D.; Liang, Y.-F.; Liu, C.-M.; Yeh, J.-W.; Shih, H.-C.; Hsu, Y.-J. Ag-nanoparticle-decorated SiO2 nanospheres exhibiting remarkable plasmon-mediated photocatalytic properties. J. Phys. Chem. C 2012, 116, 19039–19045. [Google Scholar] [CrossRef] [Green Version]
- Khedkar, C.V.; Daware, K.D.; Badgujar, P.S.; Kolekar, Y.D.; Gosavi, S.W.; Patil, S.I. Ag–SiO2 nanocomposite for the optical detection of Hg(II) ions and catalytic reduction of methylene blue. Opt. Mater. 2021, 120, 111426. [Google Scholar] [CrossRef]
- Chen, S.-L. Preparation of monosize silica spheres and their crystalline stack. Colloid Surf. A 1998, 142, 59–63. [Google Scholar] [CrossRef]
- Scherer, K.; Nouvelot, L.; Lacan, P.; Bosmans, R. Optical and mechanical characterization of evaporated SiO2 layers. Long-term evolution. Appl. Opt. 1996, 35, 5067–5072. [Google Scholar] [CrossRef] [PubMed]
- Gu, D.; Sistiabudi, R.; Dey, S.K. Modification of work function of Ti by self-assembled monolayer molecules on SiO2/p-Si. J. Appl. Phys. 2005, 97, 123710. [Google Scholar] [CrossRef]
- Ye, L.; Liang, C.; He, J.; Ou, J.; Wu, Q. Facile preparation of ordered macroporous carboxyl group functionalized polymer@SiO2 composites and their adsorption performance towards proteins. J. Inorg. Organomet. Polym. Mater. 2018, 28, 1011–1020. [Google Scholar] [CrossRef]
- Schaefers, S.; Rast, L.; Stanishevsky, A. Electroless silver plating on spin-coated silver nanoparticle seed layers. Mater. Lett. 2006, 60, 706–709. [Google Scholar] [CrossRef]
- Jackson, J.D.; Fox, R.F. Classical electrodynamics, 3rd ed. Am. J. Phys. 1999, 67, 841–842. [Google Scholar] [CrossRef]
- Jain, P.K.; El-Sayed, M.A. Noble metal nanoparticle pairs: Effect of medium for enhanced nanosensing. Nano Lett. 2008, 8, 4347–4352. [Google Scholar] [CrossRef] [PubMed]
- Sancho-Parramon, J. Surface plasmon resonance broadening of metallic particles in the quasi-static approximation: A numerical study of size confinement and interparticle interaction effects. Nanotechnology 2009, 20, 235706. [Google Scholar] [CrossRef] [PubMed]
- Yunarti, R.T.; Safitri, T.N.; Dimonti, L.C.C.; Aulia, G.; Khalil, M.; Ridwan, M. Facile synthesis of composite between titania nanoparticles with highly exposed (001) facet and coconut shell-derived graphene oxide for photodegradation of methylene blue. J. Phys. Chem. Solids 2021, 160, 110357. [Google Scholar] [CrossRef]
- Ge, Y.; Luo, H.; Huang, J.; Zhang, Z. Visible-light-active TiO2 photocatalyst for efficient photodegradation of organic dyes. Opt. Mater. 2021, 115, 111058. [Google Scholar] [CrossRef]
- Sun, Y.; Cai, L.; Liu, X.; Cui, Z.; Rao, P. Tailoring heterostructures of Ag/Cu2O hybrids for enhanced photocatalytic degradationdegradation. J. Phys. Chem. Solids 2017, 111, 75–81. [Google Scholar] [CrossRef]
- Li, S.; Lin, Q.; Liu, X.; Yang, L.; Ding, J.; Dong, F.; Li, Y.; Irfan, M.; Zhang, P. Fast photocatalytic degradation of dyes using low-power laser-fabricated Cu2O–Cu nanocomposites. RSC Adv. 2018, 8, 20277–20286. [Google Scholar] [CrossRef] [Green Version]
- Yao, X.; Liu, X. One-pot synthesis of Ag/AgCl@SiO2 core–shell plasmonic photocatalyst in natural geothermal water for efficient photocatalysis under visible light. J. Mol. Catal. A Chem. 2014, 393, 30–38. [Google Scholar] [CrossRef]
Figure 1.
Field-emission scanning electron microscopy (FE-SEM) and high-resolution transmission electron microscopy (HR-TEM) image of the nano-SiO2 sphere.
Figure 1.
Field-emission scanning electron microscopy (FE-SEM) and high-resolution transmission electron microscopy (HR-TEM) image of the nano-SiO2 sphere.
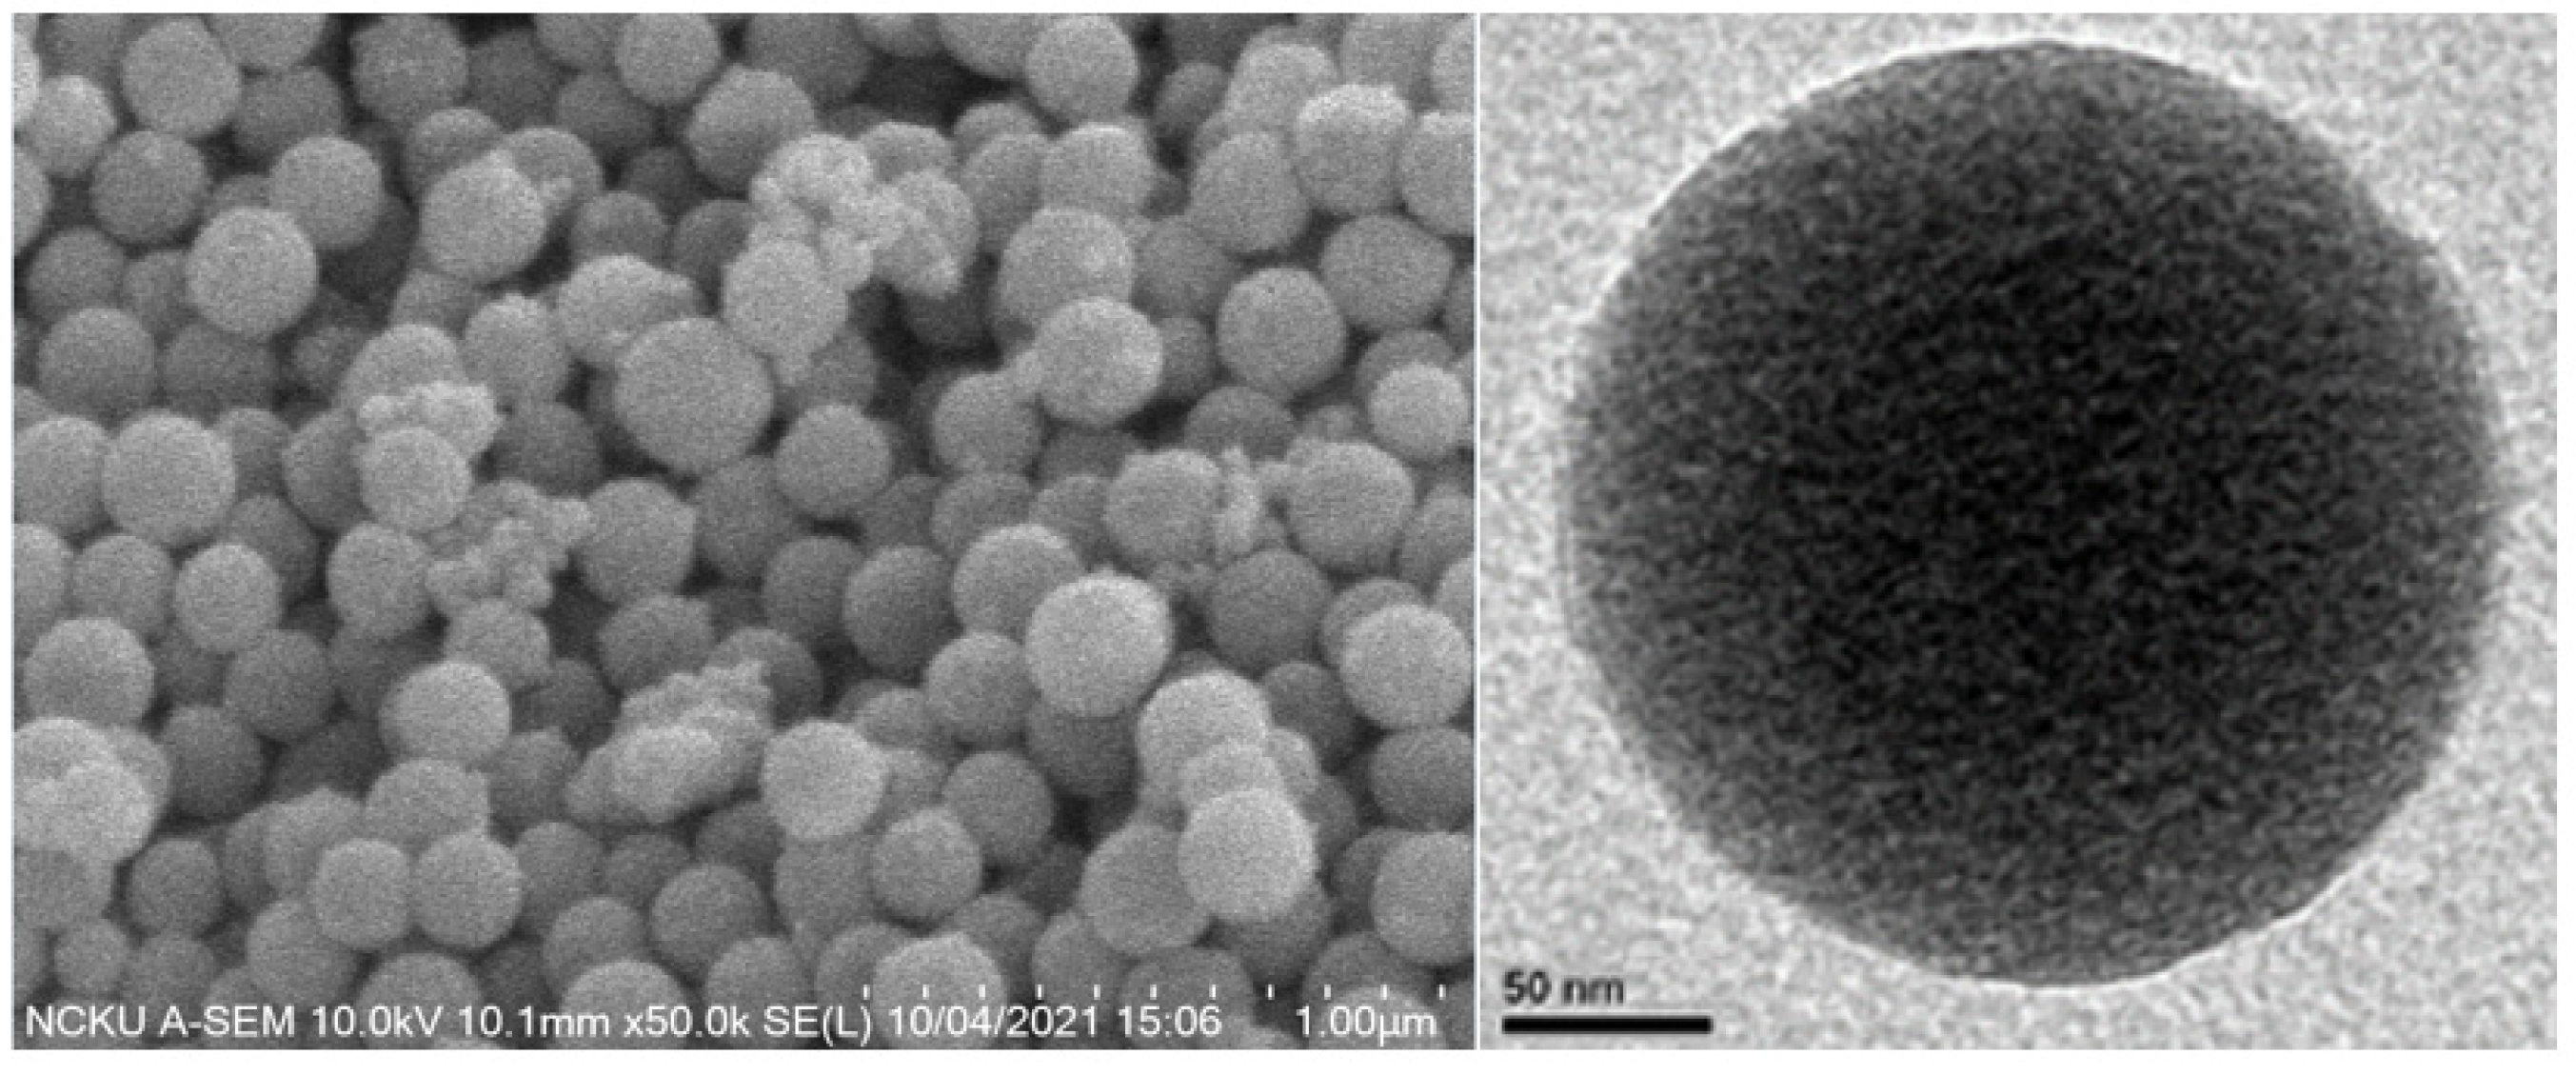
Figure 2.
The particle size distribution of nano-SiO2 (tested by laser diffraction particle size analyzer) (The red line is the particle size distribution curve, and the blue line is the cumulative particle size curve).
Figure 2.
The particle size distribution of nano-SiO2 (tested by laser diffraction particle size analyzer) (The red line is the particle size distribution curve, and the blue line is the cumulative particle size curve).
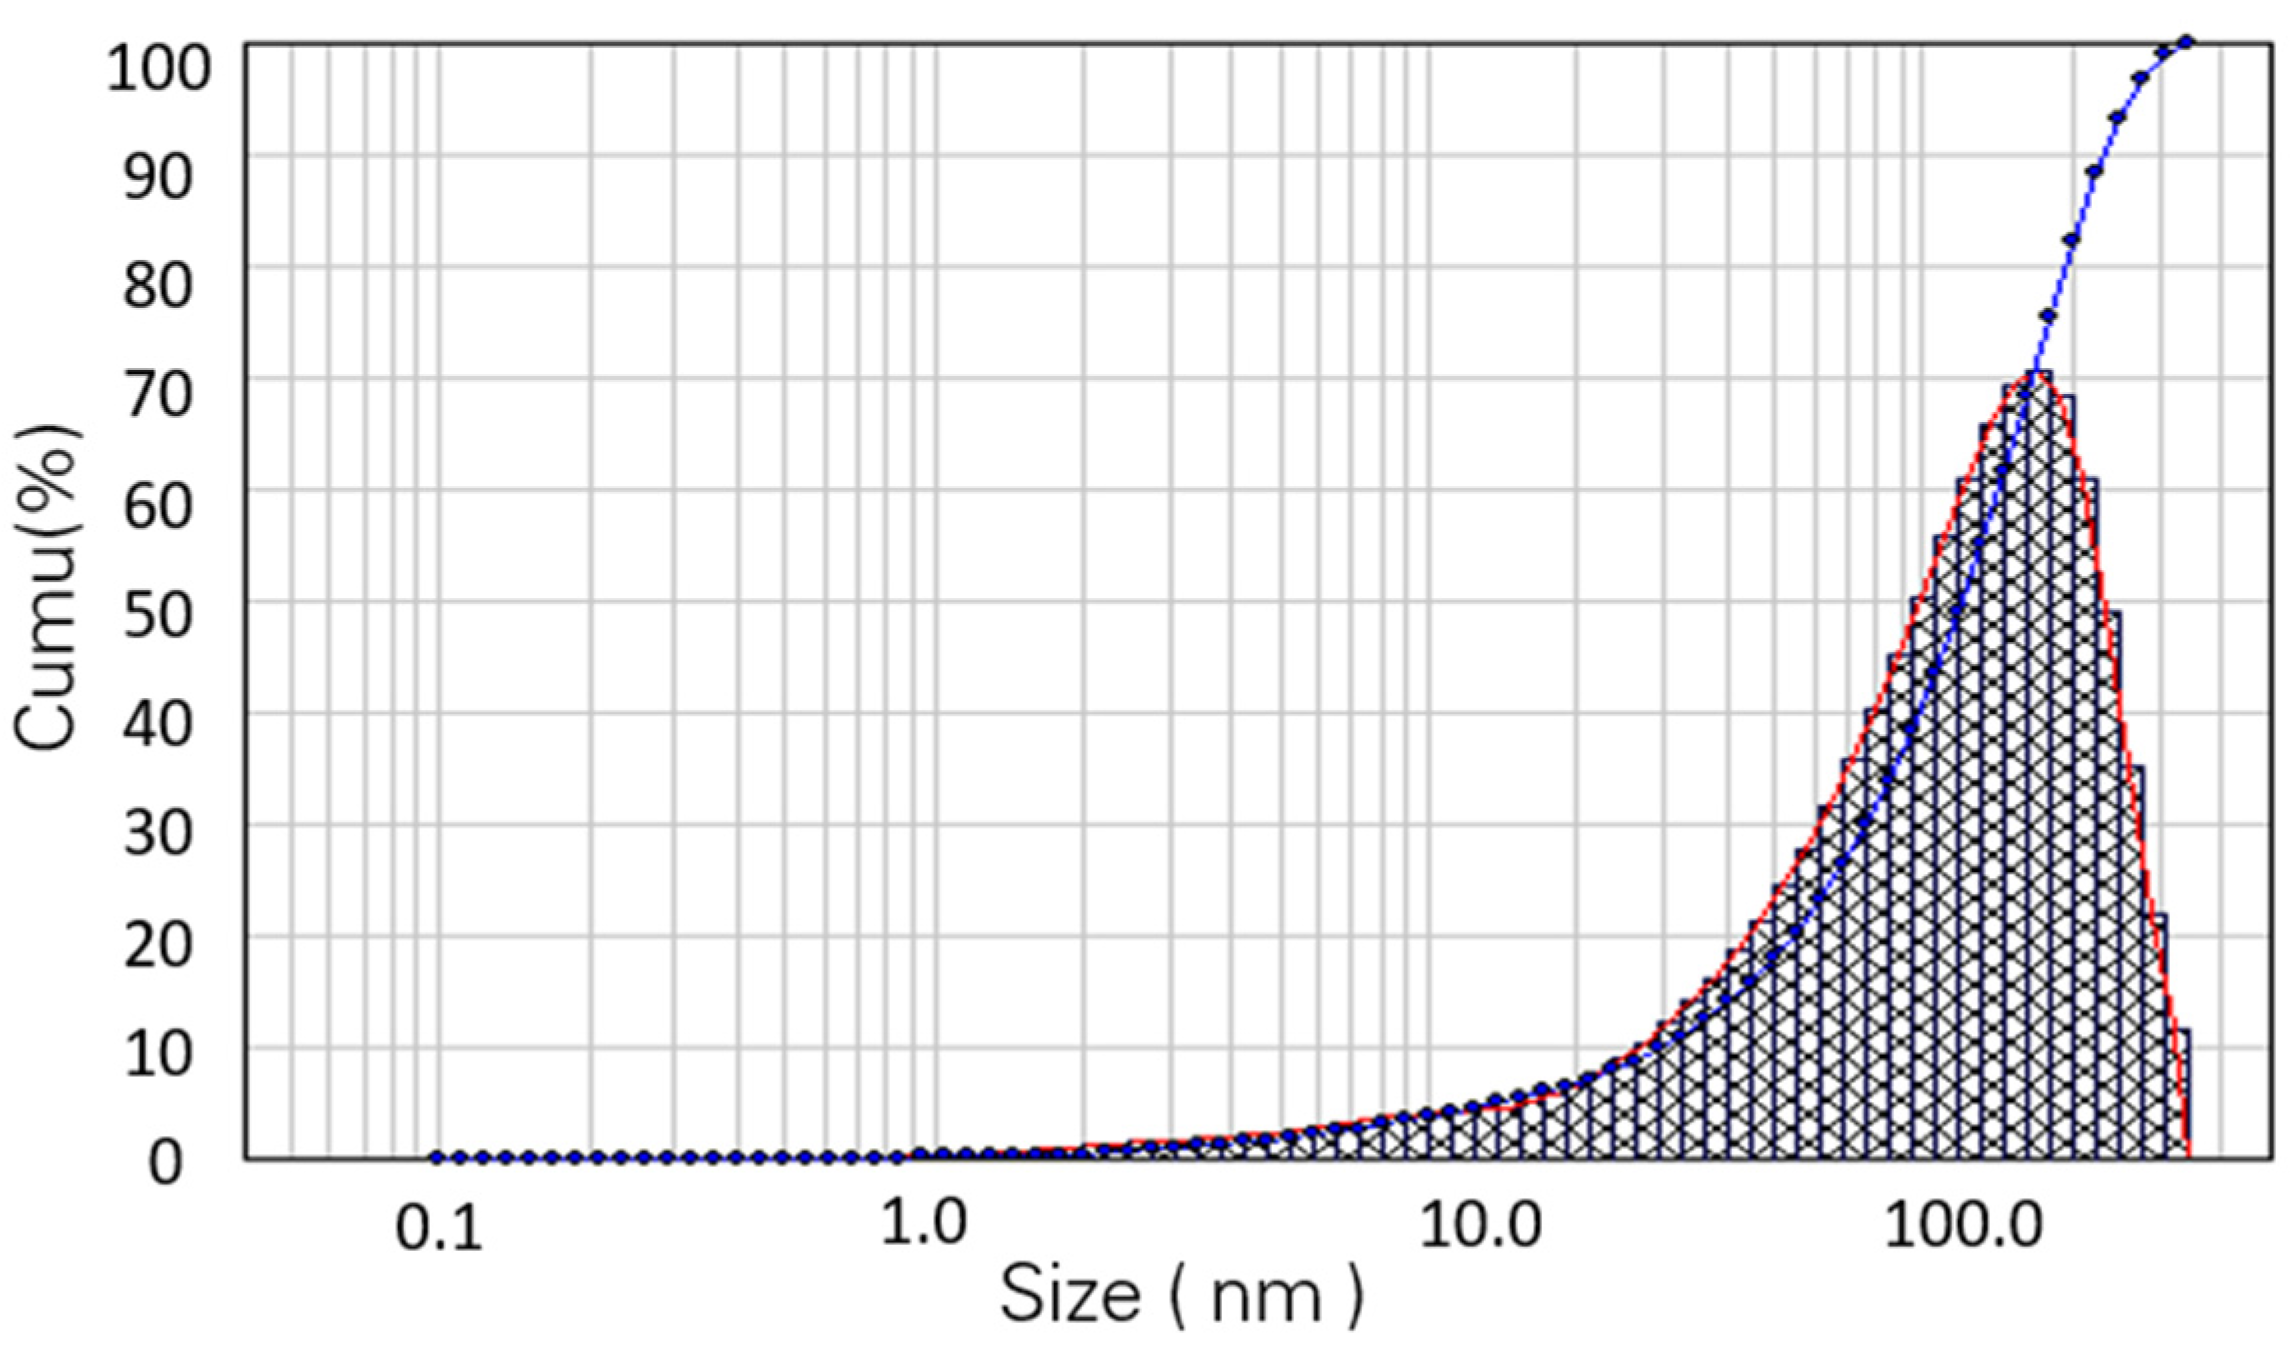
Figure 3.
Typical Fourier transform infrared (FT-IR) spectra of (a) bare-SiO2 (b) NH2-SiO2 (c) COOH-SiO2 (d) OH−-SiO2 and (e) SH-SiO2.
Figure 3.
Typical Fourier transform infrared (FT-IR) spectra of (a) bare-SiO2 (b) NH2-SiO2 (c) COOH-SiO2 (d) OH−-SiO2 and (e) SH-SiO2.

Figure 4.
The HR-TEM and elemental mapping of (a) Ag-NH2-SiO2 (b) Ag-SH-SiO2 (c) Ag-OH−-SiO2 (d) Ag-COOH-SiO2 and (e) surface topography of Ag-OH−-SiO2.
Figure 4.
The HR-TEM and elemental mapping of (a) Ag-NH2-SiO2 (b) Ag-SH-SiO2 (c) Ag-OH−-SiO2 (d) Ag-COOH-SiO2 and (e) surface topography of Ag-OH−-SiO2.

Figure 5.
The X-ray photoelectron spectroscopy (XPS) of (a) survey scan of AcOHmS (b) Si 2p of AcOHmS (c) O 1s of AcOHmS and (d) Ag 3d of AcOHmS.
Figure 5.
The X-ray photoelectron spectroscopy (XPS) of (a) survey scan of AcOHmS (b) Si 2p of AcOHmS (c) O 1s of AcOHmS and (d) Ag 3d of AcOHmS.

Figure 6.
XPS peak transform of (a) O 1s and (b) Si 2p.

Figure 7.
Ultraviolet (UV)−visible absorption spectra of different Ag-modifier-SiO2, the dispersed Ag NPs included for comparison.
Figure 7.
Ultraviolet (UV)−visible absorption spectra of different Ag-modifier-SiO2, the dispersed Ag NPs included for comparison.

Figure 8.
Concentration of methylene blue (MB) (C/C0) irradiation time plots for MB photodegradation in the presence of four kinds of photocatalysts. Without catalyst and bare-SiO2 for comparison. (C0 is the initial concentration of MB and C is the concentration at a certain minute of MB) (the reaction temperature is at room temperature and the pH value is 9).

Figure 9.
Degradation efficiency of MB five times in the presence of Ag-OH−-SiO2 under visible light irradiation. (the same experimental conditions with Figure 8).
Figure 9.
Degradation efficiency of MB five times in the presence of Ag-OH−-SiO2 under visible light irradiation. (the same experimental conditions with Figure 8).

Table 1.
The D10, D50, D90 of nano-SiO2.
| D10 | D50 | D90 |
|---|---|---|
| 34.7 nm | 125.2 nm | 234.6 nm |
Table 2.
The concentration and purity of nano-SiO2.
| Nano-SiO2 | Si | Al | Mg |
|---|---|---|---|
| ppm | 76.224 | 0.62 | 0.15 |
| Wt % | 98.87 | 0.81 | 0.191 |
Table 3.
Elemental analysis by XPS of various Ag-coated nano-SiO2.
| Si 2p | O 1s | Ag 3d5 | |
|---|---|---|---|
| -NH2 | 64.3 | 26.4 | 9.3 |
| -SH | 67.4 | 24.3 | 8.3 |
| -OH− | 63.1 | 25.1 | 11.8 |
| -COOH | 66.5 | 25.8 | 7.7 |
Table 4.
Comparison of study for MB photodegradation.
| Catalyst | Additive Amount (mg) | Concentration of MB (M) | % Degradation | Irradiation Time (min) | Ref. |
|---|---|---|---|---|---|
| TiO2(001)/GO | 40 | 1 × 10⁻² | 51.3 | 60 | [43] |
| Active-TiO2 | 21 | 3.125 × 10⁻² | >95 | 60 | [44] |
| Au/Cu2O | 20 | 3.125 × 10⁻² | 96.5 | 120 | [45] |
| Cu2O-Cu | 9 | 3.125 × 10⁻² | 90 | 50 | [46] |
| Ag/AgCl@SiO2 | 7 | 3.125 × 10⁻² | >99 | 15 | [47] |
| SiO2/Ag (Sn+) | 0.5 | 2 × 10⁻⁵ | >95 | 60 | [17] |
| Ag-OH−-SiO2 | 5 | 1 × 10⁻³ | >99 | 60 | Present study |
| Ag-NH2-SiO2 | 5 | 1 × 10⁻³ | 82 | 60 | Present study |
Publisher’s Note: MDPI stays neutral with regard to jurisdictional claims in published maps and institutional affiliations. |
© 2022 by the authors. Licensee MDPI, Basel, Switzerland. This article is an open access article distributed under the terms and conditions of the Creative Commons Attribution (CC BY) license (https://creativecommons.org/licenses/by/4.0/).
Share and Cite
MDPI and ACS Style
Chen, W.-S.; Chen, H.-R.; Lee, C.-H. The Photocatalytic Performance of Ag-Decorated SiO2 Nanoparticles (NPs) and Binding Ability between Ag NPs and Modifiers. Coatings 2022, 12, 146. https://doi.org/10.3390/coatings12020146
AMA Style
Chen W-S, Chen H-R, Lee C-H. The Photocatalytic Performance of Ag-Decorated SiO2 Nanoparticles (NPs) and Binding Ability between Ag NPs and Modifiers. Coatings. 2022; 12(2):146. https://doi.org/10.3390/coatings12020146
Chicago/Turabian StyleChen, Wei-Sheng, Hong-Ren Chen, and Cheng-Han Lee. 2022. "The Photocatalytic Performance of Ag-Decorated SiO2 Nanoparticles (NPs) and Binding Ability between Ag NPs and Modifiers" Coatings 12, no. 2: 146. https://doi.org/10.3390/coatings12020146
Note that from the first issue of 2016, this journal uses article numbers instead of page numbers. See further details here.