
Microstructure, Texture and Mechanical Properties of Al-SiC Composite with Bimodal Structure Fabricated by Multi-Layer Accumulative Roll Bonding
Abstract
:1. Introduction
2. Materials and Methods
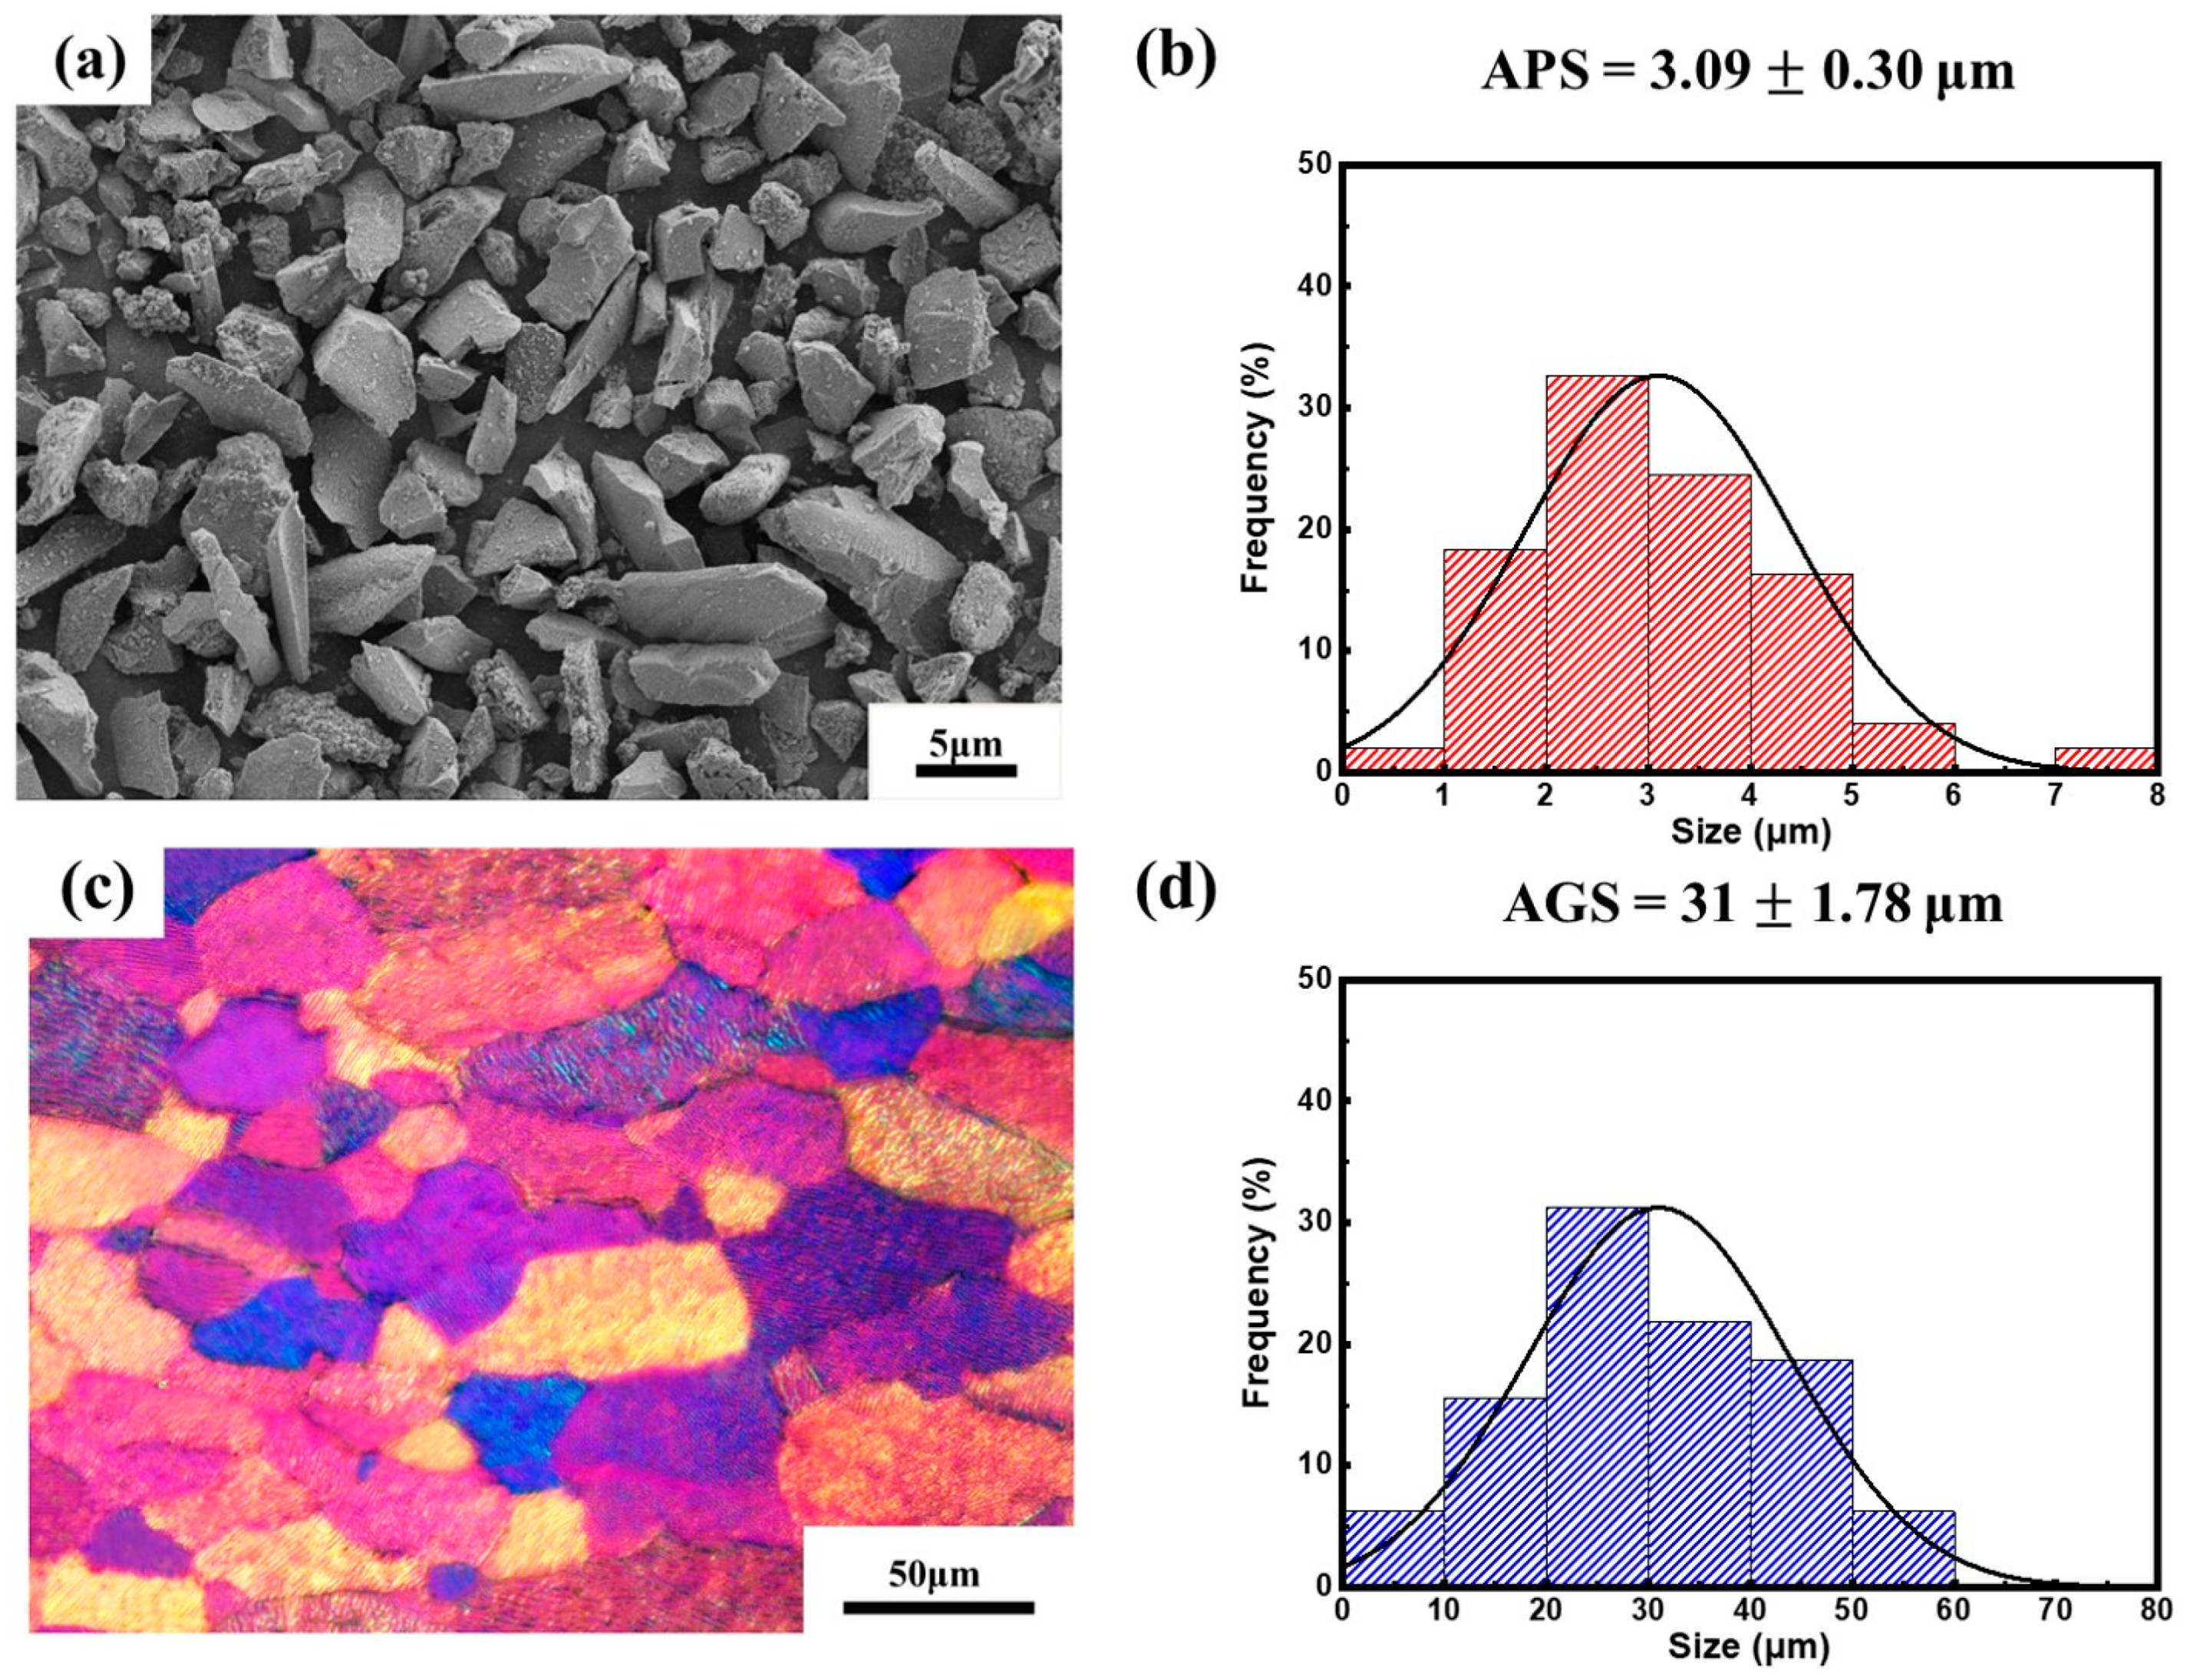
2.1. Materials
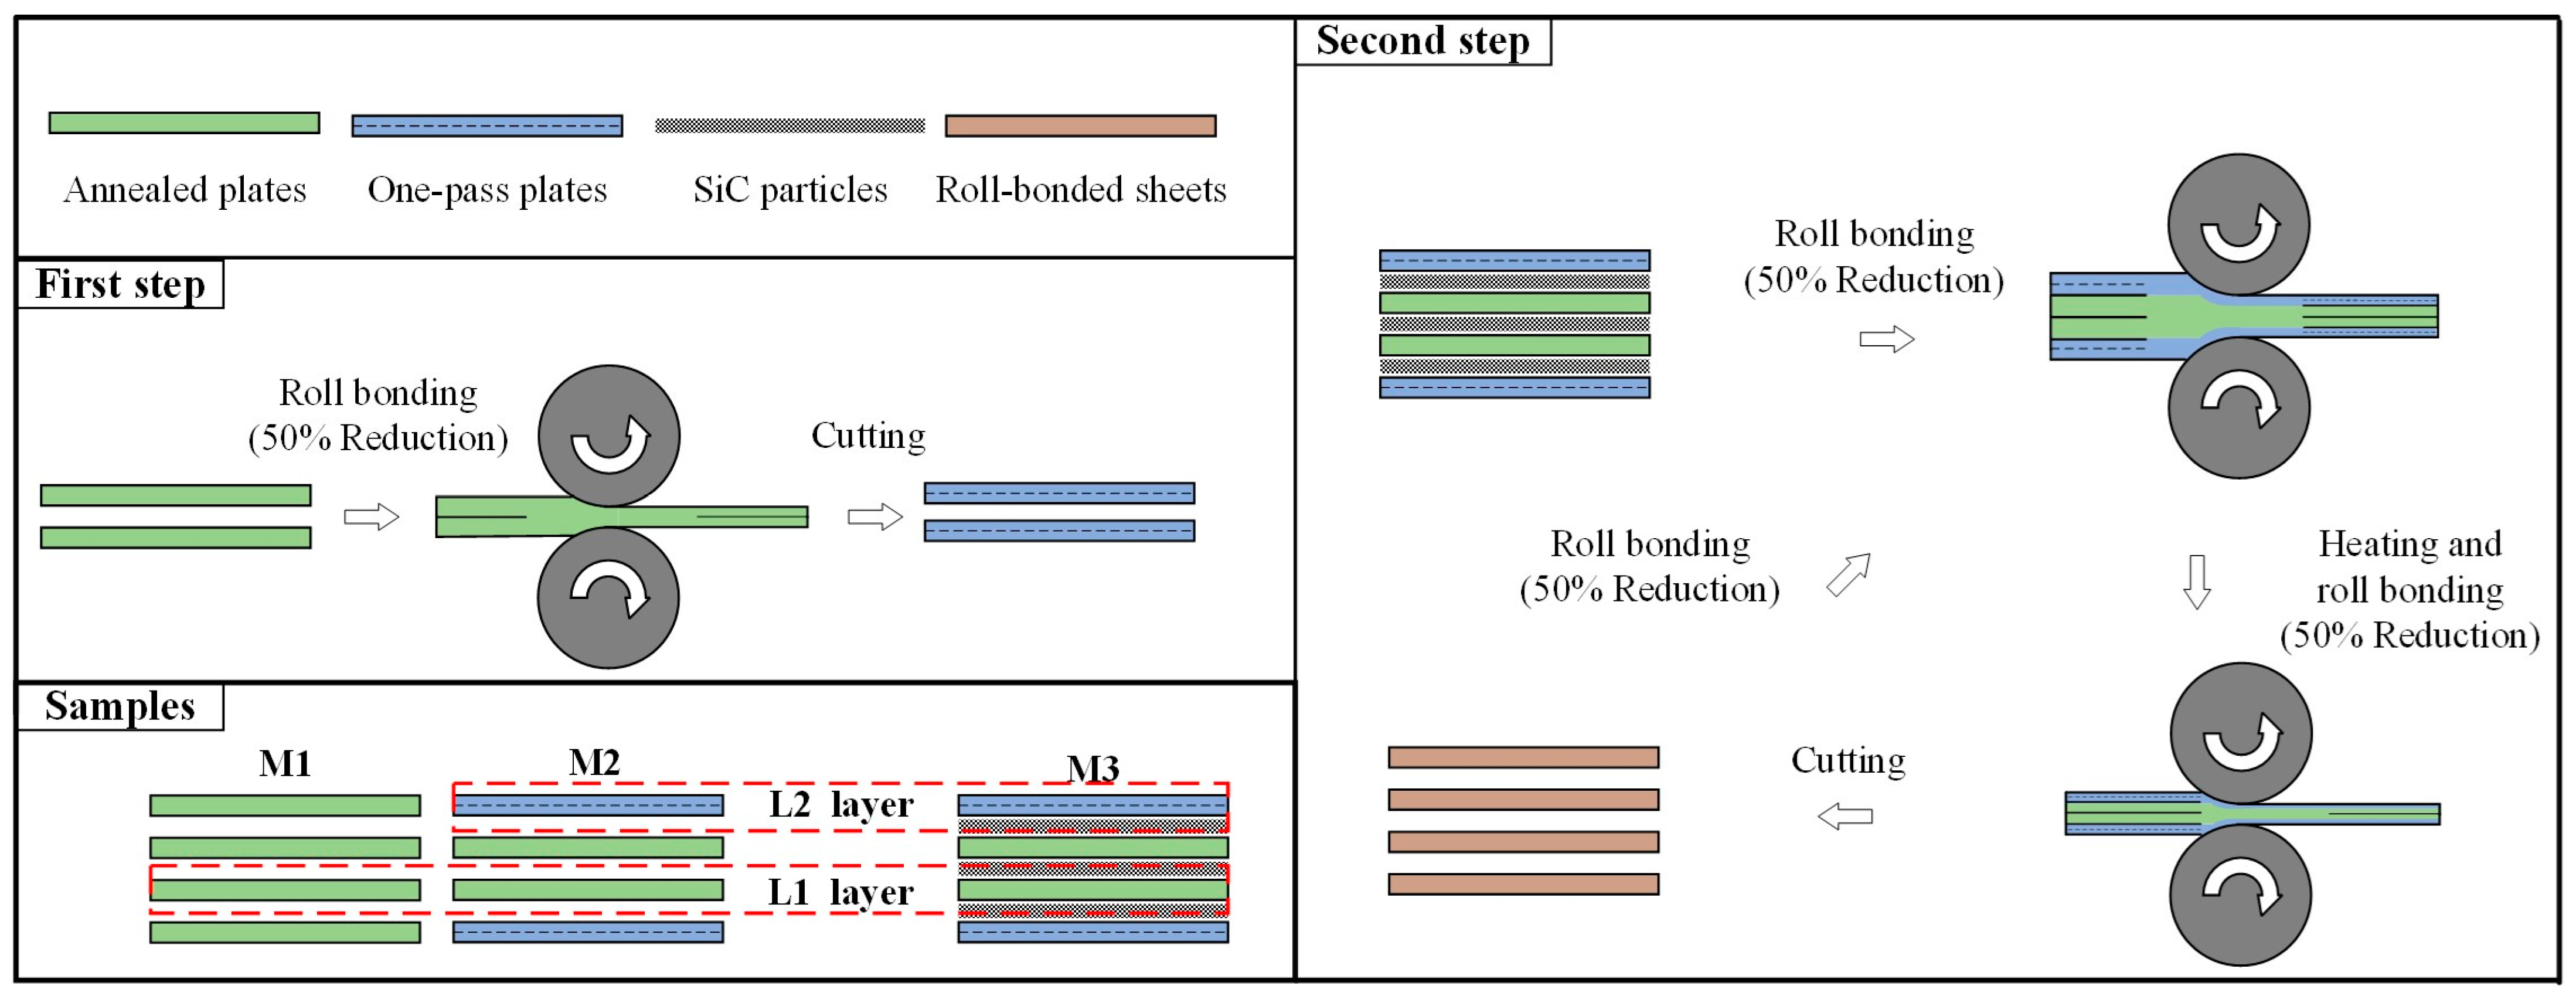
2.2. MARB Process
2.3. Microstructure
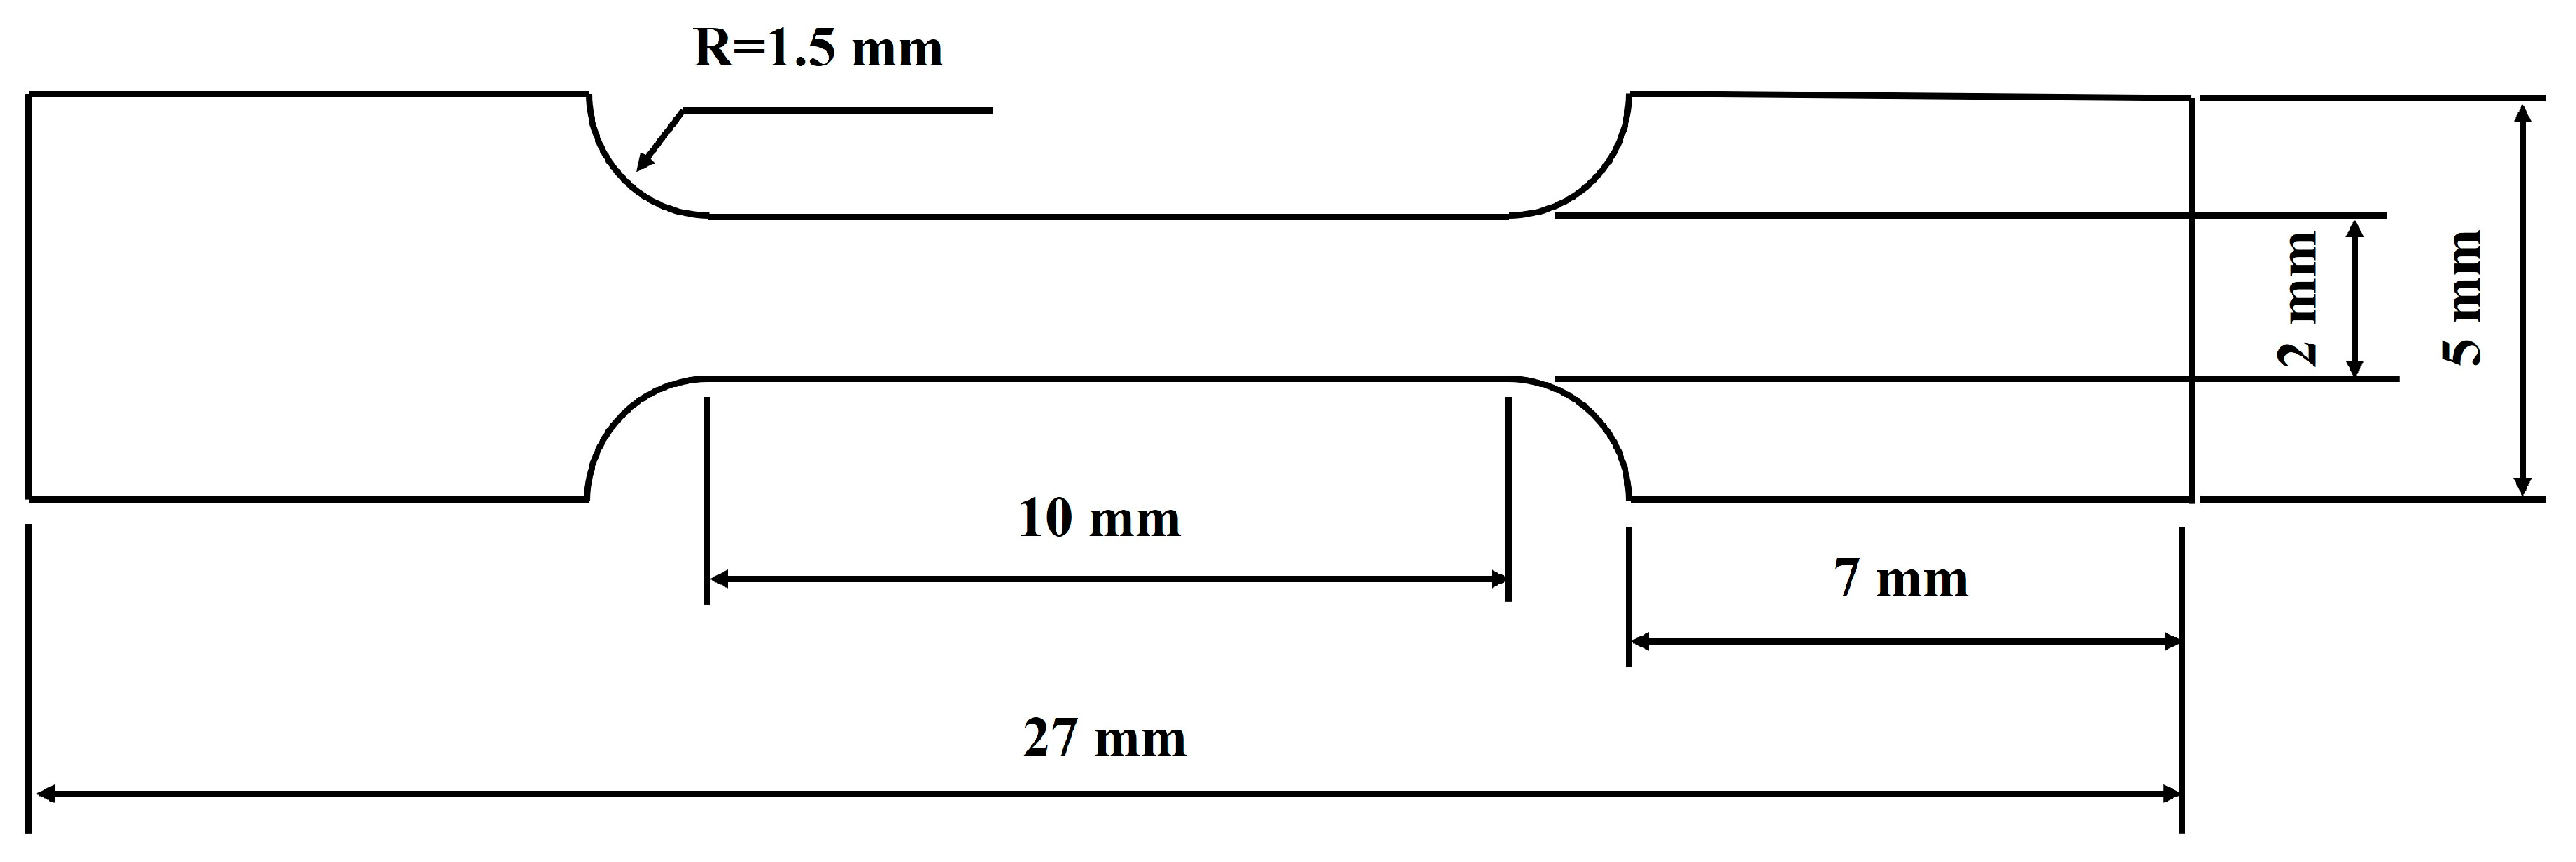
2.4. Mechanical Properties
3. Results
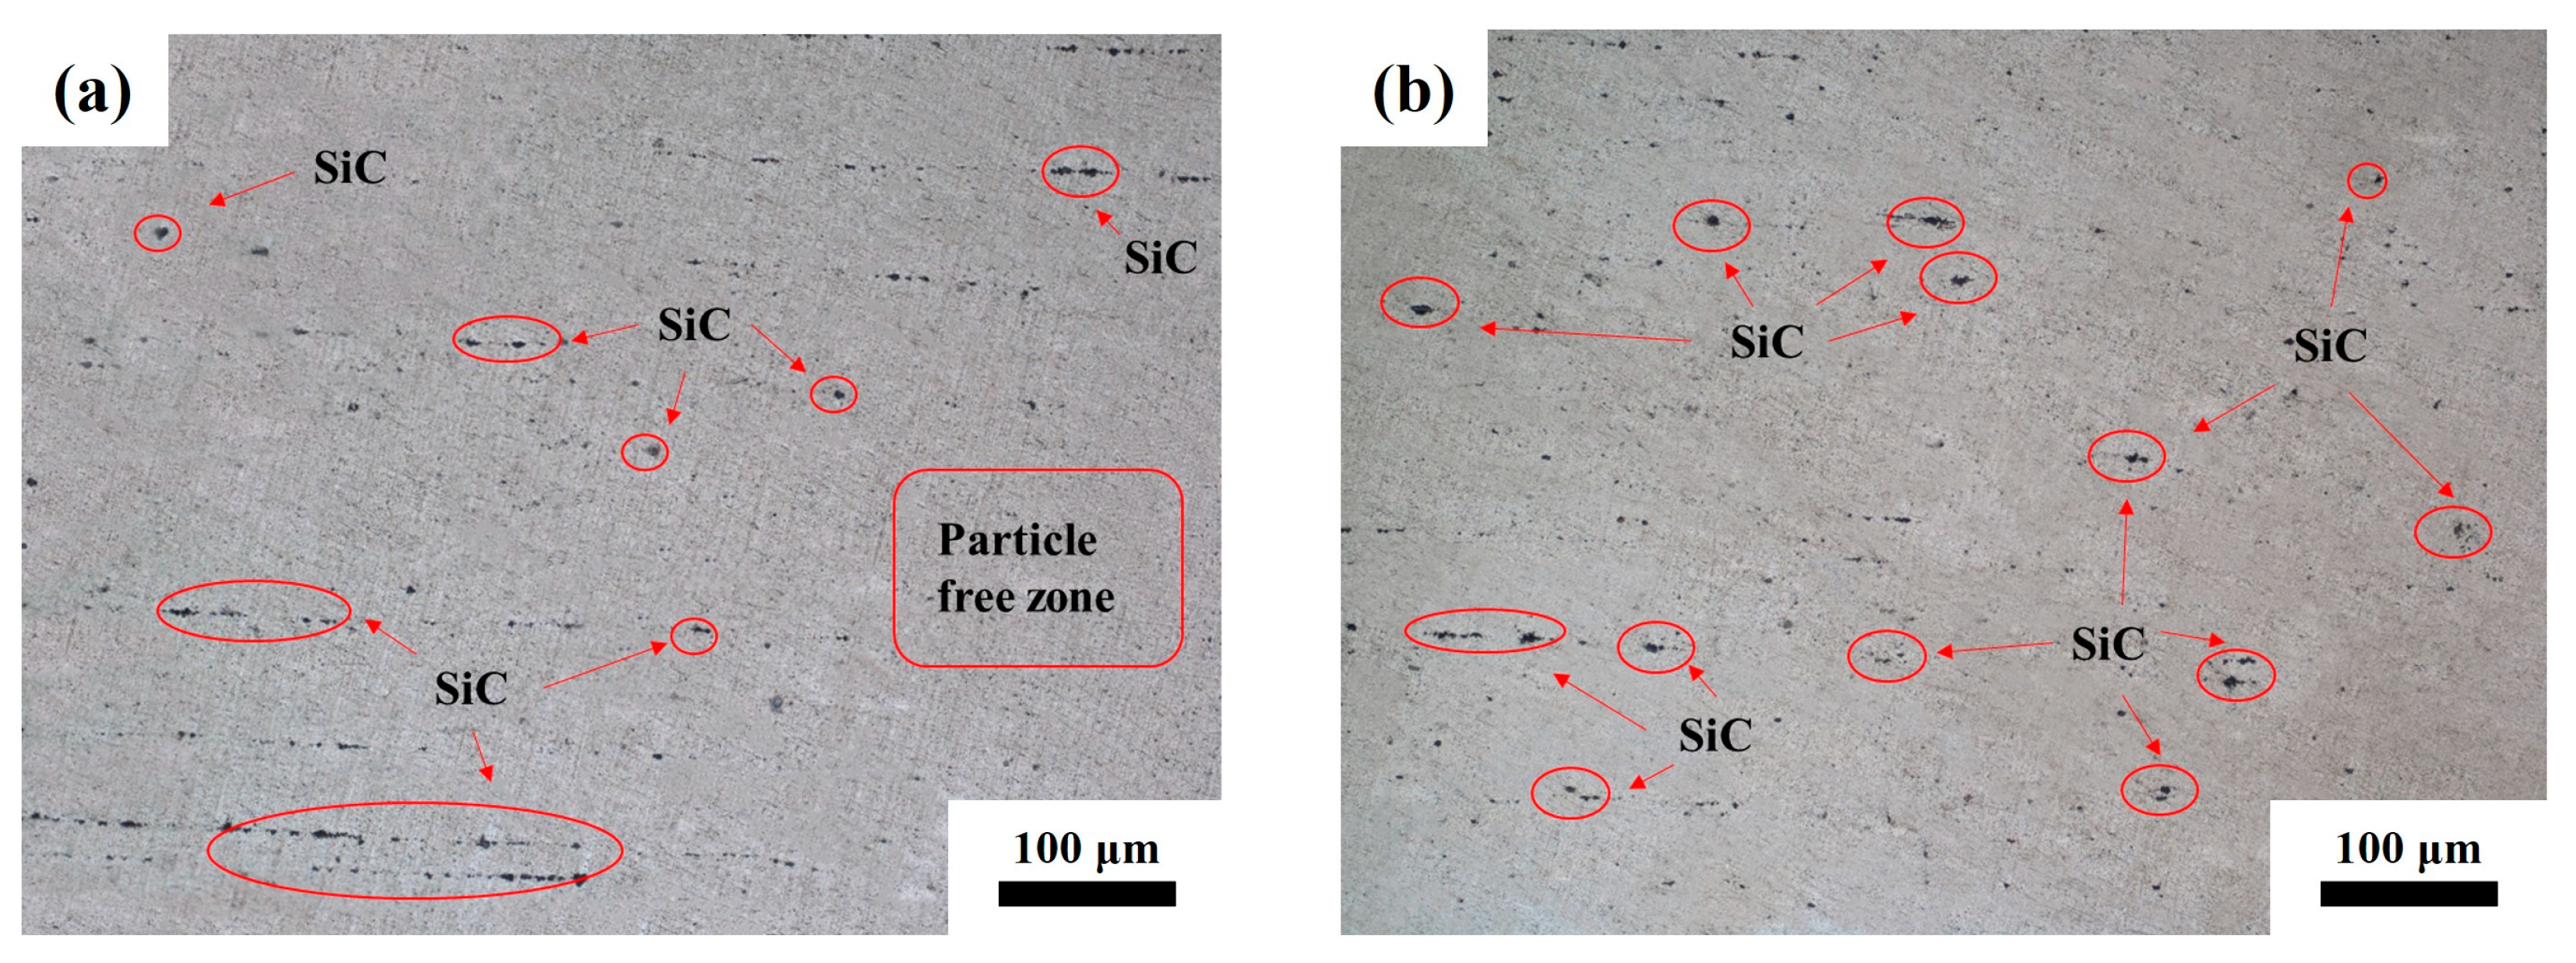
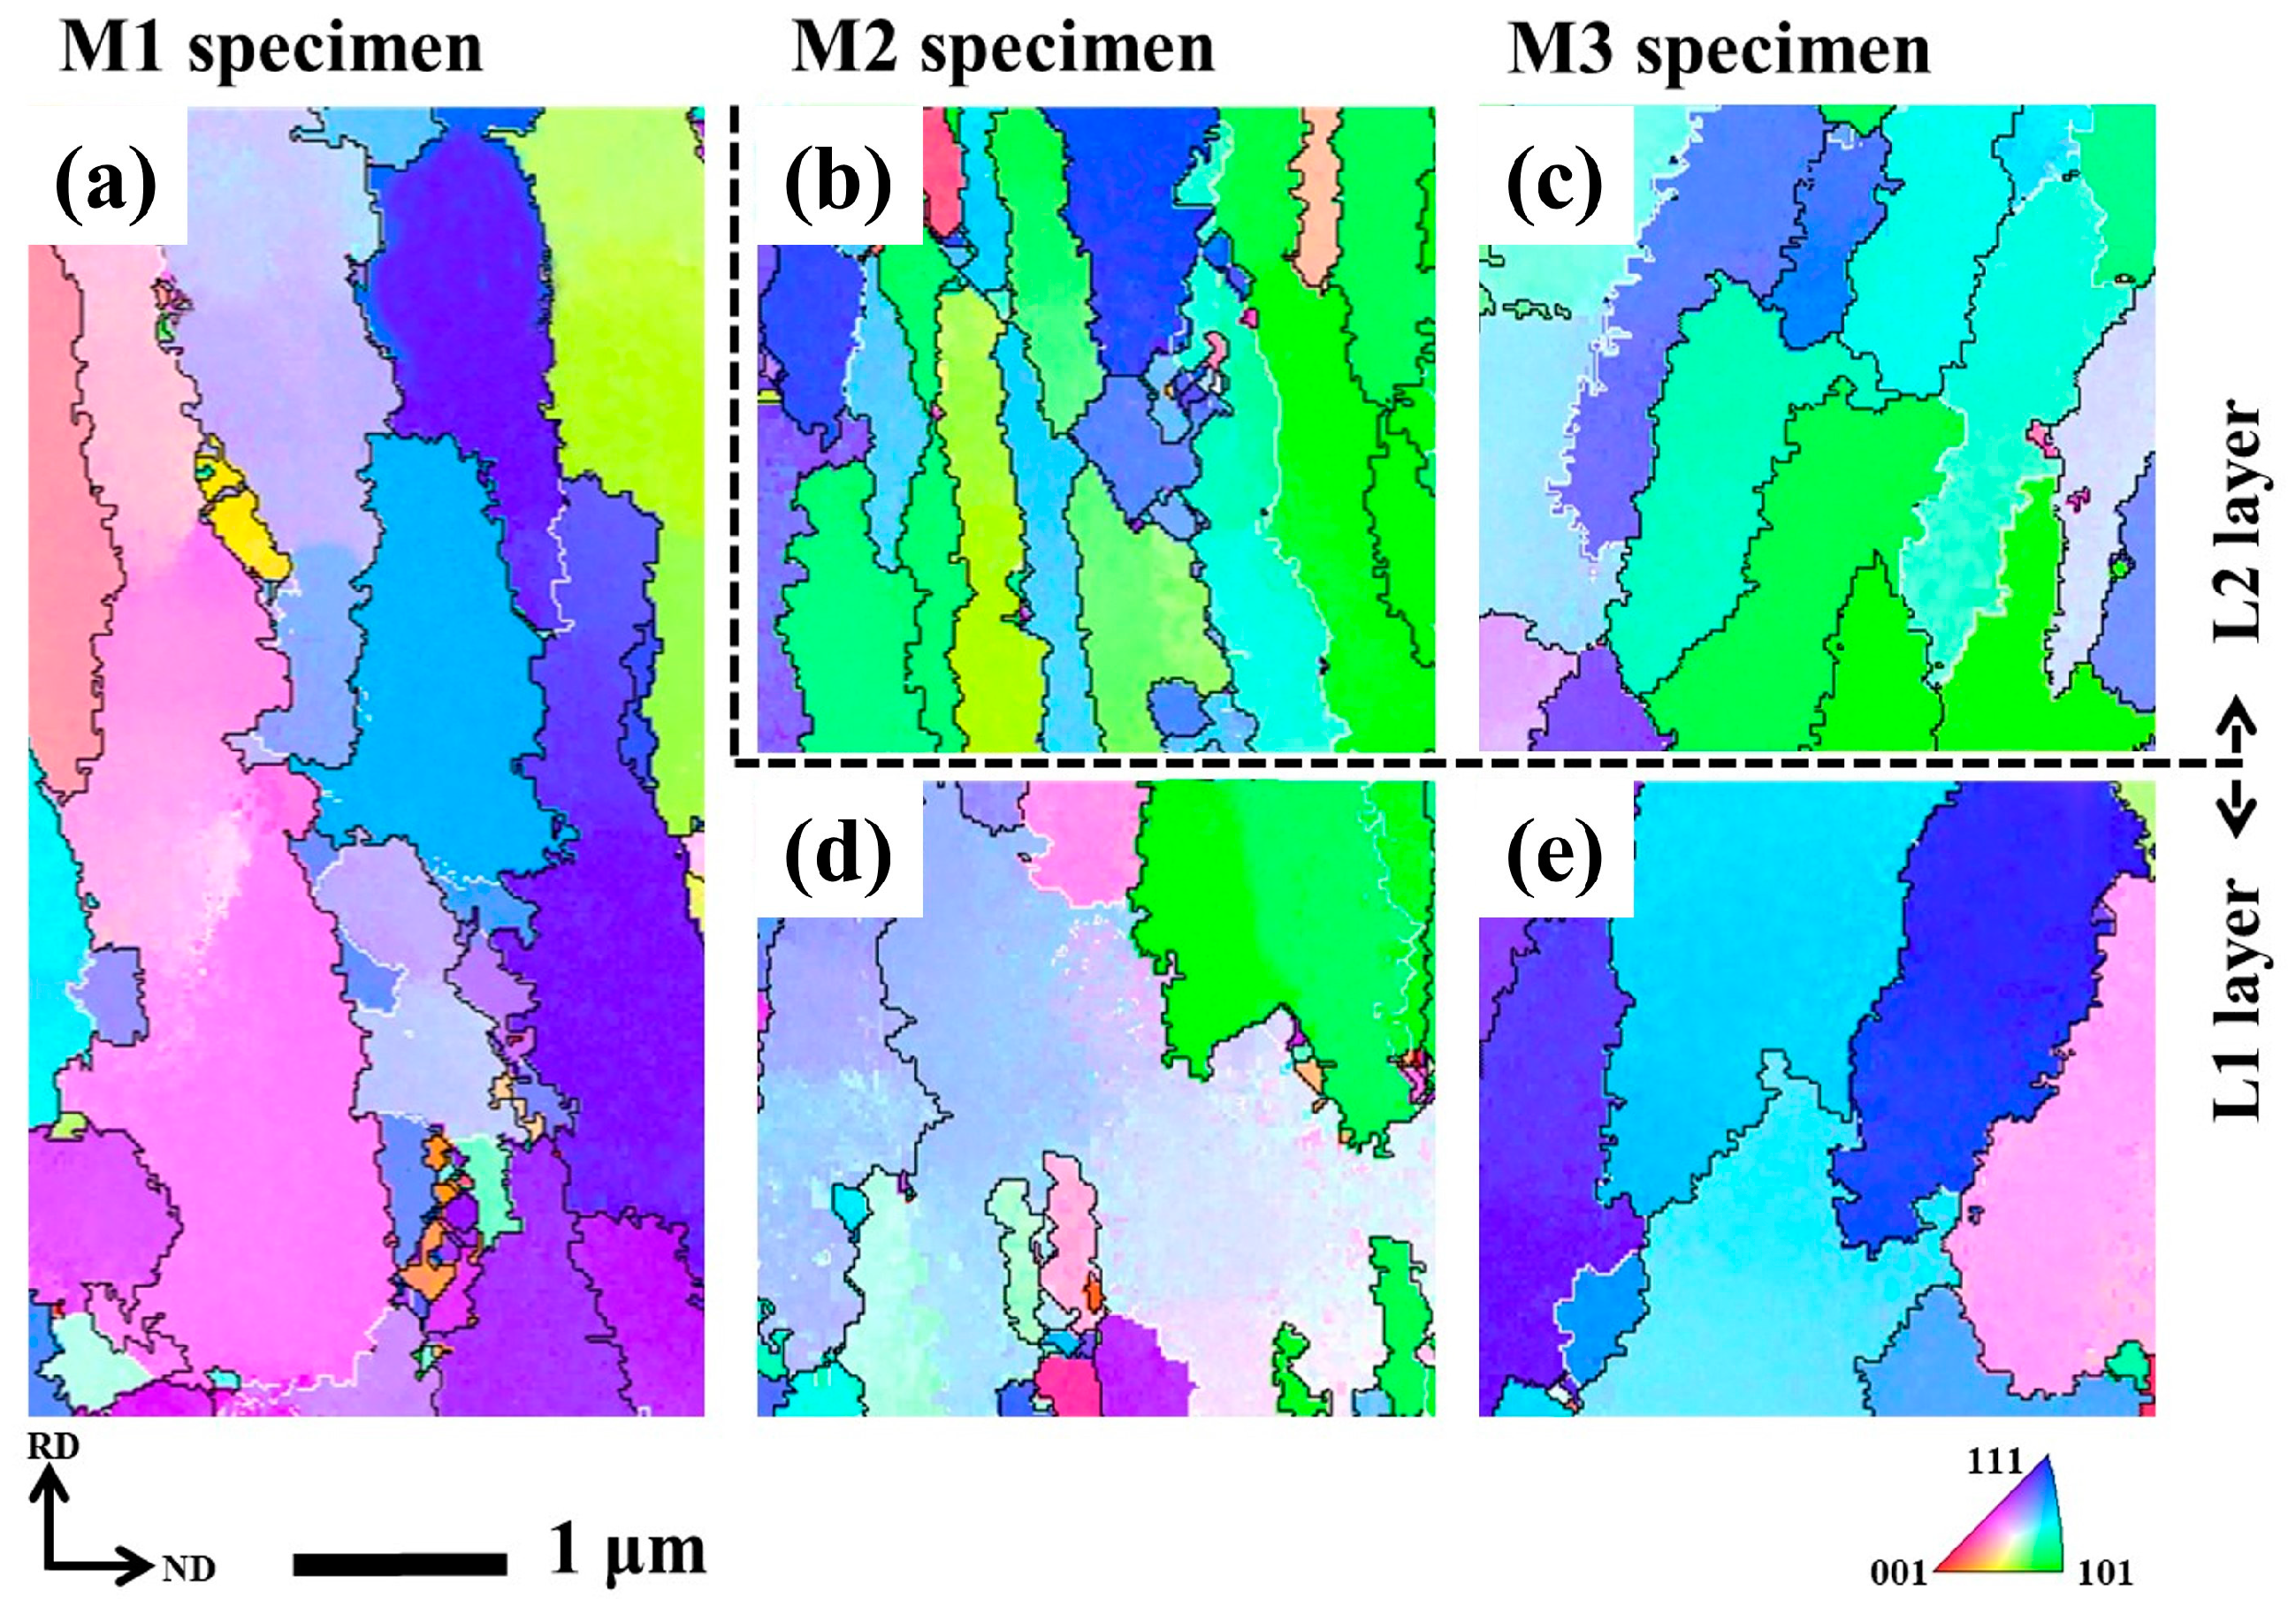
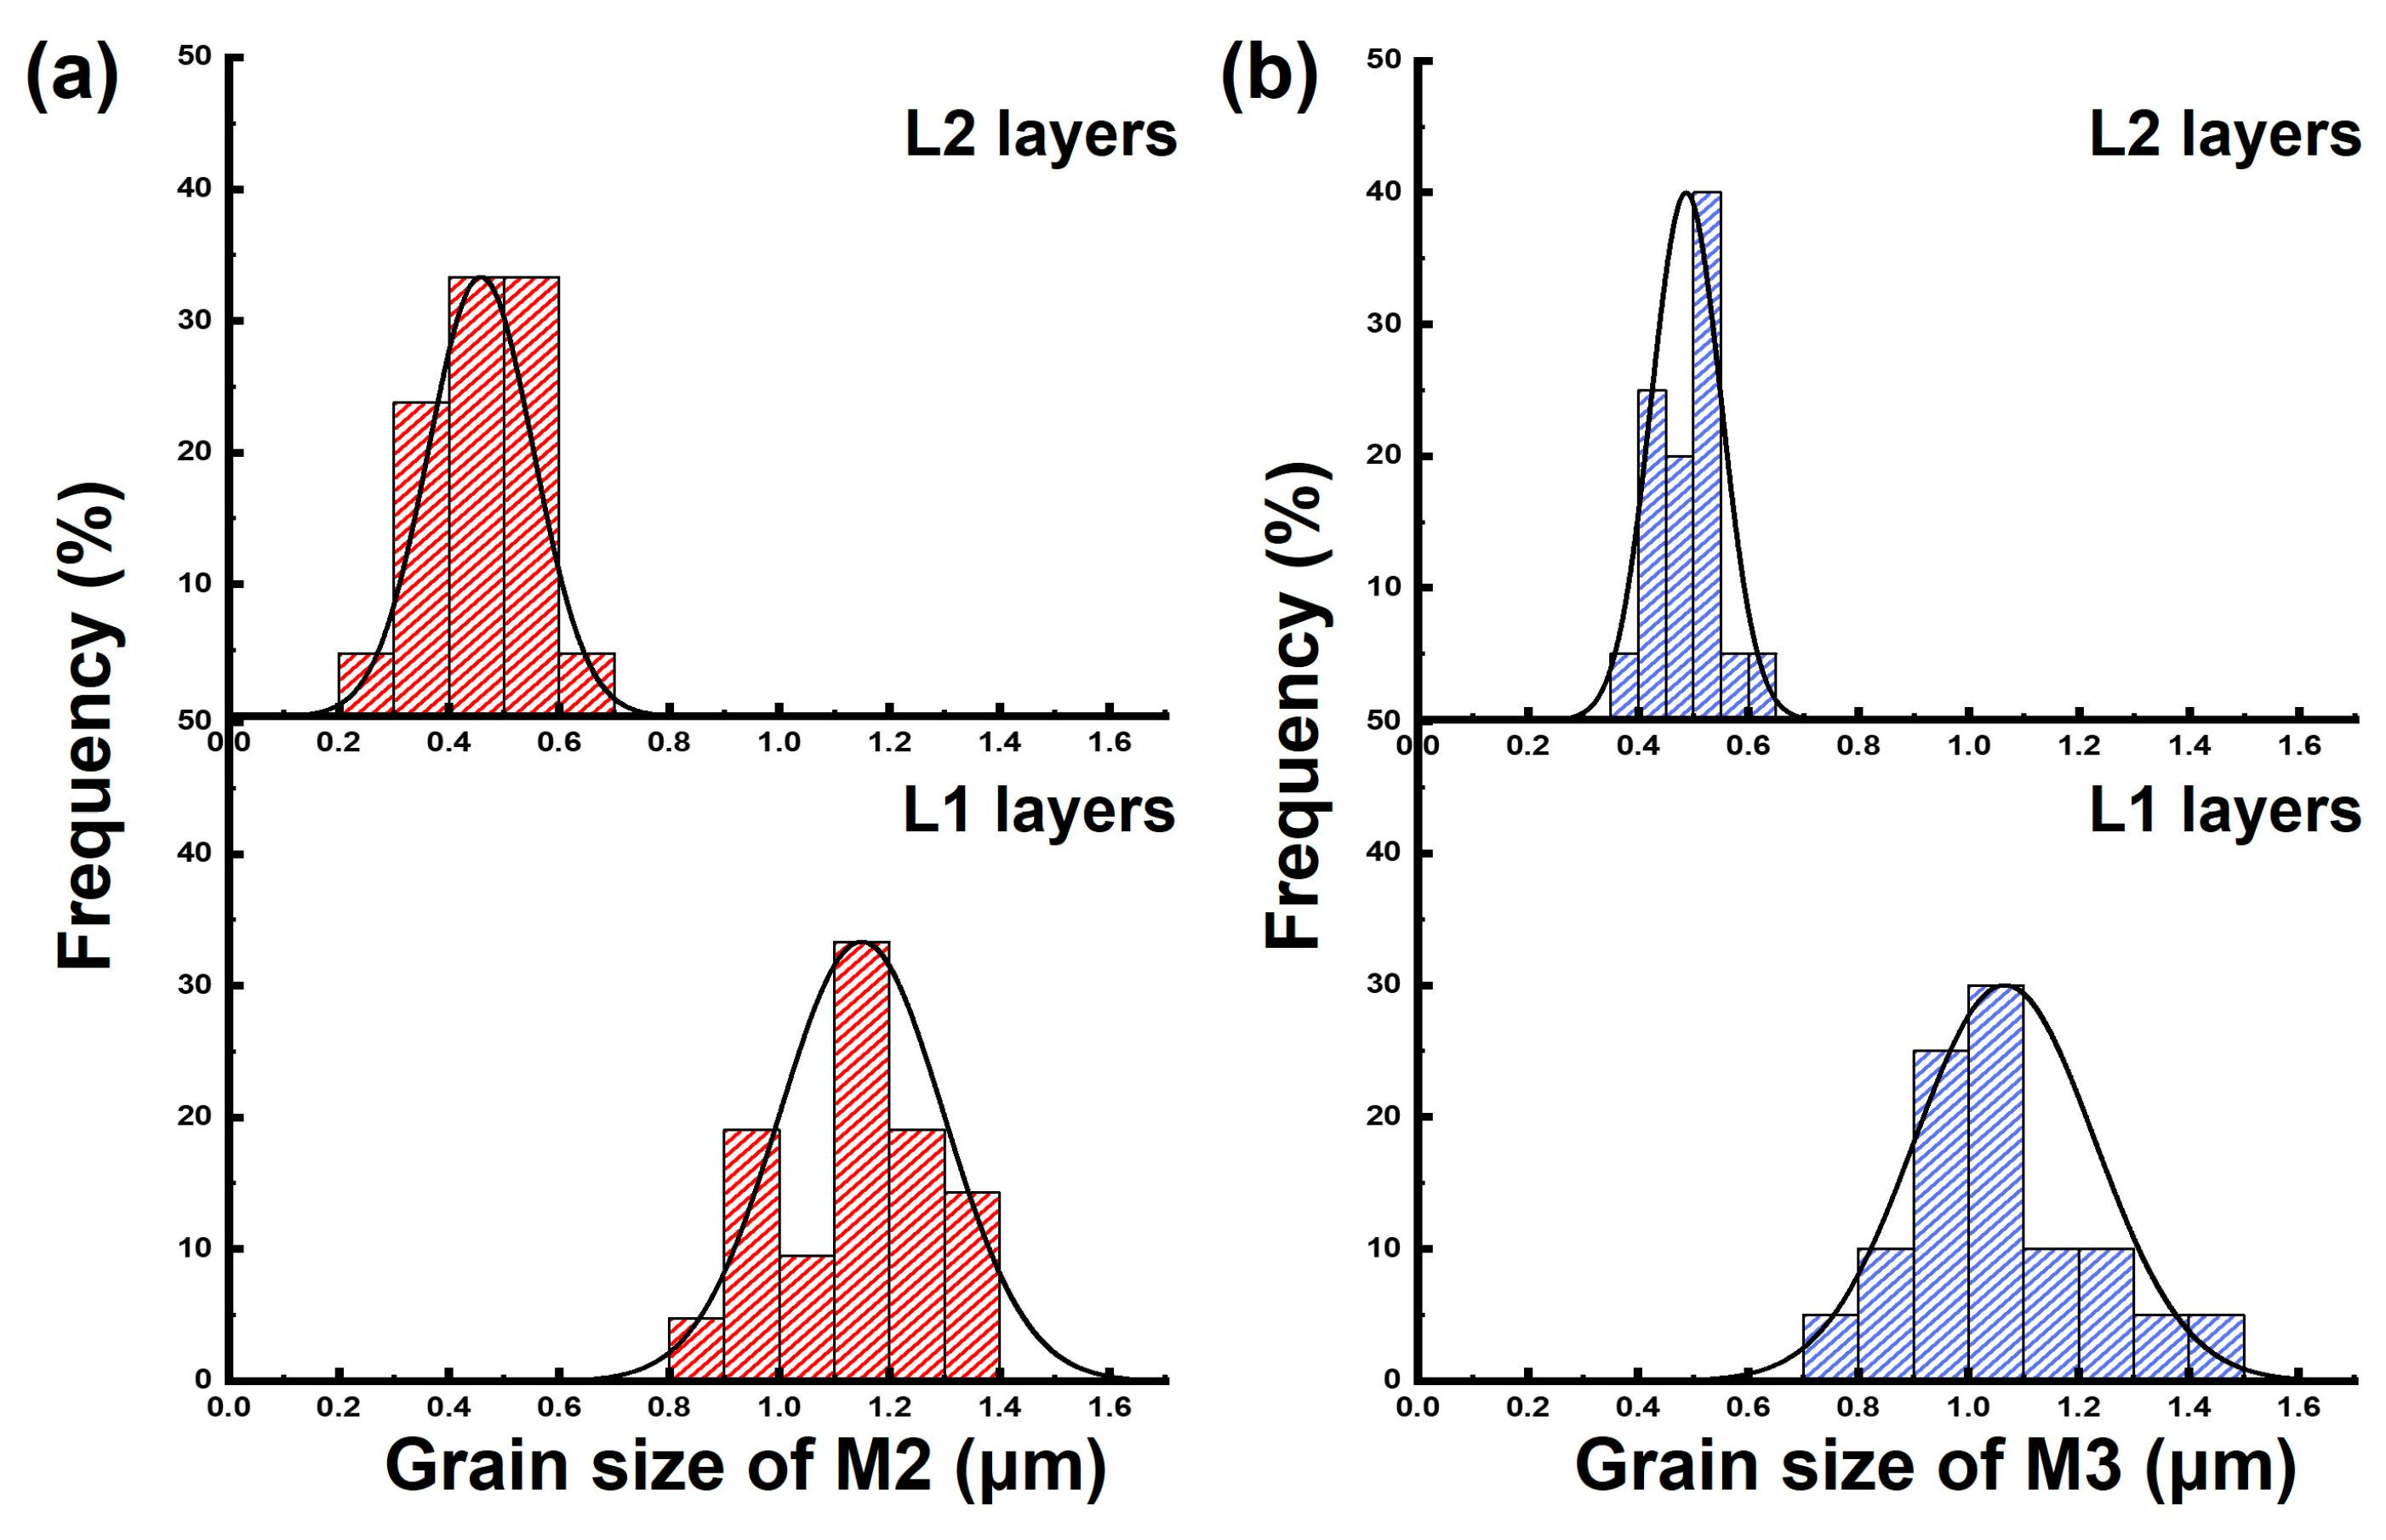
3.1. Microstructure Evolution
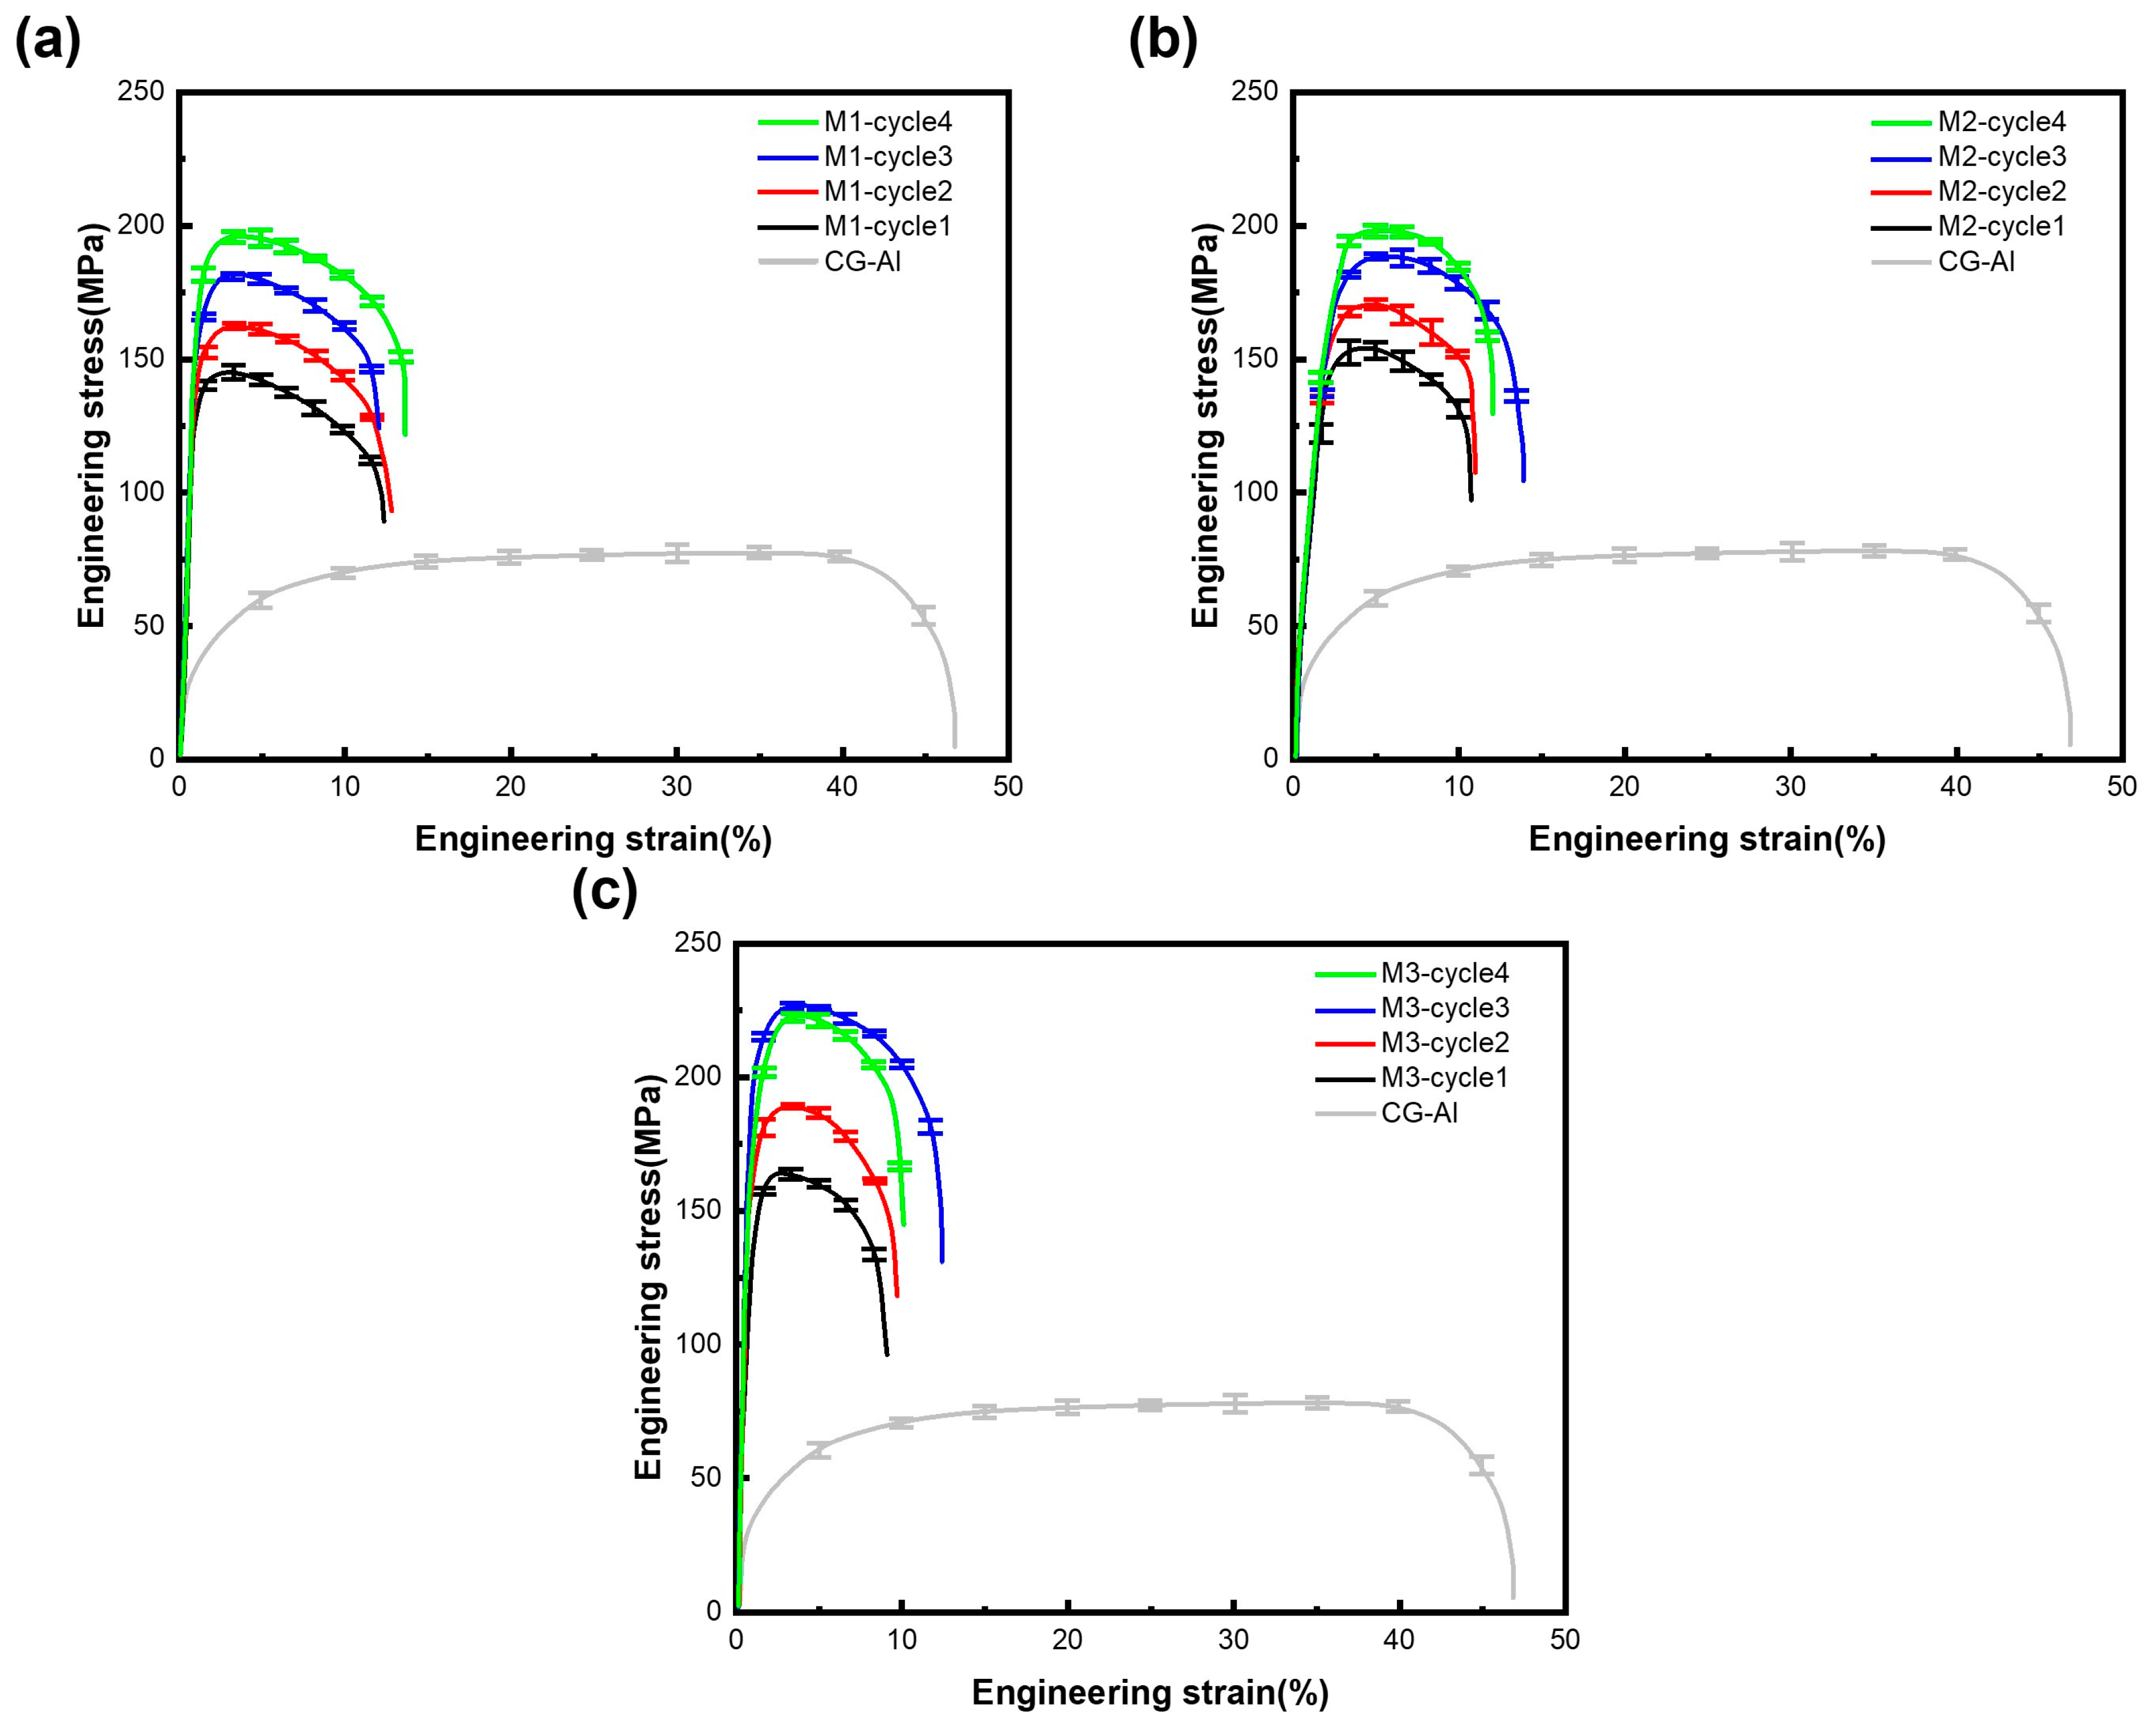
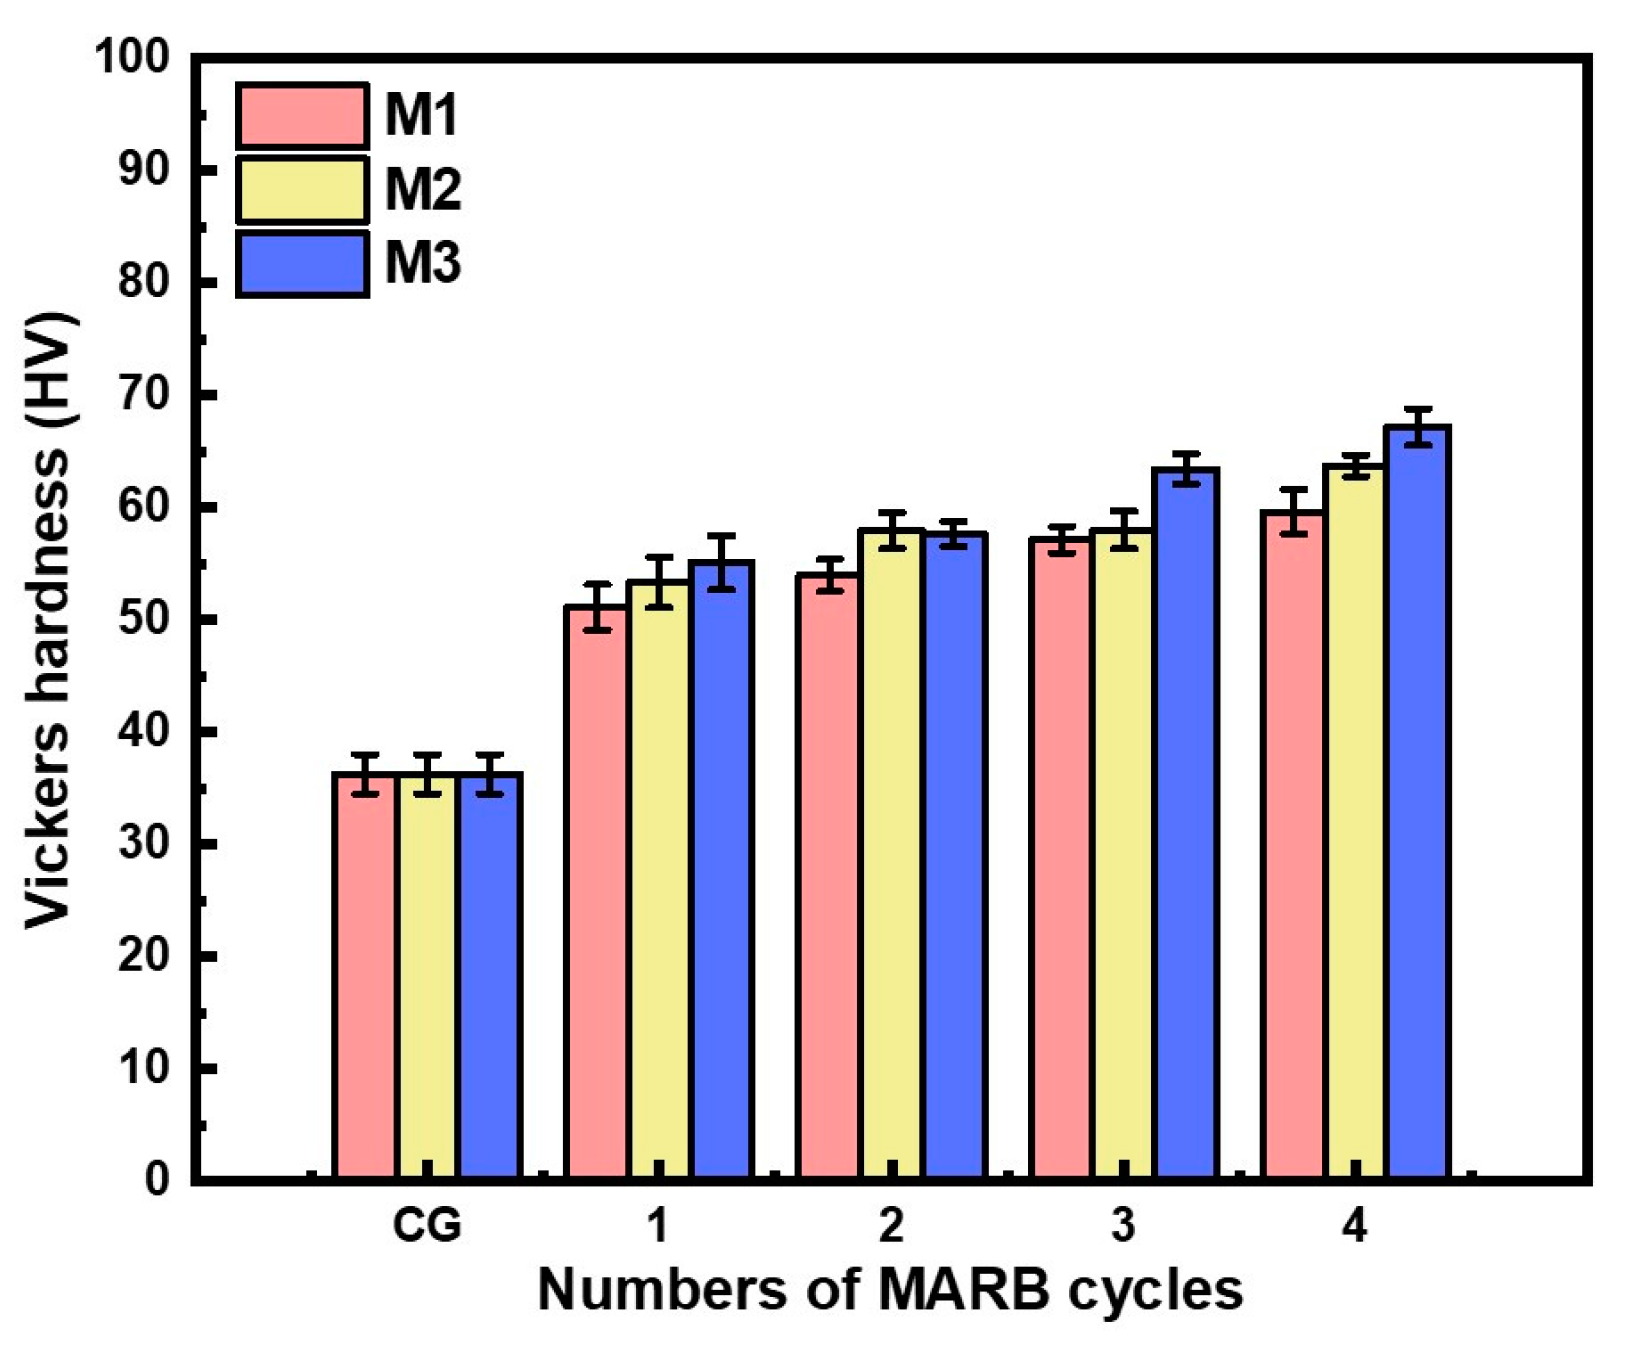
3.2. Mechanical Properties
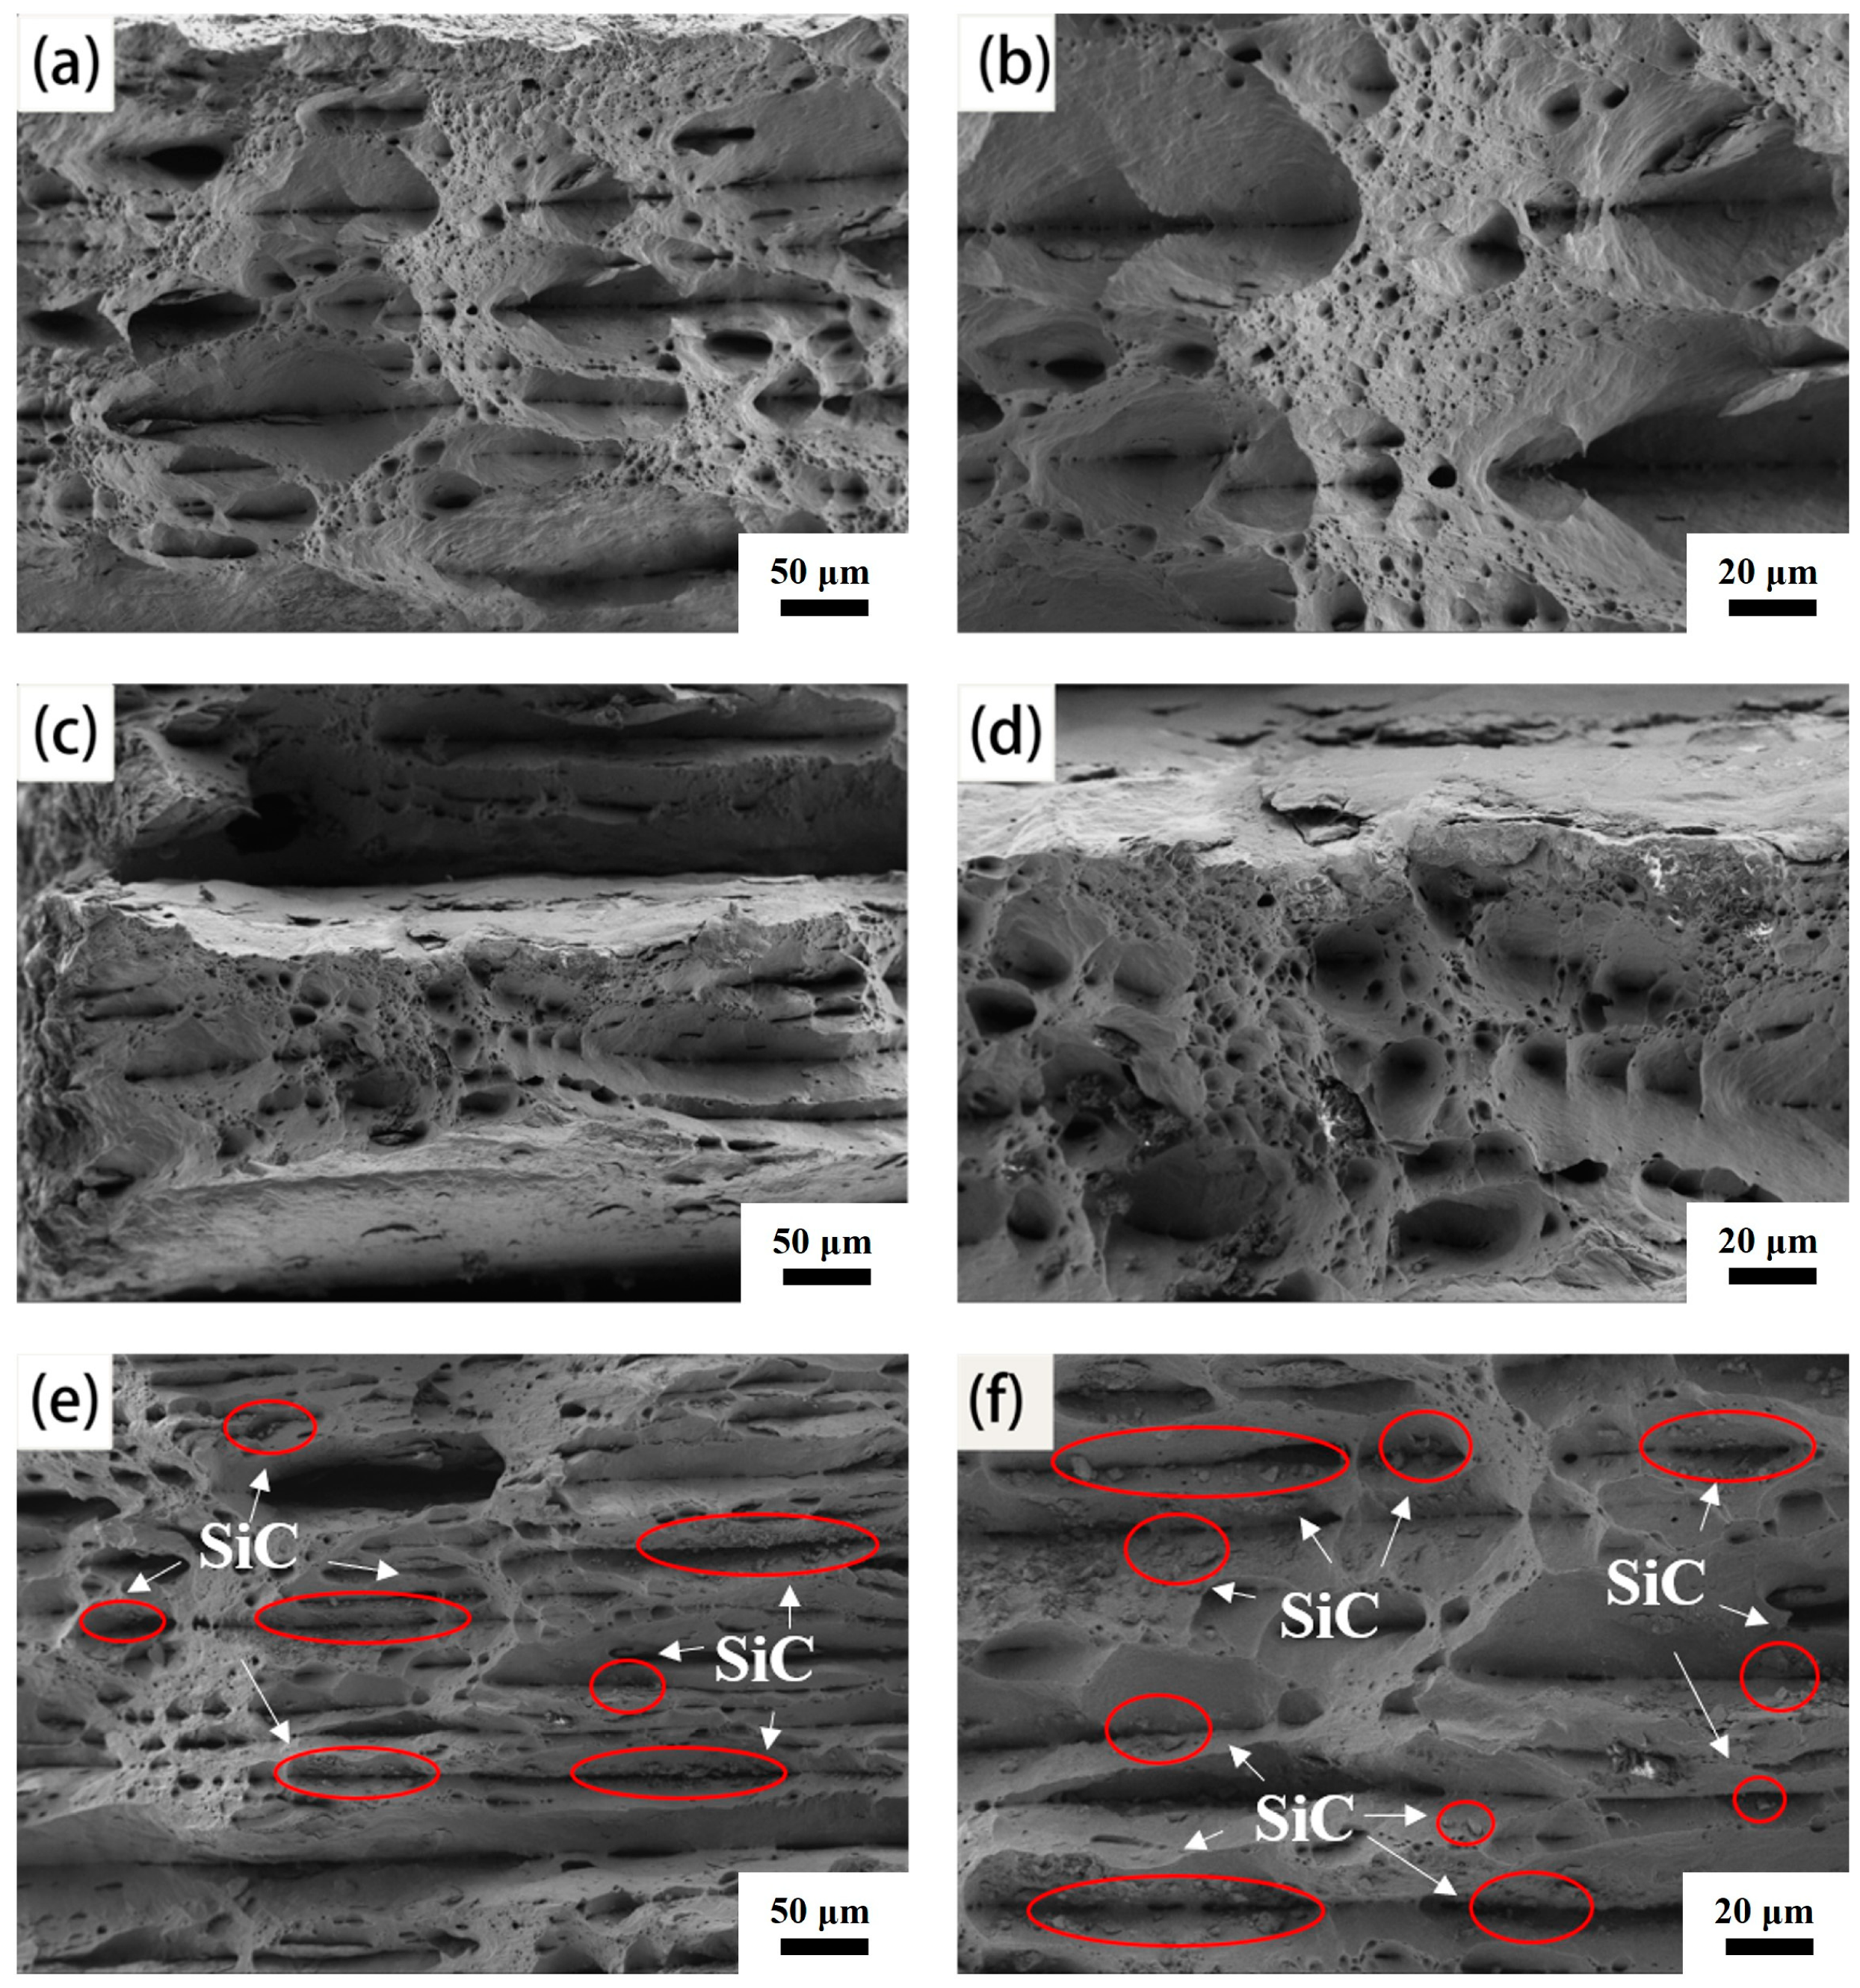
3.3. Fractography
4. Discussion
4.1. Microstructure Evolution
4.2. Mechanical Properties
4.3. Fractography
5. Conclusions
- (1)
- Grain size less than and greater than 1 μm bimodal Al-SiC composite with high strength (225 MPa) and elongation (13%) was obtained. The bimodal MMCs reached a reasonable balance between strength and ductility.
- (2)
- The AGS in the ND for the L1 layers of samples M1, M2 and M3 were 0.92, 1.15 and 1.07 μm, while that for the L2 layers of M2 and M3 were 0.46 and 0.48 μm after three MARB cycles. The grain size was controlled by intermediate annealing during one MARB cycle.
- (3)
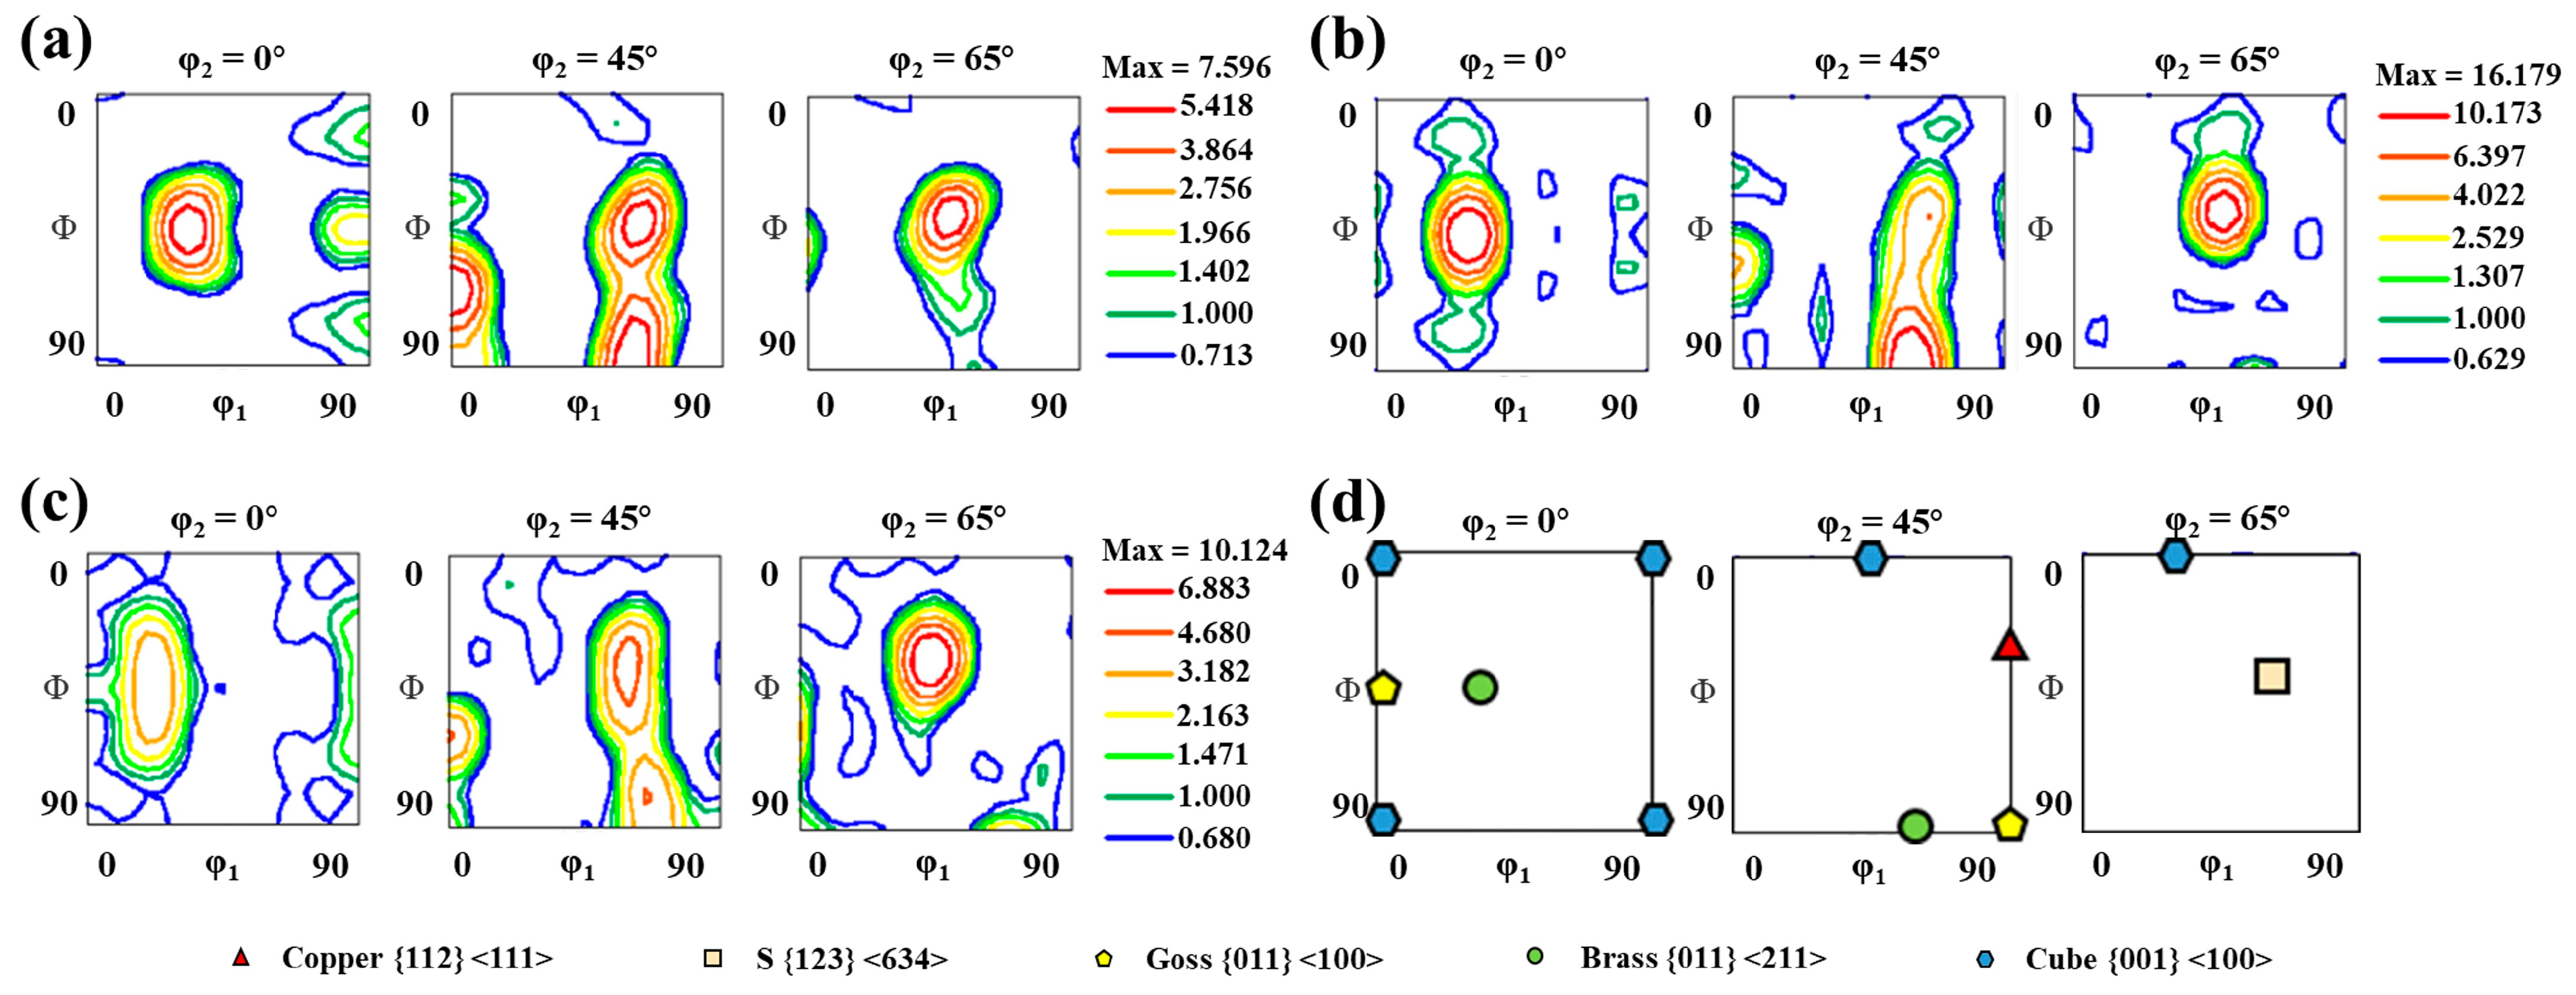
- The texture components of the M3 samples consisted of S {123} <634>, Brass {011} <211>, Cube {001} <100> and Copper {112} <111>. The texture components of the M1 were Brass {011} <211>, S {123} <634> and Cube {001} <100>. Brass {011} <211>, S {123} <634>, Copper {112} <111> and Goss {011} <100> components were analyzed in the M2 samples. The differences in the three samples caused the variation in the texture components.
- (4)
- With an increasing number of layers, the number of bonding interfaces caused a limited reduction in tensile strength. Strength saturation was observed in the M3 samples after four MARB cycles.
- (5)
- All samples conformed to ductile fracture with an equiaxed dimple. Dimples in the M1 sample were fine and equiaxed. Honeycomb, equiaxed and deep dimples were found in M2. The morphology of M3 was mainly acicular dimples and circular micropores along the SiC particles.
Author Contributions
Funding
Institutional Review Board Statement
Informed Consent Statement
Data Availability Statement
Conflicts of Interest
References
- Wang, Y.; Zhang, S.; Wu, R.; Turakhodjaev, N.; Zhang, J.; Liu, M.; Mardonakulov, S. Concurrently improving uniform elongation and strength of ultrafine-grained Al–2Li alloy. Mater. Sci. Eng. A 2020, 792, 139848. [Google Scholar] [CrossRef]
- Ivanov, K.V.; Ovcharenko, V.E. Structural features of ultrafine-grained aluminum processed through accumulative roll bonding providing improved mechanical properties and thermal stability. Mater. Sci. Eng. A 2020, 775, 138988. [Google Scholar] [CrossRef]
- Etemad, A.; Dini, G.; Schwarz, S. Accumulative roll bonding (ARB)-processed high-manganese twinning induced plasticity (TWIP) steel with extraordinary strength and reasonable ductility. Mater. Sci. Eng. A 2019, 742, 27–32. [Google Scholar] [CrossRef]
- Wang, M.; Lv, H.; Zhang, C.; Li, M.; Gao, H.; Wang, J.; Sun, B. High strength high electrical conductivity ultrafine-grained Al–Y alloy processed via cold drawing. Mater. Sci. Eng. A 2020, 772, 138824. [Google Scholar] [CrossRef]
- Feng, Z.; Hu, H.; Wang, J.; Dong, H.; Zhang, X.; Ma, J.; Wang, J.; Liu, D.; Li, J.; Zhang, X. Revealing the evolution mechanisms of microstructure, texture and mechanical behavior in Zr702 alloy plates fabricated by accumulative roll bonding. Mater. Sci. Eng. A 2023, 864, 144609. [Google Scholar] [CrossRef]
- Xu, R.; Liang, N.; Zhuang, L.; Wei, D.; Zhao, Y. Microstructure and mechanical behaviors of Al/Cu laminated composites fabricated by accumulative roll bonding and intermediate annealing. Mater. Sci. Eng. A 2022, 832, 142510. [Google Scholar] [CrossRef]
- Ebrahimi, M.; Wang, Q. Accumulative roll-bonding of aluminum alloys and composites: An overview of properties and performance. J. Mater. Res. Technol. 2022, 19, 4381–4403. [Google Scholar] [CrossRef]
- Wang, Y.; Zhong, F.; Wu, R.; Wu, H.; Turakhodjaev, N.; Kudratkhon, B.; Sun, J.; Hou, L.; Zhang, J.; Li, X.; et al. High-strength, ductility and modulus Al–Li/B4C composite with near nanostructure produced by accumulative roll bonding. J. Alloys Compd. 2020, 834, 155105. [Google Scholar] [CrossRef]
- Alawadhi, M.Y.; Sabbaghianrad, S.; Huang, Y.; Langdon, T.G. Evaluating the paradox of strength and ductility in ultrafine-grained oxygen-free copper processed by ECAP at room temperature. Mater. Sci. Eng. A 2021, 802, 140546. [Google Scholar] [CrossRef]
- Jang, G.; Kim, J.N.; Lee, H.; Lee, T.; Enikeev, N.; Abramova, M.; Valiev, R.Z.; Kim, H.S.; Lee, C.S. Microstructural evolution and mechanical properties of nanocrystalline Fe–Mn–Al–C steel processed by high-pressure torsion. Mater. Sci. Eng. A 2021, 827, 142073. [Google Scholar]
- Bazarnik, P.; Bartkowska, A.; Huang, Y.; Szlązak, K.; Adamczyk-Cieślak, B.; Sort, J.; Lewandowska, M.; Langdon, T.G. Fabrication of hybrid nanocrystalline Al–Ti alloys by mechanical bonding through high-pressure torsion. Mater. Sci. Eng. A 2022, 833, 142549. [Google Scholar] [CrossRef]
- Saito, Y.; Utsunomiya, H.; Tsuji, N.; Sakai, T. Novel ultra-high straining process for bulk materials—Development of the accumulative roll-bonding (ARB) process. Acta Mater. 1999, 47, 579–583. [Google Scholar] [CrossRef]
- Kümmel, F.; Diepold, B.; Sauer, K.F.; Schunk, C.; Prakash, A.; Höppel, H.W.; Göken, M. High Lightweight Potential of Ultrafine-Grained Aluminum/Steel Laminated Metal Composites Produced by Accumulative Roll Bonding. Adv. Eng. Mater. 2019, 21, 1800286. [Google Scholar] [CrossRef]
- Ostolaza, M.; Arrizubieta, J.I.; Queguineur, A.; Valtonen, K.; Lamikiz, A.; Ituarte, I.F. Influence of process parameters on the particle–matrix interaction of WC-Co metal matrix composites produced by laser-directed energy deposition. Mater. Des. 2022, 223, 111172. [Google Scholar] [CrossRef]
- Shalnova, S.A.; Volosevich, D.V.; Sannikov, M.I.; Magidov, I.S.; Mikhaylovskiy, K.V.; Turichin, G.A.; Klimova-Korsmik, O.G. Direct energy deposition of SiC reinforced Ti–6Al–4V metal matrix composites: Structure and mechanical properties. Ceram. Int. 2022, 48, 35076–35084. [Google Scholar] [CrossRef]
- Wu, H.; Xu, W.; Shan, D.; Wang, X.; Guo, B.; Jin, B.C. Micromechanical modeling of damage evolution and fracture behavior in particle reinforced metal matrix composites based on the conventional theory of mechanism-based strain gradient plasticity. J. Mater. Res. Technol. 2023, 22, 625–641. [Google Scholar] [CrossRef]
- Zhang, Y.; Yu, Y.; Wang, L.; Li, Y.; Lin, F.; Yan, W. Dispersion of reinforcing micro-particles in the powder bed fusion additive manufacturing of metal matrix composites. Acta Mater. 2022, 235, 118086. [Google Scholar] [CrossRef]
- He, H.; Fan, G.; Saba, F.; Tan, Z.; Su, Z.; Xiong, D.; Li, Z. Enhanced distribution and mechanical properties of high content nanoparticles reinforced metal matrix composite prepared by flake dispersion. Composites Part B 2023, 252, 110514. [Google Scholar] [CrossRef]
- Ghalehbandi, S.M.; Malaki, M.; Gupta, M. Accumulative Roll Bonding—A Review. Appl. Sci. 2019, 9, 3627. [Google Scholar] [CrossRef] [Green Version]
- Alizadeh, M.; Paydar, M.H. Fabrication of Al/SiCP composite strips by repeated roll-bonding (RRB) process. J. Alloys Compd. 2009, 477, 811–816. [Google Scholar] [CrossRef]
- Zheng, H.; Wu, R.; Hou, L.; Zhang, J.; Zhang, M. Mathematical analysis and its experimental comparisons for the accumulative roll bonding (ARB) process with different superimposed layers. J. Magn. Alloys 2021, 9, 1741–1752. [Google Scholar] [CrossRef]
- Xu, R.; Tang, D.; Ren, X.; Wen, X.; Wen, Y. Improvement of the matrix and the interface quality of a Cu/Al composite by the MARB process. Rare Met. 2007, 26, 230–235. [Google Scholar] [CrossRef]
- Lu, K. Making strong nanomaterials ductile with gradients. Science 2014, 345, 1455–1456. [Google Scholar] [CrossRef] [PubMed]
- Li, R.; Ding, Y.; Zhang, H.; Lei, J.; Shen, Y. Effective strengthening and toughening in Zn–1Mg alloy with bimodal grain structure achieved by conventional extrusion. Mater. Sci. Eng. A 2022, 854, 143850. [Google Scholar] [CrossRef]
- Naseri, M.; Reihanian, M.; Borhani, E. A new strategy to simultaneous increase in the strength and ductility of AA2024 alloy via accumulative roll bonding (ARB). Mater. Sci. Eng. A 2016, 656, 12–20. [Google Scholar] [CrossRef]
- Wang, Y.M.; Ma, E. Three strategies to achieve uniform tensile deformation in a nanostructured metal. Acta Mater. 2004, 52, 1699–1709. [Google Scholar] [CrossRef]
- Wu, X.; Yang, M.; Yuan, F.; Wu, G.; Wei, Y.; Huang, X.; Zhu, Y. Heterogeneous lamella structure unites ultrafine-grain strength with coarse-grain ductility. Proc. Natl. Acad. Sci. USA 2015, 112, 14501–14505. [Google Scholar] [CrossRef] [PubMed] [Green Version]
- Hosseiny, N.; Shabani, A.; Toroghinejad, M.R. Effect of bimodal microstructure on texture evolution and mechanical proper-ties of 1050 Al alloy processed through severe plastic deformation and subsequent annealing. Mater. Sci. Eng. A 2021, 82, 141580. [Google Scholar] [CrossRef]
- Tsuji, N.; Ito, Y.; Saito, Y.; Minamino, M. Strength and ductility of ultrafine grained aluminum and iron produced by ARB and annealing. Scr. Mater. 2002, 47, 893–899. [Google Scholar] [CrossRef]
- Azad, B.; Borhani, E. Pre-aging time dependence of microstructure and mechanical properties in nanostructured Al-2wt% Cu alloy. Met. Mater. Int. 2016, 22, 243–251. [Google Scholar] [CrossRef]
- Sarvi, Z.; Sadeghi, A.; Mashhadi, M.M.; Guo, B. Effect of Accumulative Roll Bonding (ARB) strain path on microstructural evolution and crystallographic texture development in aluminium. J. Mater. Res. Technol. 2022, 21, 1061–1071. [Google Scholar] [CrossRef]
- Naseri, M.; Reihanian, M.; Borhani, E. Effect of strain path on microstructure, deformation texture and mechanical properties of nano/ultrafine grained AA1050 processed by accumulative roll bonding (ARB). Mater. Sci. Eng. A 2016, 673, 288–298. [Google Scholar] [CrossRef]
- Borhani, E.; Jafarian, H.; Shibata, A.; Tsuji, N. Texture evolution in Al–0.2 mass% Sc alloy during ARB process and subsequent annealing. Mater. Trans. 2012, 53, 72–80. [Google Scholar] [CrossRef] [Green Version]
- Baazamat, S.; Tajally, M.; Borhani, E. Fabrication and characteristic of Al-based hybrid nanocomposite reinforced with WO3 and SiC by accumulative roll bonding process. J. Alloys Compd. 2015, 653, 39–46. [Google Scholar] [CrossRef]
- Khdair, A.I.; Fathy, A. Enhanced strength and ductility of Al-SiC nanocomposites synthesized by accumulative roll bonding. J. Mater. Res. Technol. 2020, 9, 478–489. [Google Scholar] [CrossRef]
- Alizadeh, M.; Paydar, M.H. Fabrication of nanostructure Al/SiCP composite by accumulative roll-bonding (ARB) process. J. Alloys Compd. 2010, 492, 231–235. [Google Scholar] [CrossRef]
- Reihanian, M.; Fayezipour, S.; Lari Baghal, S.M. Nanostructured Al/SiC-graphite composites produced by accumulative roll bonding: Role of graphite on microstructure, wear and tensile behavior. J. Mater. Eng. Perform. 2017, 26, 1908–1919. [Google Scholar] [CrossRef]
- Kamikawa, N.; Tsuji, N.; Minamino, Y. Microstructure and texture through thickness of ultralow carbon IF steel sheet severely deformed by accumulative roll-bonding. Sci. Technol. Adv. Mater. 2004, 5, 163. [Google Scholar] [CrossRef] [Green Version]
- Quadir, M.Z.; Ferry, M.; Al-Buhamad, O.; Munroe, P.R. Shear banding and recrystallization texture development in a multilayered Al alloy sheet produced by accumulative roll bonding. Acta Mater. 2009, 57, 29–40. [Google Scholar] [CrossRef]
- Chowdhury, S.G.; Dutta, A.; Ravikumar, B.; Kumar, A. Textural evolution during accumulative roll bonding of an Al–Li alloy. Mater. Sci. Eng. A 2006, 428, 351–357. [Google Scholar] [CrossRef]
- Wang, X.; Guo, M.; Chapuis, A.; Luo, J.; Zhang, J.; Zhuang, L. The dependence of final microstructure, texture evolution and mechanical properties of Al–Mg–Si–Cu alloy sheets on the intermediate annealing. Mater. Sci. Eng. A 2015, 633, 46–58. [Google Scholar] [CrossRef]
- Zhao, Q.; Liu, Z.; Huang, T.; Xia, P.; Li, F. Enhanced fracture toughness in an annealed Al-Cu-Mg alloy by increasing Goss/Brass texture ratio. Mater. Charact. 2016, 119, 47–54. [Google Scholar] [CrossRef]
- Reihanian, M.; Hadadian, F.K.; Paydar, M.H. Fabrication of Al–2vol%Al2O3/SiC hybrid composite via accumulative roll bonding (ARB): An investigation of the microstructure and mechanical properties. Mater. Sci. Eng. A 2014, 607, 188–196. [Google Scholar] [CrossRef]
- Attar, A.A.; Nia, A.A.; Mazaheri, Y.; Ghassemali, E. High Strength-Elongation Balance in Warm Accumulative Roll Bonded AA1050 Sheets. Met. Mater. Int. 2022, 28, 346–360. [Google Scholar] [CrossRef]
- Stone, R.V.; Cox, T.B.; Low, J.R.; Psioda, J.A. Microstructural aspects of fracture by dimpled rupture. Int. Met. Rev. 1985, 30, 157–180. [Google Scholar] [CrossRef]


| Element | Al | Si | Ti | Fe | Others |
|---|---|---|---|---|---|
| Wt.% | 99.61 | 0.08 | 0.013 | 0.26 | 0.37 |
Disclaimer/Publisher’s Note: The statements, opinions and data contained in all publications are solely those of the individual author(s) and contributor(s) and not of MDPI and/or the editor(s). MDPI and/or the editor(s) disclaim responsibility for any injury to people or property resulting from any ideas, methods, instructions or products referred to in the content. |
© 2023 by the authors. Licensee MDPI, Basel, Switzerland. This article is an open access article distributed under the terms and conditions of the Creative Commons Attribution (CC BY) license (https://creativecommons.org/licenses/by/4.0/).
Share and Cite
Zhang, S.; Wei, L.; Fu, B.; Guo, Y. Microstructure, Texture and Mechanical Properties of Al-SiC Composite with Bimodal Structure Fabricated by Multi-Layer Accumulative Roll Bonding. Coatings 2023, 13, 512. https://doi.org/10.3390/coatings13030512
Zhang S, Wei L, Fu B, Guo Y. Microstructure, Texture and Mechanical Properties of Al-SiC Composite with Bimodal Structure Fabricated by Multi-Layer Accumulative Roll Bonding. Coatings. 2023; 13(3):512. https://doi.org/10.3390/coatings13030512
Chicago/Turabian StyleZhang, Shengcheng, Liqun Wei, Bin Fu, and Yanhui Guo. 2023. "Microstructure, Texture and Mechanical Properties of Al-SiC Composite with Bimodal Structure Fabricated by Multi-Layer Accumulative Roll Bonding" Coatings 13, no. 3: 512. https://doi.org/10.3390/coatings13030512