
Mathematical Model for Early-Aged UHPFRC Compressive Strength Changes

1
School of Civil and Transportation Engineering, Ningbo University of Technology, Ningbo 315211, China
2
Engineering Research Center of Industrial Construction in Civil Engineering of Zhejiang, Ningbo University of Technology, Ningbo 315211, China
3
Faculty of Mechanical Engineering and Mechanics, Ningbo University, Ningbo 315211, China
*
Author to whom correspondence should be addressed.
Coatings 2023, 13(3), 525; https://doi.org/10.3390/coatings13030525
Submission received: 30 January 2023
/
Revised: 22 February 2023
/
Accepted: 24 February 2023
/
Published: 27 February 2023
(This article belongs to the Special Issue Surface Treatment and Mechanical Properties of Sustainable Pavement Materials)
Abstract
:Compressive strength is the most important mechanical index of ultra-high performance fiber-reinforced concrete (UHPFRC). The rule of changes in compressive strength in early-aged UHPFRC is of great significance to guide concrete curing, formwork removal, and prestress stretching. Therefore, it is very necessary to study an accurate mathematical model to describe the change in compressive strength of UHPFRC at an early age. For this purpose, a new mathematical model of compressive strength age is proposed in this work for predicting the long-term strength of UHPFRC according to a few test data from early-aged UHPFRC. This new model can overcome the shortcomings of the existing models, such as the exponential model, logarithmic model, and polynomial model. The proposed model is first demonstrated by using four groups of compressive strength test data compiled from previous research studies. Subsequently, an experiment of early-aged UHPFRC compressive strength was carried out to further verify the proposed mathematical model. The mixed proportion used in the UHPFRC compressive strength test was 10.87:0.82:1 (powder:steel fiber:water), and the design strength grade was 120 MPa. Based on the UHPFRC experimental data, it was shown that the average fitting error and standard deviation of the new model were about 10%~20% of that of the logarithmic model and the polynomial model. The proposed model can precisely predict the compressive strength of UHPFRC, with a determination coefficient (R2) of 0.9974. The research results show that the average fitting error and standard deviation of this new model were significantly reduced when compared to the existing models, and the predicted compressive strength by the new model on the 60th day is the closest to the actual design strength grade of concrete. The greatest advantage of the proposed method lies in its simple formula, fast implementation, and no need for complex mathematical operations. It has been shown that the proposed model is superior to the existing models due to its higher fitting accuracy and prediction accuracy, and it can be better used to predict the later strength of UHPFRC by using only a few compressive strength test data taken at the early age stage.
1. Introduction
Concrete is widely used in bridge structure, beam, slab, column, and pile foundation engineering in building construction [1,2,3,4]. In recent years, ultra-high performance fiber reinforced concrete (UHPFRC) has become an important development direction of cement-based composites due to its ultra-high strength and excellent durability. Compressive strength is the most important mechanical parameter of UHPFRC. Yang et al. [5] found that the compressive and bending strength of the UHPFRC samples cured at 20 °C decreased by about 20% and 10% compared with the samples cured at 90 °C. Kwon et al. [6] found that the proper volume fraction of the longer fiber is essential in improving the various mechanical properties of UHPFRC, including compressive strength, strain capacity, and energy absorption capacity. Yu et al. [7] discussed the influence of UHPFRC mix design on compressive strength. They used the improved Andreasen & Andersen particle filling model to carry out the mix design to achieve the goal of a dense cement matrix. These studies revealed that curing temperature, mix ratio, and steel fiber content have an important influence on the development of the compressive strength of early-aged UHPFRC. In other words, these factors complicate the development law of UHPFRC compressive strength at an early age. The rule of changes in UHPFRC early compressive strength is of great significance to guide concrete curing, formwork removal, prestress tensioning, and later curing. In view of this, many studies have been carried out on the development law and estimation method of concrete compressive strength in the last few decades. These studies can be broadly divided into two types. The first type is the estimation methods based on multiple factors, such as the curing temperature, water-cement ratio, steel fiber content, curing time, etc. Yeh [8] studied the possibility of artificial neural network (ANN) predictions of compressive strength in high-performance concrete. It was found that the strength model based on the ANN was more accurate than the model based on regression analysis. Bui et al. [9] developed an expert system based on an ANN model and an improved firefly algorithm, which could better predict the property of high-performance concrete. Han et al. [10] studied the prediction of the compressive strength of high-performance concrete based on machine learning. By selecting the appropriate variables based on the importance of random forest measurements, the accuracy and efficiency of the proposed model prediction can be improved. Anyaoha et al. [11] adopted a new integrated computing technology-boosting smooth transition regression tree (BooST) to predict the compressive strength of high-performance concrete. The research results show that BooST is superior to other methods in prediction accuracy, with the smallest error, and is more in line with the laboratory experimental results. Hameed et al. [12] studied the ability of ANNs combined with principal component analysis (PCA) and cross-validation (CV) technology to predict the compressive strength of high-performance concrete. When compared with other models published in previous studies, the performance of the proposed model achieved the expected advantages and more stable prediction. Emad et al. [13] developed four soft computing technologies to predict the compressive strength of UHPFRC, including linear relationships, pure quadratics, M5P trees, and ANNs. The research results show that the ANN model had high prediction accuracy for the compressive strength of UHPFRC. Based on the optimized ANN model, a closed equation is proposed to quickly estimate the compressive strength of concrete. Ali et al. [14] used six models: linear regression (LR), multiple linear regression (MLR), nonlinear regression (NLR), pure quadratic (PQ), interaction (IA), and full quadratic (FQ) to predict the compressive strength of modified concrete with different nano-silica contents in different mix proportions. The research results showed that the most effective and accurate model was the FQ model. Ibrahim et al. [15] studied four models, including LR, NLR, PQ, and FQ, to evaluate the impact of recycled coarse aggregate on the long-term compressive strength of concrete under different mix proportions and different compressive strength ranges. Mohammed et al. [16] tested the effect of three water-reducing agent additives on the workability and compressive strength of concrete during the curing period of 1 to 28 days. A nonlinear M5P mathematical model is established to predict the compressive strength of concrete and to study the influence of the mix ratio on the compressive strength of concrete. Moradi et al. [17] developed a robust and time-saving method based on machine learning (ML) to predict the compressive strength of concrete with binary supplementary cementitious materials (SCMs) at different ages. It was found that the ML-based model could accurately predict the compressive strength of concrete containing any SCM at any age. Rezvan et al. [18] studied the benefits of using polyethylene terephthalate (PET) fibers as reinforcement elements in concrete by the ML method. The results showed that the content of PET fiber in concrete has a significant impact on the concrete compressive strength. Imran et al. [19] developed a new hybrid model for predicting the compressive strength of UHPFRC by using a cascaded forward neural network (CFNN) and artificial bee colony (ABC) optimization. It was found that the optimal neural network structure selected by the ABC method consists of two layers, and the developed model (CFNN-ABC) can accurately predict the compressive strength of UHPFRC. Other similar studies [20,21,22,23,24,25,26] reported the successful application of a BP neural network, probabilistic neural network, and a depth neural network in the early age strength prediction of high-strength concrete. In general, most of the first types of methods are ANN-based prediction methods. Its advantage is that it can consider the impact of various factors on compressive strength, and its limitation is that it requires a large number of test data to train the neural network.
The second type of method is to predict the later strength of concrete according to a function curve between concrete strength and age. Based on the test data from an early age, the concrete compressive strength age function equation can be obtained by data fitting, and then the concrete strength at any time can be calculated. The advantage of this kind of method is that only a few test data are needed to predict the concrete strength at any time, but the disadvantage is that only the change rule of strength with time is considered. At present, the commonly used concrete compressive strength–age curve models are the exponential model [27,28,29,30], logarithmic model [31,32], and polynomial model [33,34,35,36]. Yang et al. [27] tested the compressive strength of high-strength concrete cylinder blocks on days 1, 3, 5, 7, 10, 14, and 28. They fitted the data using the exponential model and obtained the empirical formula to predict the strength of high-strength concrete. Zhao et al. [28] examined the compressive strength of C50 concrete at different ages and generated the curve of compressive strength with age using an exponential model. Yang et al. [29] established a diachronic variation model of axial compressive strength of C60 concrete in the early aging period using the regression fitting method and combining the exponential model. Wang et al. [30] analyzed the development law of compressive strength of high-strength concrete with age. Zhao [31] discussed the development law of high-strength concrete aging strength and obtained the corresponding logarithmic fitting formula. Li et al. [32] examined the compressive strength of the C60 concrete cube on days 3, 7, 14, 28, and 60 and fitted the data using a logarithmic model to predict the later strength of concrete. Li [33] and Jin [34] developed the diachronic variation models of early-aged concrete axial-compressive strength by using a polynomial and the regression fitting method. Ling [35] analyzed the influence of concrete composition on compressive strength and established a prediction model for the compressive strength of mechanical sand concrete using a third-order nonlinear function. Jia et al. [36] examined the compressive strength of ordinary Portland concrete from the first to the 28th day and fitted the data using the cubic polynomial model to obtain the concrete compressive strength–time curve model. In general, these existing curve models may be inconsistent with the strength growth law of concrete in some aspects. For example, the strength of concrete slowly increases and tends to stabilize after 28 days of pouring. However, the polynomial model cannot conform to this rule, and the exponential model and logarithmic model cannot indicate this feature well. In addition, the strength of high-strength concrete increases rapidly in the ultra-early stage (i.e., before 7 days after pouring), which will lead to the poor fitting accuracy of the exponential model and logarithmic model at the ultra-early stage. Therefore, it is still necessary to study a new mathematical curve model to overcome the defects of the existing curve models so as to more accurately describe the change rule of UHPFRC compressive strength.
The work of this paper also belongs to the second type of method. The research significance of this work is to develop a new mathematical curve model that can accurately predict the compressive strength of UHPFRC at any time based on only a few early-age test data. For this purpose, the advantages and disadvantages of the three existing curve models are discussed first, and then a new model that can overcome the shortcomings of the existing model is proposed in Section 2. The implementation effects of the new model and the old models are compared to illustrate the feasibility and superiority of the new model by using four groups of compressive strength test data compiled from previous research studies in Section 3. Moreover, a UHPFRC early compressive strength test was carried out to further verify the proposed mathematical model in Section 4. The research results show that the average fitting error and standard deviation of the proposed model are significantly smaller than those of the existing models, and the concrete compressive strength predicted by the proposed model on the 60th day is also the closest to the design strength grade of concrete. The proposed model provides a simple and feasible way to predict the UHPFRC compressive strength with only a few early-age test data in engineering practice.
2. Compressive Strength-Time Mathematical Models
As stated before, the method of concrete strength evaluation based on a certain assumed mathematical curve is a simple and easy way in engineering practice because it only requires a few early-age test data of compressive strength. The main steps of this type of method are shown in Figure 1.
It is clear that the proper mathematical curve model is the key to determining whether such methods can be implemented successfully. This section first reviews several of the existing mathematical models of changes in concrete compressive strength with time, discusses the advantages and disadvantages of these models, and then proposes a new compressive strength–time mathematical model. Assuming that represents the age (time) after concrete pouring and represents the compressive strength of concrete corresponding to the moment, , the exponential model of the compressive strength-time is expressed as:
In Equation (1), and denote two non-negative fitting parameters that should be obtained by curve fitting based on the strength test data of concrete at an early age. Equation (1) indicates that the advantage of the exponential model is that the function is an increasing function. increases with an increase in , which conforms to the law that the strength of concrete increases with its age in engineering practice. Moreover, when , , which is also consistent with the law that the strength of concrete remains almost stable after 28 days. The disadvantage of the exponential model is that its definition domain lacks the point = 0. In practice, the concrete strength is 0 when = 0. It is noteworthy that the exponential model cannot contain this situation. Furthermore, the equation contains only two fitting parameters, so the accuracy of the fitting is low for data with greater dispersion.
The logarithmic model of diachronic change in compressive strength is written as:
In Equation (2), and represent two fitted parameters that are obtained based on partial test data combined with curve fitting. The comparison between Equations (1) and (2) suggests that the logarithmic model can be regarded as a form of change obtained by taking logarithms on both sides of the exponential model equation. Accordingly, the advantages and disadvantages of the logarithmic model are similar to the exponential model. To be specific, a detailed advantage is that the function is an increasing function, which conforms to the law that the strength of concrete increases with its age in engineering practice. The disadvantage is that its definition domain also lacks the point of = 0, and when , the growth rate slows down but does not converge, which is not consistent with the actual growth law of concrete strength. The equation comprises only two fitted parameters, and the fitting accuracy is also low for data with greater dispersion.
Compressive strength–age polynomial model generally refers to the quadratic power function model and cubic power function model, which are expressed as follows:
Equation (3) is a quadratic polynomial model, Equation (4) is a cubic polynomial model, and , , , and x3 are the fitting parameters. The advantage of the polynomial model is that the definition domain contains the point = 0, and the obtained function after fitting is an increasing function, which is more consistent with the actual strength growth law of high-strength concrete within 28 days. The equation contains three or four fitted parameters, so the fitting accuracy is higher than an exponential or logarithmic model with only two parameters. The disadvantage of the polynomial model is that when , will increase rapidly, which is not consistent with the law that the strength of concrete at the later stage remains nearly unchanged in practice, so it cannot be used to predict the later strength of concrete.
In summary, it is very necessary to propose a novel mathematical model for the change of compressive strength with time to better describe the growth law of concrete compressive strength in practice. This study refers to the mathematical form of the polynomial model, maintains its advantages and overcomes its disadvantages, and proposes the following new compressive strength-time curve model:
where , , and represent the three fitting parameters. Obviously, the novel model Equation (5) can be considered an improved form of Equation (3), and its independent variable is modified as . The novel model shows the following advantages. (1) The definition domain contains the point = 0, and = 0 can be determined when = 0 through parameter fitting, thus overcoming the disadvantage of the lack of definition domains for the exponential model and logarithmic model. (2) When , , consistent with the law that the concrete strength at the later stage remains almost unchanged in practice, thus overcoming the limitation that the polynomial model does not converge when . As a result, the novel model can be adopted to predict the later strength of concrete. (3) The equation comprises three fitting parameters, and the fitting accuracy is high. The cubic term can be added to further improve the fitting accuracy if necessary, which will not be repeated here.
Next, the calculation method of the fitted parameters in the above mathematical model is expressed. The corresponding linear equations should first be established based on the compressive strength data of different ages obtained through the test to calculate the fitting parameters. With the proposed model Equation (5) as an example, the corresponding system of linear equations is written as follows:
where represents the compressive strength value of concrete obtained by time test. Obviously, the vector and the coefficient matrix are known quantities, and is the unknown fitted parameter vector. In general, the coefficient matrix of Equation (6) is a rectangular matrix with a greater number of rows than columns, i.e., the number of examined data (known quantities) is greater than the number of fitted parameters (unknowns). Equation (6) can generally be solved using the least squares method, for which both sides of Equation (6) are simultaneously multiplied by the transposed matrix of matrix yields:
From Equation (10), the solution of is expressed as:
The calculated refers to the least squares estimate of .
The specific curve equation of the fitted prediction model can be obtained based on the calculated fitting parameters, and the superiority of the model can be examined in accordance with the difference between the model prediction value and the experimental test value. Therefore, the difference between the model prediction and the experimental test value is calculated as follows:
where is called the residual vector. To be specific, is the residuals between the ith experimental data and the predicted value. Further calculation of the mean and standard deviation of the residual vector is as follows:
The mean and standard deviation of the residual vector are called the fitting mean error (absolute error) and standard deviation of error, respectively. The smaller and , the higher the fitting accuracy of the model and the more reliable the model will be.
To check the model’s predictability, the coefficient of determination (R2) is calculated along with root mean square error (RMSE). These performance indexes are calculated to measure how close are the predicted values from the experimental ones. This helps in better evaluation of the model capabilities for compressive strength prediction. The equations for R2 and RMSE are given by:
where, = experimental value, = mean of experimental values, = predicted value, and n = total number of observations.
3. Model Verification and Comparison by the Test Data Compiled from Previous Literature
Four sets of experimental data (called examples 1 to 4) from literature [28,29,36,37] are used to validate the new model, and the results are compared with the existing logarithmic model and cubic polynomial model fitting results to illustrate the advantages of the proposed model.
In example 1 (the literature [28]), the concrete cube test blocks with a side length of 150 mm were designed and fabricated according to the C50 strength grade, and the compressive strengths on days 1, 2, 3, 5, 7, 11, 14, 28, and 40 were examined under standard curing conditions, respectively, as shown in Figure 2 (expressed by symbol “o”). These data are fitted using the logarithmic model, the cubic polynomial model, and the model proposed, and the obtained fitting curves are also presented in Figure 2. The specific fitting equations for these models are expressed as follows:
Table 1 lists the mean fitting error, standard deviation of error, R2, RMSE, and the compressive strength value on day 60 predicted by these models.
It can be concluded from Table 1 that the average fitting error of the novel model is about 59% of the logarithmic model and about 38% of the polynomial model. The fitting standard deviation of the novel model is nearly 47% of the logarithmic model and about 29% of the polynomial model. The mean fitting error and mean standard deviation of the new model are significantly smaller than the logarithmic model and the cubic polynomial model. For the strength values predicted by the three models on the 60th day, only the 56.91 MPa predicted by the novel model is closest to the C50 intensity grade. It has been shown that the novel model is more accurate and reliable than the logarithmic model and the polynomial model.
In example 2 (the literature [29]), 150 mm × 150 mm × 300 mm concrete prismatic test blocks were designed and fabricated according to the C60 strength grade, and the compressive strengths on days 3, 5, 6, 7, 14, and 28 were examined, respectively, as illustrated in Figure 3 (represented by the symbol “o”). These data were fitted using the logarithmic model, the cubic polynomial model, and the model proposed, and the obtained fitting curves are presented in Figure 3. The specific fitting equations are as follows:
The mean fitting error, standard deviations of error, R2, and RMSE are shown in Table 2. The compressive strength values on day 60 predicted by these models are also listed in Table 2.
It can be concluded from Table 2 that the average fitting error of the novel model is about 12% of the logarithmic model and about 59% of the polynomial model. The fitting standard deviation of the novel model is about 13% of the logarithmic model and about 43% of the polynomial model. The mean fitting error and mean standard deviation of the proposed model are significantly smaller than the logarithmic model and the cubic polynomial model. For the strength values predicted by the three models on the 60th day, only the 68.17 MPa predicted by the novel model is the closest to the C60 intensity grade. This shows that the novel model is more accurate and reliable than the logarithmic model and the polynomial model.
In example 3 (the literature [36]), 50 mm × 50 mm × 150 mm Portland concrete cuboid test blocks were designed, produced, and cured under standard curing conditions, and the compressive strength was examined for 1–28 days, as shown in Figure 4 (expressed by the symbol “o”). Based on the above experimental data, the fitting curves are also presented in Figure 4. The specific fitting equations are written as follows:
The mean fitting error, standard deviation of error, R2, RMSE, and the predicted compressive strength on day 60 are shown in Table 3.
From Table 3, it can be concluded that the average fitting error of the novel model is about 43% of the logarithmic model and about 30% of the polynomial model. The fitting standard deviation of the novel model is about 38% of the logarithmic model and about 26% of the polynomial model. For the strength values predicted by the three models on the 60th day, only the 81.56 MPa predicted by the novel model is closest to the C80 strength grade. These results show that the novel model is more accurate and reliable than the logarithmic model and the polynomial model.
In example 4 (the literature [37]), the 150 mm × 150 mm × 150 mm high-strength concrete cube test blocks were designed and fabricated according to the C80 strength grade, and the compressive strengths of days 0.5, 1, 3, 7, 14, 28, and 90 are examined respectively, as shown in Figure 5 (represented by the symbol “o”). The fitting curves obtained by the three models are also shown in Figure 5. The specific fitting equations are given as follows:
Note that the coefficients in Equations (26)–(28) are obtained by fitting the test data, so different fitting coefficients will be obtained for the concrete test blocks with different components and water-cement ratios. Table 4 lists the mean fitting error, standard deviation of error, R2, RMSE, and the predicted compressive strength on day 60.
Similar conclusions can be drawn from Table 4 that the mean fitting error and standard deviation of the proposed model are significantly smaller than the logarithmic model and the cubic polynomial model. For the strength values predicted by the three models on the 60th day, only the 80.57 MPa predicted by the novel model is the closest to the C80 strength grade. This means that the proposed model is more reasonable and reliable than the logarithmic model and the polynomial model.
4. UHPFRC Experimental Validation
In this section, the compressive strength test of UHPFRC at a very early age is analyzed to further investigate the applicability of the proposed model. In the experiment, 36 UHPFRC cube blocks with a side length of 100 mm were designed and manufactured according to the strength level of 120 MPa. As shown in Figure 6, the main materials used in the UHPFRC include powder, steel fiber, and water. The mix proportion and basic physical parameters of the UHPFRC are listed in Table 5. The powder is composed of cement, silica fume, silica sand, and superplasticizer. The diameter of the steel fiber used was 0.2 mm, the length of the fibers includes 16 mm and 12 mm, and the ratio of the long fiber-to-short fiber was 1:2. Note that the main purpose of this study is to verify the applicability of the proposed curve model to the prediction of concrete compressive strength, so only one mix design was used in this experiment. More relevant experiments are needed in the future to further verify the applicability of the proposed model for predicting the early compressive strength of UHPFRC under different mix proportions and curing temperatures.
Under the standard curing conditions, the compressive strength of the test block from half a day to the 14th day was tested. The curing temperature and relative humidity were about (20 ± 2) °C and 95%, respectively. The compression strength experiment was carried out by the STYE-3000E automatic pressure tester. The loading speed was 0.6 N/mm2 per second. The test process was in accordance with GB/T50081-2002 Test Methods for Mechanical Properties of Ordinary Concrete [38]. The measured compressive strengths of these cubes at different times are listed in Table 6.
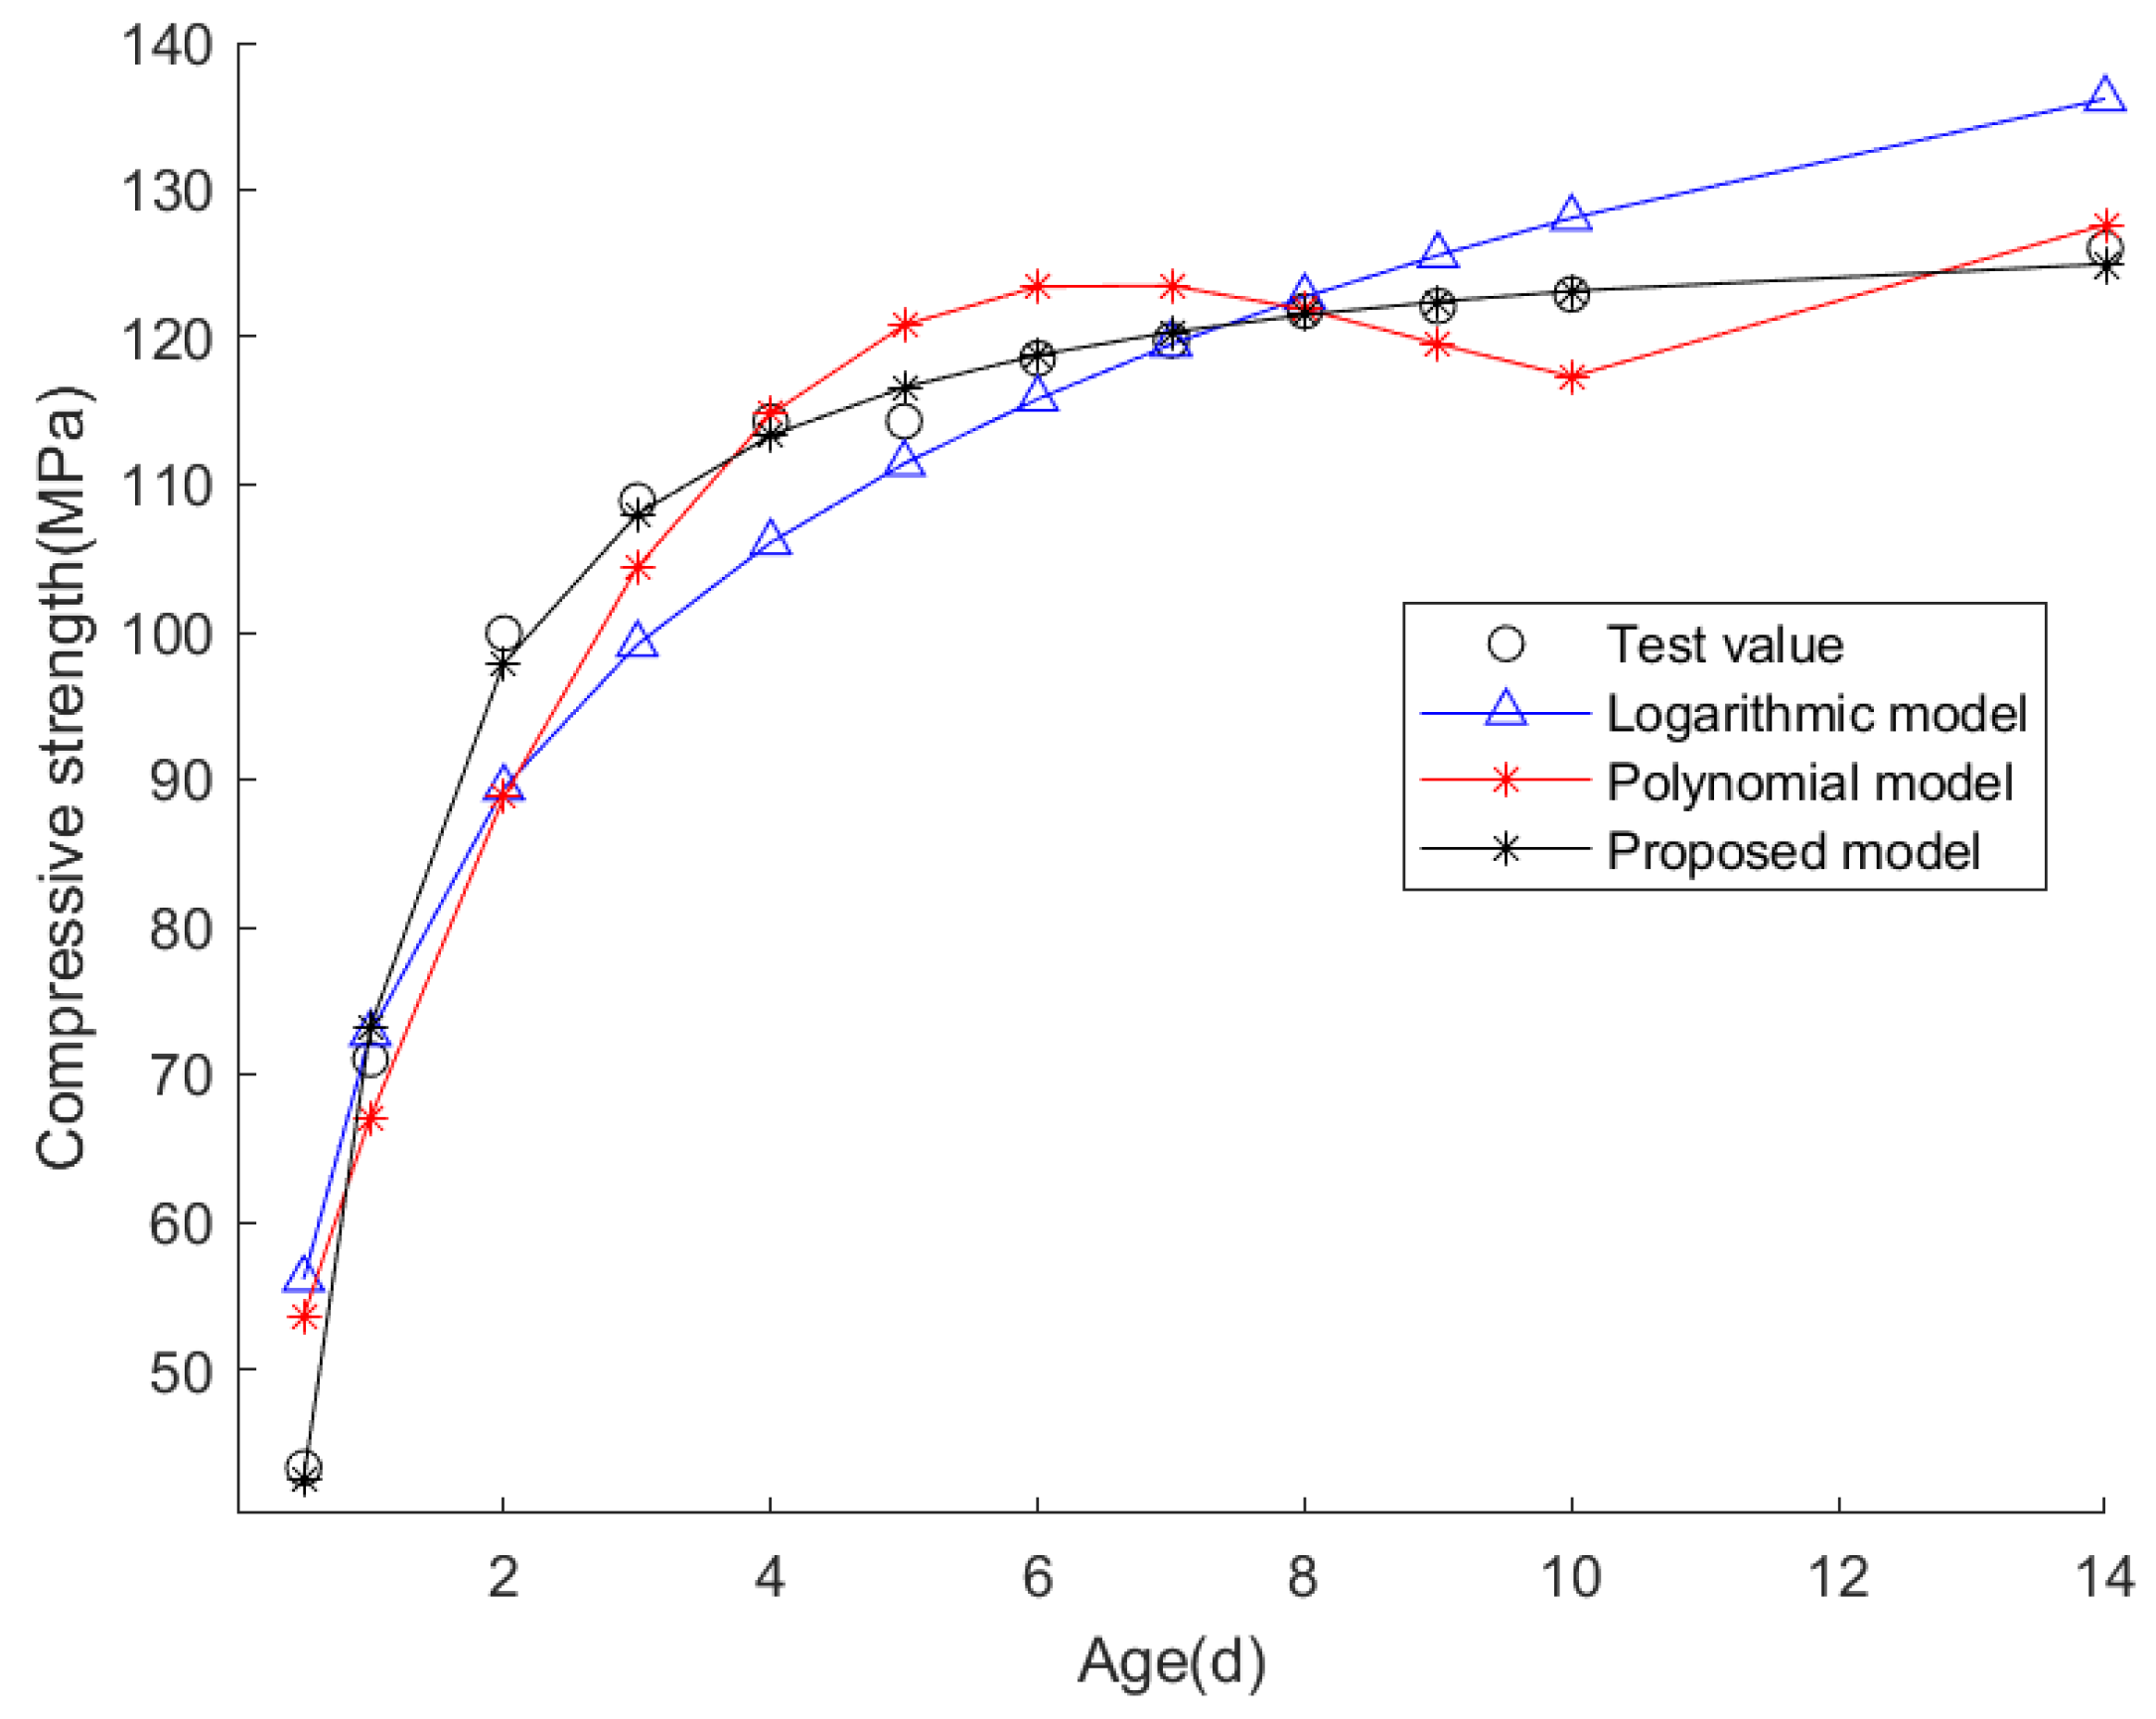
As mentioned in the previous section, based on the experimental data, the logarithmic model, the polynomial model, and the model proposed were used to fit the data, and the resulting fitting curves are shown in Figure 7. The specific fitting equations for each model are as follows:
Note that the coefficients in Equations (29)–(31) were obtained by fitting the test data, so different fitting coefficients will be obtained for those concrete test blocks with different components and water-cement ratios. The mean fitting error, standard deviation of error, R2, RMSE, and predicted compressive strength of UHPFRC on the 60th day by the three models are shown in Table 7.
It can be concluded from Table 7 that the average fitting error of the new model is about 13.7% of the logarithmic model and about 16.7% of the polynomial model. The fitted standard deviation of the new model is about 11.9% of the logarithmic model and about 14.6% of the polynomial model. Obviously, the mean fitting error and mean standard deviation of the proposed new model are much smaller than the logarithmic model and the cubic polynomial model. The proposed model has the largest R2 and the smallest RMSE. For the compressive strength values predicted by the three models on the 60th day, only the 128.36 MPa predicted by the new model is closest to the design intensity grade of 120 MPa. It has been shown that the new model is more accurate and reliable than the logarithmic model and the polynomial model.
5. Conclusions
In this paper, a new compressive strength–age curve model is proposed, which can accurately predict the later strength of concrete with only a few early-age test data. The proposed model was validated first by using four sets of compressive strength test data collected from previous studies. Subsequently, UHPFRC early compressive strength tests were carried out to further verify the proposed mathematical model. According to the comparative analysis of the calculation results, the following main conclusions can be drawn:
- (1)
- The existing compression strength–time curve models are not ideal in terms of fitting accuracy or prediction accuracy. The proposed new model can well describe the characteristics of compressive strength increases with time at the early age stage. From the comparison results, it was found that the new model is more accurate and reliable than the logarithmic model and the polynomial model;
- (2)
- From the UHPFRC experiment, it can be seen that the compressive strength of UHPFRC increases very rapidly at the ultra-early age stage, and the compressive strength was very close to that of the strength design grade on about the 7th day. After the 7th day, the compressive strength of UHPFRC increases slowly and gradually maintains a stable value;
- (3)
- Based on the UHPFRC experimental data, it has been shown that the average fitting error and standard deviation of the new model are about 10%~20% of the logarithmic model and the polynomial model. The proposed model has the largest R2 of 0.9974 and the smallest RMSE of 1.2304. The 60-day compressive strength predicted by the proposed model (i.e., 128.36 MPa) is closest to the strength design grade of UHPFRC (i.e., 120 MPa).
It should be pointed out that the curing temperature, mix ratio, and steel fiber content have an important impact on the compressive strength of UHPFRC at an early age. More relevant experiments need to be carried out in the future to further verify the growth law of UHPFRC compressive strength at an early age with different components and water-cement ratios. The proposed method is a quick method to predict the compressive strength of concrete, which can be implemented using only a few early-age test data. The greatest advantage of the proposed method lies in its simple formula, fast implementation, and no need for complex mathematical operations. However, the proposed method can not consider the influence of other factors (except for age) on compressive strength, which is possible using the surrogate model or ML-based method. In the following research, a comparative study between the proposed model and the surrogate model or ML-based algorithm can be carried out to better apply it to the strength prediction of UHPFRC in engineering practice.
Author Contributions
Conceptualization and software, X.P.; methodology, validation and formal analysis, Q.Y.; experimental testing and investigation, H.C.; resources, X.P.; writing—original draft preparation, H.W.; writing—review and editing, X.P and Q.Y.; visualization, H.W.; project administration, X.P.; funding acquisition, X.P and Q.Y. All authors have read and agreed to the published version of the manuscript.
Funding
This research was funded by the Natural Science Foundation of China (52008215), the National Key R&D Program of China (2021YFF0501004), Zhejiang Public Welfare Technology Application Research Project (LGF22E080021), the Major Special Science and Technology Project (2019B10076) of “Ningbo Science and Technology Innovation 2025”, Ningbo Natural Science Foundation Project (202003N4169), and Natural Science Foundation of Zhejiang Province, China (LQ20E080013).
Institutional Review Board Statement
Not applicable.
Informed Consent Statement
Not applicable.
Data Availability Statement
The data used to support the findings of this study are included in this study and also available from the corresponding author upon request.
Conflicts of Interest
The authors declare that there are no conflict of interest. The funders had no role in the collection, analysis, or interpretation of the data or in the decision to publish the results.
References
- Yang, Q.W.; Sun, Y.; Peng, X. Experimental study on mechanical properties of concrete at super-early age. Materials 2022, 15, 7582. [Google Scholar] [CrossRef]
- Yang, Q.W.; Peng, X.; Sun, Y. Shear capacity evaluation of the recycled concrete beam. Materials 2022, 15, 3693. [Google Scholar] [CrossRef] [PubMed]
- Yang, Q.W.; Ba, Z.; Zhao, Z.; Peng, X.; Sun, Y. Stability evaluation method of hole wall for bored pile under blasting impact. Symmetry 2022, 14, 79. [Google Scholar] [CrossRef]
- Peng, X.; Yang, Q. Damage detection in beam-like structures using static shear energy redistribution. Front. Struct. Civ. Eng. 2023, 16, 1552–1564. [Google Scholar] [CrossRef]
- Yang, S.L.; Millard, S.G.; Soutsos, M.N.; Barnett, S.; Le, T. Influence of aggregate and curing regime on the mechanical properties of ultra-high performance fibre reinforced concrete (UHPFRC). Constr. Build. Mater. 2009, 23, 2291–2298. [Google Scholar] [CrossRef]
- Kwon, S.; Nishiwaki, T.; Kikuta, T.; Mihashi, H. Development of ultra-high-performance hybrid fiber-reinforced cement-based composites. ACI Mater. J. 2014, 111, 309. [Google Scholar] [CrossRef]
- Yu, R.; Spiesz, P.; Brouwers, H.J.H. Mix design and properties assessment of ultra-high performance fibre reinforced concrete (UHPFRC). Cem. Concr. Res. 2014, 56, 29–39. [Google Scholar] [CrossRef]
- Yeh, I.C. Modeling of strength of high-performance concrete using artificial neural networks. Cem. Concr. Res. 1998, 28, 1797–1808. [Google Scholar] [CrossRef]
- Bui, D.-K.; Nguyen, T.; Chou, J.S.; Nguyen-Xuan, H.; Ngo, T. A modified firefly algorithm-artificial neural network expert system for predicting compressive and tensile strength of high-performance concrete. Constr. Build. Mater. 2018, 180, 320–333. [Google Scholar] [CrossRef]
- Han, Q.; Gui, C.; Xu, J.; Lacidogna, G. A generalized method to predict the compressive strength of high-performance concrete by improved random forest algorithm. Constr. Build. Mater. 2019, 226, 734–742. [Google Scholar] [CrossRef]
- Anyaoha, U.; Zaji, A.; Liu, Z. Soft computing in estimating the compressive strength for high-performance concrete via concrete composition appraisal. Constr. Build. Mater. 2020, 257, 119472. [Google Scholar] [CrossRef]
- Hameed, M.M.; AlOmar, M.K.; Baniya, W.J.; AlSaadi, M.A. Incorporation of artificial neural network with principal component analysis and cross-validation technique to predict high-performance concrete compressive strength. Asian J. Civ. Eng. 2021, 22, 1019–1031. [Google Scholar] [CrossRef]
- Emad, W.; Mohammed, A.S.; Kurda, R.; Ghafor, K.; Cavaleri, L.; Qaidi, S.M.A.; Hassan, A.; Asteris, P.G. Prediction of concrete materials compressive strength using surrogate models. Structures 2022, 46, 1243–1267. [Google Scholar] [CrossRef]
- Ali, R.; Muayad, M.; Mohammed, A.S.; Asteris, P.G. Analysis and prediction of the effect of Nanosilica on the compressive strength of concrete with different mix proportions and specimen sizes using various numerical approaches. Struct. Concr. 2022, 12. [Google Scholar] [CrossRef]
- Ibrahim, A.K.; Dhahir, H.Y.; Mohammed, A.S.; Omar, H.A.; Sedo, A.H. The effectiveness of surrogate models in predicting the long-term behavior of varying compressive strength ranges of recycled concrete aggregate for a variety of shapes and sizes of specimens. Arch. Civ. Mech. Eng. 2023, 23, 61. [Google Scholar] [CrossRef]
- Mohammed, A.S.; Emad, W.; Sarwar Qadir, W.; Kurda, R.; Ghafor, K.; Kadhim Faris, R. Modeling the impact of liquid polymers on concrete stability in terms of a slump and compressive strength. Appl. Sci. 2023, 13, 1208. [Google Scholar] [CrossRef]
- Moradi, N.; Tavana, M.H.; Habibi, M.R.; Amiri, M.; Moradi, M.J.; Farhangi, V. Predicting the compressive strength of concrete containing binary supplementary cementitious material using machine learning approach. Materials 2022, 15, 5336. [Google Scholar] [CrossRef] [PubMed]
- Rezvan, S.; Moradi, M.J.; Dabiri, H.; Daneshvar, K.; Karakouzian, M.; Farhangi, V. Application of machine learning to predict the mechanical characteristics of concrete containing recycled plastic-based materials. Appl. Sci. 2023, 13, 2033. [Google Scholar] [CrossRef]
- Imran, M.; Khushnood, R.A.; Fawad, M. A Hybrid data-driven and metaheuristic optimization approach for the compressive strength prediction of high-performance concrete. Case Stud. Constr. Mater. 2023, 18, e01890. [Google Scholar] [CrossRef]
- Li, Z.J.; Song, Y.H.; Li, S.H. Prediction of metakaolin high-performance concrete compressive strength. Bull. Chin. Ceram. Soc. 2017, 36, 2963–2968. [Google Scholar]
- Zhang, J.L.; Liu, X.; Zhu, H.B.; Li, C.; Yuan, Y. Model for predicting the mechanical behavior of UHPC based on BP neural network. Concrete 2013, 281, 18–25. [Google Scholar]
- Chen, Q.; Ma, R.; Jiang, Z.W.; Wang, H. Compressive Strength Prediction and Mix Proportion Design of UHPC Based on GA-BP Neural Network. J. Build. Mater. 2020, 23, 176–183. [Google Scholar]
- Zhang, J.; Zhao, Y. Prediction of compressive strength of ultra-high performance concrete (UHPC) containing supplementary cementitious materials. In Proceedings of the 2017 International Conference on Dmart Grid and Electrical Automation (ICSGEA), Changsha, China, 27–28 May 2017; pp. 522–525. [Google Scholar]
- Abuodeh, O.R.; Abdalla, J.A.; Hawileh, R.A. Assessment of compressive strength of Ultra-high Performance Concrete using deep machine learning techniques. Appl. Soft Comput. 2020, 95, 106552. [Google Scholar] [CrossRef]
- Wu, X.G.; Liu, P.C.; Chen, H.Y.; Zeng, T.M.; Xu, W. Characteristic screening and prediction of high-performance concrete compressive strength based on random forest method. Concrete 2022, 387, 17–24. [Google Scholar]
- Roberson, M.M.; Inman, K.M.; Carey, A.S.; Howard, I.L.; Shannon, J. Probabilistic neural networks that predict compressive strength of high strength concrete in mass placements using thermal history. Comput. Struct. 2022, 259, 106707. [Google Scholar] [CrossRef]
- Yang, Y.; Chen, F.Y. Strength development and evaluation of high-strength concrete at early age. China Concr. Cem. Prod. 2004, 137, 1–4. [Google Scholar]
- Zhao, S.B.; Zhao, Y.J.; Chen, J.H.; Liu, S.; Sun, Y.P. Application and study on time-dependent compressive strength and elastic modulus of C50 pumping concrete. Concrete 2015, 303, 98–101. [Google Scholar]
- Yang, W.J.; Wang, Y. Diachronic variation model of compressive strength and elastic modulus of concrete at early age. J. China Foreign Highw. 2007, 27, 149–151. [Google Scholar]
- Wang, M.L.; Wang, X.A. Study on strength development law of high strength concrete at early age in high altitude environment. Build. Struct. 2021, 51, 1311–1315. [Google Scholar]
- Zhao, Z. Proportion design and stregth regularity of high strength concrete. Concrete 2011, 264, 101–103. [Google Scholar]
- Li, X.F.; Ma, W.L.; Pei, S.W.; Sun, S.N. Experimental study on compressive strength of commercial concrete at early age. J. Zhongyuan Inst. Technol. 2006, 17, 59–61. [Google Scholar]
- Li, X.Z.; Han, L.J.; Liu, M.Q. Analysis of early aging prediction method of strength state of high-performance concrete. Shanxi Archit. 2007, 33, 167–168. [Google Scholar]
- Jin, X.Y.; Shen, Y.; Li, Z.J. Experimental study on early aging characteristics of high-strength concrete. China Concr. Cem. Prod. 2003, 133, 5–7. [Google Scholar]
- Ling, J.J. Compressive strength and nonlinear prediction model of high-grade basalt manufactured sand concrete. J. Water Resour. Archit. Eng. 2021, 19, 124–130. [Google Scholar]
- Jia, M.; Han, Z.B. Analysis of compressive test of silicate concrete based on bridge estimation. J. North China Univ. Sci. Technol. (Nat. Sci. Ed.) 2019, 41, 84–89. [Google Scholar]
- Wang, D.Y.; Wang, M.M.; Yang, Z.K.; Wu, Y.G.; Yuan, Q.; Liao, J. Study on mechanical properties of C80 concrete at different ages. Ind. Constr. 2014, 44, 106–111. [Google Scholar]
- Ministry of Construction of China. Test Method Standard for Mechanical Properties of Common Concrete: GB/T 50081-2002 [M]; China Construction Industry Press: Beiging, China, 2003. (In Chinese) [Google Scholar]
Figure 1.
The flow chart of concrete compressive strength evaluation based on strength-age curve model.
Figure 1.
The flow chart of concrete compressive strength evaluation based on strength-age curve model.
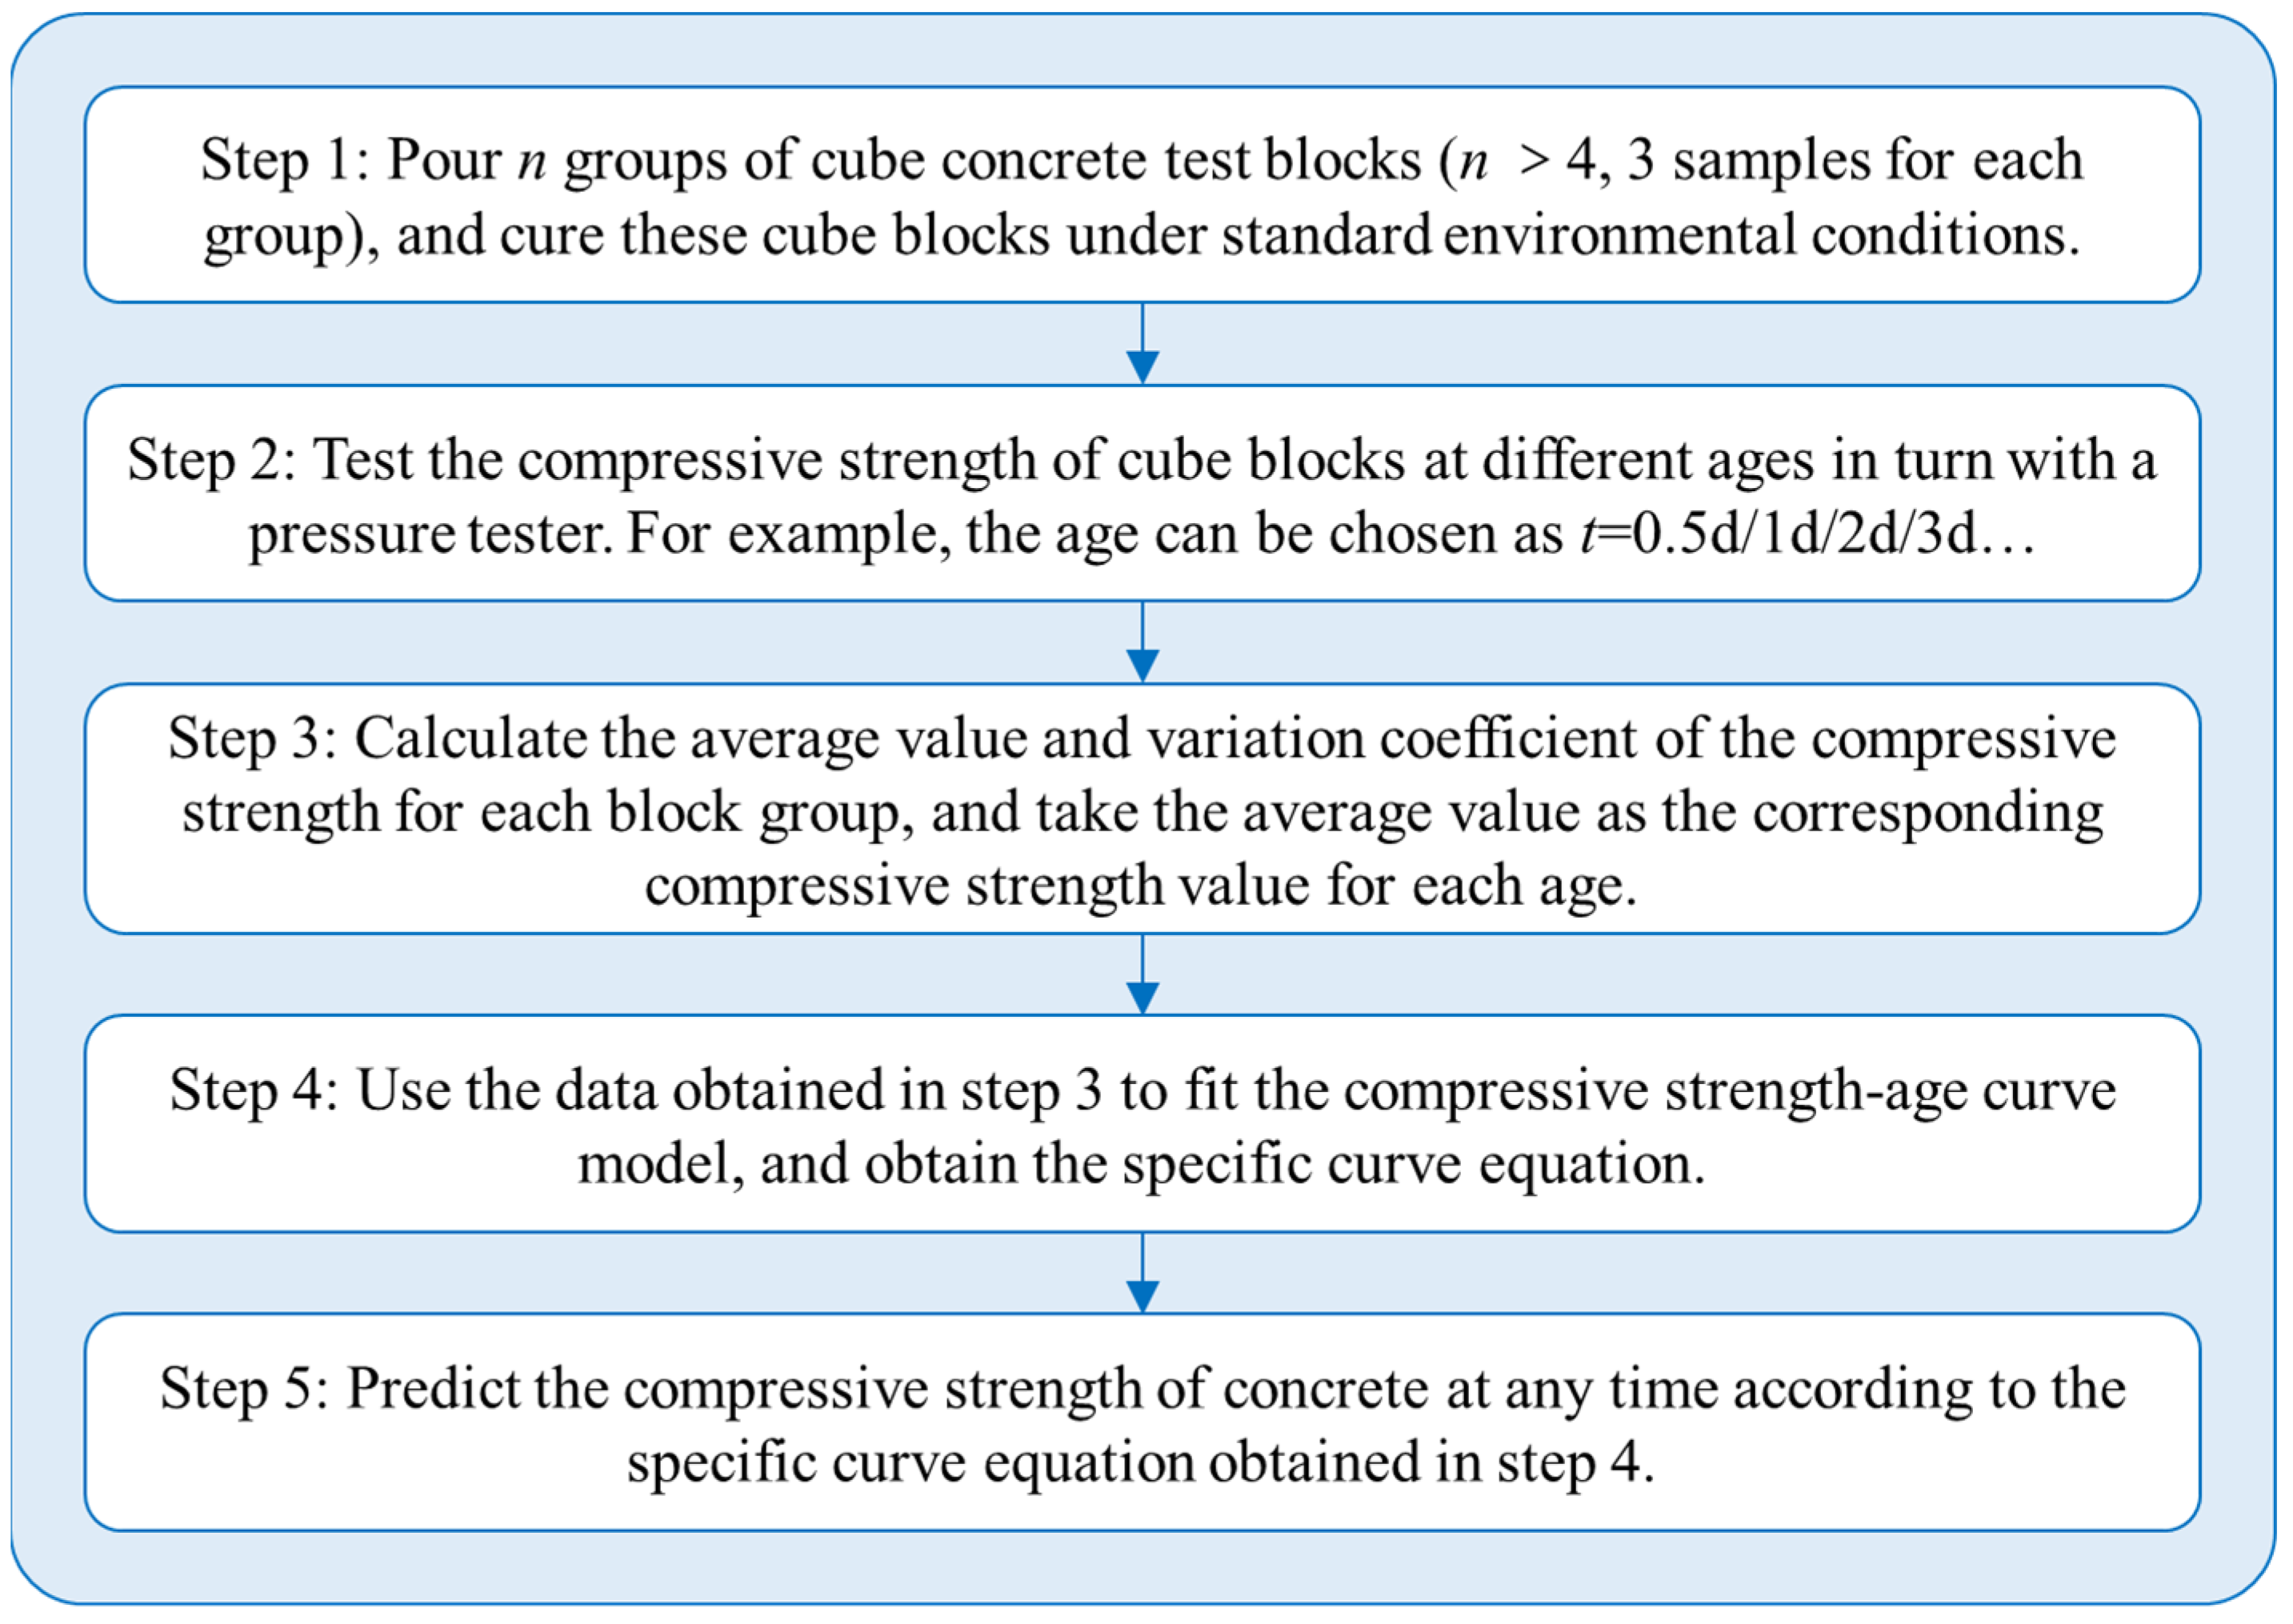
Figure 2.
The fitting results for the compressive strength test data in example 1.
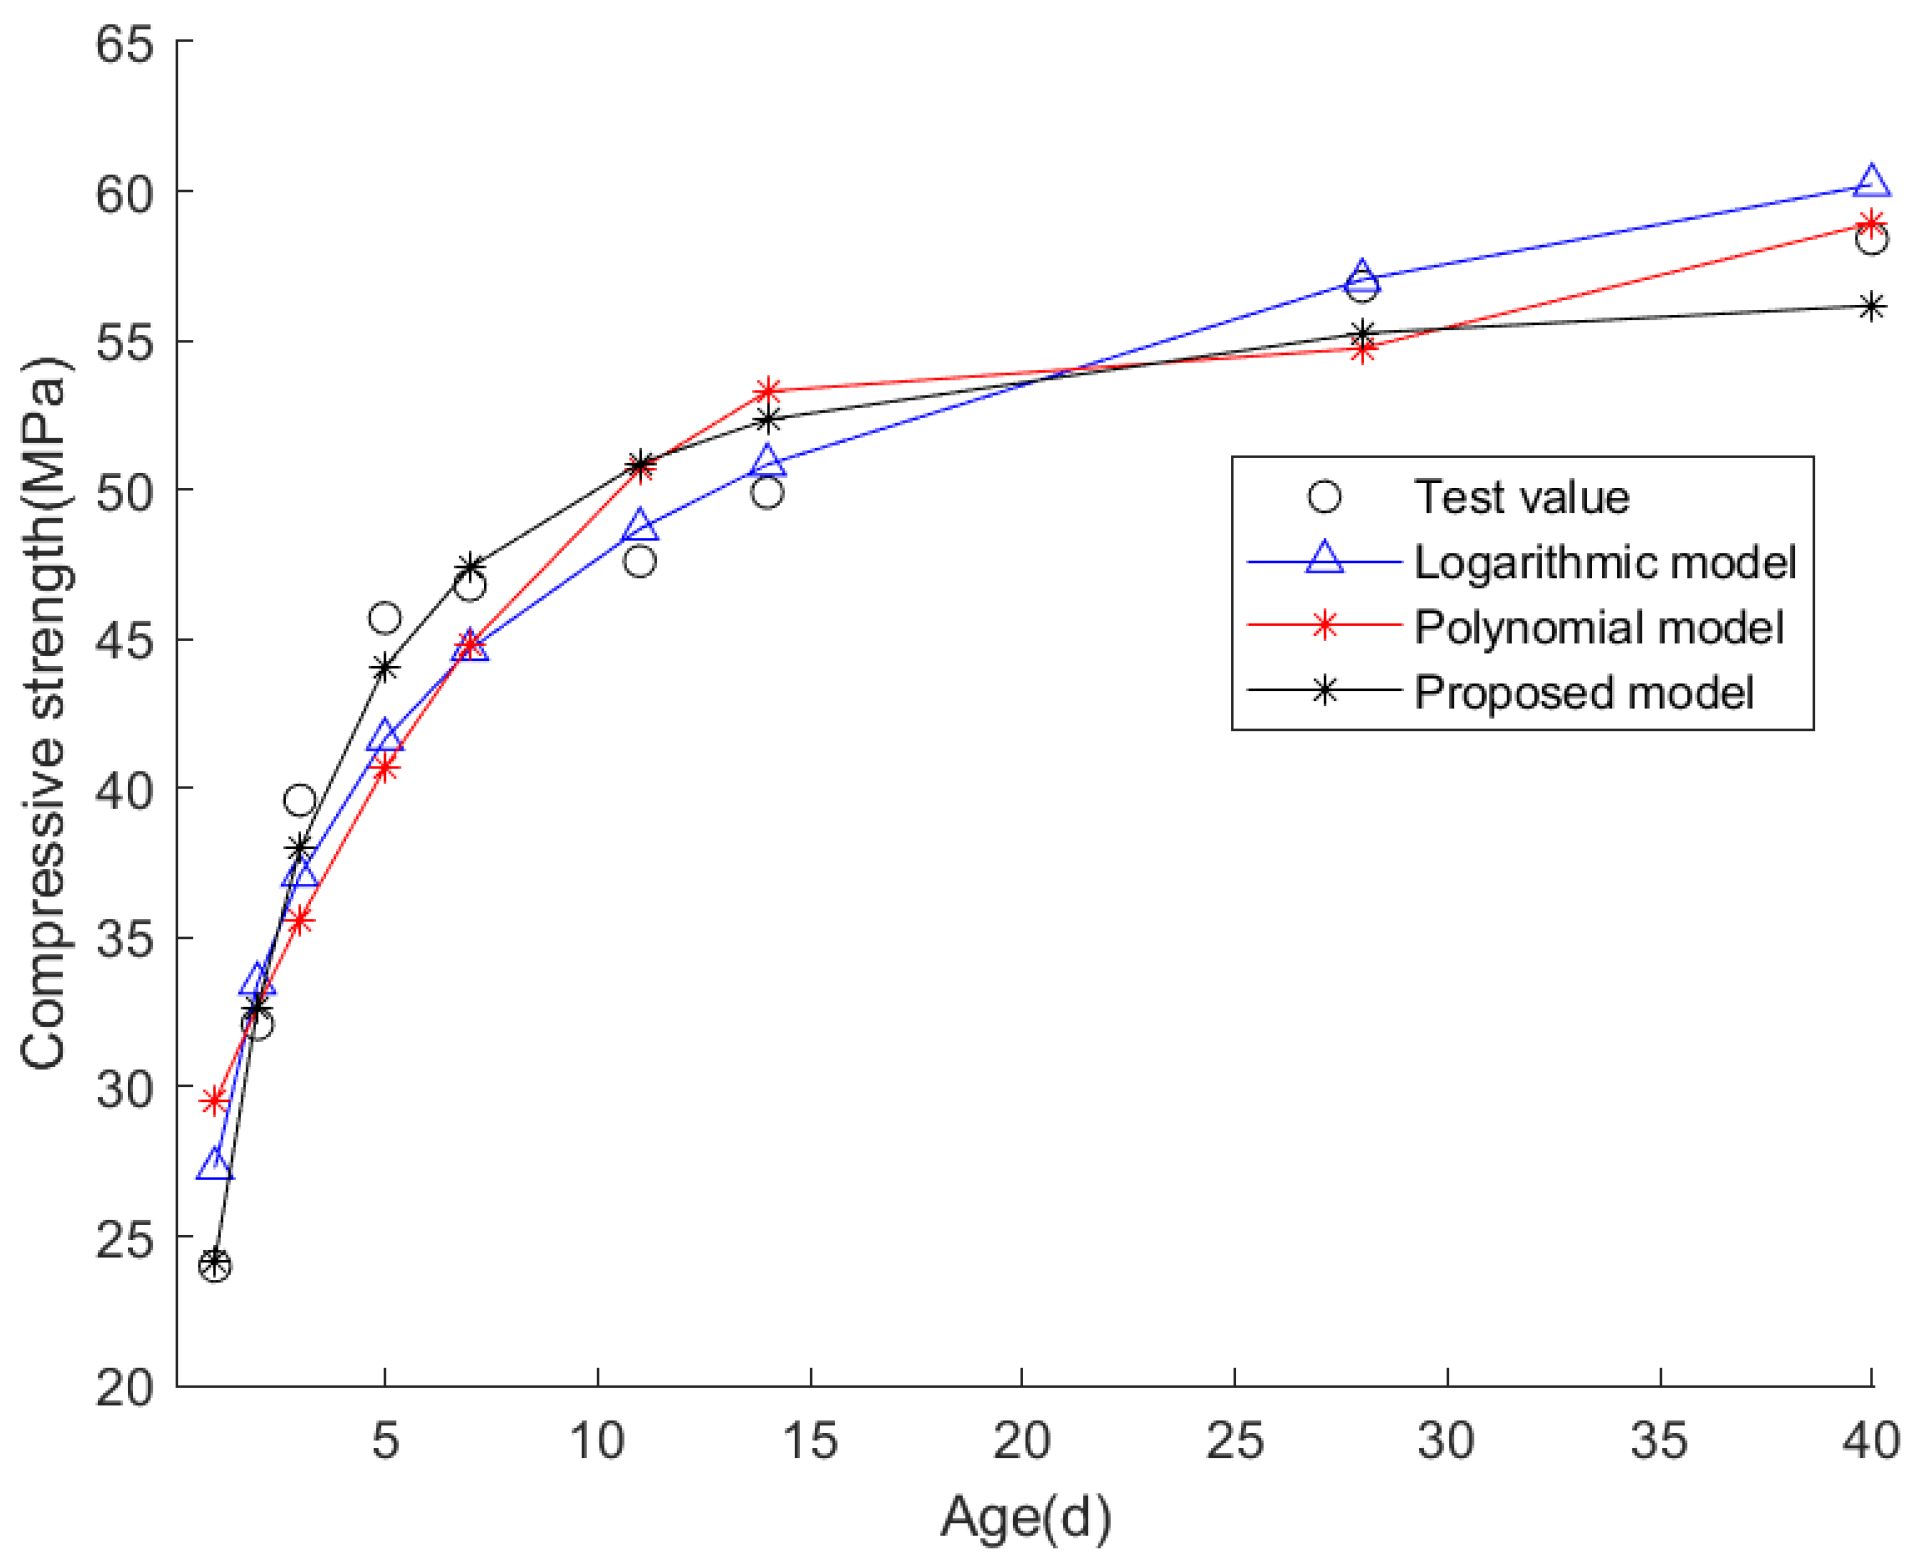
Figure 3.
The fitting results for compressive strength test data in example 2.
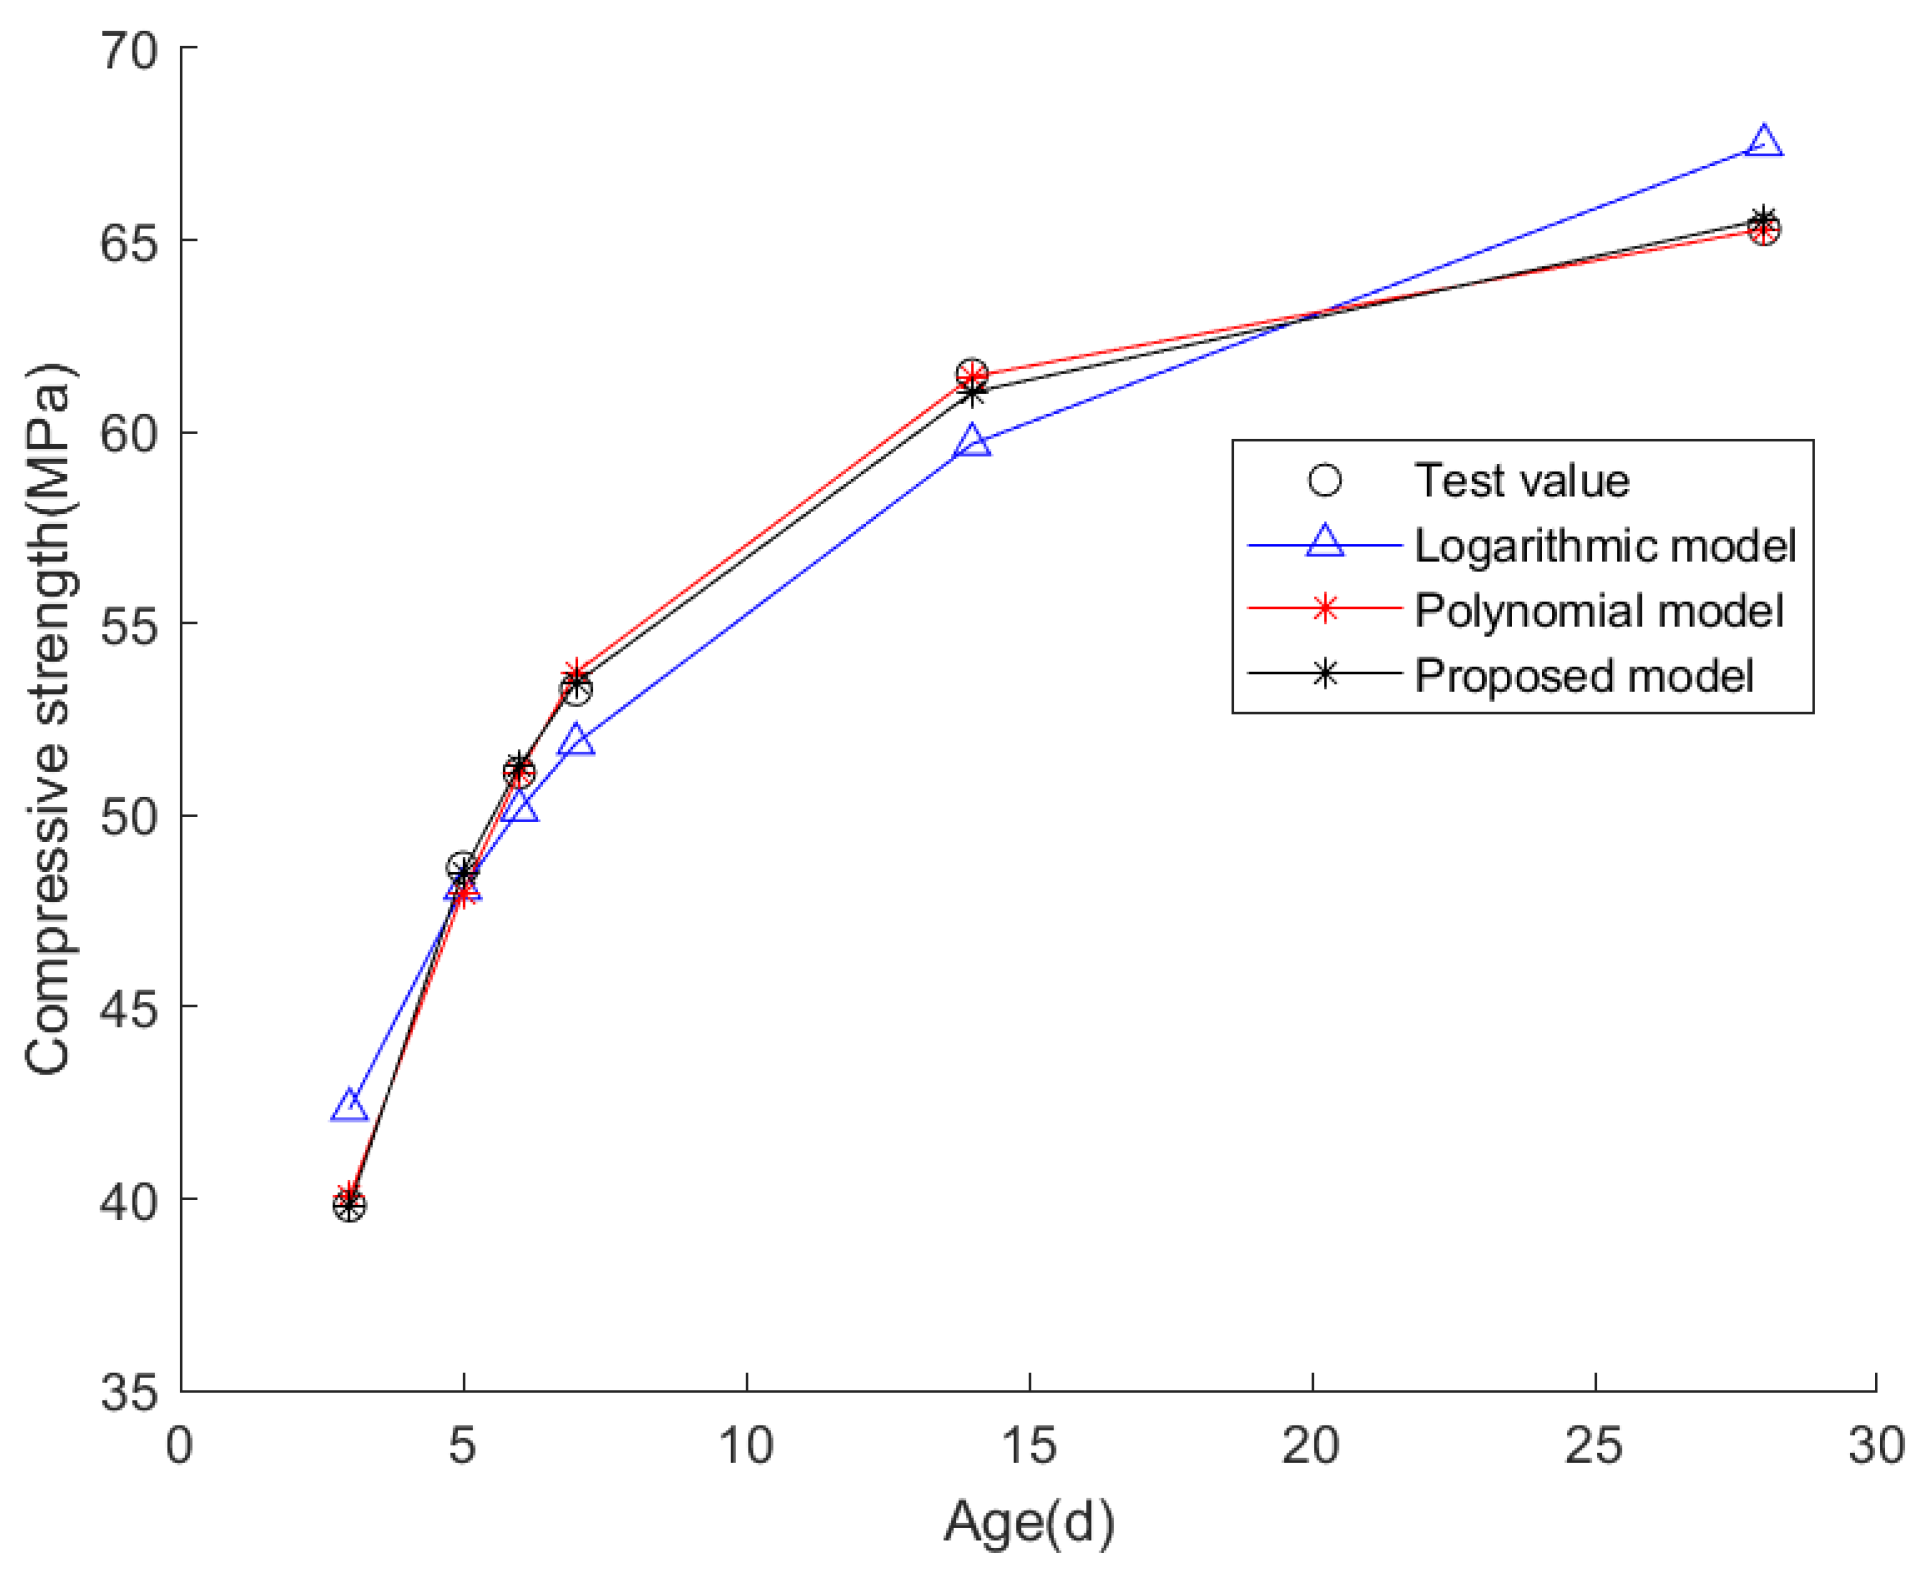
Figure 4.
The fitting results for compressive strength test data in example 3.

Figure 5.
The fitting results of compressive strength test data in example 4.
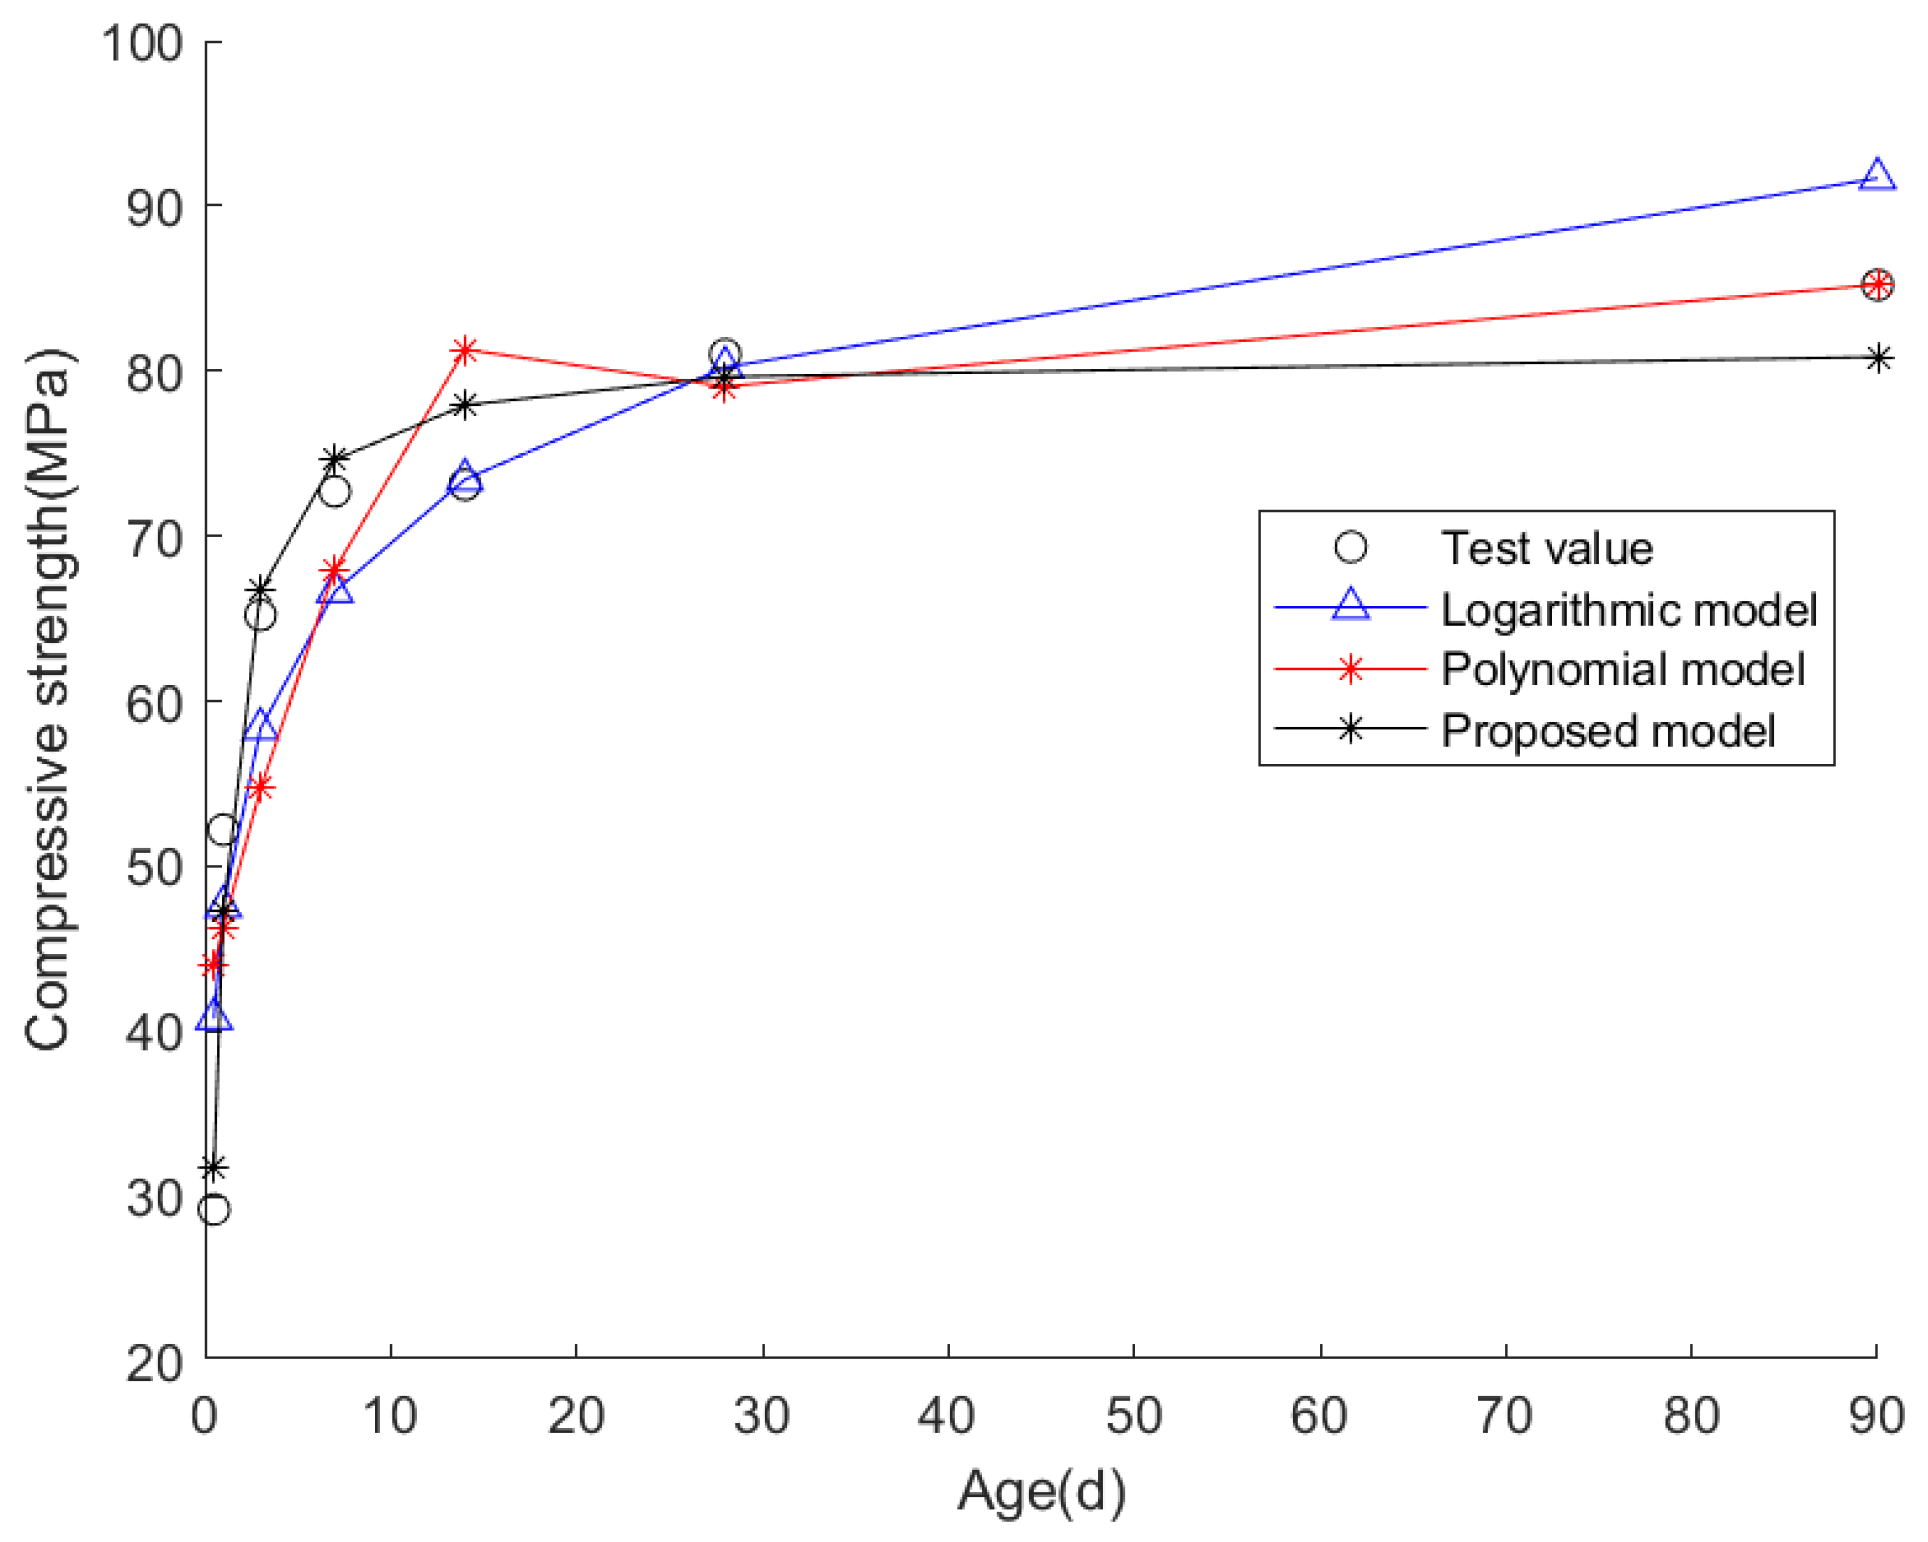
Figure 6.
Experimental powder, steel fiber, test blocks, and equipment. (a) Powder; (b) Steel fiber; (c) High-strength concrete block; (d) Compressive strength test; (e) Some damaged test blocks.
Figure 6.
Experimental powder, steel fiber, test blocks, and equipment. (a) Powder; (b) Steel fiber; (c) High-strength concrete block; (d) Compressive strength test; (e) Some damaged test blocks.

Figure 7.
Curve-fitting results using the three models for the UHPFRC blocks.

Table 1.
The mean fitting errors, standard deviations, and the predicted 60th-day compressive strengths by the three models based on experimental data in example 1.
Table 1.
The mean fitting errors, standard deviations, and the predicted 60th-day compressive strengths by the three models based on experimental data in example 1.
| Index | Logarithmic Model | Polynomial Model | Proposed Model |
|---|---|---|---|
| Mean fitting error | 0.1907 | 0.2950 | 0.1133 |
| Fitted standard deviation of error | 0.0410 | 0.0670 | 0.0194 |
| R2 | 0.9541 | 0.8976 | 0.9694 |
| RMSE | 2.2453 | 3.3528 | 1.8317 |
| Predicted day 60 compressive strength | 63.83 MPa | 127.39 MPa | 56.91 MPa |
Table 2.
The mean fitting errors, standard deviations, and the predicted 60th-day compressive strengths by the three models based on experimental data in example 2.
Table 2.
The mean fitting errors, standard deviations, and the predicted 60th-day compressive strengths by the three models based on experimental data in example 2.
| Index | Logarithmic Model | Polynomial Model | Proposed Model |
|---|---|---|---|
| Mean fitting error | 0.0847 | 0.0170 | 0.0101 |
| Fitted standard deviation of error | 0.0179 | 0.0054 | 0.0023 |
| R2 | 0.9579 | 0.9984 | 0.9991 |
| RMSE | 1.7148 | 0.339 | 0.2442 |
| Predicted day 60 compressive strength | 76.06 MPa | 550.14 MPa | 68.17 MPa |
Table 3.
The mean fitting errors, standard deviations, and the predicted 60th-day compressive strengths by the three models based on experimental data in example 3.
Table 3.
The mean fitting errors, standard deviations, and the predicted 60th-day compressive strengths by the three models based on experimental data in example 3.
| Index | Logarithmic Model | Polynomial Model | Proposed Model |
|---|---|---|---|
| Mean fitting error | 1.4240 | 2.0567 | 0.6167 |
| Fitted standard deviation of error δ | 0.2581 | 0.3783 | 0.0988 |
| R2 | 0.9672 | 0.9639 | 0.9623 |
| RMSE | 3.2636 | 3.4255 | 3.4973 |
| Predicted day 60 compressive strength | 97.73 MPa | 917.90 MPa | 81.56 MPa |
Table 4.
The mean fitting errors, standard deviations, and the predicted 60th-day compressive strengths by the three models based on experimental data in example 4.
Table 4.
The mean fitting errors, standard deviations, and the predicted 60th-day compressive strengths by the three models based on experimental data in example 4.
| Index | Logarithmic Model | Polynomial Model | Proposed Model |
|---|---|---|---|
| Mean fitting error | 0.4344 | 0.5604 | 0.1571 |
| Fitted standard deviation of error | 0.1325 | 0.1712 | 0.0314 |
| R2 | 0.8738 | 0.7948 | 0.9639 |
| RMSE | 6.3454 | 8.0907 | 3.3948 |
| Predicted day 60 compressive strength | 87.69 MPa | 24.89 MPa | 80.57 MPa |
Table 5.
Mix proportion and basic physical parameters of UHPFRC.
| Mix Proportion | Density | Initial Setting Time | Final Setting Time | ||
|---|---|---|---|---|---|
| Powder 2130 kg/m3 | Steel fiber 160 kg/m3 | Water 196 kg/m3 | 2488 kg/m3 | 240 min | 900 min |
Table 6.
The measured compressive strengths of the UHPFRC cubes (MPa).
| Age (Unit: Day) | Cube 1 | Cube 2 | Cube 3 | Mean Value |
|---|---|---|---|---|
| 0.5 | 44.596 | 41.413 | 43.899 | 43.303 |
| 1 | 65.842 | 71.954 | 75.241 | 71.012 |
| 2 | 101.524 | 100.801 | 97.419 | 99.915 |
| 3 | 106.935 | 110.032 | 109.759 | 108.909 |
| 4 | 120.471 | 109.423 | 112.927 | 114.274 |
| 5 | 122.200 | 116.100 | 104.400 | 114.300 |
| 6 | 125.919 | 107.592 | 122.186 | 118.566 |
| 7 | 120.030 | 123.060 | 116.28 | 119.790 |
| 8 | 121.192 | 122.166 | 121.963 | 121.774 |
| 9 | 124.069 | 116.635 | 125.644 | 122.116 |
| 10 | 117.506 | 122.822 | 128.429 | 122.919 |
| 14 | 121.747 | 136.977 | 119.324 | 126.016 |
Table 7.
The mean fitting errors, standard deviations, and the predicted 60th-day compressive strengths by the three models based on UHPFRC experimental data.
Table 7.
The mean fitting errors, standard deviations, and the predicted 60th-day compressive strengths by the three models based on UHPFRC experimental data.
| Index | Logarithmic Model | Polynomial Model | Proposed Model |
|---|---|---|---|
| Mean fitting error | 0.3503 | 0.2877 | 0.0480 |
| Fitted standard deviation of error | 0.0797 | 0.0649 | 0.0095 |
| R2 | 0.9130 | 0.9437 | 0.9974 |
| RMSE | 7.0595 | 5.6791 | 1.2304 |
| Predicted day 60 compressive strength | 171.13 MPa | 1192 MPa | 128.36 MPa |
Disclaimer/Publisher’s Note: The statements, opinions and data contained in all publications are solely those of the individual author(s) and contributor(s) and not of MDPI and/or the editor(s). MDPI and/or the editor(s) disclaim responsibility for any injury to people or property resulting from any ideas, methods, instructions or products referred to in the content. |
© 2023 by the authors. Licensee MDPI, Basel, Switzerland. This article is an open access article distributed under the terms and conditions of the Creative Commons Attribution (CC BY) license (https://creativecommons.org/licenses/by/4.0/).
Share and Cite
MDPI and ACS Style
Peng, X.; Yang, Q.; Cao, H.; Wang, H. Mathematical Model for Early-Aged UHPFRC Compressive Strength Changes. Coatings 2023, 13, 525. https://doi.org/10.3390/coatings13030525
AMA Style
Peng X, Yang Q, Cao H, Wang H. Mathematical Model for Early-Aged UHPFRC Compressive Strength Changes. Coatings. 2023; 13(3):525. https://doi.org/10.3390/coatings13030525
Chicago/Turabian StylePeng, Xi, Qiuwei Yang, Hongfei Cao, and Haozhen Wang. 2023. "Mathematical Model for Early-Aged UHPFRC Compressive Strength Changes" Coatings 13, no. 3: 525. https://doi.org/10.3390/coatings13030525
Note that from the first issue of 2016, this journal uses article numbers instead of page numbers. See further details here.