
Corrosion Research on Ru Porcelain Glazes Excavated at Qingliangsi, Baofeng, China
1
Institute for Cultural Heritage and History of Science and Technology, University of Science and Technology Beijing, Beijing 100083, China
2
International Joint Research Laboratory of Environmental and Social Archaeology, Shandong University, Qingdao 266237, China
3
Henan Provincial Institute of Cultural Heritage and Archaeology, Zhengzhou 450000, China
*
Author to whom correspondence should be addressed.
Coatings 2023, 13(6), 1011; https://doi.org/10.3390/coatings13061011
Submission received: 28 April 2023
/
Revised: 20 May 2023
/
Accepted: 25 May 2023
/
Published: 30 May 2023
(This article belongs to the Special Issue Materials Characterization and Surface Analysis for Cultural Heritage)
Abstract
:This paper examines two pieces of Ru porcelain glaze excavated from the Qingliangsi kiln site. Compared with the R1 glaze, the R2 glaze was fired at a lower temperature and cooled at a slower rate. The chemical composition, microstructure, and corrosion mechanisms of the two glazes were analyzed by optical microscopy (OM), scanning electron microscopy-energy dispersive X-ray spectroscopy (SEM-EDS), micro-Raman spectroscopy, transmission electron microscopy (TEM), and X-ray diffraction (XRD). The results show that the corrosion morphology of R1 glaze is mainly the dissolution of a three-dimensionally interconnected calcium (Ca)-rich phase around anorthite, and that of R2 glaze is mainly the dissolution of small droplets distributed in rows, including the dissolution of needle-like wollastonite precipitated by droplet aggregation. In addition, the dissolution of the glass phase and wollastonite crystals forms many white corrosion pits, and the physical and chemical interaction between the corroded glaze and the soil results in the deposition of contaminants that alters the color and texture of the glaze.
1. Introduction
Ru porcelain originated in Northern Song Dynasty (960–1127 A.D.) China, and there are only approximately 70 intact pieces of Ru porcelain in museum collections worldwide [1], making Ru kiln porcelain very valuable. The glaze of Ru celadon is warm and moist, similar to jade, simple and elegant. The ruling class and feudal literati in the Song Dynasty followed Cheng-Zhu Neo-Confucianism and pursued the simple and unadorned, so it was much loved by the royal family of the Northern Song Dynasty. Due to the very small number of surviving examples, Ru porcelain had become very rare in the Southern Song Dynasty (1127–1279 A.D.) and was listed as the first of the five most famous porcelains of the Chinese Song Dynasty [2,3,4]. In the 1930s, Chinese ceramics experts began to search for Ru kiln sites. At the end of the 20th century, archaeologists drilled and excavated a kiln site (Zone IV) at Qingliangsi in Baofeng, Henan Province, China, and determined the location and extent of the production area of Ru porcelain that supplied the imperial family in the Song Dynasty [5,6]. The archaeological excavation of the Qingliangsi kiln site unearthed a large number of Ru porcelain fragments, providing further examples for the study of imperial Ru porcelain. After decades of research by ceramists, there is now a relatively in-depth understanding of the chemical composition, microstructure, firing temperature and coloring mechanism of Ru celadon [7,8,9,10,11,12,13,14,15,16]. According to visual observation, most of the excavated celadons had the phenomenon of “earth erosion” on the glaze surface [6,17]. These spots greatly affected the texture of the glaze (Figure 1).
The corrosion of glazes is a complicated process because the surface is often composed of a glassy phase and one or more different crystalline phases. Ru porcelain glazes mainly contain anorthite crystals and phase-separated glass, as reported in the literature [11]. He et al. [19] analyzed three pieces of Ru porcelain glazes and found that the Ca-rich phase in the glass is preferentially degraded compared to the homogeneous glass, and the degradation of the glass leads to the loss of anorthite in the glaze. Corrosion of Ru porcelain glazes can be similar to that of silicate glass, with ion exchange of alkali ions by hydrogen ions in acidic environments and destruction of the network structure of glass by hydroxyl attack in alkaline environments. Shi et al. [20] found Si-OH bonds on the glaze of Ru porcelain, indicating that the Si-OR and Si-O-Si in the glaze had been destroyed. Recently, homogeneous glass erosion was found on the surface of the black glaze of Jian and Tushan kilns in the Song Dynasty in China, and the etched glaze produced a Si-rich hydrate layer [21,22].
In addition to the corrosion of glass in glaze, the corrosion of crystals in glaze and its interface is also worthy of attention. The crystal corrosion resistance of different components in glass or ceramic glazes has been evaluated in many studies [23,24,25,26,27]. Wollastonite crystals in glazes are very susceptible to erosion in acidic and weakly alkaline environments, while diopside, corundum, and quartz crystals are more resistant to corrosion, and there is no interfacial corrosion around these crystals. Feldspar crystals also have high corrosion resistance, but the interfacial layer around these crystals is susceptible to corrosion in the most acidic and alkaline environments. Back in the early 21st century, Zhang et al. [15] suggested the presence of anorthite crystals and incompletely melted limestone on the glaze surface of Ru porcelain excavated from the Qingliangsi kiln site, which reacted with sulfuric acid to form calcium sulfate and damage the glaze. Recently, Li et al. [28] discovered the degradation of dendritic and columnar wollastonite crystals in the glaze of Song dynasty Jun porcelain.
Glazes with similar formulations can have different microstructures due to differences in firing temperature, atmosphere, and holding time [29]. This can lead to variations in corrosion morphologies and mechanisms. At present, there is a need to expand the analysis of Ru porcelain samples, as the number of samples for Ru porcelain corrosion studies is still relatively small, and the corrosion of separated phase glass may not represent the type of corrosion of Ru porcelain glazes. In this paper, two pieces of Ru porcelain with different appearances excavated from the Qingliangsi kiln site (Area IV) in Baofeng were selected for the study. The aim was to determine the different corrosion phenomena and mechanisms of Ru porcelain due to the differences in microstructure and provide more information for the conservation of Ru porcelain. Furthermore, the interaction between archaeological artifacts and the environment will provide insight into long-term corrosion studies of modern silicate materials, as Ru porcelain has been buried in natural soil environments for nearly a millennium.
2. Materials and Methods
2.1. Samples
The debris samples were taken from the Qingliangsi kiln site (Zone IV); the archaeological number is BQIVT24②, and the experimental numbers are R1 and R2. Photographs of the samples are shown in Figure 2. The body color of R1 is blue-gray, and the body quality is dense. The glaze color is sky-blue; the inner glaze is covered with ring-shaped white pits, and the outer glaze is well preserved. The body color of R2 is blue-gray, and the body quality is slightly looser than that of R1. The glaze color is sky-blue; the inner and outer glaze surfaces have white spots, and the outer glaze surface is partially covered with yellowish-brown soil rust.
2.2. Analytical Techniques
Optical microscopy (OM): The macroscale morphology of the glaze surfaces and polished cross-sections was observed using an ultra-depth 3D microscope (VHX-6000, Keyence, Osaka, Japan).
X-ray diffraction (XRD): The crystal phases of the glaze were determined by XRD (XRD-TERRA II, Olympus, Center Valley, PA, USA) with Co radiation (30 kV) and 2θ ranging from 5° to 55°. The glaze was ground to powder in an agate mortar (particle size D < 150 µm) and then filled into the sample chamber (sample mass ~10 mg).
Scanning Electron Microscopy-Energy Dispersive X-ray Spectrometry (SEM-EDS): The micromorphology and chemical composition of the micro-areas were characterized by SEM (Quattro ESEM, Thermo Fisher Scientific, Waltham, MA, USA) with an EDS X-ray spectrometer (QUANTAX EDS, Bruker, Billerica, MA, USA). The analyses were carried out in a low vacuum environment (60 Pa) with an operating voltage of 15 kV and element acquisition at a working distance of 10 mm for 30 s, with P/B-ZAF for stoichiometric quantification. To observe the cross-sectional microstructure of the sample, small pieces of approximately 1 cm2 were cut from the edges of the sample using a diamond saw blade, embedded in epoxy resin and later polished using SiC sandpaper and diamond polishing paste (3 μm, 1 μm).
Micro-Raman: The phase components of the glaze were characterized using laser microconfocal Raman spectroscopy (Renishaw inVia, London, UK). It was equipped with a research-grade Leica microscope with a spatial resolution of <0.5 μm. The optical lenses were 50× and 100×, and the laser wavelength was 532 nm. The baseline was subtracted using WIRE software, the Raman spectrum of the glaze was deconvolved using Origin software and the curve was fitted with a Gaussian function.
Transmission Electron Microscopy (TEM): The TEM image and selected area electron diffraction (SAED) were taken in a Cs-corrected environmental transmission electron microscope. (Titan ETEM G2, FEI, Hillsboro, OR, USA) at 300 kV. Elemental distribution analysis was carried out by energy-dispersive X-ray spectroscopy (EDS, Oxford instruments, Oxford, UK) combined with STEM. The sample was prepared for TEM by ion milling with 3.2 to 4.5 keV Ar+ ions for a few hours after mechanical thinning.
Handheld spectrophotometer (Ci64, X-rite, Grandville, MI, USA), measuring aperture 4 mm.
3. Results and Discussion
3.1. Analysis of the Pristine Glaze
3.1.1. Chemical Composition of the Body and Glaze
The chemical compositions of R1 and R2 Ru glazes are shown in Table 1, and the component contents were calculated in the oxide mode. The content of Al2O3 in the body was ~28 Wt%, and the content of SiO2 was ~60 Wt%, which had the characteristics of high aluminum and low silicon of the northern China porcelain body. The glaze contained high levels of MgO (~2 Wt%) and P2O5 (~0.4 Wt%), indicating that a certain amount of plant ash was added to the Ru celadon glaze as a flux. The discriminant coefficients b (RO/(RO + R2O)) of the glazes (R1 and R2) were calculated [30], and the b values of the glazes were greater than 0.76, indicating that R1 and R2 belong to the calcium glaze.
3.1.2. Microstructure and Physicochemical Foundation
The pore diameter, the thickness of the glaze and the thickness of the interlayer between the body and the glaze of R1 and R2 were measured by optical microscopy. The photographs are shown in Figure 3 and the test data are given in Table S1. Compared to R2, the body and glaze of R1 had larger pore diameters and thicker glaze layers. There was a white interlayer between the body and the glaze, which was the reaction layer of mutual diffusion between the glaze and the body. The R1 interlayer was thick with many pores between it and the glaze. The R2 interlayer was relatively thin and closely bonded to the glaze. It was therefore assumed that R1 had a higher firing temperature and shorter holding and annealing times, while R2 had a lower firing temperature and longer holding and annealing times.
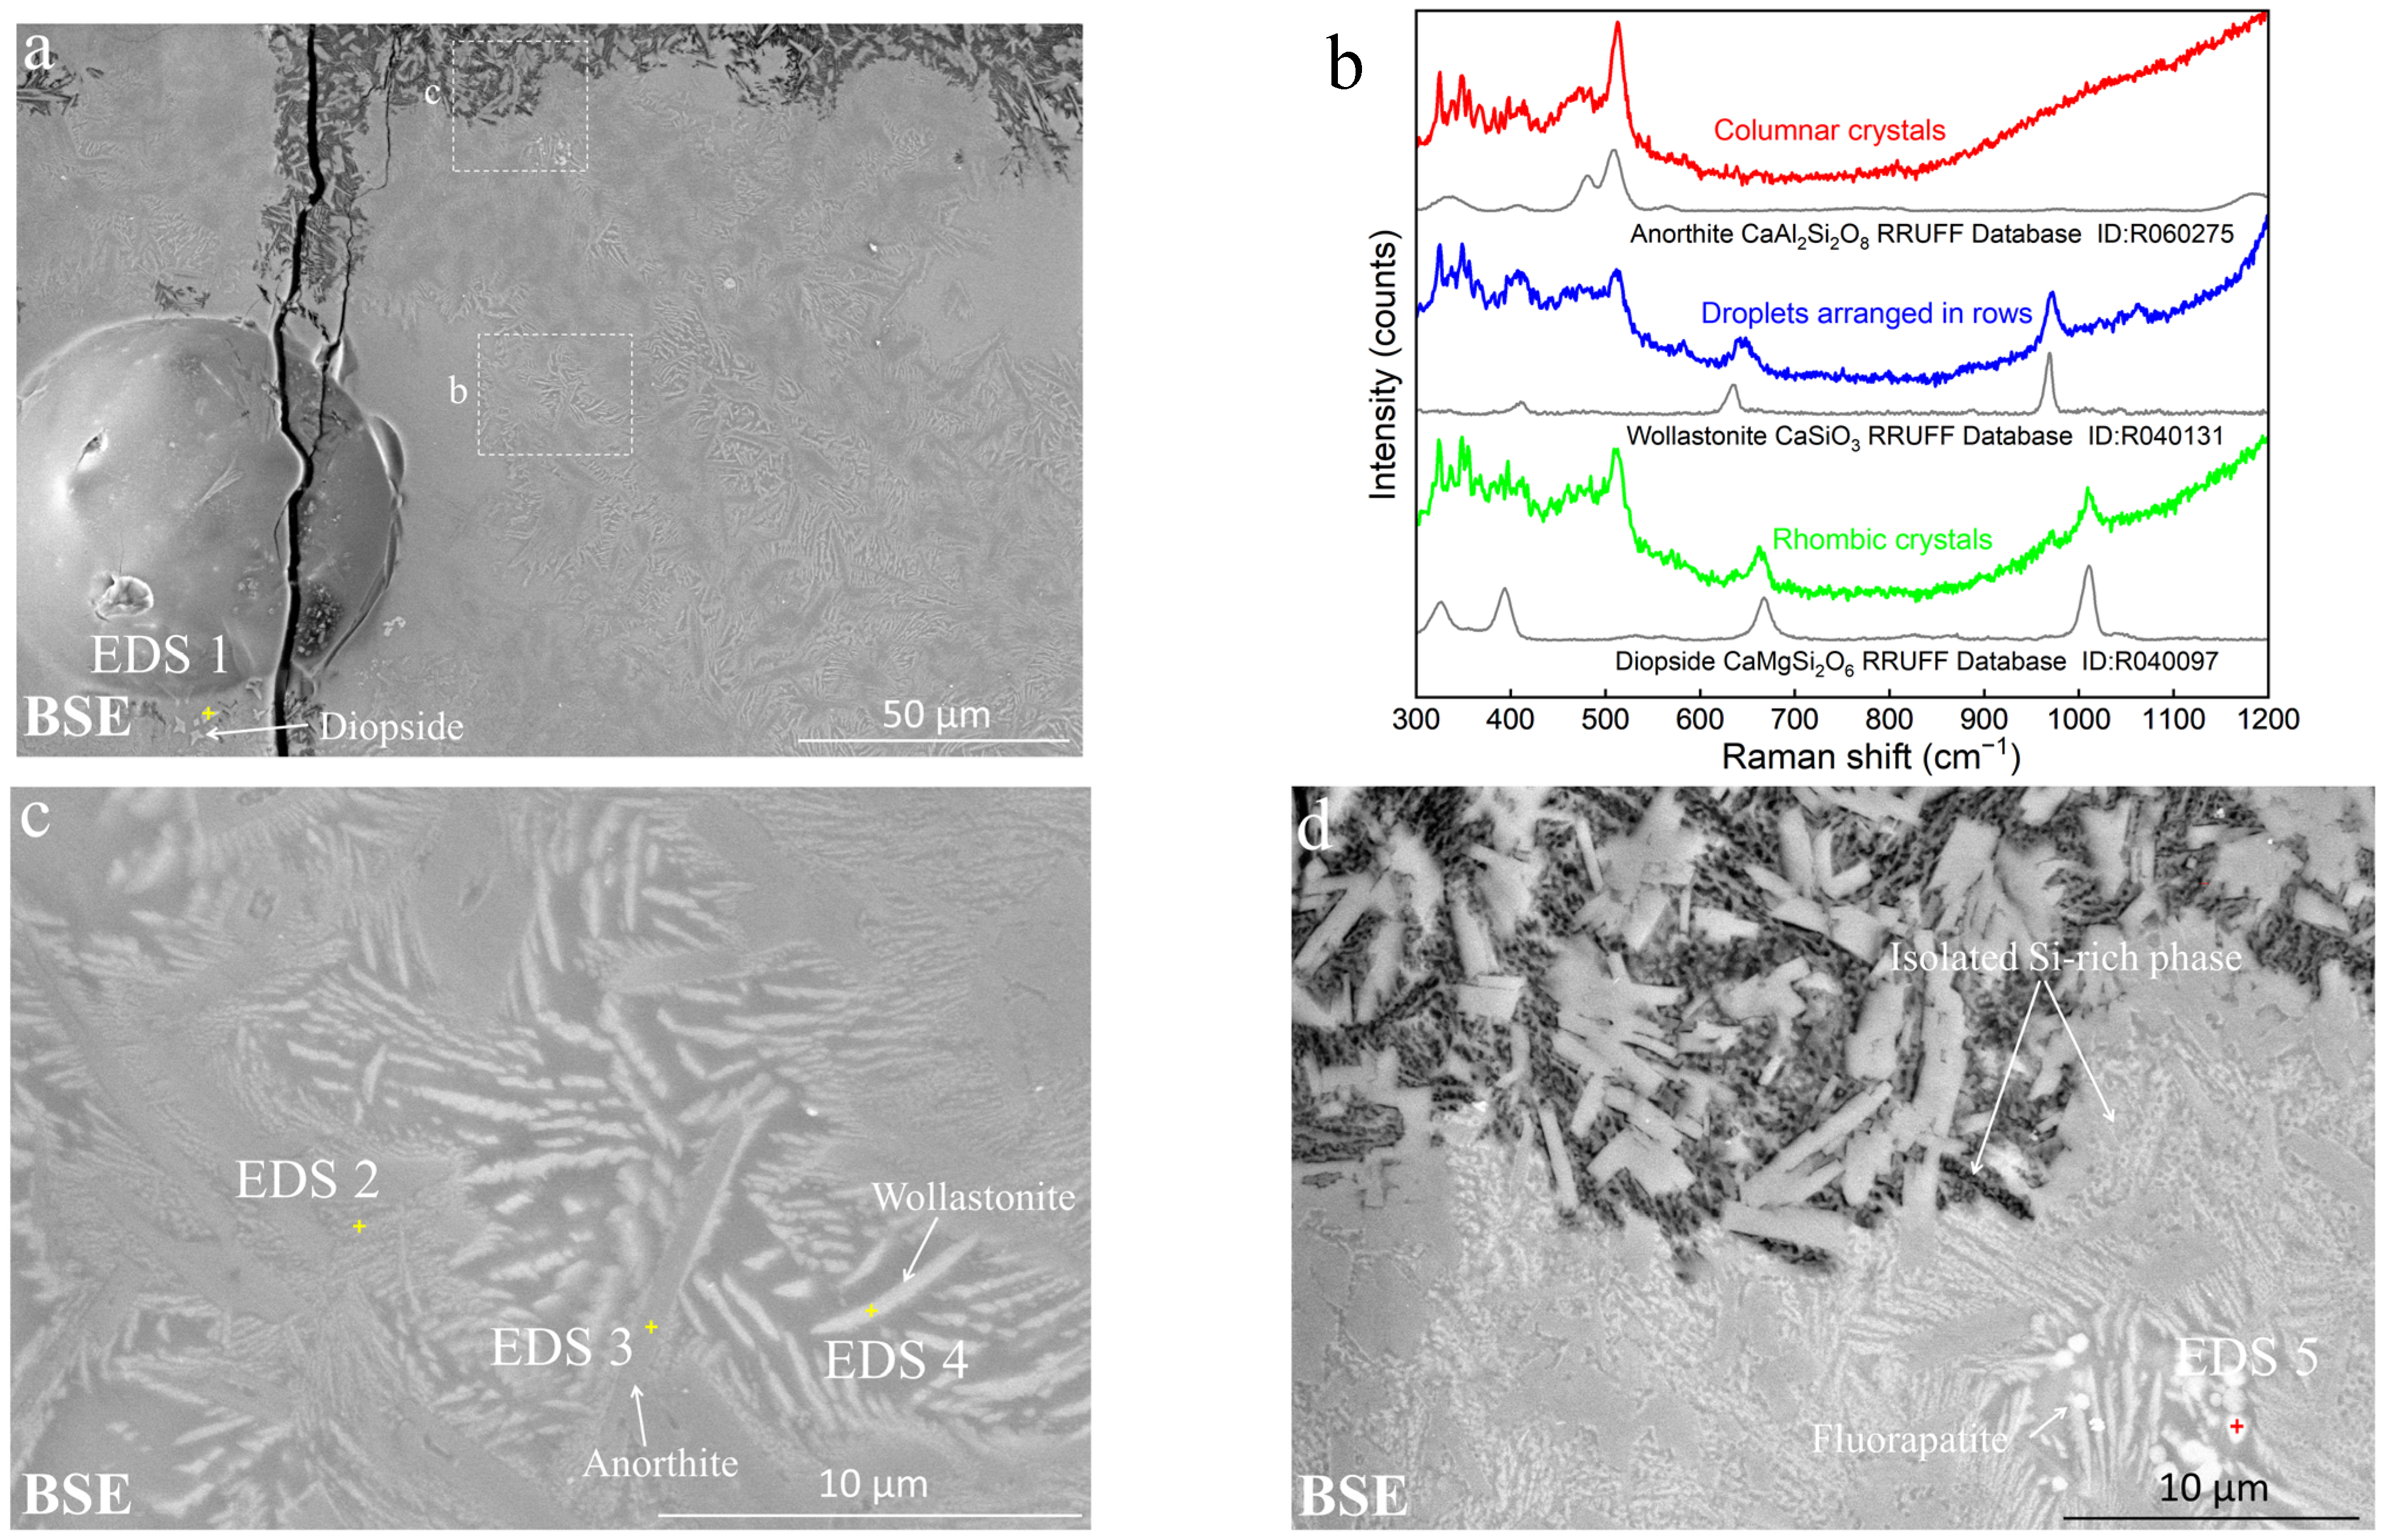
SEM images showed that a large number of short columnar crystals with a length of 2–5 μm were distributed in the glaze (Figure 4a). The EDS test showed that the contents of Ca, Al and Si in the columnar crystals were relatively high (Table 2, EDS 1), and the Raman analysis showed that they were anorthite (Figure 5b). In the ternary phase diagram of SiO2-Al2O3-CaO (Figure 5), the chemical composition of R1 and R2 glazes was concentrated in the primary crystalline region of anorthite, which resulted in them having a great tendency to crystallize, with several possibilities of nucleation interfaces, including the air/glaze surface interface, body/glaze interface, quartz particles or other inclusions/liquid interface, and the air/liquid interface provided by bubbles and cracks. In particular, the glaze formulation also contained agate [2,7]. Compared to quartz, its complex composition, small grain size, large surface area and many internal structural defects were more conducive to the nucleation and crystallization of anorthite [31].
With further growth of anorthite, the Al2O3 in the surrounding glass was largely consumed, the SiO2/Al2O3 ratio increased sharply, and then the composition rapidly moved into the metastable liquid-liquid immiscibility zone above 950 °C. Therefore, there were many phase-separated structures in the R1 and R2 glazes. In the SEM images (Figure 4c,d), the dark phase had a high content of silicon (Si), and the light phase had a higher content of calcium (Ca) and magnesium (Mg), which were referred to as the Si-rich phase and the Ca-rich phase, respectively (Table 2, EDS 2, EDS3). In addition, K was enriched in the Si-rich phase, while Fe and P were enriched in the Ca-rich phase. The phase-separated structure in the glaze was not uniform. Away from the anorthite, the size of the separated phase was smaller, and the Ca-rich phase was isolated and distributed in the continuous Si-rich phase in the form of droplets or worms (Figure 4c). The sizes of 187 Ca-rich phases were measured and counted; the average size was 81 nm and 60% of the sizes were predominantly between 55 and 137 nm (Figure 6a). Around the anorthite or between closely spaced anorthites, the size of the Ca-rich phase was larger and the shape was wormlike or three-dimensional (Figure 4d). The sizes of 106 Ca-rich phases were measured and counted; the average size was 489 nm and 60% were between 268 and 668 nm (Figure 6b).
The phase separation in the glaze was mainly determined by the strong immiscibility tendency between SiO2 and CaO. Mazurine’s research [32] showed that Al3+ could form complex groups Ca2+([AlO4/2]2Ca). In this way, the complex group could consume some of the Ca2+. Although the structure of [AlO4/2]2Ca was different from that of [SiO4/2], it was not enough to cause phase separation and could produce compatibility with more structures. Therefore, the addition of Al2O3 would reduce the phase separation tendency of SiO2-CaO. As seen in the SEM image, the phase separation tendency in the glass phase of the anorthite boundary zone was stronger due to the consumption of more Al content, and the size of the phase was larger. With increasing distance from the anorthite, the Al content in the glass phase increased, the phase separation tendency decreased and the size of the phase decreased.
In a small area of the R1 glaze (Figure S1) and in most of the R2 glaze (Figure 7a), there are small droplets arranged in rows around short columnar crystals. EDS analysis showed that the crystals contained mainly Ca, Al and Si elements, suggesting that they were anorthite crystals (Figure 7b). The Ca content in the small droplets was higher, with n(Si/Ca) = 2.8 (Table 3, EDS 2). The needle-like crystals in this region were formed by the aggregation of small droplets, with n(Si/Ca) = 2.5 (Table 3, EDS 4). In contrast, the disordered arrangement of Ca-rich droplets is n(Si/Ca) = 3.5 (Table 2, EDS 3). In other areas, the Ca-rich phase in the R2 glaze was a continuous phase in some areas, and the Si-rich phase was isolated droplets (Figure 7d). In addition, a small amount of crystal particles was observed in the local areas of R1 and R2, which were unmelted quartz particles and fluorine-containing apatite particles (Figure 7d, Table 3, EDS 5), as determined by SEM-EDS.
The Raman spectrum of the cross-sectional glaze of R2 (Figure 7b), showed characteristic peaks for anorthite (513 cm−1, 483 cm−1), wollastonite (640 cm−1, 970 cm−1), and diopside (662 cm−1, 1010 cm−1). A detailed structural analysis was carried out using transmission electron microscopy (TEM). In Ca-rich droplets, n(Si/Ca) = 2.7, and electron diffraction patterns of a region of droplets arranged in rows show that the droplet contains wollastonite crystals, ref. ICDD-PDF-4 and database (PDF#01-076-0186) (Figure 8).
The microstructural differences between the R1 and R2 glazes were related to the firing process. R2 had a lower firing temperature and a longer annealing time than R1. In the process of slow annealing, R2 had enough time to saturate and precipitate wollastonite crystals from the Ca-rich phase, and the phase separation interface provided a nucleation interface, reducing the nucleation barrier and promoting the precipitation of crystals. Due to the liquid viscosity and surface tension, some Ca-rich phases entangled, coarsened and aggregated into micron-sized needle-like wollastonite crystals. The R2 glass, therefore, contained more wollastonite crystallites. The powders of the R1 and R2 glazes were analyzed by XRD (Figure 9), and according to the peak intensities, diopside and wollastonite were higher in the R2 glaze than in the R1 glaze. The diopside may have been formed by the reaction of Mg, which is locally abundant, with the quartz melt. R1 may have undergone anorthite crystallization—phase separation during the firing process, and R2 may have undergone anorthite crystallization—phase separation—wollastonite crystallization during the firing process. Although the chemical composition of the glaze was similar, the different firing processes resulted in large differences in the microstructure, and these microstructures had different effects on the corrosion of the glaze.
3.1.3. Color Characterization and Coloring Mechanism
Glazes R1 and R2 have celestial appearances. The wavelength at which the reflectance spectrum peaks is the dominant wavelength, that characterizes the hue of the object. In the spectrophotometer analysis (Figure 10, Table 4), the dominant wavelength of the R1 and R2 glazes is in the range of 496 to 516 nm, which is in the blue-green wavelength range. Compared to the R1 glaze, the R2 glaze has a larger dominant wavelength, a broader reflectance spectrum curve and lower color saturation, indicating that the R2 glaze is more yellow and reflects more white light. This may be due to more yellow dirt deposits and more crystal reflection on the surface of the R2 glaze. The color saturation of the R1 inner side glaze surface is significantly lower than that of the outer side glaze, indicating that the inner side glaze reflects more white light and is more corroded.
Optical microscope observations of surface and cross-sections of R1 and R2 are shown in Figure 11a, Figure 12a, Figure 13a and Figure 14a. The glazes R1 and R2 have mainly white opalescence, blue opalescence and transparent areas. In order to investigate the intrinsic causes of the color change in the corroded glaze, it is necessary to understand the relationship between the microstructure and the coloring of the two Ru celadons. MATLAB software is used to perform a 2D Fourier transform on the SEM image of the phase-separated structural region, as shown in Figure 4c,d. The 2D Fourier transform graph of the isolated droplets and the three-dimensional connected phase is a ring, which is consistent with long-range disorder and short-range ordered amorphous photonic structure, and the lined-up droplet structure does not conform to the amorphous photonic structure [33]. The phase-separated structure has short-range order and conforms to coherent scattering conditions, and the size of the droplet can be calculated by Bragg’s law. The calculation procedure is shown in the Supplementary Material. The phase separation sizes of the R1 glaze range from 126 to 160 nm, which can produce coherent interference in the blue to violet visible light ranges and show structural color. The phase separation size in the region far from anorthite in R1 is mostly concentrated between 55 and 137 nm, and the phase separation size near anorthite is mostly concentrated between 268 and 668 nm. Therefore, not all phase-separated regions in the R1 glaze can produce amorphous photonic structural colors, and the phase-separated structure produces blue opalescence only in the regions far from anorthite.
The phase-separated droplets smaller than 100 nm in the glaze (away from the anorthite) are much smaller than the wavelength of visible light, conform to the conditions of Ruili dispersion (monomer scattering) and show a transparent blue color. Structures in the glaze that are much larger than the wavelength of visible light, such as the micron-scale phase-separated structure, anorthite, diopside, wollastonite, quartz, apatite and bubbles, follow the Mie dispersion (monomer scattering) condition and produce full-band reflection and refraction of the incident light, giving a milky white glaze appearance. In addition, the concentration and ratio of Fe2+/Fe3+ also affect the color of the glaze. The R2 glaze contains a large number of phase-separated structures arranged in rows that do not produce coherent scattering. There are many micron-sized wollastonite and diopside crystallites in the R2 glaze and Mie scattering is very dominant. Compared to the R1 glaze, the R2 glaze is whiter in color.
The color difference between R1 and R2 is due to the different microstructure of the glaze. Different microstructures have different degrees in corrosion. Therefore, the degree of corrosion of different color areas on the glaze surface will be different. The white opalescent areas may contain large phase-separated structures or wollastonite crystallites, which are more susceptible to corrosion than the blue and transparent areas, as discussed in detail below.
3.2. Analysis of the Corroded Glaze
3.2.1. Micromorphology
The R1 glaze on the outside of the fragment is relatively well preserved and shows an opalescent azure color. Under the optical microscope, there are many air bubbles in the outer glaze (Figure 11a). However, the inner glaze is covered with white spots (Figure 11b). According to the 3D ultra-depth microscope analysis, the white spots are annular pits with a depth of approximately 10 μm and a diameter range of approximately 50–400 μm (Figure 11b,c), which is the same order of magnitude as the diameter of the bubbles in the glaze. During the firing process, as the bubbles in the glaze rise to the surface, the liquid glaze above the bubbles collapses into the bubbles, squeezing the large bubbles into more small bubbles, and these smaller bubbles gather at the boundary of the original large bubbles. When these small bubbles escape, the glaze cannot be completely flattened due to the fast-annealing speed and a circular pit is formed. The process of ring pit formation is shown in Figure S2. These pits provide a place for the retention of the aqueous solution and will become an important site for corrosion to occur.
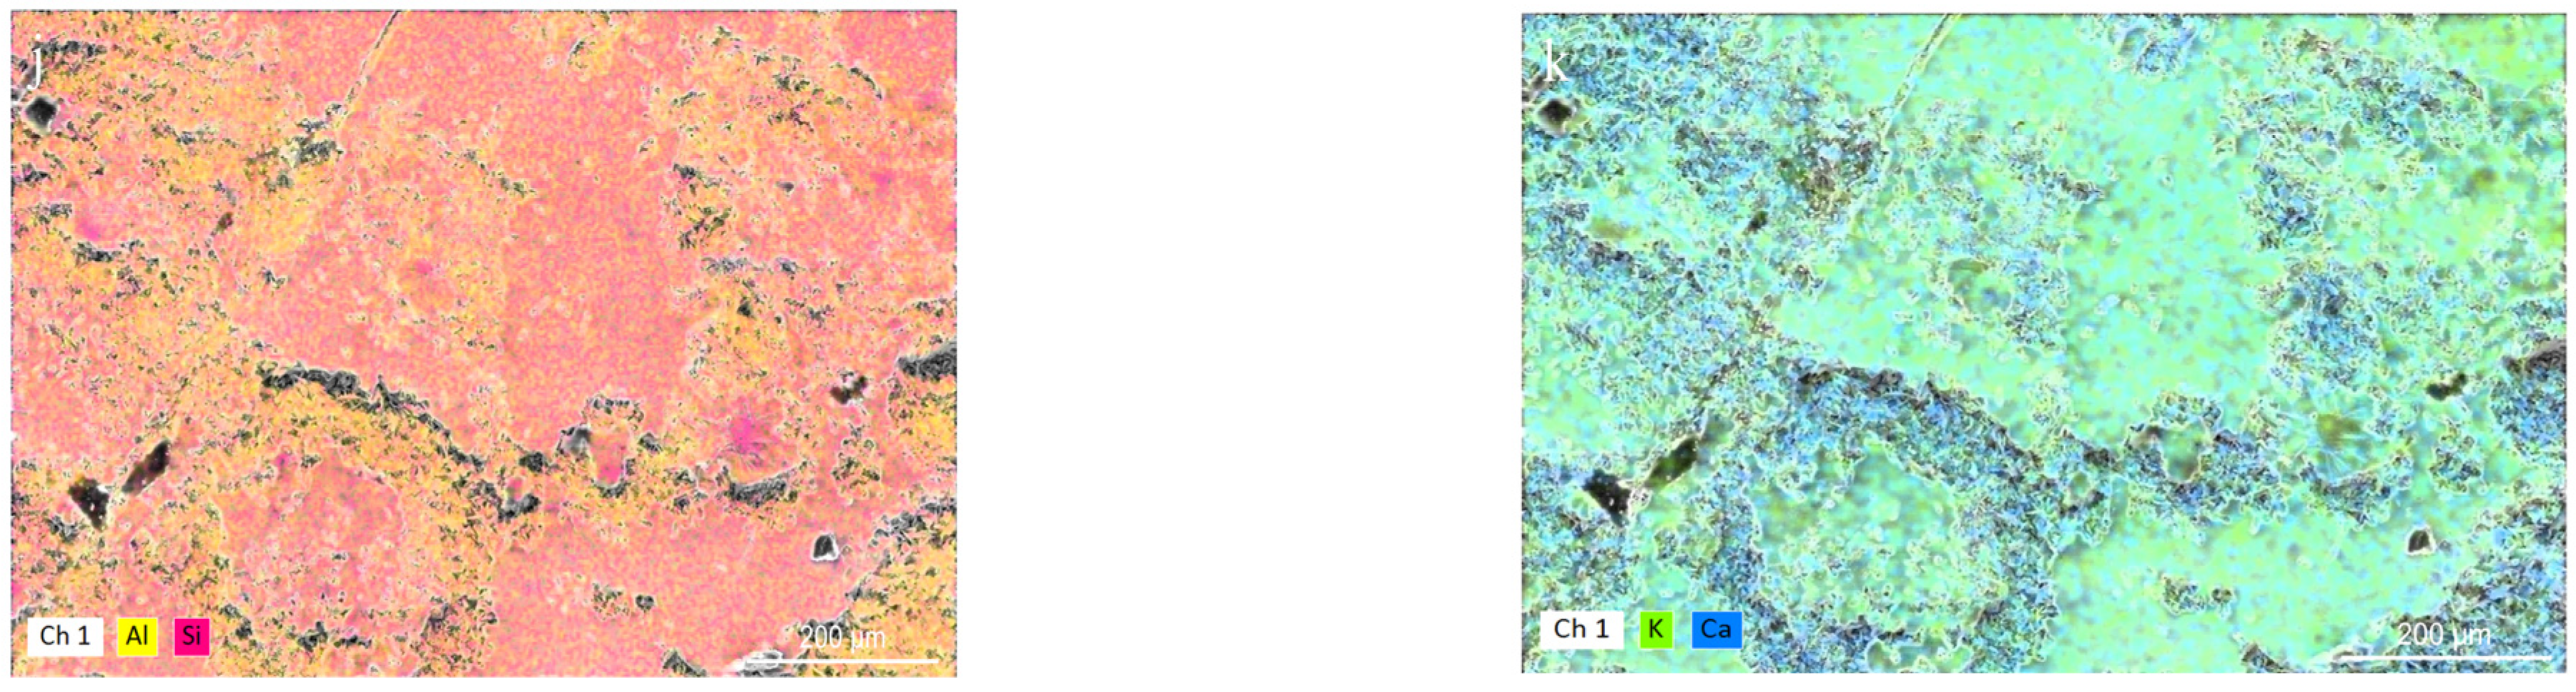
The SEM-EDS elemental mapping of the surface of R1 glaze (Figure 11j,k) shows that the content of Al and Ca in the pit area is relatively high. Under magnification, more columnar and flaky crystals are observed, corresponding to anorthite (Figure 11e, Table 5, EDS 3). In addition, the pits also contain a small number of iron ore particles (Figure 11e, Table 5, EDS 4), clay particles (Figure 11e, Table 5, EDS 5) and residual glass phase with a network pore structure that has a low calcium content (Figure 11f, Table 5, EDS 6). The corrosion pits of the glass phase around the anorthite are deep, resulting in the exfoliation of part of the anorthite, while the glass phase far from the anorthite has only shallow corrosion pits (Figure 11g). The corrosion zone also contained calcium sulfate deposits (Figure 11h, Table 5, EDS 9). The area of high Si content on the surface is unfused quartz and there are a large number of long rod-shaped crystals around the quartz (Figure 11e,i, Table 5, EDS 1). The rod-shaped crystals contain high contents of Mg, Ca and Si and are diopside crystals (Figure 11e,i, Table 5, EDS 2).
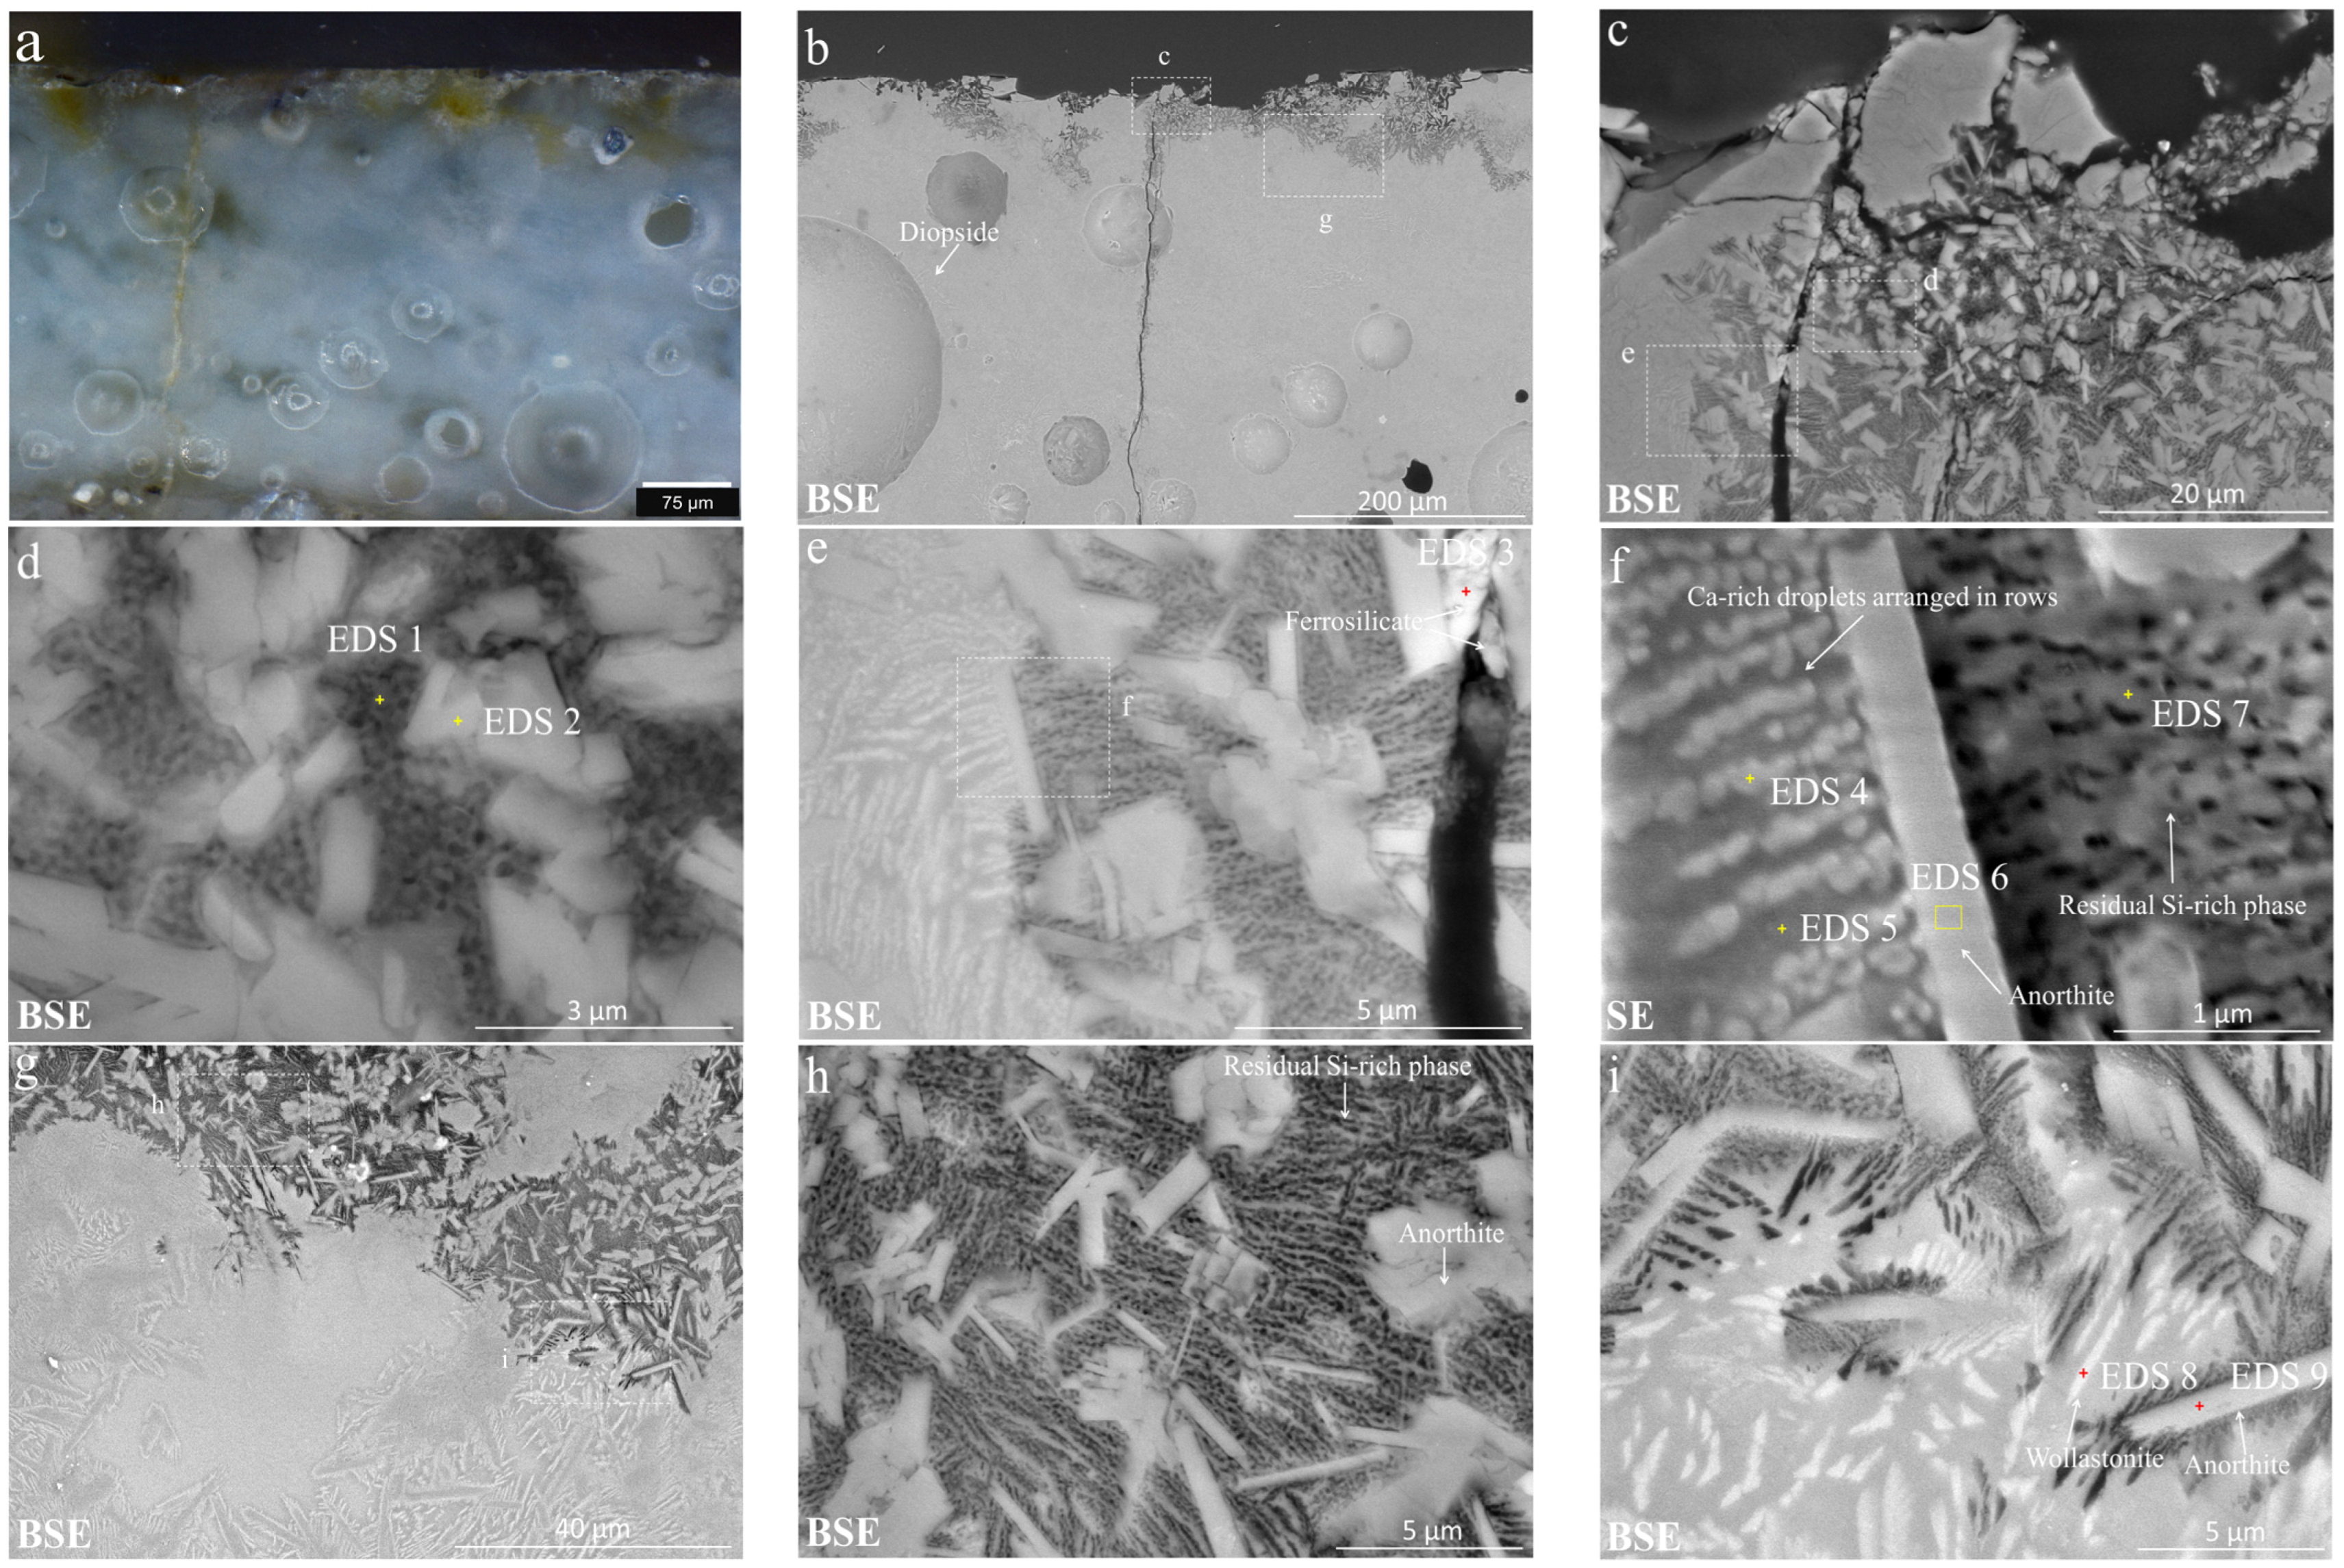
The surface of the R2 fragment shows many milky white substances. (Figure 12a) In the SEM image (Figure 12b–f) and elemental mapping of the surface of the R2 glaze (Figure 12g–i), the glaze surface is well preserved in some areas, and a large number of long rod-shaped diopside crystals with high Mg, Ca, and Si contents are distributed on the glaze surface. A small amount of diopside crystals fall from the glaze, leaving long rod-shaped pits (Figure 12b). The glass matrix around the pit has less corrosion, possibly due to the high Si content in the glass matrix in the diopside generation area. The glaze surface in some other areas has many corrosion pits; the Al content in the corrosion pits is high (Figure 12d,h) due to the loss of large amounts of glass, and many columnar anorthite crystals remain (Figure 12e, Table 6, EDS 3). Overall, the area of corrosion pits on the R2 glaze is smaller compared to the R1 glaze. The ratio of corrosion pits to total area is 65.5% and 13.6% for R1, and R2 glazes, respectively (Figure S3). The glaze surface also contains deposits (Figure 12c,f) of calcium silicate (Table 6, EDS 1), iron-rich clay minerals (Table 6, EDS 2), and calcium sulfate (Table 6, EDS 5). The calcium element in the Ca-rich minerals may originate from the soil or the glaze.
The cross sections of the R1 and R2 glazes showed two corrosion morphologies. The first corrosion morphology occurs along the interface between the anorthite crystal (Figure 13d, Table 7, EDS 2) and the glass phase. The corrosion depth is approximately 40 μm inward from the glaze surface (Figure 13c), and the Ca-rich phase dissolves, leaving a three-dimensionally connected Si-rich phase (Figure 13e and Figure 14d, Table 7, EDS 1 and Table 8, EDS 1). At the front of the corrosion reaction, there is a circle of dark material (Figure 13g), possibly related to the leaching of network-modified ions such as Ca2+, Mg2+ and Fe2+/3+ in the Ca-rich phase.
In the second corrosion morphology, the corrosion proceeds along the direction of extension of the droplet rows around the anorthite, the corrosion depth is approximately 100 μm inward from the glaze surface (Figure S1b, Figure 13b,h and Figure 14b) and the Ca-rich droplets are dissolved (Table 7, EDS 3, Table 8, EDS 4 and Table S2, EDS 1), leaving a striated Si-rich phase (Table 7, EDS 5, Table 8, EDS 7 and Table S2, EDS 2). The first corrosion morphology is more common in the R1 glaze and the second corrosion morphology is more common in the R2 glaze. In the local area of the R2 glaze, an isolated spherical Si-rich phase remains after the loss of the continuous Ca-rich phase (Figure 7d and Figure S4). In this region, the volume ratio of the Ca-rich phase to the Si-rich phase increases, making the material more susceptible to corrosion.
3.2.2. Corrosion Mechanism
Glaze corrosion is not only related to chemical composition and microstructure but also to environmental factors. In the soil burial environment, the flow rate and pH of the aqueous solutions in contact with the glaze surface have the greatest effect on corrosion [34]. Minerals, organic matter and micro-organisms in the soil also affect the glaze. The Qingliangsi site is located in Pingdingshan City, Henan Province. The Pingdingshan coal mine is rich in resources and has a large national coal base. There are also several small private coal mines in the Qingliangsi site area. Acid rain caused by irrational coal mining, and irrational agricultural practices and excessive use of nitrogen fertilizers are all causes that accelerate soil acidification. From the 1980s to the 2010s, the average soil pH in Pingdingshan has decreased by approximately 1.5 pH units over the past 30 years. Soil pH in most areas of the city has decreased from neutral (6.5 ≤ pH < 7.5) and weakly alkaline (7.5 ≤ pH < 8.5) to weakly acidic (5.5 ≤ pH < 6.5) or even acidic (4.5 ≤ pH < 5.5) [35]. After 2000, the Ru kiln site was extensively excavated. Prior to the excavation, the porcelain buried in the soil had undergone a large pH change, and the acidification of the soil had an important effect on the corrosion of the porcelain.
In the first type of corrosion, the large Ca-rich phase around the anorthite dissolves and forms voids, leaving the Si-rich phase. Compared with the Si-rich phase, the Ca-rich phase contains more network-modifying ions, which reduce the degree of polymerization of the Si-O network and increase the amount of nonbridging oxygen. Therefore, the Ca-rich phase is more susceptible to corrosion. In the acidic soil solution, the Ca-rich phase in the glaze preferentially undergoes an ion exchange reaction, and the network modifying ions such as Ca2+ and Mg2+ in the glass network are leached out. (Equation (1)) Due to the difference in radius between the hydrogen ion and the modifier ion in the glass network, the Si-O network shrinks and produces microcracks. In the area of the microcracks, the fluidity of the solution is poor, and as the H+ in the aqueous solution decreases, the pH of the local area increases. Then the Si-O network in the Ca-rich phase begins to hydrolyze, and eventually, the Ca-rich phase is completely dissolved in the solution. (Equation (2)) Since the Ca-rich phase at the anorthite interface is three-dimensionally connected, a three-dimensionally connected channel is formed when it is completely dissolved, and the aqueous solution continues to corrode inward along the channel at the anorthite boundary. However, the isolated Ca-rich phase droplets far from the anorthite do not provide a connected channel for the aqueous solution to penetrate, resulting in a shallow corrosion depth. The voids formed by the lost Ca-rich phase provide a larger space and reaction surface for the infiltration and residence of the aqueous solution. The liquid within the channel has poor fluidity, and as the reaction time increases, the remaining Si-rich phase is also completely dissolved. Eventually, only the less soluble anorthite and diopside crystals remain. In addition, because the anorthite crystal and the glass phase are different materials, the atoms at the interface are not closely arranged, so there are many atomic-level vacancies. Additionally, the thermal expansion coefficients of the anorthite crystal and the glass phase are different, so the glass phase interface is stressed, resulting in tiny voids [36,37,38]. All of this provides channels for aqueous solutions to enter and a larger reaction interface for the reaction to occur. Therefore, corrosion is more likely to occur at the anorthite boundary. The anorthite in the glaze is highly resistant to corrosion, and when the glass matrix around the anorthite dissolves, the anorthites are not eroded but flake-off.
In the second type of corrosion, rows of Ca-rich droplets are dissolved around the anorthite. The above analysis shows that wollastonite crystallites are present in the Ca-rich phase droplets. Wollastonite is a triclinic, chain-like silicate in which Si-O tetrahedral groups form chains. The chain is formed along the b-axis by repeating structural units connected by two vertex-to-vertex Si-O tetrahedral radicals (Si2O7) and an Si-O tetrahedron, with one of its edges parallel to the direction of the chain. The [CaO6] octahedra attached to the chain are consistent with the direction of chain elongation [39,40]. There are many reports in the literature on the dissolution mechanism of wollastonite [41,42]. When wollastonite comes into contact with pure water, Ca ions are rapidly released from the surface and exchanged with H+ in the aqueous solution, raising the pH of the solution to approximately 10 within a few minutes. Wollastonite is incongruently dissolved and the calcium is released into the solution faster than silicon. With the ion exchange of Ca2+ and H+, the silanol groups formed in the surface leach layer undergo a polycondensation reaction. This repolymerization in the leach layer was confirmed by Casey et al. using Raman spectroscopy of the wollastonite leach layer and they found that this surface structure has a network of quaternary silicon rings [43]. This type of reconstruction results in cracks and pores in the leached layer, which may contribute to further surface protonation and Ca leaching. As the leaching process continues, the Si-O-OH polymer clusters detach from the surface due to the lack of attraction of the network modifying ion Ca2+. In addition, surface cracks allow the solution to penetrate deeper, releasing “chunks” of Si-O chains up to thousands of single chains at greater depths. Once released into the solution, these polymers rapidly decompose into monomers, releasing silicic acid [41,44]. Most of the wollastonite crystals in these samples are nanoscale and their tiny particle size causes a rapid release of Ca and Si ions [45].
In the same corrosion environment, the corrosion depth of the second type of corrosion is approximately twice that of the first type. (Figure 13b and Figure 14b) According to the EDS analysis, the contents of network modifiers (Ca2+ and Mg2+) in the Ca-rich phase of the second type of corrosion are higher than those in the first type and more susceptible to erosion. The droplet-like Ca-rich phases are arranged in rows around the anorthite; the row is longer, about a few microns; the droplets around different anorthites can contact and bond with each other, so the corrosion can be directed to deeper glaze layers and is poorly correlated with the density of the anorthite. However, the first type of corrosion relies on the three-dimensional interconnected channels near the anorthite, and it is difficult for corrosion to occur inward in the sparse area of the anorthite. In addition, in the second type of corrosion, wollastonite crystallites are present in the Ca-rich phase. Due to the special chain structure, the silicon-oxygen skeleton is easily separated from the body and dissolved in the solution after Ca2+ leaching. The glassy Ca-rich phase has a network structure, and compared with wollastonite crystals, the Si-O skeleton has more difficulty leaving the body in an acidic environment, and corrosion is weaker. Therefore, the second type of corrosion is more likely to occur. A schematic diagram of the two types of corrosion is shown in Figure 15.
The chemical compositions of glazes R1 and R2 are similar, but the microstructure and appearance are different due to the different firing processes. Glaze R1, with a higher firing temperature and faster annealing rate, is dominated by the first type of corrosion. Glaze R2, with a lower firing temperature and slower annealing rate, is dominated by the second type of corrosion. The difference in microstructure results in a different degree of corrosion, with R2 being more corrosive than R1. The corrosion of the R2 glaze is deeper, but due to the growth of many diopsides on the surface of the R2 glaze, which increases the corrosion resistance of the glaze, the corrosion pit area on the surface of R2 is smaller than that of R1 in the two-dimensional glaze surface. Over the past 30 years, the acidification of the soil in the area where the site is located has increased, changing from weakly alkaline to acidic, and this acidification accelerates the ion exchange reaction of the Ca-rich phase in the glaze, especially for the dissolution of the wollastonite microcrystal in the glaze. Acidification of the environment has accelerated the destruction of Ru porcelain buried in the soil.
3.2.3. Change in Glaze Color
On the surface of sample R2, there were many yellow substances that were difficult to remove by mechanical methods. The optical microscope showed that the yellow substances had penetrated into the glaze along the cracks and voids created by corrosion. The SEM image showed iron-rich silicate mineral particles on the surface and in the cracks. (Figure 11e, Figure 12c and Figure 14e) These inorganic colloidal particles from the soil could easily enter the interior of the glaze layer through cracks and form hydrogen bonds with silanol groups formed by glaze hydrolysis and adsorbed in the glaze [46,47]. The increase in ion concentration in the local solution due to cations released from the corroding glaze could promote the aggregation of soil colloid particles [48,49].
Silicate structures consist of more or less connected (polymerized) SiO4 tetrahedra. The intensities of the Si-O stretching and bending modes at approximately 1000 and 500 cm−1, respectively, and the polymerization index (Ip = A500/A1000; A is the area under the Raman band) can provide information about the connectivity of the SiO4 polymer units [50]. The fitting and deconvolution of the Si-O stretching peaks at 1000 cm−1 on the cross-section and surface are shown in Figure 16. Raman peaks of stretching modes at approximately 820 cm−1, 950 cm−1, 1000 cm−1 and 1150 cm−1 have been reported in the literature for no, one, two, three and four bridging oxygen bonds, respectively (denoted by Q0 or isolated SiO4, Q1 or -SiO3, Q2 or =SiO2, Q3−4 or ≡SiO and SiO2) [51]. The “Raman” degree of polymerization could be extracted from the precise measurement of the above quantities, but due to the rather strong fluorescence-related baseline observed in the spectra of archaeological objects, independent measurement of the Q3 and Q4 components is difficult [52]. From the Raman spectroscopic analysis (Table 9), the Ip of R2 in the pristine glaze (cross-section) and in the corroded glaze (surface) are 0.99 and 0.59, respectively, indicating that the degree of aggregation in the corroded glaze is lower. The Q1 in the corroded glaze increases significantly and the Q3−4 decreases significantly, indicating that the amount of nonbridging oxygen increases, more silica-oxygen skeletons are hydrolyzed and broken, and the polycondensation reaction between silicic acid is difficult to occur. It is therefore hypothesized that the concentration of silicic acid at the reaction interface will be low and a large amount of silicic acid may be lost to solution or react with cations in the soil to form ferrous silicates [53,54,55]. All of the above physical and chemical effects can lead to the deposition of yellow contaminants on the glaze. In addition, the leaching of modified ions in the corroded glaze and the breaking of the silicon-oxygen skeleton may cause more hydrogen bonding on the corroded glaze surface, making it more hydrophilic. The contact angle test of pure water on the glaze surface shows that the contact angle of the R2 corroded area is 47.04° and the contact angle of the R2 uncorroded area is 65.92° (Figure S5), which is an indirect confirmation that the corroded area contains more fractured silicon-oxygen skeletons.
The three-dimensional interconnected Ca-rich phase and aligned Ca-rich droplets (including needle-like wollastonite microcrystals) surrounding the anorthite were dissolved in the solution. Some of the anorthites on the glaze surface are exfoliated, and as the corrosion progresses inward, the internal anorthite is exposed. The corrosion pits and a large amount of exposed anorthite on the surface provided more light-reflecting interfaces, which increased the scattering of these areas on the surface to show white. In addition, the glaze was unable to show the color of the amorphous photonic structure due to the destruction of the phase-separated structure on the surface. Fe ions are mostly concentrated in the Ca-rich phase, and the loss of the Ca-rich phase weakens the chemical coloring ability of the glaze. Therefore, overall, the altered area is whiter than the unaltered area.
4. Conclusions
This study thoroughly investigated the degradation morphology and mechanism of two pieces of Ru porcelain glazes with similar compositions but different microstructures in the same burial environment. The main findings are as follows.
In the phase separation structure, the Ca-rich phase corrodes preferentially. The Ca-rich phase that is linearly distributed (corrosion type 2) corrodes approximately twice as deep as the Ca-rich phase that is three-dimensionally interconnected (corrosion type 1). The precipitation of needle-like wollastonite microcrystals by droplet aggregation exacerbates glaze corrosion in an acidified soil environment.
Dissolution of the Ca-rich phase exposes many anorthites, providing many reflecting surfaces, and destroys the color of the amorphous photonic structure, which changes to give the glaze an overall white color. The Si-O skeleton in the glaze is broken, causing the corroded glaze to physiochemically interact with soil particles, allowing yellow contaminants to seep into the glaze.
Ru kiln porcelain has been buried in the soil for nearly a thousand years. The phase separation structure and wollastonite crystals in its glaze seriously reduce the corrosion resistance of the glaze. At the same time, the diopside and homogeneous glass matrix make the glaze highly resistant to corrosion. In producing modern corrosion-resistant ceramics, the formulation and firing process should be reasonably designed to avoid the formation of unstable phases in the glaze.
Supplementary Materials
The following supporting information can be downloaded at: https://www.mdpi.com/article/10.3390/coatings13061011/s1, Figure S1: The polished cross-section of R1 glaze. (a) Optical micrograph, (b–d) SEM images; Figure S2: Schematic diagram of the formation of annular pits on the glaze surface; Figure S3: Profile curves of corrosion pits in SEM images at the same magnification (80×): (a) R1 glaze, (b) R2 glaze; Figure S4: SEM images of the polished cross-section of the R2 glaze; Figure S5: Contact angle of R2 glaze surface; (a) obvious corrosion area; (b) no obvious corrosion region; Table S1: The microstructure of Ru porcelain glaze and body under an optical microscope; calculation process of droplet size with coherent interference; method of calculating the approximate area ratios of pits on a two-dimensional glaze surface; Table S2. EDS analysis results of the positions marked in Figure S1 (Wt%).
Author Contributions
Conceptualization, Q.M. and Z.L.; methodology, B.Z.; software, B.Z.; formal analysis, B.Z.; investigation, J.C. and Z.L.; resources, J.C.; writing—original draft preparation, B.Z.; writing—review and editing, Q.M. and Z.L. All authors have read and agreed to the published version of the manuscript.
Funding
This research received no external funding.
Institutional Review Board Statement
Not applicable.
Informed Consent Statement
Not applicable.
Data Availability Statement
Not applicable.
Acknowledgments
The authors would like to express their great gratitude to Yunpeng Wang from the Shandong Cultural Relics Conservation and Restoration Center, and Shuqiang Xu, Qi Jiang, from Shandong University for their help in experiment testing, and Yongdong Tong from the University of Science and Technology Beijing for revision of the manuscript.
Conflicts of Interest
The authors declare no conflict of interest.
References
- Wang, Z. In search of the true discoverer of the Ru kiln. Cult. Identif. Apprec. 2010, 3, 46–51. (In Chinese) [Google Scholar]
- Liu, Y. Qing Bo Za Zhi Notes; Zhonghua Book Company: Beijing, China, 1997; ISBN 9787101011364. (In Chinese) [Google Scholar]
- Tao, Z. Shuo Fu, 1st ed.; Xinhua Shu Dian: Beijing, China, 1986. (In Chinese) [Google Scholar]
- Wang, S. Kui Tian Wai Cheng, 1st ed.; Collection Series; Zhonghua Book Company: Beijing, China, 1985. (In Chinese) [Google Scholar]
- Zhao, Q.; Mao, B.; Zhao, W. Investigation and trial excavation of Ru Kiln in Qingliangsi, Baofen. Cult. Relics 1989, 11, 1–14+59+97–100. (In Chinese) [Google Scholar] [CrossRef]
- Guo, M.; Zhao, W.; Yu, H.; Jia, C.; Bo, M.; Y, Y.; Zhu, H. A brief report on the excavation of the Ru kiln site of Qingliangsi in Baofeng in 2000. Cult. Relics 2001, 11, 4–22. (In Chinese) [Google Scholar] [CrossRef]
- Ding, Y.; Li, H.; Sun, X.; Chen, T.; Miao, J. Scientific and technological exploration of Qingliangsi Ruguan kiln celadon glaze. China Cult. Relics Sci. Res. 2017, 4, 54–62. (In Chinese) [Google Scholar]
- Zhang, M.; Wang, C.; Jin, P.; Wei, S.; Xu, W.; Chen, D.; Wu, Z. A preliminary study on Fe valence of porcelain glaze by XAFS. Nucl. Technol. 2008, 9, 648–652. (In Chinese) [Google Scholar]
- Li, R.; Yang, L.; Li, G.; Zhao, W.; Gao, Z.; Xie, J.; Chen, J.; Zhang, B.; Sun, X.; Feng, S.; et al. Neutron activation analysis and Mössbauer spectroscopy research on coloring mechanism of Chinese Ru porcelain. Chin. Sci. Bull. 2002, 47, 1163–1166. [Google Scholar] [CrossRef]
- Chen, Y.; Bai, Y.; Wei, W. Analysis of structural effects on coloring mechanism of Ru celadon porcelain. Int. J. Ceram. Eng. Sci. 2020, 2, 177–186. [Google Scholar] [CrossRef]
- Li, W.; Li, J.; Deng, Z.; Wu, J.; Guo, J. Study on Ru ware glaze of the Northern Song dynasty: One of the earliest crystalline-phase separated glazes in ancient China. Ceram. Int. 2005, 31, 487–494. [Google Scholar] [CrossRef]
- Yang, Y.; Feng, M.; Ling, X.; Mao, Z.; Wang, C.; Sun, X.; Guo, M. Microstructural analysis of the color-generating mechanism in Ru ware, modern copies and its differentiation with Jun ware. J. Archaeol. Sci. 2005, 32, 301–310. [Google Scholar] [CrossRef]
- Doherty, C.J.; Ding, Y. Exploring a petrographic and geological approach to the study of Ru ware bodies. In Proceedings of the International Symposium on Science and Technology of Five Great Wares of the Song Dynasty, Beijing, China, 22 October 2015; Key Scientific Research Base of Ancient Ceramics, State Administration of Cultural Heritage (Palace Museum). Science Press: Beijing, China, 2016; pp. 3–11. [Google Scholar]
- Vandiver, P.B. Variability of Song Dynasty Green Glaze Technology Using Microstructure, Microcomposition and Thermal History to Compare Yaozhou, Jun, Ru, Yue, Longquan, Guan, and Korean Koryo Dynasty Materials and Practices. In Proceedings of the International Symposium on Science and Technology of Five Great Wares of the Song Dynasty, Beijing, China, 22 October 2015; Key Scientific Research Base of Ancient Ceramics, State Administration of Cultural Heritage (Palace Museum). Science Press: Beijing, China, 2016; pp. 391–432. [Google Scholar]
- Zhang, F.; Tao, G.; Ruan, M.; Yuan, H. Scientific study on glaze colours, surface textures, fish-scale crackles and etching spots of Ru Guan ware. In Proceedings of the International Symposium on Ancient Ceramic Science and Technology, Shanghai, China, 1–4 November 2002; Shanghai Institute of Ceramics, Chinese Academy of Sciences and Shanghai Research Society of Science and Technology of Ancient Ceramics. Shanghai Science and Technology Literature Press: Shanghai, China, 2002; pp. 194–200. (In Chinese). [Google Scholar]
- Jia, C.; Miao, J. Characteristic observation and mechanism analysis of ice cracking on glaze surface of Ru Guan ware tiles in Song Dynasty. South. Cult. Relics 2016, 2, 225–230. (In Chinese) [Google Scholar]
- Henan Institute of Cultural Relics and Archaeology; Baofeng Ru Kiln Museum. Dreamy Azure—The Latest Collection of Unearthed Porcelain in Baofeng Qingliangsi Ru Kiln; Elephant Press: Zhengzhou, China, 2017; ISBN 9787534795220. (In Chinese) [Google Scholar]
- The Palace Museum. Digital Photos of Ru Wares. Available online: https://www.dpm.org.cn/collection/ceramic/226762.html (accessed on 20 April 2023). (In Chinese).
- He, Y.; Li, W.; Xu, C.; Lu, X.; Sun, X. Degradation mechanism of the Ru wares unearthed from the Qingliangsi site in Henan, China. Ceram. Int. 2022, 48, 17131–17142. [Google Scholar] [CrossRef]
- Shi, P.; Wang, F.; Zhang, B.; Luo, H.; Zhu, J.; Fei, G. Study on the coloring mechanism of the Ru celadon glaze in the Northern Song Dynasty. Ceram. Int. 2020, 46, 23662–23668. [Google Scholar] [CrossRef]
- Ma, Q.; Xu, S.; Wang, J.; Yan, J. Integrated analysis of a black-glazed porcelain bowl in Tushan Kiln dated back to Song Dynasty, China. Mater. Chem. Phys. 2020, 242, 122213. [Google Scholar] [CrossRef]
- Chen, X.; Li, W.; Xu, C.; Lu, X. Angle dependence of Jian bowl color and its coloring mechanism. J. Eur. Ceram. Soc. 2022, 42, 693–706. [Google Scholar] [CrossRef]
- Kronberg, T.; Hupa, L. The impact of wollastonite and dolomite on chemical durability of matte fast-fired raw glazes. J. Eur. Ceram. Soc. 2020, 40, 3327–3337. [Google Scholar] [CrossRef]
- Fröberg, L.; Hupa, L.; Hupa, M. Corrosion of the crystalline phases of matte glazes in aqueous solutions. J. Eur. Ceram. Soc. 2009, 29, 7–14. [Google Scholar] [CrossRef]
- Fröberg, L.; Kronberg, T.; Törnblom, S.; Hupa, L. Chemical durability of glazed surfaces. J. Eur. Ceram. Soc. 2007, 27, 1811–1816. [Google Scholar] [CrossRef]
- Hupa, L.; Bergman, R.; Fröberg, L.; Vane-Tempest, S.; Hupa, M.; Kronberg, T.; Pesonen-Leinonen, E.; Sjöberg, A.M. Chemical resistance and cleanability of glazed surface. Surf. Sci. 2005, 584, 113–118. [Google Scholar] [CrossRef]
- Kronberg, T.; Hupa, L.; Fröberg, K. Durability of mat glazes in hydrochloric acid solutions. Key Eng. Mater. 2004, 264–268, 1565–1568. [Google Scholar] [CrossRef]
- Li, Z.; Ma, Y.; Ma, Q.; Chen, J.; Song, Y. New perspective on Jun glaze corrosion: Study on the corrosion of light greenish blue and reddish purple glazes from Juntai Kiln, Yuzhou, Henan, China. Herit. Sci. 2020, 8, 2. [Google Scholar] [CrossRef]
- Fröberg, L.; Kronberg, T.; Hupa, L.; Hupa, M. Influence of firing parameters on phase composition of raw glazes. J. Eur. Ceram. Soc. 2007, 27, 1671–1675. [Google Scholar] [CrossRef]
- Luo, H.; Li, J.; Gao, L. Classification criteria of calcium-based glazes in ancient Chinese porcelain and its application in the study of porcelain glazes. Bull. Chin. Ceram. Soc. 1995, 2, 50–53. (In Chinese) [Google Scholar] [CrossRef]
- Liu, S. Ceramic Mineral Raw Materials and Petrographic Analysis; Wuhan University of Technology Press: Wuhan, China, 2007; pp. 95–100. ISBN 9787562925132. (In Chinese) [Google Scholar]
- Mazurin, O.V.; Porai-Koshits, E.A. Phase Separation in Glass; North-Holland Physics Publishing: Amsterdam, The Netherlands, 1984; p. 140. [Google Scholar]
- Yin, H. Study on the Mechanism and Preparation Method of Structural Color. Ph.D. Thesis, Fudan University, Shanghai, China, 2008. (In Chinese). [Google Scholar]
- Palomar, T. Effect of Soil pH on the Degradation of Silicate Glasses. Int. J. Appl. Glass Sci. 2017, 8, 177–187. [Google Scholar] [CrossRef]
- Zhang, Y.; Li, L.; Wang, X.; Lu, J. Analysis of spatiotemporal variation characteristics of soil pH in Henan Province. Soil Bull. 2019, 50, 1091–1100. (In Chinese) [Google Scholar] [CrossRef]
- Han, Y.; Li, C.; Bian, C.; Li, S.; Wang, C.A. Porous anorthite ceramics with ultra-low thermal conductivity. J. Eur. Ceram. Soc. 2013, 33, 2573–2578. [Google Scholar] [CrossRef]
- Tian, K.V.; Mahmoud, M.Z.; Cozza, P.; Licoccia, S.; Fang, D.; Tommaso, D.D.; Chass, G.A.; Greaves, G.N. Periodic vs. molecular cluster approaches to resolving glass structure and properties: Anorthite a case study. J. Non-Cryst. Solids. 2016, 451, 138–145. [Google Scholar] [CrossRef]
- Sushko, P.V.; Shluger, A.L.; Toda, Y.; Hirano, M.; Hosono, H. Models of stoichiometric and oxygen-deficient surfaces of subnanoporous 12CaO·7Al2O3. Proc. R. Soc. A 2011, 467, 2066–2083. [Google Scholar] [CrossRef]
- Deer, W.A.; Howie, R.A.; Zussman, J. An Introduction to the Rock-Forming Minerals, 3rd ed.; Mineralogical Society of Great Britain and Ireland: London, UK, 2013; pp. 132–135. [Google Scholar]
- Tian, J. Silicate Crystal Chemistry; Wuhan University Press: Wuhan, China, 2010; pp. 105–108. ISBN 9787307076198. (In Chinese) [Google Scholar]
- Xie, Z.; Walther, J.V. Dissolution stoichiometry and adsorption of alkali and alkaline earth elements to the acid-reacted wollastonite surface at 25 °C. Geochim. Cosmochim. Acta 1994, 58, 2587–2598. [Google Scholar] [CrossRef]
- Weissbart, E.J.; Rimstidt, J.D. Wollastonite: Incongruent dissolution and leached layer formation. Geochim. Cosmochim. Acta 2000, 64, 4007–4016. [Google Scholar] [CrossRef]
- Casey, W.H.; Westrich, H.R.; Banfield, J.F.; Ferruzzi, G.; Arnold, G.W. Leaching and reconstruction at the surfaces of dissolving chain-silicate minerals. Nature 1993, 366, 253–256. [Google Scholar] [CrossRef]
- Kundu, T.K.; Hanumantha Rao, K.; Parker, S.C. Atomistic simulation of the surface structure of wollastonite. Chem. Phys. Lett. 2003, 377, 81–92. [Google Scholar] [CrossRef]
- Prabhakar, S.; Hanumantha Rao, K.; Forsling, W. Dissolution of wollastonite and its flotation and surface interactions with tallow-1,3-diaminopropane (duomeen T). Miner. Eng. 2005, 18, 691–700. [Google Scholar] [CrossRef]
- Huang, X.; Chen, M.; Yang, Q.; Zhu, Y.; Wang, K.; Fang, X.; Hu, D. Natural reinforcing effect of inorganic colloids on excavated ancient jades. J. Cult. Herit. 2020, 46, 52–60. [Google Scholar] [CrossRef]
- Sadri, B.; Pernitsky, D.; Sadrzadeh, M. Aggregation and deposition of colloidal particles: Effect of surface properties of collector beads. Colloid Surf. A 2017, 530, 46–52. [Google Scholar] [CrossRef]
- Gregory, J. Approximate expressions for retarded van der waals interaction. J. Colloid Interface Sci. 1981, 83, 138–145. [Google Scholar] [CrossRef]
- Goldberg, S.; Glaubig, R.A. Effect of saturating cation, pH, and aluminum and iron oxide on the flocculation of kaolinite and montmorillonite. Clay Clay Miner. 1987, 35, 220–227. [Google Scholar] [CrossRef]
- Colomban, P.; Paulsen, O. Non-destructive determination of the structure and composition of glazes by Raman spectroscopy. J. Am. Ceram. Soc. 2005, 88, 390–395. [Google Scholar] [CrossRef]
- Robinet, L.; Eremin, K.; Cobo del Arco, B.; Gibson, L.T. The use of Raman spectrometry to predict the stability of historic glasses. J. Raman Spectrosc. 2006, 37, 789–797. [Google Scholar] [CrossRef]
- Colomban, P. Polymerization degree and Raman identification of ancient glasses used for jewelry, ceramic enamels and mosaics. J. Non Cryst. Solids 2003, 323, 180–187. [Google Scholar] [CrossRef]
- Philippini, V.; Naveau, A.; Catalette, H.; Leclercq, S. Sorption of silicon on magnetite and other corrosion products of iron. J. Nucl. Mater. 2006, 348, 60–69. [Google Scholar] [CrossRef]
- Michelin, A.; Burger, E.; Rebiscoul, D.; Neff, D.; Bruguier, F.; Drouet, E.; Dillmann, P.; Gin, S. Silicate Glass Alteration Enhanced by Iron: Origin and Long-Term Implications. Environ. Sci. Technol. 2013, 47, 750–756. [Google Scholar] [CrossRef] [PubMed]
- Aréna, H.; Godon, N.; Rébiscoul, D.; Frugier, P.; Podor, R.; Garcès, E.; Cabie, M.; Mestre, J.-P. Impact of iron and magnesium on glass alteration: Characterization of the secondary phases and determination of their solubility constants. Appl. Geochem. 2017, 82, 119–133. [Google Scholar] [CrossRef]
Figure 1.
(a) Handed-down intacct Ru ware collected in the Palace Museum, China [18]; (b) Ru ware excavated at Qingliangsi kiln site (Zone IV), with severe glaze corrosion [6].

Figure 2.
Digital photos of Ru porcelain samples.

Figure 3.
R1 (a) and R2 (b) optical micrograph of glazed cross-section.

Figure 4.
SEM images of the polished cross-section of R1 (a,c,d): (c) is the phase separation structure away from the anorthite; (d) is the phase separation structure near the anorthite. The upper right corner is the two-dimensional fast Fourier transformation (2D-FFT) diagram of the phase separation structure. Raman spectrum of the cross-section of R1glaze (b).

Figure 5.
The region of the chemical composition of R1 and R2 glazes in the equilibrium phase diagram of SiO2-Al2O3-CaO [11].
Figure 5.
The region of the chemical composition of R1 and R2 glazes in the equilibrium phase diagram of SiO2-Al2O3-CaO [11].

Figure 6.
Column distribution of droplet size. (a) Away from the anorthite region; (b) Around the anorthite region.
Figure 6.
Column distribution of droplet size. (a) Away from the anorthite region; (b) Around the anorthite region.

Figure 7.
SEM images of the polished cross-section of R2 (a,c,d): small droplets are arranged in rows around columnar crystals (c), the continuous Ca−rich phase (d). Raman spectrum of the cross-section of R2 glaze (b).
Figure 7.
SEM images of the polished cross-section of R2 (a,c,d): small droplets are arranged in rows around columnar crystals (c), the continuous Ca−rich phase (d). Raman spectrum of the cross-section of R2 glaze (b).

Figure 8.
Chemical composition by TEM-EDS (a) and electron diffraction pattern (b) of droplets arranged in rows in R2 glaze.
Figure 8.
Chemical composition by TEM-EDS (a) and electron diffraction pattern (b) of droplets arranged in rows in R2 glaze.

Figure 9.
XRD of R1 and R2 glaze powder.

Figure 10.
(a) Reflectance spectrum of glaze surface; (b) CIE1931 chromaticity diagram of glaze surface.
Figure 10.
(a) Reflectance spectrum of glaze surface; (b) CIE1931 chromaticity diagram of glaze surface.

Figure 11.
R1 glaze surface. (a–c) Optical micrographs: (a) uncorroded glaze; (b,c) corroded glaze, with numerous white annular pits; (d–i) SEM images: corrosion pits around the anorthite; diopside was growing around the quartz, the glass was well preserved in this region; (j,k) Element mapping: high Al, Ca content in corrosion pits.


Figure 12.
R2 glaze surface. (a) Optical micrograph; (b–f) SEM images: The glaze is well preserved with a lot of diopsides (b); The glaze has some corrosion pits with residual anorthite in the pits (d); (g–i) Elemental mapping of Figure d: high Al in corrosion pits, high Mg in glaze surface, higher S in local region.


Figure 13.
The polished cross-section of R1 glaze. (a) Optical micrograph; (b–i) SEM images: corrosion of the three-dimensionally connected Ca-rich phase (d–g) and of the Ca-rich droplets that are distributed in rows (h,i).
Figure 13.
The polished cross-section of R1 glaze. (a) Optical micrograph; (b–i) SEM images: corrosion of the three-dimensionally connected Ca-rich phase (d–g) and of the Ca-rich droplets that are distributed in rows (h,i).


Figure 14.
The polished cross-section of R2 glaze. (a) Optical micrograph; (b–i) SEM images: corrosion of the three-dimensionally connected Ca-rich phase (d) and the Ca-rich droplets distributed in rows (e,f), as well as the needle-like wollastonite precipitated by droplet aggregation (i).
Figure 14.
The polished cross-section of R2 glaze. (a) Optical micrograph; (b–i) SEM images: corrosion of the three-dimensionally connected Ca-rich phase (d) and the Ca-rich droplets distributed in rows (e,f), as well as the needle-like wollastonite precipitated by droplet aggregation (i).

Figure 15.
Sketch of a Ru porcelain glaze cross-section. (a) The morphology of the phase separation structure and crystals in the pristine glaze. The left side shows the three-dimensional interconnected structure of the Ca-rich phase around the anorthite, and the right side shows the linear structure of the Ca-rich droplets around the anorthite. (b) shows the corrosion morphology of the glaze in the soil solution; the left side shows the first corrosion morphology, where the corrosion proceeds inward around the anorthite, and the right side shows the second corrosion morphology, where the corrosion proceeds in the direction of droplet extension. (c) shows the corrosion morphology after excavation; the second corrosion type is deeper, and soil particles are deposited in the glaze. (Note: The surrounding anorthite is a phase-separated structure, and the Si-rich phase is distributed around the Ca-rich phase, which is not marked in this drawing).

Figure 16.
Raman spectrum of R2 glaze and deconvolution and curve fitting of the spectra. (a) Cross-sections (pristine glaze); (b) Surfaces (corroded glaze).
Figure 16.
Raman spectrum of R2 glaze and deconvolution and curve fitting of the spectra. (a) Cross-sections (pristine glaze); (b) Surfaces (corroded glaze).


Table 1.
Chemical composition of Ru porcelain glaze (Wt%).
| Na2O | MgO | Al2O3 | SiO2 | P2O5 | K2O | CaO | TiO2 | MnO | Fe2O3 | b | ||
|---|---|---|---|---|---|---|---|---|---|---|---|---|
| Glaze | R1 | 0.8 | 2.2 | 16.4 | 59.5 | 0.4 | 3.2 | 15.2 | 0.2 | 0.1 | 1.9 | 0.88 |
| R2 | 0.5 | 2.0 | 16.3 | 60.3 | 0.4 | 3.6 | 14.7 | 0.2 | 0.2 | 1.9 | 0.87 | |
| Body | R1 | 0.2 | 0.6 | 29.1 | 64.2 | - | 1.3 | 1.4 | 1.2 | - | 2.0 | - |
| R2 | 0.2 | 0.7 | 27.3 | 65.7 | - | 1.5 | 1.6 | 1.2 | - | 1.9 | - |
Table 2.
EDS analysis results of the positions marked in Figure 4 (Wt%).
Table 2.
EDS analysis results of the positions marked in Figure 4 (Wt%).
| Na2O | MgO | Al2O3 | SiO2 | P2O5 | K2O | CaO | TiO2 | MnO | Fe2O3 | |
|---|---|---|---|---|---|---|---|---|---|---|
| EDS 1 | 1.0 | 1.1 | 28.5 | 50.3 | 0.0 | 0.9 | 17.4 | 0.1 | 0.1 | 0.6 |
| EDS 2 | 1.1 | 1.4 | 12.8 | 67.5 | 0.3 | 4.8 | 10.4 | 0.2 | 0.0 | 1.6 |
| EDS 3 | 0.5 | 2.5 | 11.0 | 62.7 | 0.7 | 3.0 | 16.7 | 0.4 | 0.1 | 2.5 |
Table 3.
EDS analysis results of the positions marked in Figure 7 (Wt%).
Table 3.
EDS analysis results of the positions marked in Figure 7 (Wt%).
| Na2O | MgO | Al2O3 | SiO2 | P2O5 | K2O | CaO | TiO2 | MnO | Fe2O3 | F | |
|---|---|---|---|---|---|---|---|---|---|---|---|
| EDS 1 | 0.2 | 13.8 | 8.0 | 53.1 | 0.3 | 1.3 | 21.7 | 0.2 | 0.2 | 1.3 | - |
| EDS 2 | 0.8 | 3.0 | 10.1 | 59.6 | 0.1 | 3.5 | 20.0 | 0.3 | 0.2 | 2.5 | |
| EDS 3 | 1.1 | 2.1 | 19.0 | 57.1 | 0.3 | 2.5 | 16.2 | 0.2 | 0.1 | 1.4 | - |
| EDS 4 | 0.8 | 3.3 | 12.4 | 56.6 | 0.4 | 2.4 | 21.0 | 0.1 | 0.2 | 2.8 | - |
| EDS 5 | 0.3 | 1.0 | 7.7 | 32.3 | 19.4 | 1.9 | 34.8 | 0.1 | 0.1 | 1.0 | 1.3 |
Table 4.
Dominant wavelength and colorimetric purity (saturation) of glaze surface.
| Regions | Dominant Wavelength (nm) | Chromaticity Coordinates | Saturation | |
|---|---|---|---|---|
| x | y | |||
| Outside surface of R1 | 496 | 0.31405 | 0.33556 | 0.064 |
| Inside surface of R1 | 502 | 0.32055 | 0.33736 | 0.041 |
| Outside surface of R2 | 513 | 0.32667 | 0.33865 | 0.020 |
| Inside surface of R2 | 516 | 0.32636 | 0.34339 | 0.022 |
Table 5.
EDS analysis results of the positions marked in Figure 11. (Wt%).
Table 5.
EDS analysis results of the positions marked in Figure 11. (Wt%).
| Na2O | MgO | Al2O3 | SiO2 | P2O5 | K2O | CaO | TiO2 | MnO | Fe2O3 | SO3 | |
|---|---|---|---|---|---|---|---|---|---|---|---|
| EDS 1 | 0.3 | 0.9 | 8.1 | 82.3 | 0.1 | 3.1 | 4.2 | 0.2 | - | 0.9 | - |
| EDS 2 | 0.3 | 11.7 | 9.0 | 54.1 | 0.3 | 1.3 | 20.7 | 0.2 | 0.2 | 2.3 | - |
| EDS 3 | 0.9 | 1.1 | 23.0 | 52.7 | 0.1 | 2.9 | 16.9 | 0.2 | - | 2.0 | - |
| EDS 4 | 1.0 | 1.1 | 12.2 | 27.8 | - | 1.5 | 5.7 | 0.2 | - | 50.4 | - |
| EDS 5 | 1.2 | 1.8 | 24.8 | 55.1 | 0.2 | 3.5 | 8.0 | 0.6 | 0.1 | 4.7 | - |
| EDS 6 | 0.6 | 1.3 | 19.7 | 59.8 | 0.2 | 3.6 | 12.9 | 0.2 | - | 1.6 | - |
| EDS 7 | 0.8 | 2.1 | 15.5 | 61.2 | 0.3 | 4.5 | 13.6 | 0.2 | - | 1.9 | - |
| EDS 8 | 0.7 | 2.1 | 15.5 | 62.3 | 0.5 | 4.2 | 12.6 | 0.3 | 0.1 | 1.9 | - |
| EDS 9 | 0.6 | 1.2 | 16.2 | 37.2 | 0.1 | 2.0 | 23.2 | 0.2 | - | 1.6 | 17.8 |
Table 6.
EDS analysis results of the positions marked in Figure 12 (Wt%).
Table 6.
EDS analysis results of the positions marked in Figure 12 (Wt%).
| Na2O | MgO | Al2O3 | SiO2 | K2O | CaO | TiO2 | Fe2O3 | Cl | SO3 | |
|---|---|---|---|---|---|---|---|---|---|---|
| EDS 1 | 0.5 | 3.1 | 9.4 | 37.5 | 4.5 | 42.7 | - | 1.9 | - | 0.5 |
| EDS 2 | 0.7 | 2.8 | 24.9 | 48.9 | 4.7 | 3.4 | 0.9 | 11.8 | 1.1 | 0.3 |
| EDS 3 | 1.1 | 1.0 | 23.2 | 54.9 | 5.0 | 13.5 | - | 1.3 | 0.2 | - |
| EDS 4 | 0.3 | 11.4 | 7.2 | 50.2 | 1.7 | 23.1 | - | 6.1 | - | - |
| EDS 5 | 0.8 | 1.0 | 4.8 | 13.0 | 1.4 | 35.4 | - | 0.5 | 0.1 | 42.6 |
Table 7.
EDS analysis results of the positions marked in Figure 13 (Wt%).
Table 7.
EDS analysis results of the positions marked in Figure 13 (Wt%).
| Na2O | MgO | Al2O3 | SiO2 | P2O5 | K2O | CaO | TiO2 | MnO | Fe2O3 | |
|---|---|---|---|---|---|---|---|---|---|---|
| EDS 1 | 0.6 | 1.3 | 13.7 | 69.6 | 0.3 | 3.7 | 9.3 | 0.1 | 0.0 | 1.5 |
| EDS 2 | 1.1 | 1.2 | 25.7 | 53.7 | 0.1 | 1.6 | 15.5 | 0.2 | 0.2 | 0.8 |
| EDS 3 | 0.8 | 2.9 | 11.1 | 59.6 | 0.1 | 3.7 | 18.9 | 0.3 | 0.2 | 2.5 |
| EDS 4 | 1.0 | 1.4 | 21.8 | 56.9 | 0.3 | 1.8 | 15.7 | 0.2 | 0.1 | 1.0 |
| EDS 5 | 0.9 | 0.6 | 14.1 | 65.1 | 0.8 | 6.1 | 10.9 | 0.3 | - | 1.2 |
Table 8.
EDS analysis results of the positions marked in Figure 14 (Wt%).
Table 8.
EDS analysis results of the positions marked in Figure 14 (Wt%).
| Na2O | MgO | Al2O3 | SiO2 | P2O5 | K2O | CaO | TiO2 | MnO | Fe2O3 | |
|---|---|---|---|---|---|---|---|---|---|---|
| EDS 1 | 0.6 | 0.7 | 15.5 | 68.4 | 0.2 | 3.9 | 9.7 | 0.2 | 0.1 | 0.8 |
| EDS 2 | 0.5 | 0.9 | 27.9 | 52.7 | 0.1 | 1.3 | 15.6 | - | - | 0.8 |
| EDS 3 | 1.2 | 1.3 | 17.9 | 37.4 | 0.7 | 1.6 | 10.0 | 0.1 | 0.6 | 29.3 |
| EDS 4 | 0.4 | 2.9 | 12.0 | 60.1 | 0.6 | 2.3 | 18.0 | 0.2 | 0.1 | 3.4 |
| EDS 5 | 0.5 | 1.8 | 14.0 | 65.9 | 0.4 | 4.6 | 11.0 | 0.2 | 0.1 | 1.7 |
| EDS 6 | 1.2 | 1.7 | 18.3 | 58.8 | 0.1 | 3.8 | 14.3 | 0.2 | 0.1 | 1.6 |
| EDS 7 | 0.7 | 1.3 | 15.0 | 66.6 | 0.2 | 4.3 | 10.2 | 0.3 | 0.1 | 1.4 |
| EDS 8 | 0.5 | 3.0 | 10.3 | 57.5 | 0.1 | 2.7 | 22.6 | 0.1 | 0.4 | 2.8 |
| EDS 9 | 0.5 | 1.6 | 15.0 | 64.6 | 0.5 | 4.0 | 11.8 | 0.3 | 0.1 | 1.6 |
Table 9.
The integral area ratios of the bending envelope to the stretching envelope in the Raman spectra of the cross-sections and surfaces (A500/A1000) and the peak positions and integral area ratios of each component (Qn) in the stretching envelope (AQn/A950).
Table 9.
The integral area ratios of the bending envelope to the stretching envelope in the Raman spectra of the cross-sections and surfaces (A500/A1000) and the peak positions and integral area ratios of each component (Qn) in the stretching envelope (AQn/A950).
| Regions | A500/A1000 | Parameters | Q0 | Q1 | Q2 | Q3−4 |
|---|---|---|---|---|---|---|
| cross-sections | 0.99 | Peak position | 825 | 952 | 1020 | 1124 |
| AQn/A1000 | 0.20 | 0.05 | 0.67 | 0.08 | ||
| surfaces | 0.59 | Peak position | 824 | 940 | 1018 | 1160 |
| AQn/A1000 | 0.21 | 0.50 | 0.26 | 0.02 |
Disclaimer/Publisher’s Note: The statements, opinions and data contained in all publications are solely those of the individual author(s) and contributor(s) and not of MDPI and/or the editor(s). MDPI and/or the editor(s) disclaim responsibility for any injury to people or property resulting from any ideas, methods, instructions or products referred to in the content. |
© 2023 by the authors. Licensee MDPI, Basel, Switzerland. This article is an open access article distributed under the terms and conditions of the Creative Commons Attribution (CC BY) license (https://creativecommons.org/licenses/by/4.0/).
Share and Cite
MDPI and ACS Style
Zhou, B.; Ma, Q.; Li, Z.; Chen, J. Corrosion Research on Ru Porcelain Glazes Excavated at Qingliangsi, Baofeng, China. Coatings 2023, 13, 1011. https://doi.org/10.3390/coatings13061011
AMA Style
Zhou B, Ma Q, Li Z, Chen J. Corrosion Research on Ru Porcelain Glazes Excavated at Qingliangsi, Baofeng, China. Coatings. 2023; 13(6):1011. https://doi.org/10.3390/coatings13061011
Chicago/Turabian StyleZhou, Benyuan, Qinglin Ma, Zhimin Li, and Jiachang Chen. 2023. "Corrosion Research on Ru Porcelain Glazes Excavated at Qingliangsi, Baofeng, China" Coatings 13, no. 6: 1011. https://doi.org/10.3390/coatings13061011
Note that from the first issue of 2016, this journal uses article numbers instead of page numbers. See further details here.