Abstract
In this paper, we examine the effect of a small amount of Sn, Sr and Ca on the hardening and the kinetic properties of Pb. Experimentally, we analyze the specific process from the structural hardening evolution to equilibrium of PbCaSrSn alloy occurring in two steps. In the first one, a discontinuous transformation hardening and a continuous precipitation take place. A lamellar discontinuous precipitation that occurs after aging, characterizes the second step. Theoretically, we study the aging and overaging kinetics of the alloy by using the two complimentary methods needed to calculate the apparent activation energies of the Pb0.058%Ca0.12%Sr1.09%Sn associated with the various transformations, characterizing its hardening at 20 and 80 °C. We show that activation energies of aging and overaging of Pb0.058%Ca0.12%Sr1.09%Sn alloy are 25 and 28 kJ/mole, respectively, which are four times lower than the self-diffusion energy of Pb. Moreover, the addition of Ca, Sr and Sn leads to an amplification of the maximum hardness from 5 ± 5% HV to 21 ± 5% HV and an acceleration of the transformation hardening process responsible for aging.
1. Introduction
Humanity’s energy consumption and the diversification of supply sources call for the rapid development of materials by making them more efficient in terms of mechanical and electrochemical properties. This is the case for the lead acid battery. The lead accumulator is the oldest and most used accumulator for energy storage, which is a recyclable storage medium characterized by low cost and with great maturity [1].
The two main elements of the accumulator are the metal grids and the active material (sulphates and lead oxides). The grid plays the role of mechanical support and an electron collector. The basic element of the acid battery grid is lead, which is very malleable and lacks hardness. This is why researchers have undertaken studies on alloys with improved mechanical properties. Research was then conducted on the creep resistance and corrosion of lead alloy in a sulfuric acid medium [2,3,4,5,6].
To improve the mechanical properties of the alloys one can use different methods of hardening, namely hardening via solid solution, strain or precipitation (structural hardening).
The elastic limit is reached when the applied stress field causes the dislocations to move irreversibly through the entire structure. If we want to increase this limit, we must make it more difficult for the dislocations to move, either by creating obstacles to their movements or by creating other dislocations. The following effects are deduced: (i) solid solution effect, (ii) effect of grain boundaries, (iii) effect of dislocations (hardening throughwork hardening) and (iv) effect of the precipitation of a second phase (structural hardening).
Precipitation is one of the best ways to increase the resistance of a material to plastic deformation. Indeed, the presence of very fine particles distributed inside the crystals leads to the formation of very effective obstacles to the movements of the dislocations. The crossing of a “line” of precipitates via dislocation can only be achieved by bending the dislocation between the particles.
Primary solid solutions are solutions that adjoin pure substances. They are of the same structure as the corresponding pure body (for example, the primary solid solutions of lead are face-centered cubic, like pure lead). This structure is very malleable, that is to say plastic. To increase its level of mechanical resistance, it is necessary to introduce the defects of small dimensions finely dispersed in this ductile phase. This can be achieved by precipitating a highly dispersed second phase into the matrix phase. For this, it is necessary to exceed the solubility limit of the solute in the lead matrix. This is the principle of structural hardening. This last one is the most widespread method to improve the performance of lead-based alloys systems, like Pb-Cd [7,8], Pb-Ca and Pb-Ca-Sn [9,10,11,12,13], Pb-Sr and Pb-Sr-Sn [14,15], Pb-Te [16,17], Pb-Ca-Sr [18], Pb-Ca-Sr-Sn [19], Pb-Cd-Sr [20,21] and Pb-Cd-Sr-Sn [22].
Among these alloys, Pb-Ca-Sr-Sn has good mechanical properties [19]. The structural hardening evolution to equilibrium of PbCaSrSn alloy occurs in two steps. At the first one, a discontinuous transformation hardening and a continuous precipitation take place. A lamellar discontinuous precipitation occurs after aging thus characterizing the second step.
To the best of our knowledge, the kinetics of aging and overaging of the PbCaSrSn have not been carried out on previous theoretical and experimental. So, the main objective of this paper is the study of aging and overaging kinetics using two complimentary methods, which are Johnson and Mehl and Burke’s method, needed to calculate the apparent activation energies of the Pb0.058%Ca0.12%Sr1.09%Sn alloy associated with its aging and overaging transformations at 20 and 80 °C.
In the first part, the alloy Pb0.058%Ca0.12%Sr1.09%Sn was prepared and the hardness was measured. In the second part, the different transformations were investigated using micrographic observation techniques. Then, the kinetics of aging and overaging were studied and analyzed with the apparent activation energies associated with various transformations. Finally, the relevant results were summarized in the conclusion.
2. Materials and Methods
2.1. Alloy Preparation
According to the composition diagram for the PbSr system, the eutectic has coordinates 324.5 °C and 0.42% Sr, and the maximum strontium solubility in the α-phase is 0.14% at the same temperature [23]. For the case of the PbCa system, the eutectic coordinates are 328 °C and 0.8% Ca [24]. At room temperature, the solubility of Ca in the α-phase is 0.01%. As is known from the phase diagram of the SrCa system, no defined compound can be formed. However, this diagram shows the presence of a total solid solution and an allotropic at temperatures ranging from 443 to 547 °C [25]. The phase diagram of the PbSn system [26] shows a wide range of solubility of tin in lead characterized by a eutectic level at 183 °C, and the composition of the eutectic liquid was 18.3% by weight of tin and at 2% Sn room temperature.
The Pb0.058%Ca0.12%Sr1.09%Sn alloy was prepared from pure metals: lead (99.99%) and tin (99.99%). The contributions of calcium and strontium were made, respectively, from mother alloys composed of Pb0,135%Ca and Pb1%Sr. To study the structural integrity of the gross casting alloys, elements were taken in appropriate proportions and then introduced into bulb silica of 8 mm in diameter, sealed under high vacuum and the mixture was brought to 500 °C. After fusion and complete cooling, the alloy and silica tube were soaked with water. The samples were studied directly or preserved in liquid nitrogen. For re-homogenization, the ingot was sawn into pieces, which were then polished via abrasion. Samples were introduced into bulb silica sealed under secondary vacuum. Both bulb and sample were maintained at a temperature of 280 °C for two hours (the estimated optimum duration of rehomogenization) and then soaked with water.
2.2. Hardness-Microhardness
The hardness tests were performed using the Vickers method, using a durometer Testwell under a load of 2 kgf. Each measurement represents the average of five maximum footprints distributed over a section corresponding to a diametral plane or perpendicular plane to the axis of the cylindrical sample. Sections were obtained through sawing, mechanical abrasion and then chemical polishing. It should be noted that the uncertainty of our hardness measurements is estimated at approximately ±5% HV. It is important to remember that empirical relation HV = 0.3 R (MPa) can be used to evaluate the tensile strength (R) of these alloys.
The microhardness tests were used to compare the hardness of the transformed and untransformed regions, provided that their surface was substantially greater than the diameter of the footprint. We proceeded as follows: First, the sample was chemically etched and polished several times to differentiate transformed regions from untransformed ones. Then, the sample was attached to the sample holder using a special adhesive that performed the operation in 10 s. Afterwards, we proceeded to the microhardness test. For unprocessed regions, footprints were used away from the last position of the forehead revealed during the last attack of the sample.
2.3. Micrographic Observation Techniques
Due to the mechanical preparation with an abrasive, a strain hardening on the surface occurs by inducing deformations of the surface of the sample and consequently a modification of the kinetic transformations, even inducing a recrystallization (Figure 1 and Figure 2). In Figure 2, the recrystallization shows a significant change in the kinetics of the transformations. For this reason, ductility and quick transformations of lead alloys have been taken into account by making some specific preparations (Schumacher and Bouton [27]; ASM, [28]; Mao el al. [29]; Scharfenberger et al. [30]; Borchers et al. [31]; Boulahrouf, [32]; Bouirden, [9]; Hilger and Boulahrouf [33]; Tsubakino [34,35,36]; Colmenero and Akune [37]; Rossi [38,39,40]):
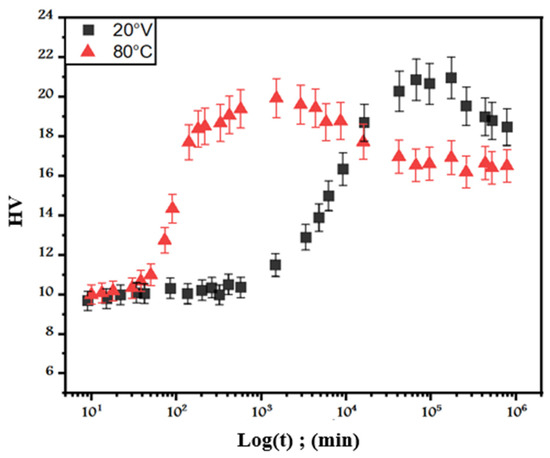
Figure 1.
Evolution of the hardness of Pb0.058%Ca0.12%Sr1.09%Sn as a function of time at 20 °C (red triangles) and 80 °C (black squares).
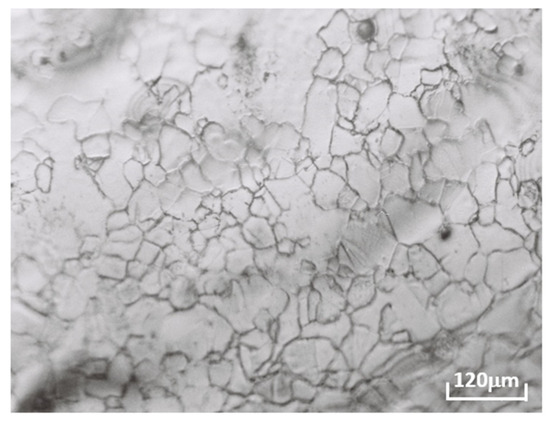
Figure 2.
The quenching structure of the as-cast Pb0.058%Ca0.12%Sr1.09Sn alloy.
- (1)
- At room temperature, a chemical polishing was used for aging and overaging samples whose evolutions are so slow;
- (2)
- During the preparation of freshly quenched samples, we used an electrochemical polishing at low temperature to avoid transformations
2.3.1. The Chemical Polishing
The procedure of chemical polishing consisted of prepolishing under water with sandpaper of grade 80 and further grade 800 to give a planed surface. The samples were not embedded to avoid the heating of resin hardening and to ensure good chemical polishing. The preparation was followed by chemical polishing of 3–5 min in a solution of 1/4 hydrogen peroxide H2O2 (30%) and 3/4 glacial acetic acid. Chemical polishing removed the strain-hardened surface of the sample but had the drawback of leaving a slight raised pattern on the surface. This chemical polishing was usually not sufficient to properly reveal the sample microstructure. An etching of 10–30 s had to be added with a solution of ammonium molybdate (100 g) and citric acid (250 g) in 1 L of water (chemical attacks) [33]. After each polishing and etching step, samples were successively washed with water and alcohol and dried. An etching treatment that was too long (more than 1 min) makes the aging structure disappear by revealing too much of the casting structure.
2.3.2. The Electrochemical Polishing
For freshly quenched samples, the transformations started in the first few seconds at room temperature with the displacement of discontinuous fronts of transformation. Only a preparation at low temperature enabled us to block the microstructure evolution during the preparation until metallographic observation. In practice, at temperatures of –50 °C, the rates of the transformations were low enough to not significantly affect the microstructure throughout the metallographic preparation. The need to keep the sample at low temperature and its softness made for the preparation of the electrochemical polishing at cold temperature, one of the best techniques to prepare fresh samples. The polishing was performed at –50 °C and was followed by etching. This technique was widely used by Hilger and Boulahrouf [33] as well as Boulahrouf [32] and Bouirden, [9]. The polishing cell was made up of a cup of 100 mm in diameter with the sample as an anode in the middle and a sheet of stainless steel as a cathode. The electrolyte was composed of five percent of perchloric acid diluted in ethanol and was maintained at –50 °C in an alcohol bath. A voltage of 30 to 40 V and a current density of 0.3 to 0.6 A cm−2 were used for polishing. Under these conditions, a polishing of 45 min removed 0.1 mm of material and made the stripes of the initial mechanical polishing completely disappear and produced a planed and shiny surface. During polishing, the electrolyte was stirred by a helix to avoid local heating of the sample.
3. Results
3.1. Study of Hardness
We start our study with the hardness evolution of the Pb0.058%Ca0.12%Sr1.09%Sn as-cast alloy as a function of time during an isothermal hold at 20 and 80 °C [21], as shown in Figure 1. The initial hardness was about 9 ± 5% HV; this value is higher than that of pure lead (~5 ± 5% HV) [33,41]. At 20 °C after quenching, we did not notice any variation in hardness during the first 10 h. After this incubation period, the alloy then began to harden so that the hardness then peaked at approximately 20 ± 5% HV after a month and a half of maintenance at 20 °C. Beyond 4 months, the hardness began to decrease to reach 18 ± 5% HV after a year and a half of maintenance at this temperature. This softening was caused by the overaging of this alloy.
At 80 °C, the kinetics of transformation are faster, and the maximum hardness obtained is of about 21 ± 5% HV. Beyond 24 h, overaging occurs, and the hardness decreases significantly to a peak of 16 ± 5% HV after 2 months.
3.2. Kinetic Study of Aging Reaction
The optical microscopy observations using an OLYMPUS BH2 UMA type optical microscope of the quenching structure of the Pb0.058%Ca0.12%Sr1.09%Sn alloy as-cast shows a solidification structure, which is manifested by the appearance of a foundry dendritic structure with strong segregation at the grain boundaries at the time of solidification (Figure 2).
The optical microscope was used to follow the quenched structure evolution of the Pb0.058%Ca0.12%Sr1.09%Sn as-cast alloy (see Figure 3). As shown in Figure 3a,b, at the beginning of the alloy’s aging, we observed that the supersaturated matrix was not homogeneous, which can be explained by the movement of grain boundaries that characterizes the discontinuous transformation of aging (Figure 3b).
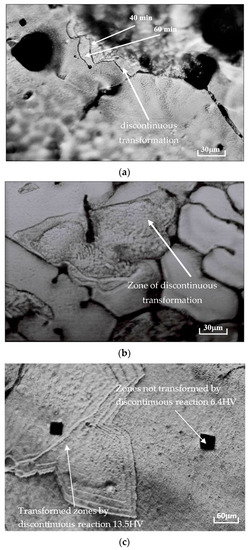
Figure 3.
(a) Structure evolution at 80 °C of Pb0.058%Ca0.12%Sr1.09%Sn after quenching; grain boundaries movement are observed after successive chemical attack 40 and 60 min after quenching. (b) Aging after 7 days of quench at 20 °C of Pb0.058%Ca0.12%Sr1.09%Sn; visualization of the discontinuous transformation. (c) Visualization of footprints of microhardness performed on the crude casting Pb0.058%Ca0.12%Sr1.09%Sn alloy. Aged for 50 min at 80 °C.
Figure 3a shows the displacement of the fronts of transformation, observed by using the HILGER technique [33], of the alloy Pb0.058%Ca0.12%Sr1.09%Sn maintained at 80 °C, after successive attacks for 40 and 60 min after quenching.
In addition, microscopic observations and testing of microhardness are consistent with hardness measurements (Figure 1). Aging is ensured by a discontinuous transformation. Microhardness testing performed on this alloy in areas transformed by the discontinuous transformation and those not transformed show that they are less hardened, about 6.3 ± 5% HV (Figure 3c).
Decomposition of the supersaturated matrix through heating is complex. For each transformation, we assumed that the transformed volume can be represented by a mathematical law and that the isothermal kinetics are independent. Many reactions obey the relationship:
This reduces to the Johnson–Mehl law [42,43]:
where x = volume transformed in time t.
Considering the experimental curves HV = f(t), for the first discontinuous transformation we can write:
where HV(0), HV(t) and HV(ꝏ) =HV(f) are the original, current and final hardness values, respectively.
From Figure 1, it can be observed that the values of the original and final hardness are HV(0) = 9.7 ± 5% HV and HV(f)= HVmax = 20.96 ± 5% HV, respectively, via the aging reaction.
Figure 4 represents the variation in Log(−Log(1−x)) as a function of Log(t−τ), where τ represents the start times of the transformation. From Figure 1, it can be noted that τ corresponds to 84 and 18 min for 20 and 80 °C, respectively.
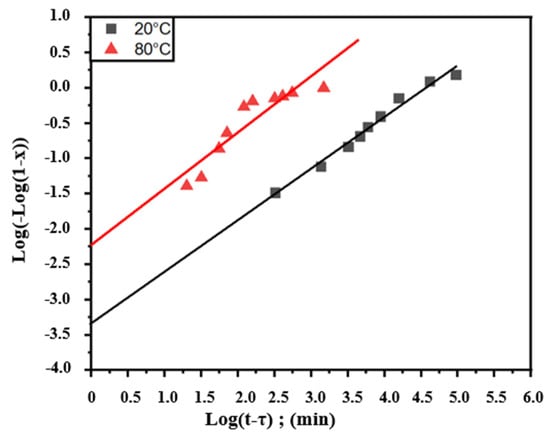
Figure 4.
Representation of Log(−Log(1−x)) as a function of Log(t−τ) relative to the aging transformation of Pb0.058%Ca0.12%Sr1.09%Sn as-cast alloy studied through isothermal hardness.
Figure 4 shows that the points form straight lines and the progress of this reaction is in conformity with the Johnson–Mehl–Avrami Equations (4) and (5) [42,43]:
Through Equation (4) from Johnson and Mehl, the exponents n and K coefficients for the two lines shown in Figure 4 were calculated and given in Table 1.

Table 1.
Johnson–Mehl–Avrami coefficients at 20 and 80 °C during aging of Pb0.058%Ca0.12%Sr1.09%Sn.
It is assumed that coefficient k varies according to the Arrhenius law of Equations (6) and (7):
From two values of this coefficient regarding temperatures of 20 and 80 °C as summarized in Table 1, characterizing the kinetics of the transformation during aging in the case of the crude casting alloy Pb0.058%Ca0.12%Sr1.09%Sn quenched with water, Equation (8) was used to obtain an apparent activation energy Q associated with this reaction, which is close to 25.81 kJ/mol.
Subsequently, Burke’s method was used to verify whether the activation energy depended or not on the degree of advancement x [42]. The principle of this method is to measure the time tx for different precipitation rates x and then to plot the curves Log(tx) as a function of 1000/T as shown in Figure 5. The slopes of these lines are roughly parallel for the different values of x and gives an apparent activation energy Q, whose values are reported in Table 2. The obtained results are in good agreement with the obtained value 25.81 kJ/mol of the activation energy given by Equation (8) for Burke’s method [42].
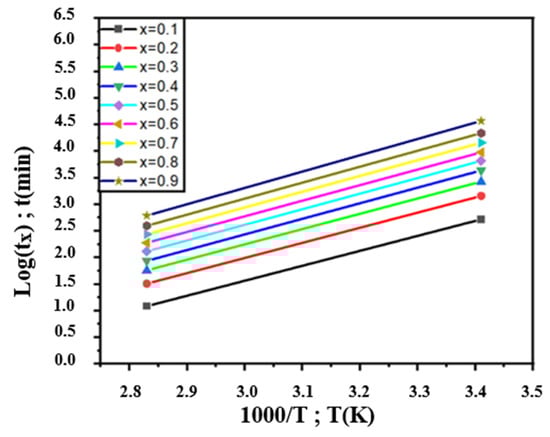
Figure 5.
Variation in Log(tx) as function of 1000/T relative to the aging transformation of as-cast alloy Pb0.058%Ca0.12%Sr1.09%Sn.
Table 2.
The apparent activation energy Q of Pb0.058%Ca0.12%Sr1.09%Sn quenched as-cast alloy for different degrees of advancement characterizing aging.
This activation energy of the softening reaction is about four times lower than the self-diffusion energy of lead, which is around 104.6 KJ/mol [44]. Those values show the ease of having the hardening discontinuous transformation in Pb0.058%Ca0.12%Sr1.09%Sn.
In other words, the addition of Ca, Sr and Sn amplifies the hardness from 5 ± 5% HV to 21 ± 5% HV and accelerates the transformation hardening process responsible for aging.
3.3. Kinetic Study of Overaging Reaction
After the aging of the as-cast Pb0.058%Ca0.12%Sr1.09%Sn, overaging occurs as shown in Figure 1, since the hardness decreases from 20.96% to 16.41 ± 5% HV. The metallographic observations using scanning electron microscopy after aging for 9 months at 20 °C (Figure 6) show that the matrix is the site of lamellar precipitation, which starts at the grain boundaries.
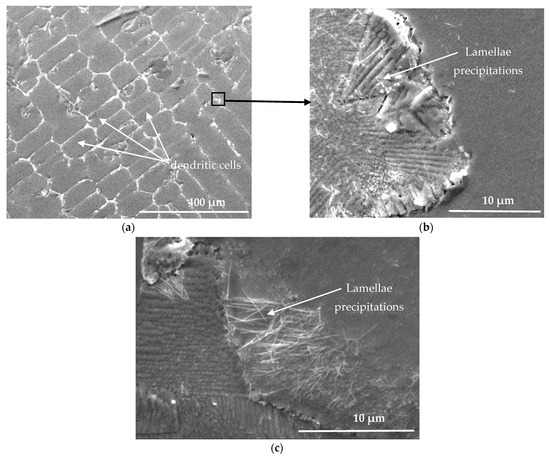
Figure 6.
Scanning electron microscopy of alloy Pb0.058%Ca0.12%Sr1.09%Sn microstructure after aging at 20 °C temperature for 9 months at different magnifications (a) at 400 μm; (b) at 10 μm. (c) lamellar texture located near grain boundary.
Microhardness testing (Figure 7) performed on this alloy in areas transformed by the precipitates lamellars (about 13 ± 5% HV) and those non-transformed show that they are more hardened (about 18 ± 5% HV) and confirm that they are the seat of the continuous reaction.
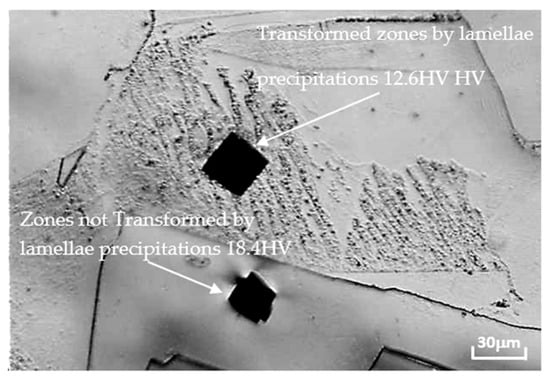
Figure 7.
Visualization of the microhardness impressions performed on the Pb0.058%Ca0.12%Sr1.09%Sn alloy. Aged 70 days at 80 °C.
The analyses carried out via EDAX on precipitates lamellars characterizing overaging show that these precipitates are due to the simultaneous presence of Pb, Sr and Sn (not traces of calcium), which shows that calcium segregates in the center while strontium and tin segregate at the grain boundaries in accordance with the work of RAND 2002 [45] in the case of PbCaSn alloys (see Figure 8).
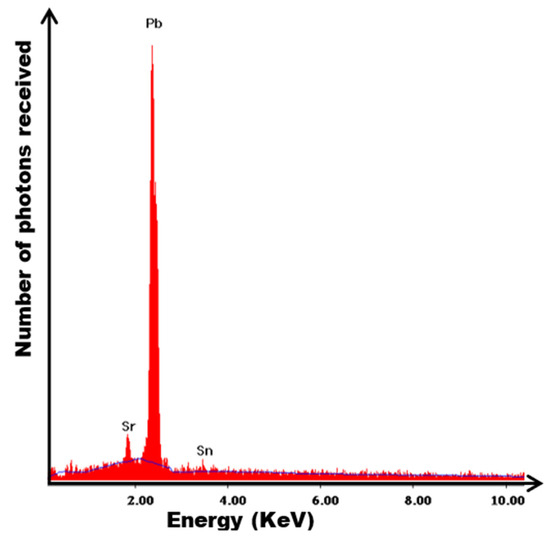
Figure 8.
Local energy-dispersion spectra for alloy Pb0.058%Ca0.12%Sr1.09%Sn of the lamellar texture close to a grain boundary.
Once the origin of the overaging step was established, we studied the degree of advancement of this reaction. The calculation of the degree of advancement (x) of discontinuous lamellar precipitation of overaging softening can be obtained by replacing the values of original HV(0) = 20.96 ± 5% HV and final hardness HV(f) = HVmin = 16.41 ± 5% HV (Figure 1) in Equation (3).
By using the obtained values of x, we can plot the variation in Log(−Log(1−x)) as a function of Log(t−τ) in Figure 9, where τ is 172933 min and 1507 min, representing the start times of the over aging transformation for temperatures 20 and 80 °C (Figure 1), respectively. Figure 9 shows that for each temperature, the points are placed on straight lines, which is in conformity with the Johnson–Mehl–Avrami equation.
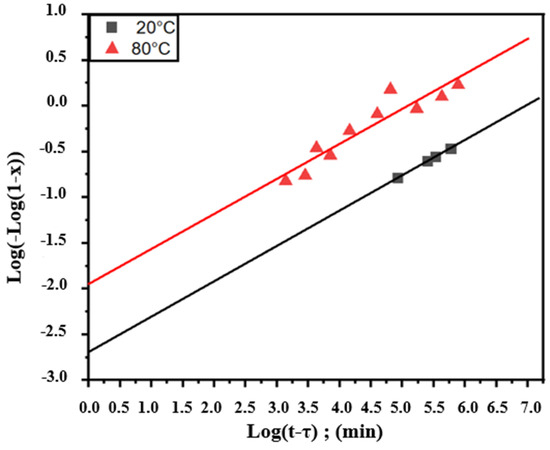
Figure 9.
Log(−Log(1−x)) as a function of Log(t−τ) relative to the overaging transformation of Pb0.058%Ca0.12%Sr1.09%Sn as-cast alloy studied through isothermal hardness variations.
Table 3 provides the values of the exponent n calculated from the slopes of the straight lines shown in Figure 9 and the rate constants K for different temperatures. The value of n is close to 0.38 for both temperatures, 20 and 80 °C. According to the calculation method represented by Equation (8), it can be said that the alloy transformations require a value of 28.59 kJ/mol, which is the apparent activation energy of the overaging transformation.
Table 3.
Coefficients of the equation of Johnson–Mehl–Avrami at different temperatures during overaging of the as-cast crude casting alloy of Pb0.058%Ca0.12%Sr1.09%Sn.
To ensure this result, we used the Burke method. For that, Figure 10 shows the Log(tx) variation for different degrees of advancement values (x = 0.1, 0.2, 0.3, 0.4, 0.5, 0.6, 0.7, 0.8 and 0.9) as a function of 1000/T. The straights are almost parallel, which gives almost constant energies as shown in Table 4 (≈28 kJ/mol).
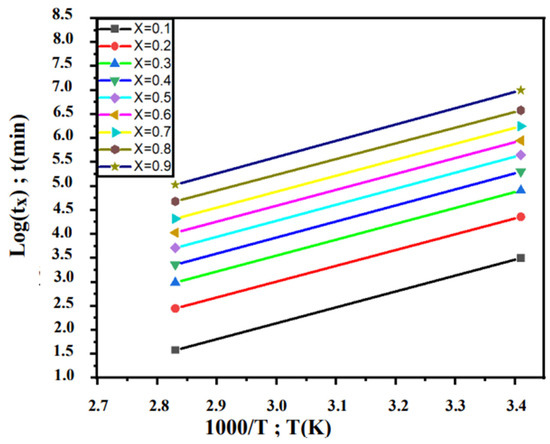
Figure 10.
Variation in Log(tx) as function of 1000/T relative to the overaging transformation of Pb0.058%Ca0.12%Sr1.09%Sn as-cast alloy.
Table 4.
The apparent activation energies of overaging transformation of Pb0.058%Ca0.12%Sr1.09%Sn quenched as-cast alloy for different advancement degrees x.
4. Conclusions
The as-cast sample of the Pb0.058%Ca0.12%Sr1.09%Sn alloy presents a dendritic sub-structure with segregation in the sub-boundaries at the time of solidification.
The aging mechanism of Pb0.058%Ca0.12%Sr1.09%Sn supersaturated alloys proceeds via a discontinuous reaction and was detected vis hardness measurement and optical microscopy. After aging, overaging occurs, characterized by a drop in hardness. It is observable through electron microscopy that it corresponds to a discontinuous transformation of reprecipitation of a lamellar phase located near grain boundaries. Qualitative microanalyses through EDAX on several lamellar precipitates show the simultaneous presence of lead, strontium and tin. All the mechanisms are thermally activated.
The activation energies of strengthening (aging) and weakening (overaging) of alloy Pb0.058%Ca0.12%Sr1.09%Sn are 25 and 28 kJ/mole, respectively. By comparing those values with lead auto-diffusion, which is 104 kJ/mol, it can be said that the reactions are isokinetic and the addition of Ca, Sr and Sn amplifies the hardness from 5 ± 5% HV to 21 ± 5% HV and accelerates the transformation hardening process responsible for aging. In the case of overaging transformation, there is the formation of precipitates enriched in strontium and tin near to the grain boundary, which must be taken into account during the analysis of the battery condition.
Author Contributions
Conceptualization, Y.A.Y. and E.Z.; methodology, Y.A.Y.; formal analysis, Y.A.Y. and M.L.; writing—original draft preparation, Y.A.Y.; writing—review and editing, Y.A.Y., M.L., N.L. and M.S.; visualization, E.S.; supervision, Y.A.Y. All authors have read and agreed to the published version of the manuscript.
Funding
This research received no external funding.
Institutional Review Board Statement
Not applicable.
Informed Consent Statement
Not applicable.
Data Availability Statement
All data is in the manuscript.
Conflicts of Interest
The authors declare no conflict of interest.
References
- Kirchev, A.; Serra, L.; Dumenil, S.; Brichard, G.; Alias, M.; Jammet, B.; Vinit, L. Carbon honeycomb grids for advanced lead-acid batteries. Part III: Technology scale-up. J. Power Sources 2015, 299, 324–333. [Google Scholar] [CrossRef]
- Xiang, J.; Hu, C.; Chen, L.; Zhang, D.; Ding, P.; Chen, D.; Liu, H.; Chen, J.; Wu, X.; Lai, X. Enhanced performance of Zn(II)-doped lead-acid batteries with electrochemical active carbon in negative mass. J. Power Sources 2016, 328, 8–14. [Google Scholar] [CrossRef]
- White, C.; Deveau, J.; Swan, L.-G. Evolution of internal resistance during formation of flooded lead-acid batteries. J. Power Sources 2016, 327, 160–170. [Google Scholar] [CrossRef]
- Moseley, P.-T.; Rand, D.-A.-J.; Peters, K. Enhancing the performance of lead–acid batteries with carbon–In pursuit of an understanding. J. Power Sources 2015, 295, 268–274. [Google Scholar] [CrossRef]
- Yao, L.; Xi, Y.; Xi, G.; Feng, Y. Synthesis of cobalt ferrite with enhanced magnetostriction properties by the sol-gel-hydrothermal route using spent Li-ion battery. J. Alloys Comp. 2016, 680, 73–79. [Google Scholar] [CrossRef]
- Pino, M.; Herranz, D.; Chacón, J. Carbon treated commercial aluminum alloys as anodes for aluminum-air batteries in sodium chloride electrolyte. J. Power Sources 2016, 326, 296–302. [Google Scholar] [CrossRef]
- Hilali, E.; Bouirden, L.; Hilger, J.-P. Structural hardening of lead-cadmium alloys for battery’s grids. Ann. De Chim. Sci. Des Matériaux 1999, 24, 135–143. [Google Scholar] [CrossRef]
- Hilali, E.; Bouirden, L.; Hilger, J.-P. Structural hardening of lead-cadmium-tin alloys for battery’s grids. Ann. De Chim. Sci. Des Matériaux 2000, 25, 1–9. [Google Scholar] [CrossRef]
- Bouirden, L. Transformations Continues et Discontinues dans les Alliages de Plomb Microallies au Calcium et au Calcium Etain pour Batteries’ D’accumulateurs. Influence de la Vitesse de Refroidissement. Role des Impuretes Argent, Aluminium et Bismuth. Ph.D. Thesis, University of Nancy, Nancy, France, 1990. [Google Scholar]
- Bouirden, L.; Hilger, J.-P.; Hertz, J. Discontinuous and continuous hardening processes in calcium and calcium—Tin micro-alloyed lead: Influence of ‘secondary-lead’ impurities. J. Power Sources 1991, 33, 27–50. [Google Scholar] [CrossRef]
- Hilger, J.-P.; Bouirden, L. New representation of the hardening processes of lead alloys by transformation-time-temperature (TTT) diagrams. J. Alloys Compd. 1996, 236, 224–228. [Google Scholar] [CrossRef]
- Rossi, F.; Rossi, F.; Lambertin, M.; Delfaut-Durut, L.; Maitre, A.; Vilasi, M. Ageing and overageing of lead–calcium alloys. J. Microsc. 2009, 236 Pt 3, 219–235. [Google Scholar] [CrossRef] [PubMed]
- Furukawa, J.; Nehyo, Y.; Shiga, S. Development of new positive-grid alloy and its application to long-life batteries for automotive industry. J. Power Sources 2004, 133, 25–31. [Google Scholar] [CrossRef]
- Nabli, H.; Hilger, J.-P. Annales de Chimie. Sci. Des Matériaux 1996, 21, 33–47. [Google Scholar]
- Nabli, H. Study of the Mechanisms of Structural Hardening of Lead-Strontium and Lead-Cadmium-Strontium-tin Alloys for Battery Grids. Ph.D. Thesis, Ibn Zohr University, Agadir, Morocco, 1997. [Google Scholar]
- Guo, W.-X.; Shua, D.; Chena, H.-Y.; Li, A.-J.; Wang, H.; Xiao, G.-M.; Dou, C.-L.; Peng, S.-G.; Wei, W.-W.; Zhang, W.; et al. Study on the structure and property of lead tellurium alloy as the positive grid of lead-acid batteries. J. Alloy. Compd. 2009, 475, 102–109. [Google Scholar] [CrossRef]
- Aguizir, A.; Zantalla, E.; Ait Yassine, Y.; Kidari, R.; Ait Amar, M.; Selhaoui, N.; Bouirden, L. Mécanismes de durcissement structural des alliages plomb-Tellure. Ann. De Chim. Sci. Des Matériaux 2011, 36, 99–110. [Google Scholar] [CrossRef]
- Zantalla, E.; Ait Yassine, Y.; Aguizir, A.; Selhaoui, N.; Bouirden, L. Influence des additions mineures du strontium sur le durcissement structural des alliages plomb-calcium pour les grilles de batterie. Ann. De Chim. Sci. Des Matériaux 2009, 34, 297–311. [Google Scholar] [CrossRef]
- Zantalla, E.; Ait Yassine, Y.; Aguizir, A.; Kidari, R.; Selhaoui, N.; Bouirden, L. Influence des additions mineures de l’étain sur le durcissement structural des alliages plomb-calcium-strontium pour les grilles de batterie. Ann. De Chim. Sci. Des Matériaux 2011, 36, 177–192. [Google Scholar] [CrossRef]
- Yassine, Y.A.; Zantalla, E.; Azzaoui, K.; Jodeh, S.; Aguizir, A.; Saissi, S.; Lamhamdi, A.; Errich, A.; Hamed, O.; Saad, E.; et al. Eutectic Morphology in Alloy Pb–3.2% Cd–0.08% Sr for Battery Grids. Met. Sci. Heat Treat. 2018, 60, 407–410. [Google Scholar] [CrossRef]
- Ait Yassine, Y.; Zantalla, E.; Aguizir, A.; Selhaoui, N.; Bouirden, L. Mécanismes de durcissement structural des alliages plomb-cadmium-strontium pour les grilles de batterie. Ann. De Chim. Sci. Des Matériaux 2009, 34, 85–98. [Google Scholar] [CrossRef]
- Ait Yassine, Y.; Saissi, S.; Zantalla, E.; Aguizir, A.; Saad, E.; Ibnlfassi, A.; Zerrouk, L.; Selhaoui, N.; Bouirden, L. Mécanismes de durcissement structural des alliages plomb-cadmium-strontium-étain pour grilles de batterie. Metall. Res. Technol. 2017, 114, 1–9. [Google Scholar] [CrossRef]
- Marshall, D.; Chang, Y.-A. Constitution of the lead-tin-strontium system up to 36 atomic percent Sr. Metall. Trans. A 1984, 15, 43. [Google Scholar] [CrossRef]
- Cartigny, Y.; Fiorani, J.-M.; Maître, A.; Vilasi, M. Thermodynamic assessment of Ca-Pb system. Thermochim. Acta 2004, 414, 197–202. [Google Scholar] [CrossRef]
- Masalski, T.B. Binary Alloys Phase Diagrams, 2nd ed.; ASM International: Metals Park, OH, USA, 1990. [Google Scholar]
- Karakaya, I.; Thompson, W.-T. The PbSn system. Bull. Alloys Phase Diagr. 1987, 8, 326–334. [Google Scholar] [CrossRef]
- Schumacher, E.-E.; Bouton, G.-M. Age hardening lead-calcium alloys. Met. Alloys 1930, 1, 405–409. [Google Scholar]
- George, F.; Vander, V. American Society for Metals (ASM) ASM Handbook ume 09: Metallography and Microstructures, 8th ed.; ASM Materials Park: Novelty, OH, USA, 1973; pp. 415–423. [Google Scholar]
- Mao, G.-W.; Sc, B.; Larson, J.-G.; Rao, P. Recent results on lead-calcium alloys as grid materials for lead acid batteries. J. Electrochem. Soc. 1973, 120, 11–17. [Google Scholar] [CrossRef]
- Scharfenberger, W.; Borchers, H.; Henkel, S. Zum entmis chungsverhalten unverformter blei-kalzium legierungen bei raumtemperaturlagerung. Z. Fur Met. 1973, 64, 478–483. [Google Scholar]
- Borchers, H.; Scharfenberger, W.; Henkel, S. Uber die Beeinflussung des Ausscheidungsverhaltens von Blei-KalziumLegierungen durch Auslagertemperatur und Verformung. Z. Fur Met. 1975, 66, 111–118. [Google Scholar]
- Boulahrouf, A. Etude des Alliages de Plomb-Calcium Faiblement Allies en Calcium Destines à la Fabrication des Grilles D’accumulateurs de la Nouvelle Génération. Ph.D. Thesis, University of Nancy I, Nancy, France, 1989. [Google Scholar]
- Hilger, J.-P.; Boulahrouf, A. Observation of the first stages of discontinuous transformation in Pb-Ca alloys used for lead batteries. Mater. Charact. 1990, 24, 159–167. [Google Scholar] [CrossRef]
- Tsubakino, H.; Nozato, R.; Satoh, Y. Study on precipitation in a Pb−0.04%Ca alloy. Z. Fur Met. 1990, 81, 490–495. [Google Scholar]
- Tsubakino, H.; Nozato, R.; Yamamoto, A. Precipitation in Pb-Ca binary alloys. Z. Fur Met. 1993, 84, 29–32. [Google Scholar] [CrossRef]
- Tsubakino, H.; Yamamoto, A.; Nozato, R. High-resolution electron microscopy of lead and lead-calcium alloys. Mater. Charact. 1993, 30, 217–220. [Google Scholar] [CrossRef]
- Colmenero, J.C.; Akune, K. Precipitation in an as-cast Pb-0.04% Ca alloy. Mater. Charact. 1993, 30, 45–53. [Google Scholar] [CrossRef]
- Rossi, F. Etude et Comprehension des Mecanismes de Vieillissement des Alliages de Plomb-Calcium. Ph.D. Thesis, Arts et Metiers ParisTech, Paris, France, 2006. [Google Scholar]
- Rossi, F.; Lambertin, M.; Delfaut-Durut, L.; Maitre, A.; Vilasi, M. Influence of the cooling rate on the ageing of lead−calcium alloys. J. Power Source 2008, 188, 416–458. [Google Scholar] [CrossRef]
- Rossi, F.; Lambertin, M.; Delfaut-Durut, L.; Maitre, A.; Vilasi, M. Determination of new Time-Temperature-Transformation diagrams for lead-calcium alloys. J. Power Source 2018, 185, 1465–1470. [Google Scholar] [CrossRef]
- Taylor, L.; Robert, F.M. Metals Handbook, 8th ed.; American Society for Metals: Detroit, MI, USA, 1973; Volume 7, pp. 297–304. [Google Scholar]
- Burke, J. The Kinetics of Phase Transformations in Metals; Pergamon Press: Oxford, UK, 1965. [Google Scholar]
- Austin, J.-B.; Rickett, R.-L. Kinetics of the decomposition of austenite at constant temperature. Trans. AIME 1939, 135, 296–415. [Google Scholar]
- Robert, C.W.; David, R.L. Handbook of Chemistry and Physics, 70th ed.; CRC Press: Cleveland, OH, USA, 1989. [Google Scholar]
- Rand, D.-A.-J.; Boden, D.-P.; Lakshmi, C.-S.; Nelson, R.-F.; Prengaman, R.-D. Manufacturing and operational issues with lead-acid batteries. J. Power Sources 2002, 107, 280–300. [Google Scholar] [CrossRef]
Disclaimer/Publisher’s Note: The statements, opinions and data contained in all publications are solely those of the individual author(s) and contributor(s) and not of MDPI and/or the editor(s). MDPI and/or the editor(s) disclaim responsibility for any injury to people or property resulting from any ideas, methods, instructions or products referred to in the content. |
© 2023 by the authors. Licensee MDPI, Basel, Switzerland. This article is an open access article distributed under the terms and conditions of the Creative Commons Attribution (CC BY) license (https://creativecommons.org/licenses/by/4.0/).