

Frictional Study on 30CrNi2MoVA Steel Based on Experiments and Finite Element Simulation: Wear Prediction

School of Mechanical Engineering and Automation, University of Science and Technology Liaoning, Anshan 114051, China
*
Authors to whom correspondence should be addressed.
†
These authors contributed equally to this work.
Coatings 2024, 14(3), 265; https://doi.org/10.3390/coatings14030265
Submission received: 14 January 2024
/
Revised: 5 February 2024
/
Accepted: 20 February 2024
/
Published: 22 February 2024
(This article belongs to the Special Issue Tribological Properties and Wear Protection of Coatings and Alloys)
Abstract
:30CrNi2MoVA steel demonstrates excellent performance, meeting the requirements of a crucial material for high-load structural parts. However, after experiencing high loads and thermal cycling, the material undergoes wear on its contact surfaces, resulting in a certain wear depth that determines its service life. Therefore, accurately predicting and evaluating the wear performance and wear depth of this material is of paramount importance. This study employs a combined approach of experimental and simulation methods. Initially, friction and wear tests were conducted to investigate the wear behavior of the 30CrNi2MoVA steel. The experimental results reveal a significant influence of thermal cycling temperature on the material’s wear resistance, with wear mechanisms primarily attributed to adhesive wear and abrasive wear. Subsequently, a ball-on-disc wear model was established. Based on experimental data, the modified Archard model was implemented as a user subroutine in finite element software (ABAQUS version 2020) to assess the material’s wear volume. The simulation results demonstrate a close agreement with the experimental wear depths. Furthermore, a fitting formula was developed to correlate the wear depth of the material with the number of wear cycles, enabling accurate wear depth prediction. This study provides theoretical support for enhancing the performance and extending the service life of 30CrNi2MoVA steel.
1. Introduction
With the increasing demand for material performance in engineering applications, research on the tribological properties of materials has become particularly important. Among them, 30CrNi2MoVA steel, as a low-alloy, high-strength steel, has been widely used in the mechanical, metallurgical, defense, and aerospace fields. This steel possesses high strength, excellent toughness, and fatigue strength [1], as well as remarkable wear and heat resistance, and it is commonly used in key high-load structural parts [2,3,4]. However, these structural components often operate under special conditions (high loads and high-temperature cycling environments), and the research on the material performance of these components under such conditions is still relatively limited. Therefore, studying the tribological behavior of the surfaces of these components is of particular importance. Additionally, the service life of the components is closely related to the wear depth. Therefore, predicting the wear depth through finite element analysis can provide valuable references for the service life of the components. Thus, this study has significant engineering value. In-depth research on the tribological behavior and wear depth of 30CrNi2MoVA steel structural components not only contributes to the optimization of component design and manufacturing but also enhances their performance and service life under special conditions.
The frictional performance of materials has always been a subject of great interest, and extensive tribological experiments on metallic materials have been conducted by previous researchers [5,6]. However, there is a lack of reports on the tribological characteristics of 30CrNi2MoVA steel. In order to understand the tribological behavior of the material, researchers conducted friction and wear tests to determine parameters such as friction coefficient and wear rate [7,8]. Additionally, surface topography analysis using relevant instruments was employed to investigate the mechanisms of frictional wear. Some experiments require a significant amount of human and material resources, and certain experimental conditions are difficult to reproduce in a laboratory environment, posing significant challenges to research in this field. With the development of friction theory and advancements in finite element software, some scholars utilized finite element analysis to study the frictional behavior of materials [9,10]. For example, Xue X [11] combined finite element software with the Archard equation to simulate microslip wear in involute splined couplings and established a predictive model for involute spline damage. Zabala B [12] compared the simulation model with experimental results and found a difference of less than 5%, thus verifying the reliability of the simulation. Many researchers adopted the modified Archard wear model in friction and wear simulations to predict various parameters [13,14,15,16,17,18]. For instance, Bortoleto E M [19] employed the linear Archard wear theory and finite element method (FEM) in pin-on-disc dry sliding tests. In their numerical simulations, they utilized adaptive mesh refinement to redraw the worn mesh and analyzed the stress distribution along the wear tracks and the changes in surface topography. Li C [20] conducted a simulation analysis of the wear process of HT200 using ANSYS 15.0 software and derived a formula for calculating wear depth based on the number of wear cycles. In response to the depth prediction method proposed by Li C and Bastola A [21], this study employs a combined approach using ABAQUS (version 2019) software and its subroutines to achieve a relatively accurate depth prediction for the 30CrNi2MoVA steel ball-disk model. Extensive research was conducted on metal wear tests, and the aforementioned literature provides valuable references for studying the tribological properties of 30CrNi2MoVA steel. Currently, there are limited data available on the frictional performance of 30CrNi2MoVA steel, particularly in terms of the integration of experimental testing and friction and wear simulation for this material, which lacks literature reports.
This study combines experimental testing and simulation to investigate the sliding wear behavior of 30CrNi2MoVA steel after thermal cycling treatment and predict the wear depth under different loads and thermal cycling temperatures. Initially, sliding wear tests were conducted to obtain the relevant parameters required for the simulation. Subsequently, the Archard wear model was modified and implemented into the UMESHMOTION user subroutine to calculate the wear depth. The validity of the simulation approach was confirmed by comparing the calculated results with experimental wear test data. Following that, a predictive model was developed to estimate the wear depth of 30CrNi2MoVA steel using a fitting formula. The developed finite element model can be utilized to predict the service life of the steel and assess wear conditions under various loads or thermal cycling temperatures, providing a method and supplement for investigating the friction behavior of this material. Additionally, this study establishes an important theoretical foundation for the integrated design, performance control, and engineering application of 30CrNi2MoVA steel-material systems.
2. Materials and Methods
2.1. Preparation of Materials and Dry Friction Test
2.1.1. Specimen
The substrate material used in the dry friction test is 30CrNi2MoVA steel, with Si3N4 ceramic as the mating material. Firstly, the substrate material is cut into a rectangular shape measuring 30 mm × 30 mm × 3 mm using a wire cutting machine, followed by sandpaper polishing. Next, the specimens are immersed in acetone solution for 10 min of ultrasonic cleaning, followed by immersion in anhydrous ethanol solution for another 10 min of ultrasonic cleaning to remove surface oil and other contaminants. Finally, the specimens are dried using an air dryer and prepared for further use.
The main chemical composition of 30CrNi2MoVA steel was measured using infrared absorption and inductively coupled plasma atomic emission spectroscopy methods [22], and the results are shown in Table 1. Due to the fact that the 30CrNi2MoVA steel used in key high-load structural components can experience temperatures of approximately 800 °C during actual operation [23,24,25], and these components undergo repeated thermal cycling, the specimens were subjected to thermal cycling treatment, with untreated specimens (without thermal cycling) taken as the control group. The treatment process was as follows: the specimens were placed in a resistance furnace (BLMT-1800A, Luoyang, China) under atmospheric conditions and heated to 400 °C and 800 °C, respectively, kept for 6 min, and then removed and cooled to room temperature in the air. They were then reinserted into the resistance furnace, heated, and kept for 6 min, repeating the cycle 10 times. The mechanical properties of the material after thermal cycling were measured using a tensile testing machine (CMT6502, Shanghai, China). Three replicates of the tensile tests were performed for each group to ensure accuracy and minimize errors. The results are presented in Table 2.
2.1.2. Dry Friction Test Equipment and Test Parameters
The friction and wear behavior of untreated specimens (not subjected to thermal cycling at 25 °C) under 10 N and 20 N loads was tested using a reciprocating friction and wear tester (HRT-A02, Jinan, China) (conforming to ASTM G133 standard) (as shown in Figure 1). Friction tests were also conducted on the specimens after thermal cycling under a 20 N load. The reciprocating friction distance was set at 15 mm, the sliding speed was 2 mm/s, and the friction test duration was 2 h. The contact mode was spherical contact, and the ambient temperature was room temperature. To minimize the influence of the ceramic ball on the friction behavior of the substrate, a 6 mm diameter Si3N4 ceramic was selected as the test sample, with Young’s modulus of 310,000 MPa, a Poisson’s ratio of 0.26, and a relatively high Vickers hardness.
For convenience of description, the specimens in the experiment were labeled as Ax, where the untreated sample under a 10 N load (10 N–25 °C) was labeled as A1, the untreated sample under a 20 N load (20 N–25 °C) was labeled as A2, the sample subjected to 400 °C thermal cycling under a 20 N load (20 N–400 °C) was labeled as A3, and the sample subjected to 800 °C thermal cycling under a 20 N load (20 N–800 °C) was labeled as A4.
2.1.3. Acquisition and Characterization of Test Results
Through wear tests, the coefficient of friction under dry sliding conditions can be obtained (calculated using the formula μ = F/P, where F represents the frictional force, and P denotes the applied load). Surface characteristics such as scratches and pits are observed using a scanning electron microscope (SEM, Zeiss ΣIGMA HD, Jena, Germany), while the chemical composition of the worn region is analyzed using an energy-dispersive spectrometer (SEM, Zeiss ΣIGMA HD). Wear rate serves as a crucial metric for assessing material wear resistance. In this experiment, the wear depth, wear width, and wear volume were measured using a stylus profilometer (Alpha-Step IQ, KLA Corporation, San Diego, CA, USA). To ensure consistency, the wear scar on the same sample was measured five times. During the measurement of wear depth, the maximum and minimum values were excluded, and the remaining three sets of data were averaged to obtain the average wear depth. Wear rate for the material was calculated using Equation (1) [26].
In the formula, the following apply: N represents the wear rate in mm3/N·m, V denotes the wear volume in mm3, F represents the load in N, and S represents the total wear distance in m.
2.2. Finite Element Simulation
2.2.1. Finite Element Simulation Modeling
This study employed the ABAQUS (version 2020) finite element software to establish a three-dimensional finite element model, as shown in Figure 2a. Taking into consideration that the oxide film on the material after thermal cycling is extremely thin and negligible compared to the wear depth (the proportion of the oxide layer relative to the wear scar is approximately 10%), the presence of the oxide film was disregarded when constructing the model. The upper friction pair used a Si3N4 hemisphere with a diameter of 6 mm, which has a high hardness and negligible wear; thus, it was set as a rigid body. The lower friction pair consisted of a 30CrNi2MoVA steel matrix with dimensions of 30 mm × 30 mm × 3 mm, and its elastic modulus and Poisson’s ratio are shown in Table 2. The sliding between Si3N4 and 30CrNi2MoVA was modeled using the Coulomb friction model, and the friction coefficient between the interference fit was determined by the average friction coefficient (Figure 5b). The tangential contact behavior was controlled by the penalty function contact algorithm. A load of 10 N and 20 N was applied to the RP1 point of the upper friction pair, with reciprocating motion along the Z-axis, while the remaining degrees of freedom were fixed. The bottom surface of the lower friction pair was completely fixed. The analysis was divided into loading and wear stages. In the analysis, Step 1 had a duration of 0.01 s, and Step 2 had a duration of 10 s in order to save computational time. To obtain accurate results for the contact pressure and relative sliding on the contact surfaces, Saint-Venant’s principle [27] was employed in this study. The region of mutual contact between the friction pairs was modeled using a dense mesh, while the areas far from the contact surfaces gradually transitioned to a sparse mesh. Therefore, the mesh was refined in the middle region of the matrix (as shown in Figure 2b) to reduce the finite element analysis time while maintaining computational accuracy. The entire model was meshed using hexahedral elements, and the eight-node reduced integration brick (C3D8R) element type was utilized.
2.2.2. Verification of the Model
Before conducting friction and wear simulations, the primary task is to validate the model by comparing the analytical solution based on the classical Hertz contact theory with the solution obtained from finite element simulations [28].
In the formula, p(x,y) represents the contact stress in megapascals (MPa) at the contact point (x,y), p0 represents the maximum contact stress in MPa, a represents the radius of the contact area in millimeters (mm), ν1 and ν2 are the Poisson’s ratios of the two materials, E1 and E2 are the elastic moduli of the two materials in MPa, and R1 and R2 are the radii of curvature of the two materials in mm. F represents the concentrated load in newtons (N).
Under a 10 N load, the contact stresses obtained from the finite element method (FEM) are compared with the Hertz contact stresses [30]. As shown in Figure 3, it can be observed that the maximum points of the FEM contact stresses and the Hertz contact stresses are close to each other, indicating the reasonableness of the mesh division.
2.2.3. UMESHMOTION Subroutine and ALE Adaptive Mesh
The ALE (Arbitrary Lagrangian–Eulerian) adaptive grid can improve the quality of the grid gradually and achieve the desired solution accuracy by solving a single analysis step when analyzing the displacement field of a structure. In the wear simulation analysis, ALE is responsible for adjusting the morphology of the post-wear contact surface. The implementation steps for dividing the adaptive grid include the Sweeping and Advection processes. In the ball–disc wear model presented in this paper, ALE acts on the contact wear surface and calculates the wear amount using the UMESHMOTION subroutine [31,32,33,34,35]. After each incremental step of stress update, the ALE algorithm is applied to the elements within the ALE scope. It adjusts the nodal displacements based on the wear condition of the boundary nodes and then redivides the grid within the ALE scope to avoid grid distortion, which could lead to calculation issues.
2.2.4. Modified Archard Wear Model
The Archard theory [36] is a classical tribology theory that describes the phenomenon of wear when solid surfaces come into contact. However, the classical Archard model is not suitable for simulating the specific wear depth of an individual contact point. In order to accurately simulate the wear behavior within a specific wear region, it is necessary to modify the Archard model. Therefore, in this paper, it is necessary to modify the Archard model and incorporate the modified version into the UMESHMOTION subroutine to simulate the frictional wear process of materials using ALE adaptive mesh technology (as shown in Figure 2b). The formula is as follows:
In the formula, V represents the volume of wear in cubic meters (m3), W represents the load N, s represents the sliding distance in meters (m), H represents the material hardness in Newtons per square meter (N/m2), and k is the wear factor.
Transform the above formula:
In the formula, A is the actual contact area m2, and h is the wear depth m.
Substitute the contact stress () into the above formula:
In practice, the amount of wear is generally accumulated over time. The time is derived, the speed is , and is brought into the above formula. Finally, the deformed Archard formula is obtained:
In the finite element method, the process of wear can be divided into n incremental steps. For the j-th incremental step, the displacement increment Δsi,j of node i can be calculated using ABAQUS (version 2020).
In the equation, si,j and si,j−1, respectively, represent the displacement of node i in the previous j and previous (j − 1) incremental steps.
Incorporating a cyclic leap factor (Δn) into this model allows for higher computational speed while maintaining accuracy. The Archard model can be modified as follows:
The flowchart depicted in Figure 4 illustrates the process of wear simulation. The calculations are repeated until the number of wear cycles exceeds the predetermined value, indicating the completion of the wear simulation.
3. Results and Discussion
3.1. Dry Friction Characteristics
As shown in Figure 5a, the friction coefficient (COF) variation over time during the contact between Si3N4 and 30CrNi2MoVA steel was obtained from the friction and wear testing machine. After the friction coefficient curve entered the stable stage, the average value of the friction coefficient in this stage represented the friction characteristics of the material (Figure 5b). According to Figure 5b, the average COF for A1 was approximately 0.533, A2 was approximately 0.621, A3 was approximately 0.5969, and A4 was approximately 0.5748. These values were used in the finite element simulation. With the increase in thermal cycling temperature, the friction coefficients of A2, A3, and A4 specimens showed a decreasing trend. This is because the thermal cycling and oxidation temperature caused the formation of an oxide film on the material surface, which decreased the contact between the friction pairs and, hence, reduced the friction coefficient [25]. In summary, an increase in load led to an increase in the friction coefficient, while an increase in thermal cycling temperature caused a decrease in the friction coefficient.
The contour curve of the wear region on the substrate was measured using a stylus profilometer (Figure 5c) to obtain the wear profile, and the wear rate was calculated accordingly (Figure 5d). Figure 5c indicates that under dry sliding conditions, as the number of wear cycles increased, the wear profile of the A1 specimen exhibited a relatively uniform pattern. The wear profile of the A2 specimen displayed a “V” shape, which may be attributed to the accumulation of debris in the central region during face-contact wear, altering the stress distribution. This resulted in higher stresses in the central region, leading to deformation [37]. The contour profile of sample A3 exhibits slight protrusions on both sides, similar to the contour profile of sample A4, which are attributed to material accumulation. When the load increased from 10 N to 20 N, the wear depth of the untreated specimen increased from 1.51 × 10⁻³ mm to 5.38 × 10⁻³ mm, indicating that the load increase had an influence on the wear profile depth. Under the same load, A2, A3, and A4 exhibited a trend of greater wear depth with increasing thermal cycling temperature. The maximum wear depth for A3 was 8.13 × 10⁻³ mm, and for A4, it was 1.16 × 10⁻² mm. This is primarily due to the increase in temperature, which reduces the material’s elastic modulus (as shown in Table 2) and consequently decreases its wear resistance [38,39]. Figure 5d demonstrates that the wear rate exhibits a significant exponential increase with the increment of the applied load. Additionally, the wear rate shows a relatively slower increase with the rise in thermal cycling temperature. SEM and EDS analysis are required to understand the wear mechanisms and surface morphology of the material.
Figure 6 presents the SEM and EDS analysis of the effects of load and thermal cycling on the wear behavior of specimens A1, A2, A3, and A4 under dry sliding conditions. Figure 6a shows the scanning electron microscope (SEM) image of specimen A1, revealing a relatively smooth wear surface with minor scratches. Some regions in the wear area exhibit parallel grooves aligned with the direction of friction and sporadic small protrusions, indicating the presence of abrasive wear mechanisms. Fatigue cracks and delamination phenomena are observed around the wear path due to the reciprocating mechanical motion caused by the elevated surface temperature. The energy-dispersive spectroscopy (EDS) spectrum (Figure 6b) displays high concentrations of iron (Fe) and oxygen (O) elements, indicating the formation of oxides due to the increased surface temperature.
Figure 6c shows the SEM image of specimen A2, which exhibits more severe wear compared to the 10 N load. The wear surface displays pronounced grooves, and the compression, crack formation, and delamination of the material are observed under applied load [40,41]. The EDS spectrum (Figure 6d) suggests the presence of a surface oxide film resulting from prolonged friction in the air.
Figure 6e displays the SEM image of specimen A3, revealing accumulated debris on both sides of the wear area and dispersed debris along the wear path. Local magnification shows adhesion phenomena caused by the pressing of abrasive particles into the surface due to load and friction heating [42]. Surface damage and delamination occur due to interactions between the small protrusions on the surface. The EDS spectrum (Figure 6f) indicates the oxidation of the metal and the formation of oxide products.
Figure 6g shows the SEM image of specimen A4, displaying oxides adhering to the substrate. Secondary grinding occurs due to the inability to remove detached material in a timely fashion. The EDS spectrum (Figure 6h) exhibits relatively high concentrations of iron (Fe) and oxygen (O) elements attributed to the oxidation process. It can be concluded that the wear mechanisms after thermal cycling include abrasive wear, adhesive wear, and oxidation wear.
3.2. Wear Depth Simulation Prediction
There are two methods to verify the accuracy of friction and wear simulations [43]. The first method is to use wear depth as a validation criterion, while the second method is to use wear volume as a validation criterion. In this study, to avoid secondary deviations in calculating wear volume, wear depth was chosen as the sole scale to validate the reliability of the simulations. Figure 7 illustrates the schematic of the ball–disc wear results. Observations show that the wear width of A2 is significantly larger than that of A1, which is consistent with the experimental results. As the number of wear cycles increases, the wear width also increases, following the Hertz contact formula. From the wear displacement contour maps in the top left corners of Figure 7a,b, it can be seen that the wear depth of A1 reaches 0.001803 mm, while that of A2 reaches 0.004474 mm. With an increase in load, the wear depth increases, indicating a greater amount of wear, which is consistent with the experimental results. Figure 7c,d shows that the wear depths of A3 and A4 reach 0.007637 mm and 0.009583 mm, respectively. As the thermal cycling temperature increases, the wear depth increases, following a similar trend as observed in the experiments.
Figure 8 shows the experimental and simulated wear profile curves under different loads and thermal cycling conditions. The results indicate that the trend of the wear profiles is similar in both the experiments and simulations, validating the feasibility of the simulations. The maximum error in wear depth between the experimental and simulated results for A1 is 20.7%, 16.8% for A2, 6.06% for A3, and 17.39% for A4. All four sets of data have errors below 25%. The presence of wear errors may be attributed to other operating conditions, such as abrasive wear during the experiments and system errors. In comparison, the simulations were conducted under ideal conditions. In the calculation process, the finite element method (FEM) obtains global results by averaging the results for each node. Additionally, the Archard formula is used to adjust the position of each node, and ALE adaptive mesh is used for node displacement, resulting in an idealized simulation result. The symmetrical state of the simulated profile curves demonstrates the idealization of the simulation.
Figure 9 depicts the fitted curve of the evolution of the maximum wear depth of the selected model with respect to the number of cycles. From the graph, it can be observed that the four curves exhibit nonlinear variations, with an increase in wear depth accompanying an increase in load and temperature. As the number of cycles increases, the trend of wear depth enlargement gradually slows down. A higher curvature slope indicates a faster wear rate, in accordance with Archard’s formula. By fitting a formula to this curve, it is possible to predict the wear depth [44].
Formula (13) represents the fitted curve equation for the relationship between the maximum wear depth and the number of wear cycles in ball–disc friction. Table 3 contains the numerical values used in the fitted equation.
In the equation, h represents the wear depth in millimeters (mm); x denotes the number of friction cycles; and h0, A0, and t are constants.
The fitted values obtained from Table 4 are basically consistent with the experimental values. The calculation formula can provide a prediction for the value after 960 times. The wear depth is affected by many aspects, and this paper also provides an idea for the performance prediction of the material.
In summary, with the increase in thermal cycling temperature, the 30CrNi2MoVA steel undergoes severe oxidation on the surface. Additionally, under the influence of applied loads, surface damage is exacerbated, resulting in the formation of numerous pits and grooves. Particularly, at 800 °C, the steel exhibits extremely severe wear, a phenomenon that was verified through both experimental and simulation studies. The application of a fitting equation derived from simulations enables the prediction of the steel’s service life. These findings provide experimental and theoretical foundations for understanding the frictional wear performance and lifespan of the 30CrNi2MoVA steel surface.
4. Conclusions
This paper employs a combined approach of experimental and simulation methods to analyze the tribological behavior of 30CrNi2MoVA steel under different loads and temperatures. Furthermore, the wear depth is predicted using finite element analysis. Based on the results, the following conclusions can be drawn:
- 1.
- Under dry friction conditions, an increase in load accelerates material loss, with the wear mechanism being abrasive wear. An increase in thermal cycling temperature reduces the friction coefficient but increases the wear depth, with the wear mechanisms being adhesive wear and abrasive wear. The increase in load and temperature will amplify the damage to the material.
- 2.
- Wear simulation is implemented using a modified Archard wear model, along with the UMESHMOTION subroutine in ABAQUS (version 2020) software and ALE adaptive mesh technology. A method and workflow for finite element simulation of ball–disc friction–wear are proposed.
- 3.
- A comparative study between simulated wear data and experimental wear data validates the feasibility of the simulation and provides support for predicting wear depth profiles.
- 4.
- A process function was derived from the simulation results to fit the relationship between wear depth and the number of cycles. This function can be utilized for predicting the wear depth and the resulting surface profile after wear for 30CrNi2MoVA. Wear is influenced by multiple factors, and this study also provides an approach for predicting the service life of this steel. Moreover, this research serves as a reference for more intricate models of frictional wear.
Author Contributions
Investigation, A.W. and Y.L.; writing—original draft, A.W. and Y.L.; software, A.W. and L.F.; writing—review and editing, Y.F. and Z.X. All authors have read and agreed to the published version of the manuscript.
Funding
The work described in this paper is supported by the National Key Research and Development Program (2021YFB3702004).
Institutional Review Board Statement
Not applicable.
Informed Consent Statement
Not applicable.
Data Availability Statement
The data that were used are confidential.
Acknowledgments
We sincerely thank the University of Science and Technology Liaoning.
Conflicts of Interest
The authors declare no conflicts of interest.
References
- Liu, D.; Shen, Y.; Wang, E.; Wang, H.; Liu, J.; Wang, K.; Sun, J. Improvement of the Mechanical Properties of 30CrNi2MoVA through Ultrasonic-Milling in Certain Key Components. Coatings 2023, 13, 1626. [Google Scholar] [CrossRef]
- Li, X.; Pan, C.; Fu, D.; Wang, M.; Zhang, Z.; Qu, S.; Yang, C. Fabrication of highly dissimilar TC4/steel joint with V/Cu composite transition layer by laser melting deposition. J. Alloys Compd. 2021, 862, 158319. [Google Scholar] [CrossRef]
- Zhang, S.; Zhou, S.; Li, M. Research on fatigue crack propagation process of fracturing pumphead. Eng. Fail. Anal. 2020, 116, 104726. [Google Scholar] [CrossRef]
- Wei, A.; Feng, Y.; Wu, L.; Li, Y.; Xie, Z. Corrosion wear behavior of 30CrNi2MoVA steel in simulated seawater. Mater. Lett. 2023, 349, 134750. [Google Scholar] [CrossRef]
- Liu, D.; Liu, D.; Zhang, X.; He, G.; Ma, A.; Wu, G. Plain fatigue and fretting fatigue behaviors of 17-4PH steel subjected to ultrasonic surface rolling process: A comparative study. Surf. Coat. Technol. 2020, 399, 126196. [Google Scholar] [CrossRef]
- Limmer, L.; Nowell, D.; Hills, D.A. A combined testing and modelling approach to the prediction of the fretting fatigue performance of splined shafts. Proc. Inst. Mech. Eng. Part G J. Aerosp. Eng. 2001, 215, 105–112. [Google Scholar] [CrossRef]
- Bijwe, J.; Indumathi, J.; Rajesh, J.J.; Fahim, M. Friction and wear behavior of polyetherimide composites in various wear modes. Wear 2001, 249, 715–726. [Google Scholar] [CrossRef]
- Wei, M.X.; Chen, K.M.; Wang, S.Q.; Cui, X.H. Analysis for wear behaviors of oxidative wear. Tribol. Lett. 2011, 42, 1–7. [Google Scholar] [CrossRef]
- Huang, T.-C.; Tsai, J.-W.; Liao, K.-C. Wear and leakage assessments of canted coil Spring–Energized polytetrafluoroethylene seals under Ultra-High cycle operations. Eng. Fail. Anal. 2022, 135, 106110. [Google Scholar] [CrossRef]
- Attanasio, A.; Ceretti, E.; Rizzuti, S.; Umbrello, D.; Micari, F. 3D finite element analysis of tool wear in machining. CIRP Ann. 2008, 57, 61–64. [Google Scholar] [CrossRef]
- Xue, X.; Li, Y.; Sui, L.; Yu, W.; Lin, K.; Liu, J. Mechanism and prediction method of fretting damage in involute spline couplings of aero-engine. Eng. Fail. Anal. 2023, 148, 107200. [Google Scholar] [CrossRef]
- Donner, R.; Potirakis, S.; Balasis, G.; Eftaxias, K.; Kurths, J. Friction and wear of a piston ring/cylinder liner at the top dead centre: Experimental study and modelling. Tribol. Int. 2017, 106, 23–33. [Google Scholar] [CrossRef]
- Tang, L.; Ding, S.; Qian, H.; Xie, Y.; Huo, Y. Fretting fatigue tests and crack initiation analysis on zircaloy tube specimens. Int. J. Fatigue 2014, 63, 154–161. [Google Scholar] [CrossRef]
- Lee, R.; Jou, J. Application of numerical simulation for wear analysis of warm forging die. J. Mater. Process. Technol. 2003, 140, 43–48. [Google Scholar] [CrossRef]
- Shen, X.; Liu, Y.; Cao, L.; Chen, X. Numerical simulation of sliding wear for self-lubricating spherical plain bearings. J. Mater. Res. Technol. 2012, 1, 8–12. [Google Scholar] [CrossRef]
- Molinari, J.; Ortiz, M.; Radovitzky, R.; Repetto, E. Finite-element modeling of dry sliding wear in metals. Eng. Comput. 2001, 18, 592–610. [Google Scholar] [CrossRef]
- Martínez-Londoño, J.C.; Martínez-Trinidad, J.; Hernández-Fernández, A.; García-León, R.A. Finite Element Analysis on AISI 316L Stainless Steel Exposed to Ball-on-Flat Dry Sliding Wear Test. Trans. Indian Inst. Met. 2023, 76, 97–106. [Google Scholar] [CrossRef]
- Xie, L.-J.; Schmidt, J.; Schmidt, C.; Biesinger, F. 2D FEM estimate of tool wear in turning operation. Wear 2005, 258, 1479–1490. [Google Scholar] [CrossRef]
- Bortoleto, E.; Rovani, A.; Seriacopi, V.; Profito, F.; Zachariadis, D.; Machado, I.; Sinatora, A.; Souza, R. Experimental and numerical analysis of dry contact in the pin on disc test. Wear 2013, 301, 19–26. [Google Scholar] [CrossRef]
- Li, C.; He, J.; Du, Y.; Xiao, W.; Wang, Z. Wear Model and Finite Element Analysis of Machine Tool Guide Based on Archard Model. J. Mech. Eng. 2016, 52, 106–113. [Google Scholar] [CrossRef]
- Bastola, A.; Stewart, D.; Dini, D. Three-dimensional finite element simulation and experimental validation of sliding wear. Wear 2022, 504, 204402. [Google Scholar] [CrossRef]
- Terashima, S. Determination of total carbon and sulfur in fifty-two geochemical reference samples by combustion and infrared absorption spectrometry. Geostand. Newsl. 1988, 12, 249–252. [Google Scholar] [CrossRef]
- Fan, W.; Gao, P. A review on erosion-reducing additive materials to extend the lifespan of gun barrels. J. Mater. Sci. 2021, 56, 19767–19790. [Google Scholar] [CrossRef]
- Susantez, C.; Caldeira, A.B. Heat Transfer Modelling and Simulation of a 120 mm Smoothbore Gun Barrel During Interior Ballistics. Def. Sci. J. 2022, 72, 30–39. [Google Scholar] [CrossRef]
- Wei, A.; Hu, J.; Li, Y.; Wang, S.; Feng, L.; Feng, Y.; Xie, Z. Friction behavior of 30CrNi2MoVA gun barrel steel after thermo-cyclic treatment: Air and simulated seawater. Eng. Fail. Anal. 2023, 157, 107948. [Google Scholar] [CrossRef]
- Lim, S.; Ashby, M.; Brunton, J. Wear-rate transitions and their relationship to wear mechanisms. Acta Metall. 1987, 35, 1343–1348. [Google Scholar] [CrossRef]
- Toupin, R.A. Saint-Venant’s principle. Arch. Ration. Mech. Anal. 1965, 18, 83–96. [Google Scholar] [CrossRef]
- Ma, L.; Eom, K.; Geringer, J.; Jun, T.-S.; Kim, K. Literature review on fretting wear and contact mechanics of tribological coatings. Coatings 2019, 9, 501. [Google Scholar] [CrossRef]
- McColl, I.R.; Ding, J.; Leen, S.B. Finite element simulation and experimental validation of fretting wear. Wear 2004, 256, 1114–1127. [Google Scholar] [CrossRef]
- Cai, M.; Zhang, P.; Xiong, Q.; Cai, Z.; Luo, S.; Gu, L.; Zeng, L. Finite element simulation of fretting wear behaviors under the ball-on-flat contact configuration. Tribol. Int. 2023, 177, 107930. [Google Scholar] [CrossRef]
- Bae, J.W.; Lee, C.Y.; Chai, Y.S. Three dimensional fretting wear analysis by finite element substructure method. Int. J. Precis. Eng. Manuf. 2009, 10, 63–69. [Google Scholar] [CrossRef]
- Wang, Y.; Pasiliao, C.L. Modeling ablation of laminated composites: A novel manual mesh moving finite element analysis procedure with ABAQUS. Int. J. Heat Mass Transf. 2018, 116, 306–313. [Google Scholar] [CrossRef]
- Jin, Y.; Zou, L.; Huang, J.; Jiang, X.; Guo, Z.; Xie, J.; Yuan, Z. Numerical research on ablation and wear of the artillery barrel based on UMESHMOTION user-defined subroutine. Eng. Rep. 2023, 5, e12575. [Google Scholar] [CrossRef]
- Zhang, C.-Z.; Shen, F.; Ke, L.-L. Electrical contact resistance endurance of AgNi10 alloys under fretting wear: Experiment and numerical prediction. Wear 2023, 530–531, 205009. [Google Scholar] [CrossRef]
- Wang, C.; Chen, J.; Xia, Z.C.; Ren, F. Die wear prediction by defining three-stage coefficient K for AHSS sheet metal forming process. Int. J. Adv. Manuf. Technol. 2013, 69, 797–803. [Google Scholar] [CrossRef]
- Donner, R.; Potirakis, S.; Balasis, G.; Eftaxias, K.; Kurths, J. Sliding wear analysis in borided AISI 316L steels. Mater. Lett. 2021, 285, 129138. [Google Scholar] [CrossRef]
- Yan, J.; Yan, Q.; Pan, J. Study on the electrochemical corrosion and surface friction-wear characteristics of GaN chips. Surf. Technol. 2023, 52, 208–222. [Google Scholar] [CrossRef]
- Li, W.; Kou, H.; Zhang, X.; Ma, J.; Li, Y.; Geng, P.; Wu, X.; Chen, L.; Fang, D. Temperature-dependent elastic modulus model for metallic bulk materials. Mech. Mater. 2019, 139, 103194. [Google Scholar] [CrossRef]
- Zheng, J.; Li, L.; Tian, L.; Fan, J. Influence of annealing temperature on fatigue damage evolution behavior of 304 stainless steel. Hot Work. Technol. 2024, 1–5. [Google Scholar] [CrossRef]
- Ding, H.; Yang, T.; Wang, W.; Zhu, Y.; Lin, Q.; Guo, J.; Xiao, Q.; Gan, L.; Liu, Q. Optimization and wear behaviors of 316L stainless steel laser cladding on rail material. Wear 2023, 523, 204830. [Google Scholar] [CrossRef]
- Shi, L.; Li, M.; Liu, Z.; Zhan, Z.; Yuan, Z.; Wang, X. Fabrication of yttria-stabilized zirconia/La2O3 composite coating by electrophoretic deposition to improve high-temperature oxidation resistance of stainless steel. Ceram. Int. 2023. [Google Scholar] [CrossRef]
- Wang, Y.-M.; Liang, Y.; Zhai, Y.-D.; Zhang, Y.-S.; Sun, H.; Liu, Z.-G.; Su, G.-Q. Study on the role of cryogenic treatment on corrosion and wear behaviors of high manganese austenitic steel. J. Mater. Res. Technol. 2023, 24, 5271–5285. [Google Scholar] [CrossRef]
- Xue, X.; Wang, S.; Yu, J.; Qin, L. Wear characteristics of the material specimen and method of predicting wear in floating spline couplings of aero-engine. Int. J. Aerosp. Eng. 2017, 2017, 1859167. [Google Scholar] [CrossRef]
- Huang, F.; He, W.; Xu, Y.; Xia, F.; Luo, X. Study on Wear of Polyurethane Bowl for Pipe Cleaner Based on Modified Archard Model. Plast. Ind. 2020, 48, 126–131. [Google Scholar] [CrossRef]
Figure 1.
Schematic diagram of the friction and wear experimental setup.

Figure 2.
Ball-disk friction and wear model and mesh generation: (a) Three-dimensional wear model, (b) ALE adaptive mesh.
Figure 2.
Ball-disk friction and wear model and mesh generation: (a) Three-dimensional wear model, (b) ALE adaptive mesh.

Figure 3.
Contact pressure distribution.
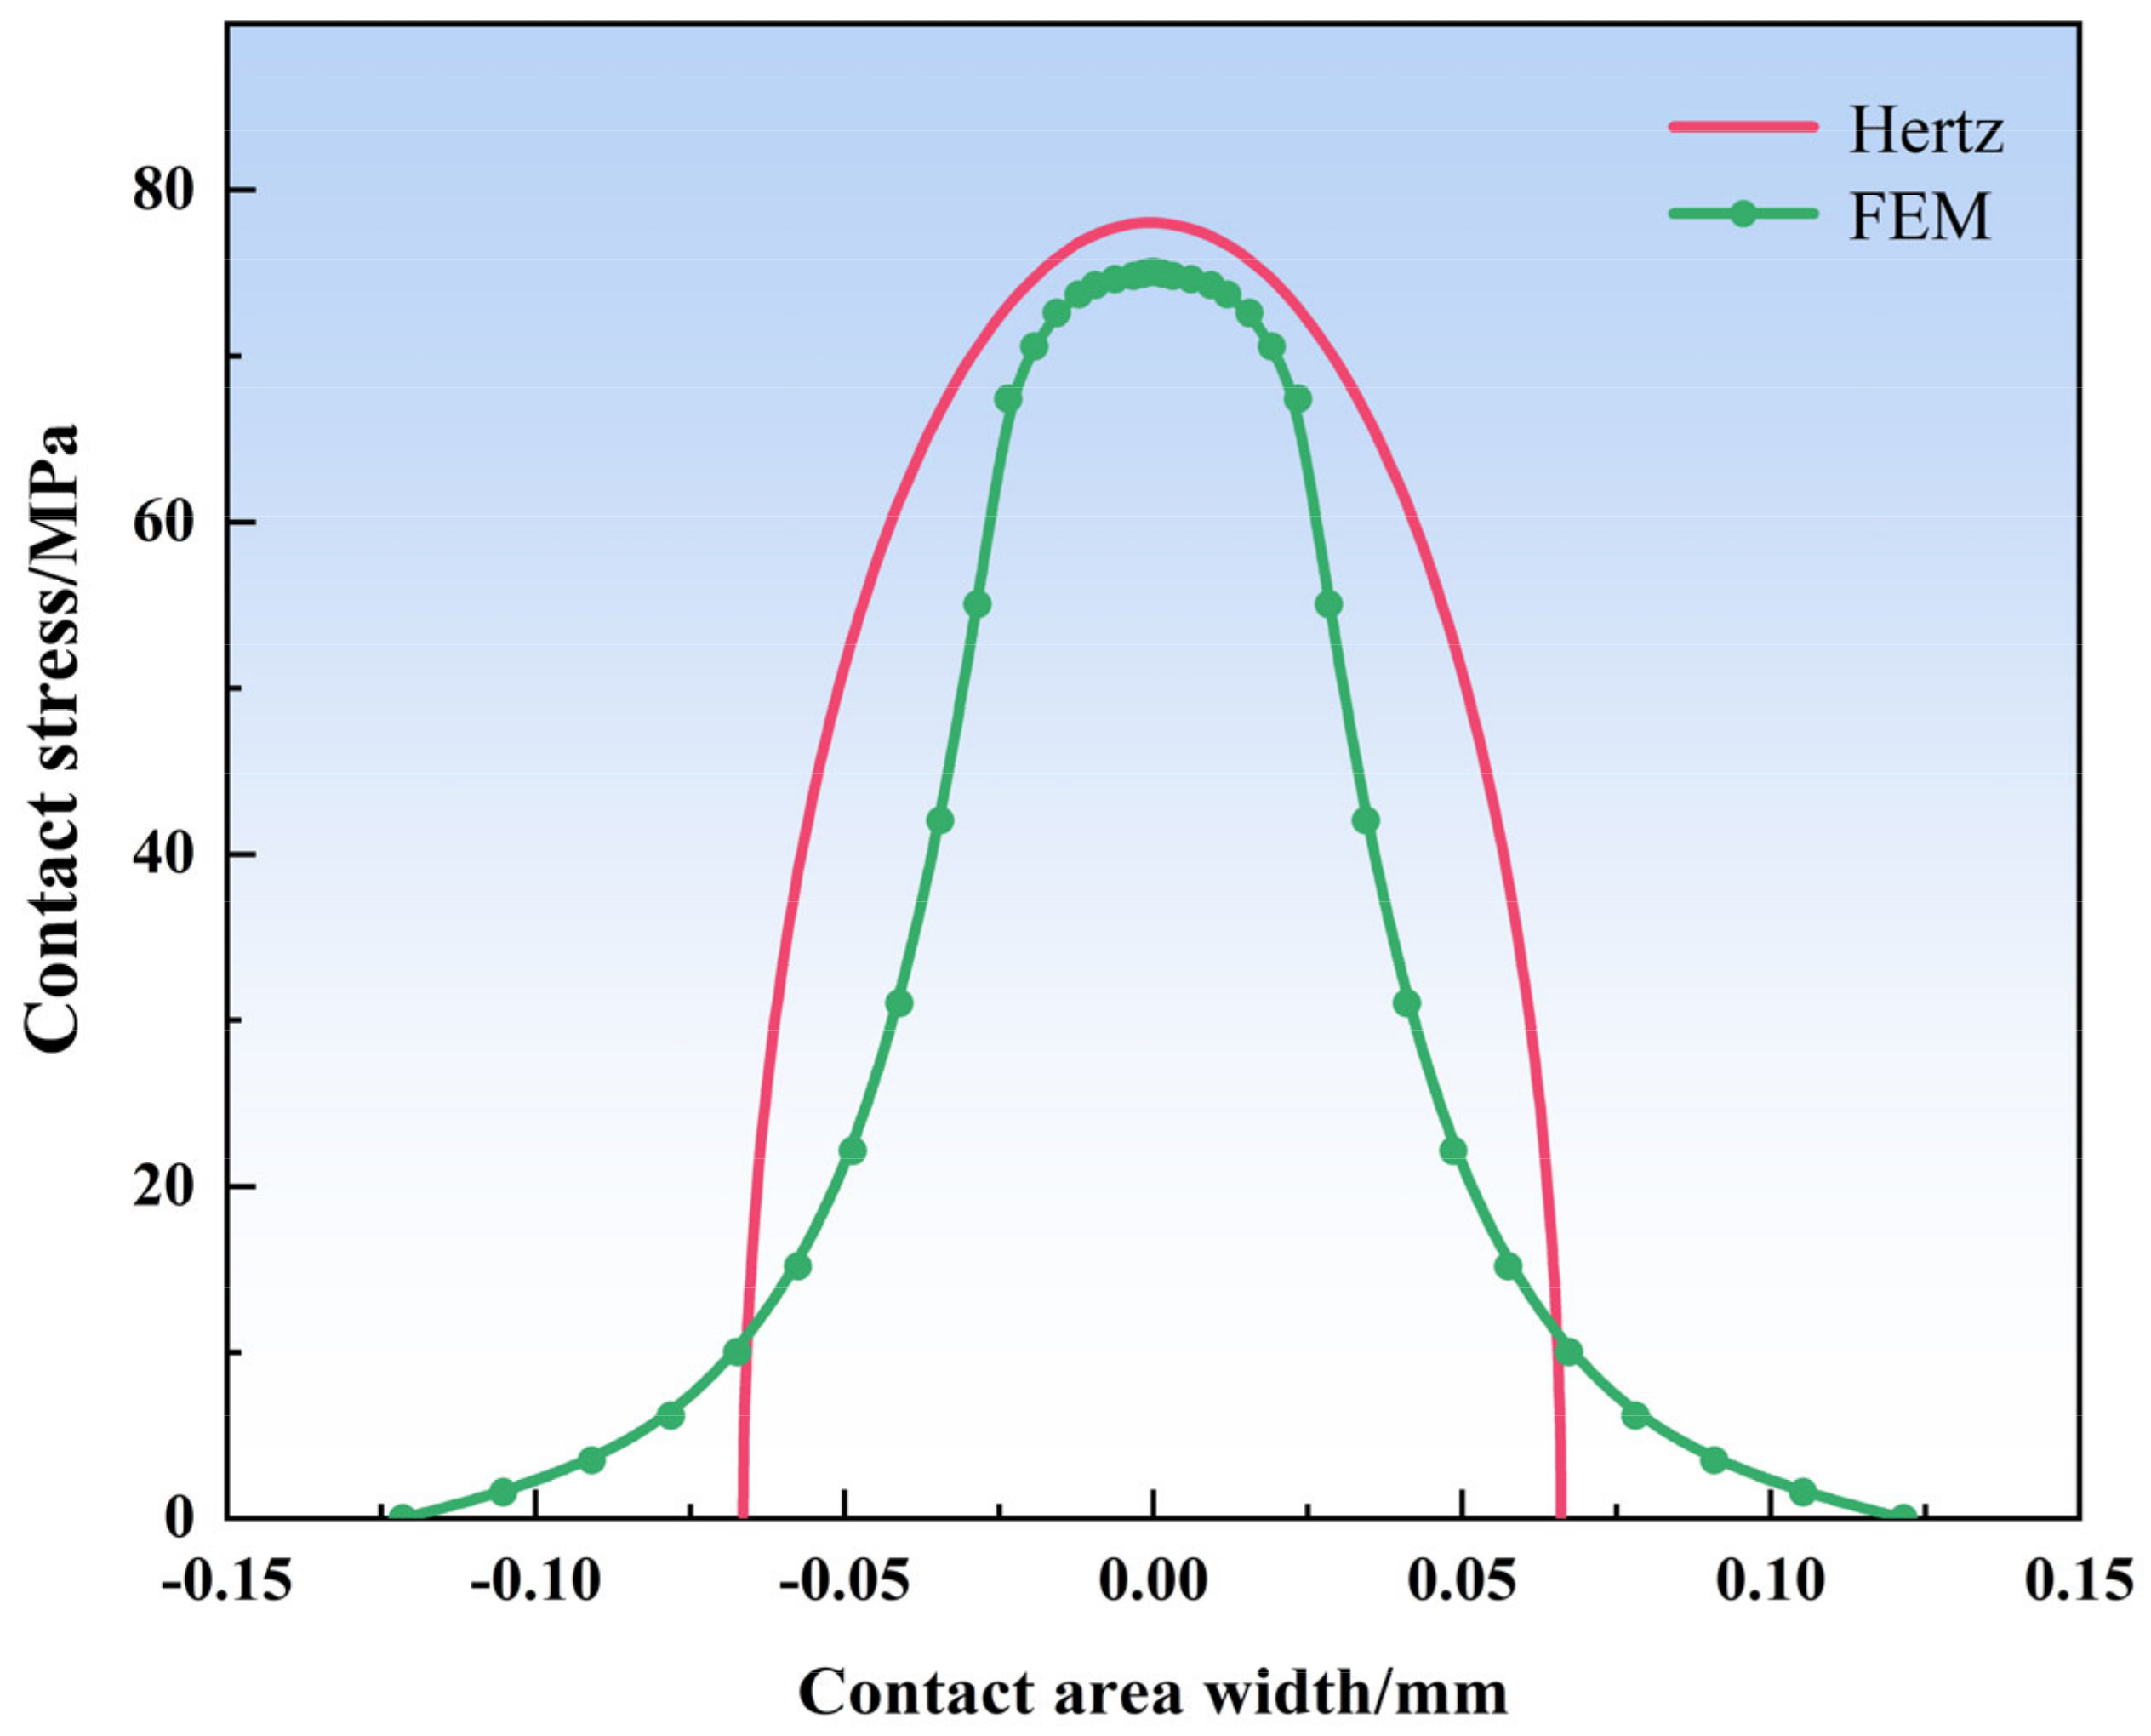
Figure 4.
Flow chart of wear simulation.
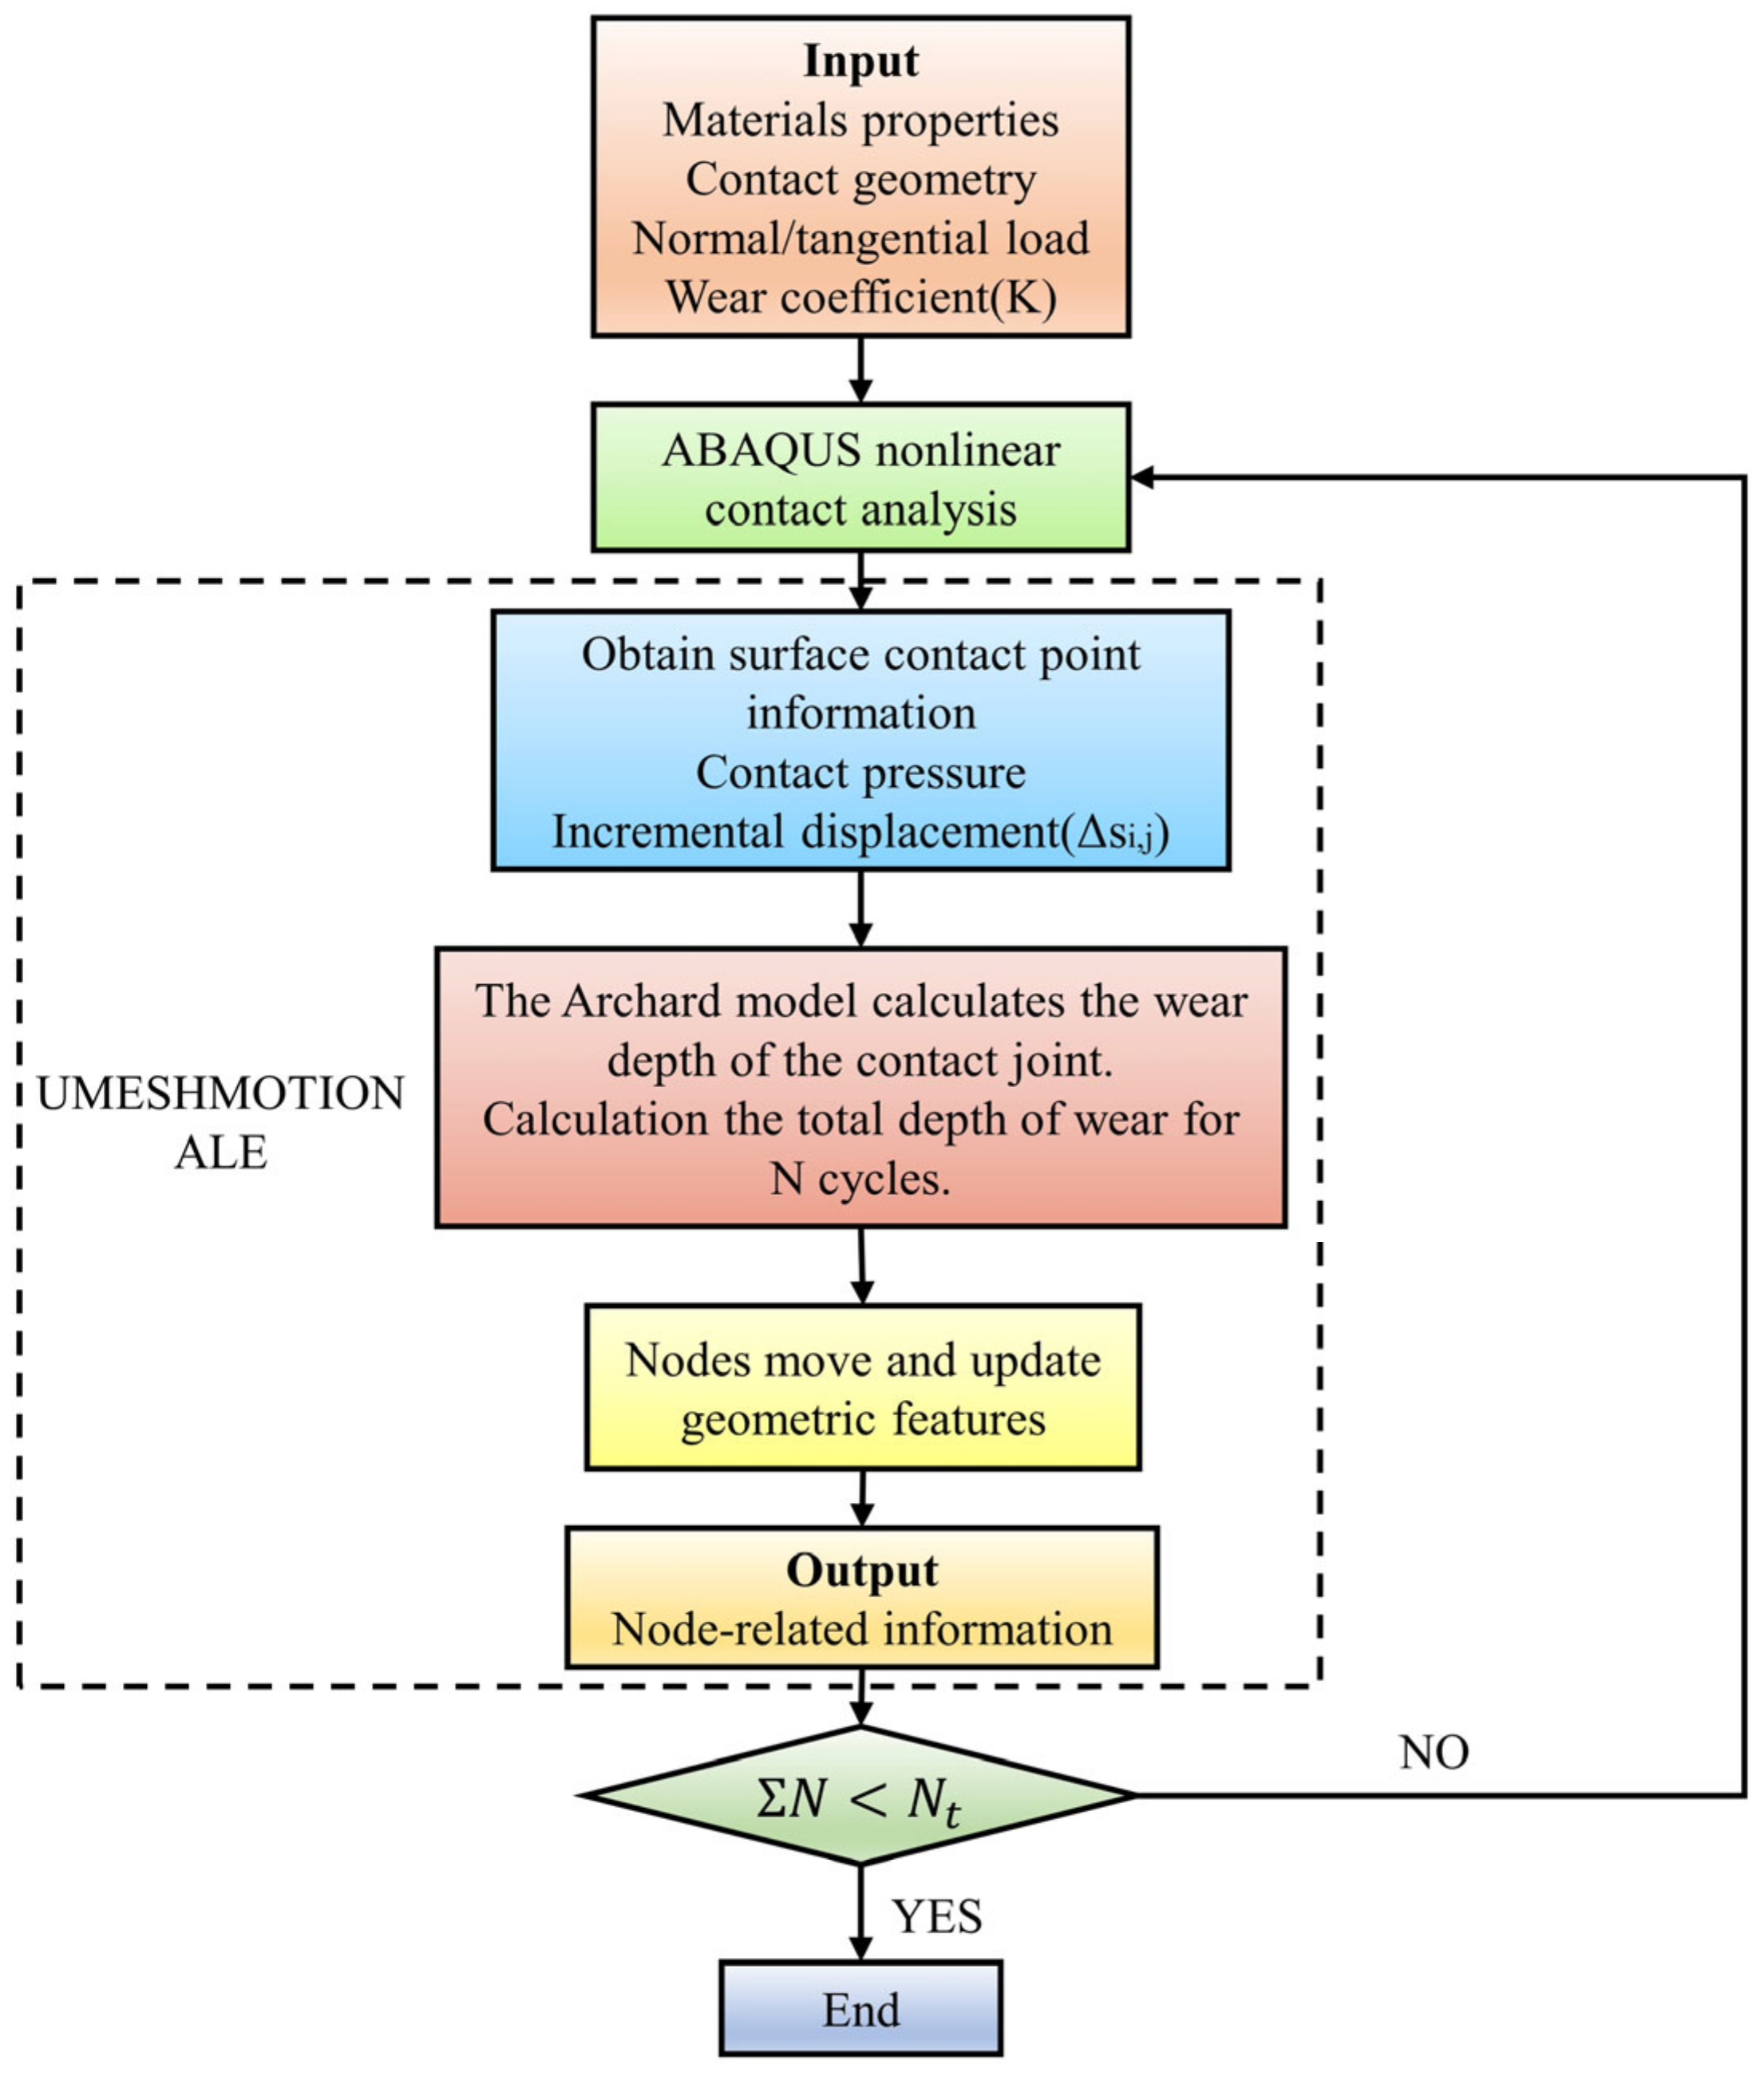
Figure 5.
Wear characteristics: (a) friction coefficient curve, (b) average friction coefficient, (c) wear profile curve, (d) wear rate.
Figure 5.
Wear characteristics: (a) friction coefficient curve, (b) average friction coefficient, (c) wear profile curve, (d) wear rate.

Figure 6.
SEM and EDS analysis of wear after different loads and thermal cycling temperatures: (a,b) 10 N–25 °C, (c,d) 20 N–25 °C, (e,f) 20 N–400 °C, (g,h) 20 N–800 °C.
Figure 6.
SEM and EDS analysis of wear after different loads and thermal cycling temperatures: (a,b) 10 N–25 °C, (c,d) 20 N–25 °C, (e,f) 20 N–400 °C, (g,h) 20 N–800 °C.

Figure 7.
Schematic diagrams of wear displacement in ball–disc simulations: (a) 10 N–25 °C, (b) 20 N–25 °C, (c) 20 N–400 °C, (d) 20 N–800 °C.
Figure 7.
Schematic diagrams of wear displacement in ball–disc simulations: (a) 10 N–25 °C, (b) 20 N–25 °C, (c) 20 N–400 °C, (d) 20 N–800 °C.
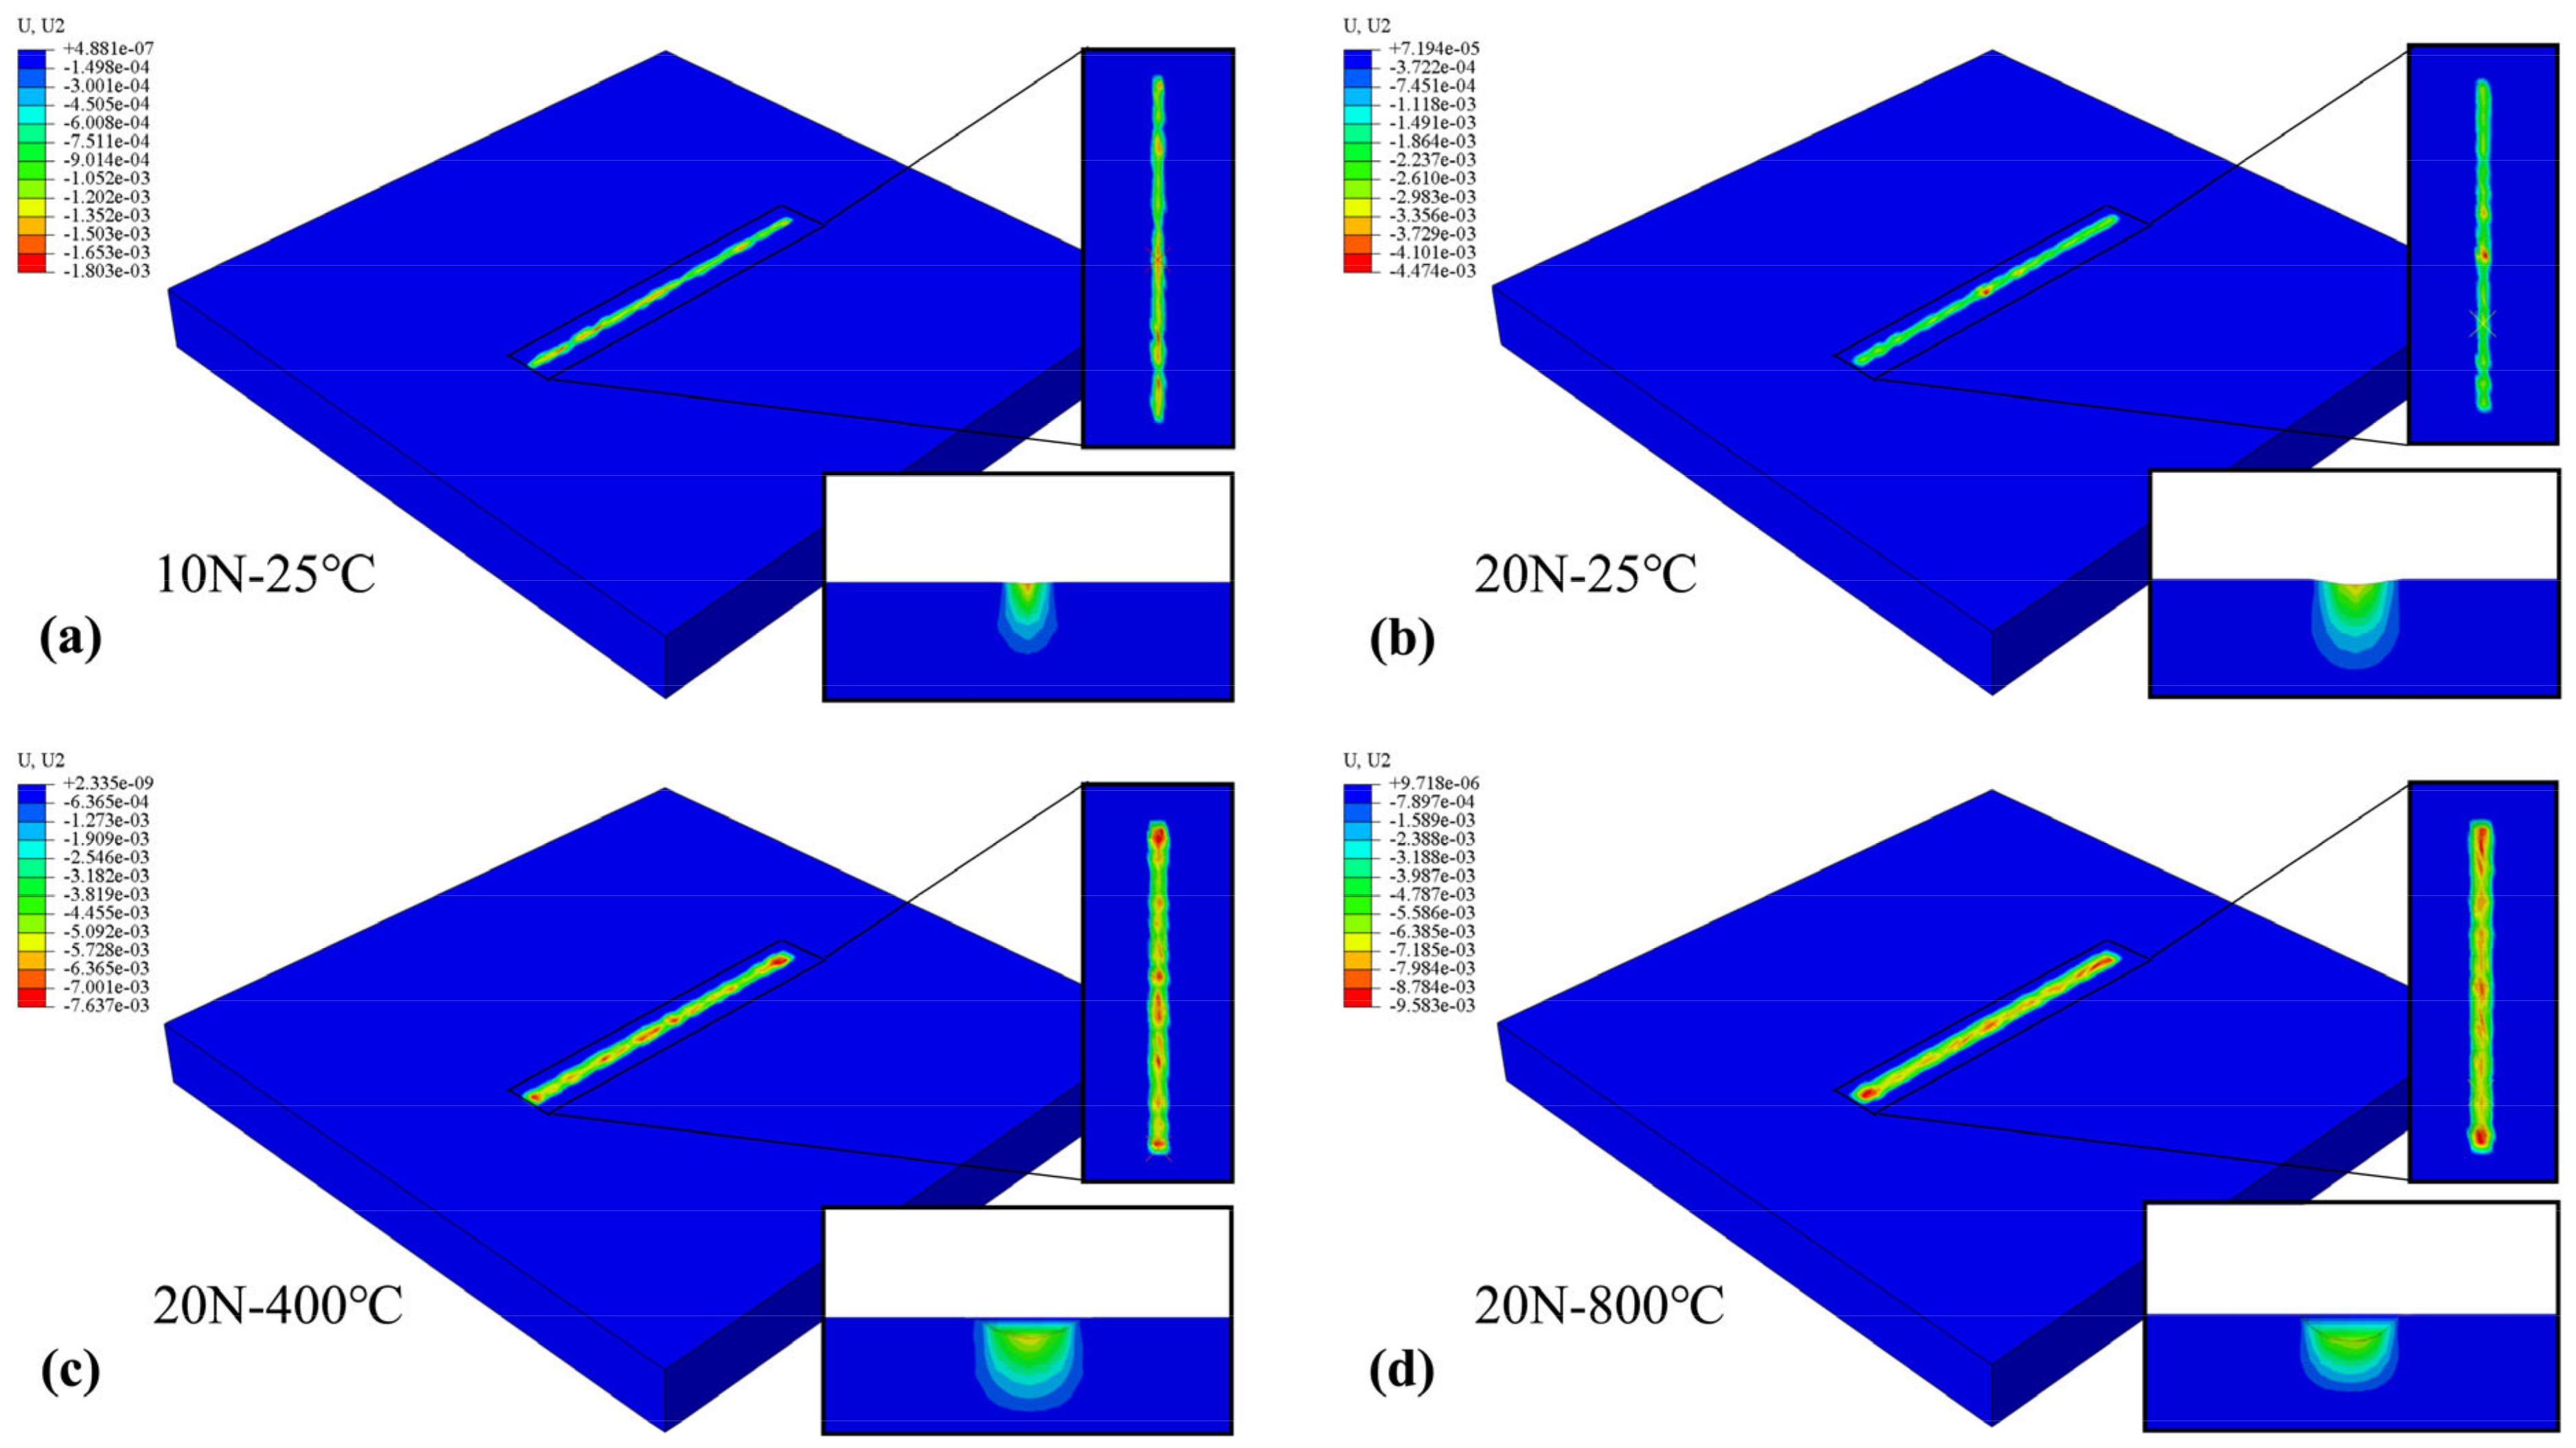
Figure 8.
Comparison of experimental and simulated wear profiles under different loads and temperatures.
Figure 8.
Comparison of experimental and simulated wear profiles under different loads and temperatures.
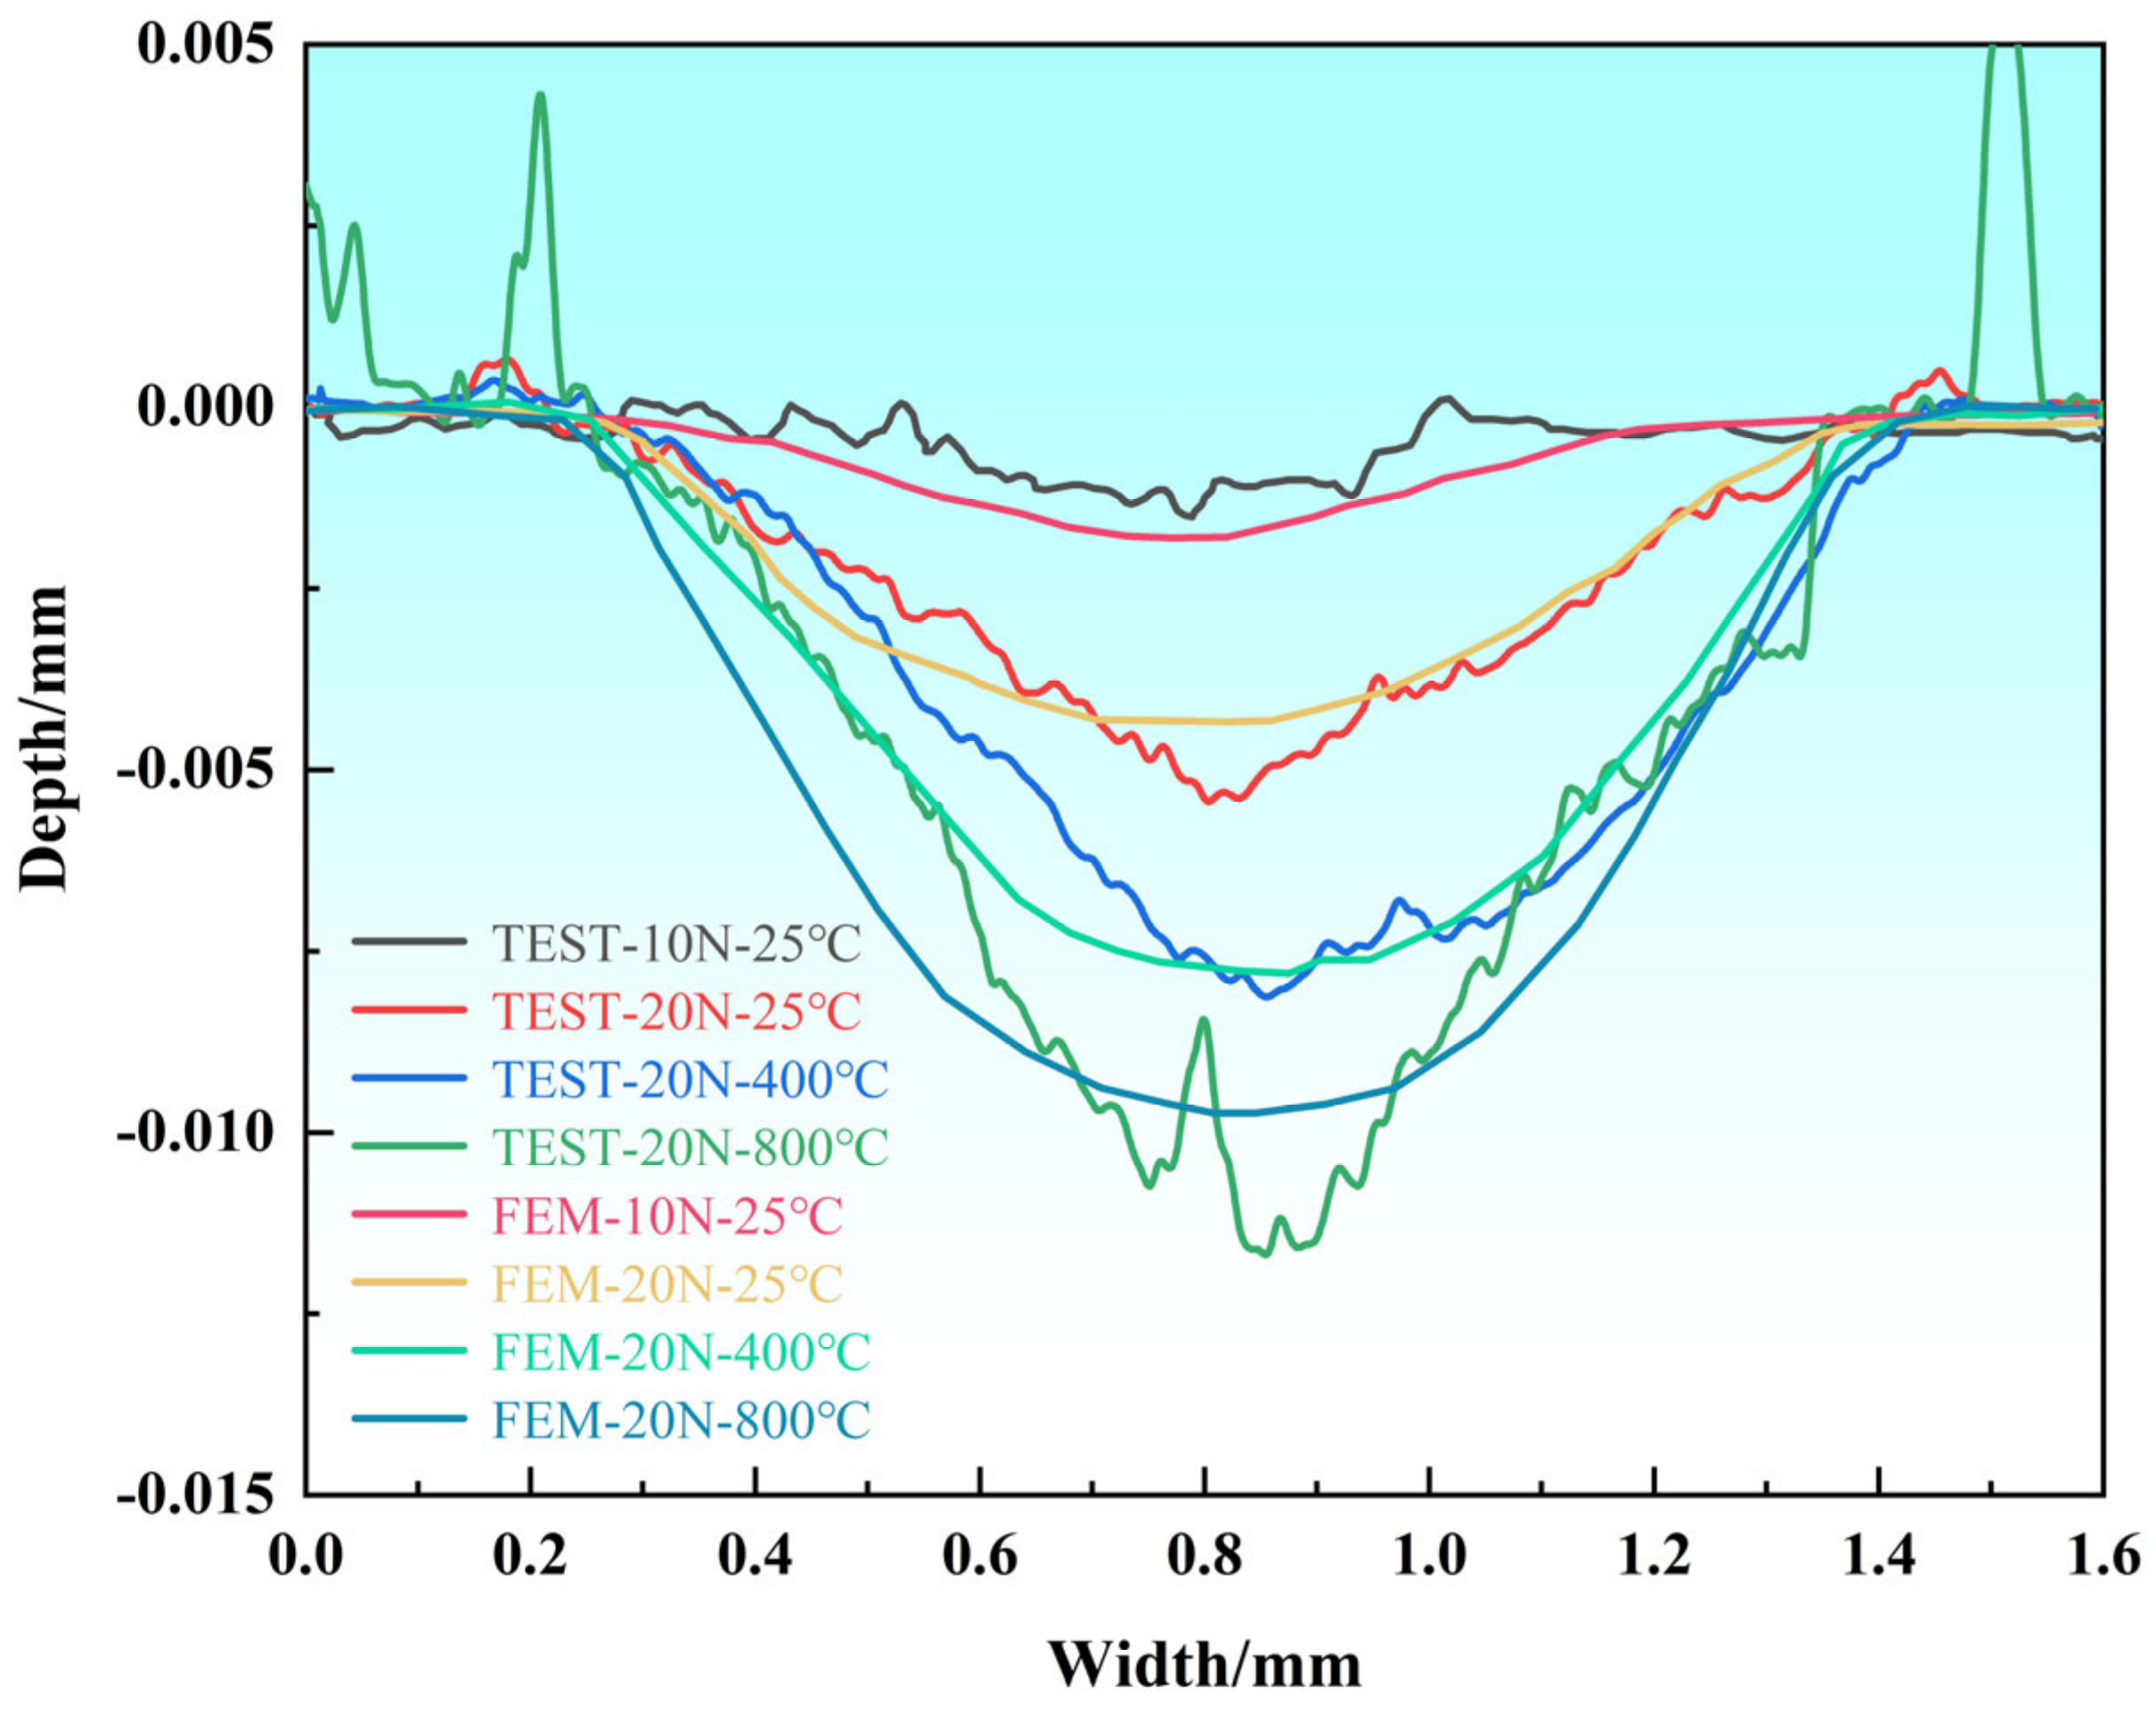
Figure 9.
Fitting curve of node depth with number of cycles.


Table 1.
Chemical composition of 30CrNi2MoVA steel (mass fraction, wt.%).
| C | Si | Mn | Cr | Ni | Mo | V |
|---|---|---|---|---|---|---|
| 0.32 | 0.26 | 0.44 | 0.90 | 2.29 | 0.25 | 0.18 |
Table 2.
Mechanical properties of 30CrNi2MoVA steel.
| Temp/°C | Elastic Modulus/MPa | Poisson Ratio/σ |
|---|---|---|
| 25 | 205,865.3 | 0.27 |
| 400 | 165,425.1 | 0.299 |
| 800 | 146,326.1 | 0.344 |
Table 3.
Fitting formula values.
| Load–Temp | h0 | A0 | t |
|---|---|---|---|
| 10 N–25 °C | −0.00346 | 0.00343 | 1322.75 |
| 20 N–25 °C | −0.00616 | 0.00597 | 817.6 |
| 20 N–400 °C | −0.0144 | 0.0141 | 1306.1 |
| 20 N–800 °C | −0.0183 | 0.01794 | 1307.2 |
Table 4.
Comparison of experimental wear depth values and fitted wear depth values.
| Number of Wear | Load–Temp | Experiment Values | Fitting Values |
|---|---|---|---|
| 960 | 10 N–25 °C | −0.00151 mm | −0.00180 mm |
| 20 N–25 °C | −0.00538 mm | −0.004315 mm | |
| 20 N–400 °C | −0.00813 mm | −0.007639 mm | |
| 20 N–800 °C | −0.01160 mm | −0.009632 mm |
Disclaimer/Publisher’s Note: The statements, opinions and data contained in all publications are solely those of the individual author(s) and contributor(s) and not of MDPI and/or the editor(s). MDPI and/or the editor(s) disclaim responsibility for any injury to people or property resulting from any ideas, methods, instructions or products referred to in the content. |
© 2024 by the authors. Licensee MDPI, Basel, Switzerland. This article is an open access article distributed under the terms and conditions of the Creative Commons Attribution (CC BY) license (https://creativecommons.org/licenses/by/4.0/).
Share and Cite
MDPI and ACS Style
Wei, A.; Li, Y.; Feng, L.; Feng, Y.; Xie, Z. Frictional Study on 30CrNi2MoVA Steel Based on Experiments and Finite Element Simulation: Wear Prediction. Coatings 2024, 14, 265. https://doi.org/10.3390/coatings14030265
AMA Style
Wei A, Li Y, Feng L, Feng Y, Xie Z. Frictional Study on 30CrNi2MoVA Steel Based on Experiments and Finite Element Simulation: Wear Prediction. Coatings. 2024; 14(3):265. https://doi.org/10.3390/coatings14030265
Chicago/Turabian StyleWei, Ao, Yiyi Li, Lianghai Feng, Yongjun Feng, and Zhiwen Xie. 2024. "Frictional Study on 30CrNi2MoVA Steel Based on Experiments and Finite Element Simulation: Wear Prediction" Coatings 14, no. 3: 265. https://doi.org/10.3390/coatings14030265
Note that from the first issue of 2016, this journal uses article numbers instead of page numbers. See further details here.