3.3. Influence of NaAlO2 Concentration on the Mechanical Properties of MAO Coating
The mechanical properties, such as hardness, and adhesive force, are important in the performance and durability of MAO coatings throughout their service life. Coatings characterized by inferior mechanical properties can have detrimental effects [
50,
51]. Consequently, it is imperative to undertake a comprehensive study and analysis to discern the influence of NaAlO
2 concentration on the mechanical properties of MAO coatings.
3.3.1. Nano Scratch Test
This section assesses the adhesive force of MAO coatings prepared with varying NaAlO2 concentrations using nano scratch tests. In the test, the elemental composition and distribution of the coating were also investigated through EDS linear scanning, which aided in defining the puncture point of the MAO coating under testing. Specifically speaking, the position where Mg content underwent a sudden and significant increase in elemental distribution was considered the puncture point in this study. The nano scratch test involves a preload of 20 N, with the load moving 3 mm on the MAO coating surface at a speed of 3 N∙mm−1.
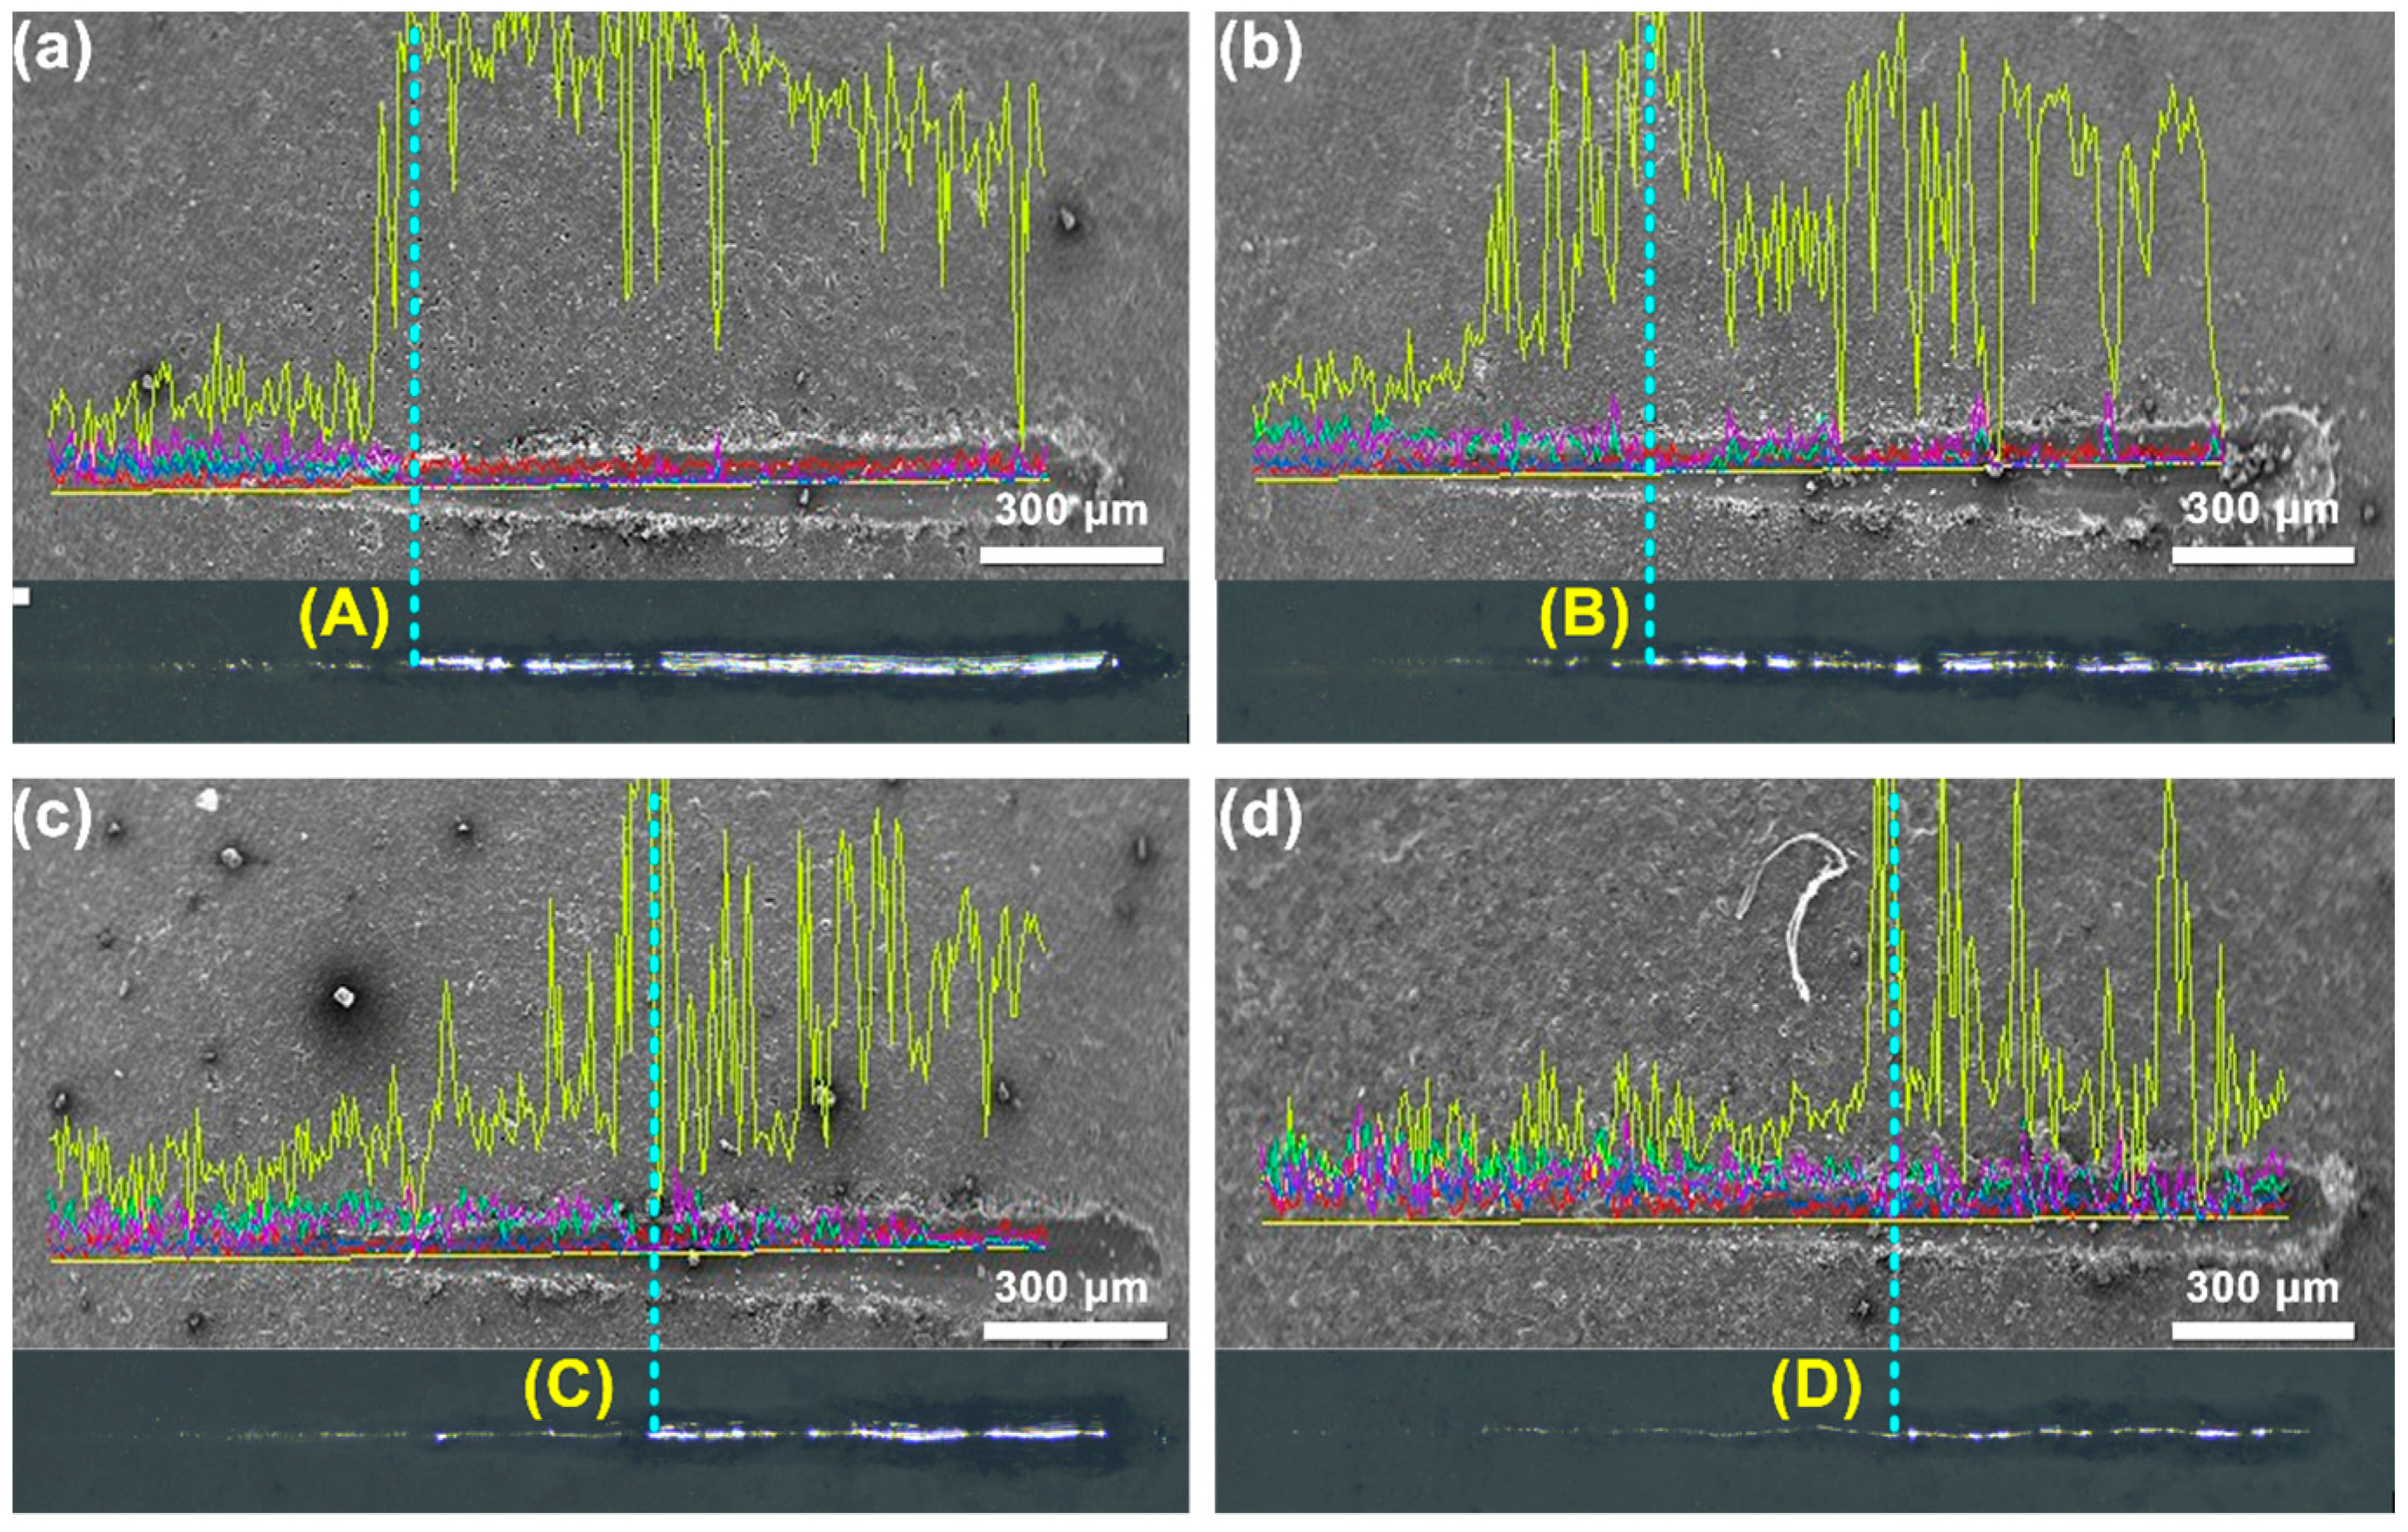
Figure 8 presents the results of the EDS linear scanning. As previously described, the puncture point for each coating is denoted by blue vertical dotted lines, accompanied by yellow markings of (A), (B), (C), and (D).
Figure 9 illustrates the results of four groups of nano scratch tests conducted on MAO coatings. In the context of the graphs, Lc represents the load at which the indenter punctured the MAO coating. The scratch profile was placed below the acoustic emission (A.E.) curve, while the penetration depth (P.D.) curve represents the penetration situation, of which the gradient until puncture points reflects the difficulty of the indenter in penetrating the MAO coating. A lower gradient indicated increased difficulty. Due to the presence of severe nonuniformity and brittle phases in the MAO coating, the A.E. signal exhibited significant fluctuations.
Observing the Lc values that stand for the load values at the puncture points shown in
Figure 9, it was evident that Lc increased from 6.81 N in the 3 g/L group to 12 N in the 12 g/L group, suggesting an escalation in the difficulty of puncturing the MAO coating. This finding implies an augmentation in the adhesive force between the Mg substrate and the MAO coating. However, considering the presence of brittle phases in the coating, which can also contribute to increased puncture difficulty, a detailed analysis of the penetration depth curve is necessary. The gradient of the P.D. curve in the 3 g/L group before puncture was 4569.40 nm∙N
−1, while the gradients in the 6 g/L, 9 g/L, and 12 g/L groups were 3115.12 nm∙N
−1, 3540.71 nm∙N
−1, and 4043.85 nm∙N
−1, respectively. The 3 g/L group exhibited the highest gradient, indicating that its coating was the easiest for the indenter to puncture, likely due to its lower thickness.
Considering the A.E. curve, the MAO coating in the 6 g/L group displayed the most stable acoustic emission. Despite having a lower coating thickness than the 9 g/L and 12 g/L groups, it appeared to have fewer brittle phases or defects. Upon reaching 0.2 mm, the A.E. curve revealed enormous peaks in the 9 g/L and 12 g/L groups, suggesting significant damage and a substantial increase in nonuniformity. Researchers have found that certain coating phases produced during preparation can enhance wear resistance. For instance, hydroxyapatite (H.A.) enhances the wear resistance of MAO coating, and graphene influences the wear and corrosion resistance on a titanium substrate [
52,
53].
3.3.2. Circumferential Abrasion Test
Figure 10 presents the results of the circumferential test conducted on MAO coatings prepared with different NaAlO
2 concentration in the electrolytes. The indicator of the test was the abrasion area. The circumferential abrasion test applied a load of 10 N, a test duration of 600 s, and a 3 mm abrasive radius for the steel sphere indenter. The five measuring positions for each abrasion arc are represented in
Figure 10A0, and the measurement was realized by using a confocal laser microscope, with the average value calculated within each group before further analyses.
Table 8 provides the wearing area results calculated from the circumferential tests.
Observations revealed a substantial decrease in the wearing area with increased NaAlO2 concentrations. In the 3 g/L group, the average abrasive area was 6.46 × 104 μm2, while in the 12 g/L group, the average abrasive area decreased to 2.91 × 104 μm2. A negative correlation existed between the wear area and the wear resistance of the coating. A smaller wear area indicated enhanced wear resistance.
3.3.3. Hardness
In this section, the automatic microhardness tester was utilized to measure the microhardness of the MAO coatings.
Table 9 shows an increase in the microhardness of the MAO coating with the rise in NaAlO
2 concentration. Considering the concurrent prevalence of reaction phenomena, it can be inferred that an elevated presence of NaAlO
2 in the electrolyte prompted heightened reactivity. Consequently, the formation of high-temperature brittle phases, such as MgAl
2O
4, and the proliferation of defects, such as cracks, were significantly amplified. This escalation results in the generation of micro fragments during the abrasion test. A portion of these fragments contributes to an increased frictional force between the indenter and the coating.
Considering previous testing results, the coating prepared with 12 g/L encountered large volume spark discharge and nonuniform growth, leading to an uneven distribution of defects in the MAO coating. Consequently, during the abrasion test, this nonuniform distribution caused certain parts to break earlier than others, producing fragments that further damaged the coating surface.
3.4. Influence of NaAlO2 on Phase and Chemical Bonds
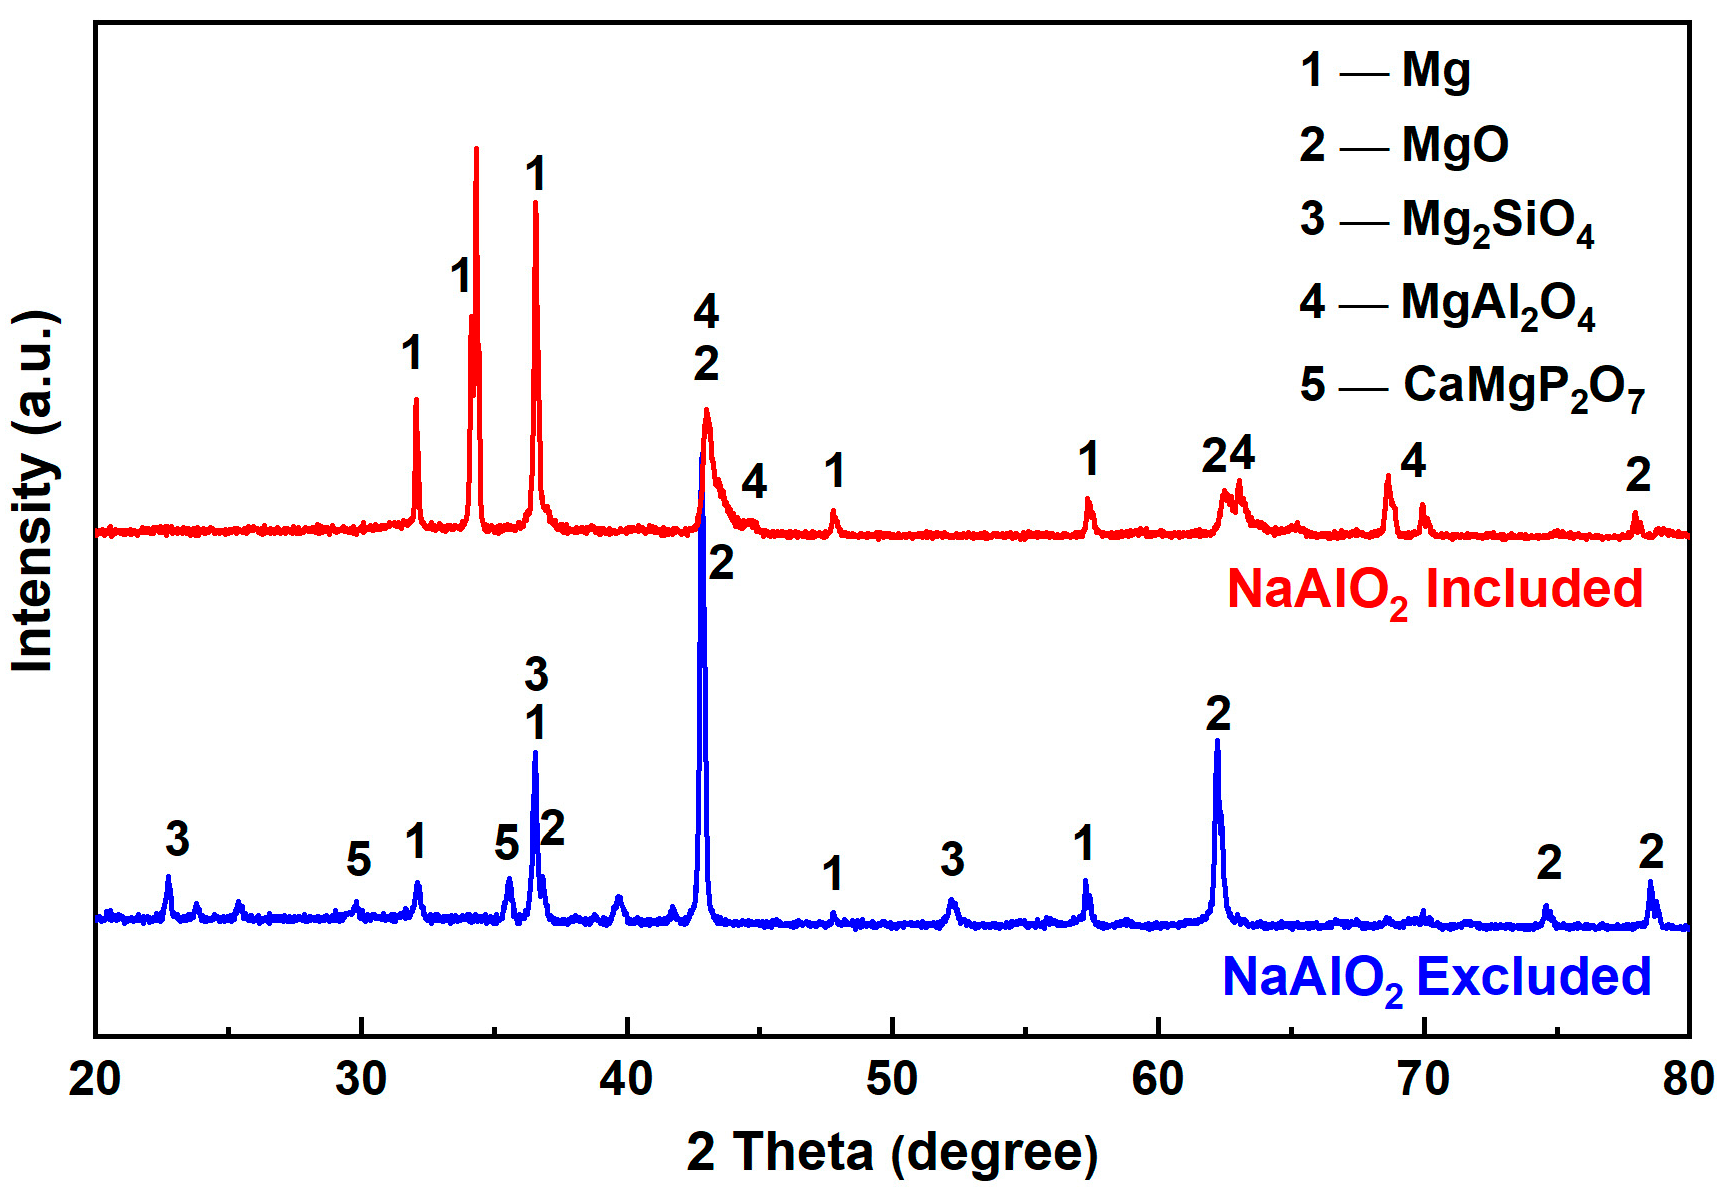
Figure 11 illustrates the XRD patterns both prior to and following the introduction of NaAlO
2 into the electrolyte. In the absence of NaAlO
2, the XRD pattern revealed the prevalence of MgO and Mg
2SO
4 as the primary phases in the MAO coating, with Mg
2SiO
4 representing the high-temperature phase found in the Earth’s mantle at depths ranging from 350 to 1000 km [
54]. Contrastingly, the XRD pattern with NaAlO
2 exhibited MgAl
2O
4 and MgO as the dominant phases, accompanied by a global weakening of MgO diffraction peaks. This weakening suggests a reduction in MgO within the MAO coating and the near disappearance of the secondary peak at 52° for MgSiO
4. In the NaAlO
2-included pattern, the MgAl
2O
4 diffraction peak significantly surpassed that of MgO. Considering the MAO reactions, it was evident that the NaAlO
2-included electrolyte reacted with the Mg alloy substrate, yielding the high-temperature phase MgAl
2O
4, known for its impressive properties, including a high melting point of 2135 °C [
55]. It has outstanding high-temperature mechanical properties and chemical stability. Its Knoop hardness is 1398 kg/mm
2 [
56]. Lastly, the NaAlO
2 pattern revealed the presence of CaMgP
2O
7. The chemical equations representing the phases above are provided in Formulas (3)–(5).
Figure 12 presents the XPS analysis outcomes for MAO coatings crafted with varying concentrations of NaAlO
2. The comprehensive spectrum (
Figure 12a) revealed distinctive features, and the Mg 1s spectrum showcased a fitting peak at 1303.4 eV (
Figure 12b), affirming the presence of Mg; another peak at 1303.8 eV indicated the presence of MgO. The third peak, which was at 1301 eV, stood for the CaMgP
2O
7. Finally, the peak at 1305.2 eV represented the MgAl
2O
4. This result was coherent with the XRD analyses results. They collectively confirmed the presence of MgO, MgAl
2O
4, and CaMgP
2O
7 in the prepared MAO coating. Previous studies indicate that certain phases enhance corrosion resistance by forming a protective layer that seals micropores and microcracks in the primary MAO coating, such as hydroxyl apatite [
28,
57,
58].
Figure 13 illustrates the EDS image of four groups of MAO coatings, showing the elemental distribution across the coating cross-sections. Firstly, the Mg substrate (highlighted in red) was present in all coatings, and its proportion diminished with increasing NaAlO
2 concentrations due to augmented coating thickness. The Ca element (indicated in dark green in the third column) are found in the regions with fewer defects undergoing growth. Conversely, the proportion of Al increased proportionally with the NaAlO
2 concentration.
Table 10 details the elemental composition in the MAO coatings prepared with different NaAlO
2 concentrations. Higher NaAlO
2 concentrations corresponded to substantial increases in Ca and P elements. The Ca/P ratio, which is associated with osseous inducibility, reached a rather high value of 0.85 in the 6 g/L group and 0.92 in the 9 g/L group. This progression indicates the presence of high-temperature phases like MgAl
2O
4 and CaMgP
2O
7 in the MAO coating. Incorporating Ca and P elements in the MAO coating enhances adhesion forces and improves biocompatibility, as supported by previous studies [
59,
60].
3.5. Influence of NaAlO2 Concentration on the Corrosion Behavior
In this section, each experimental group comprised four parallel samples designated for immersion tests spanning 5, 10, 15, and 20 days in Hank’s solution. The immersion medium employed was Hank’s balanced salt solution, with regular refreshing every 24 h to maintain consistent testing conditions.
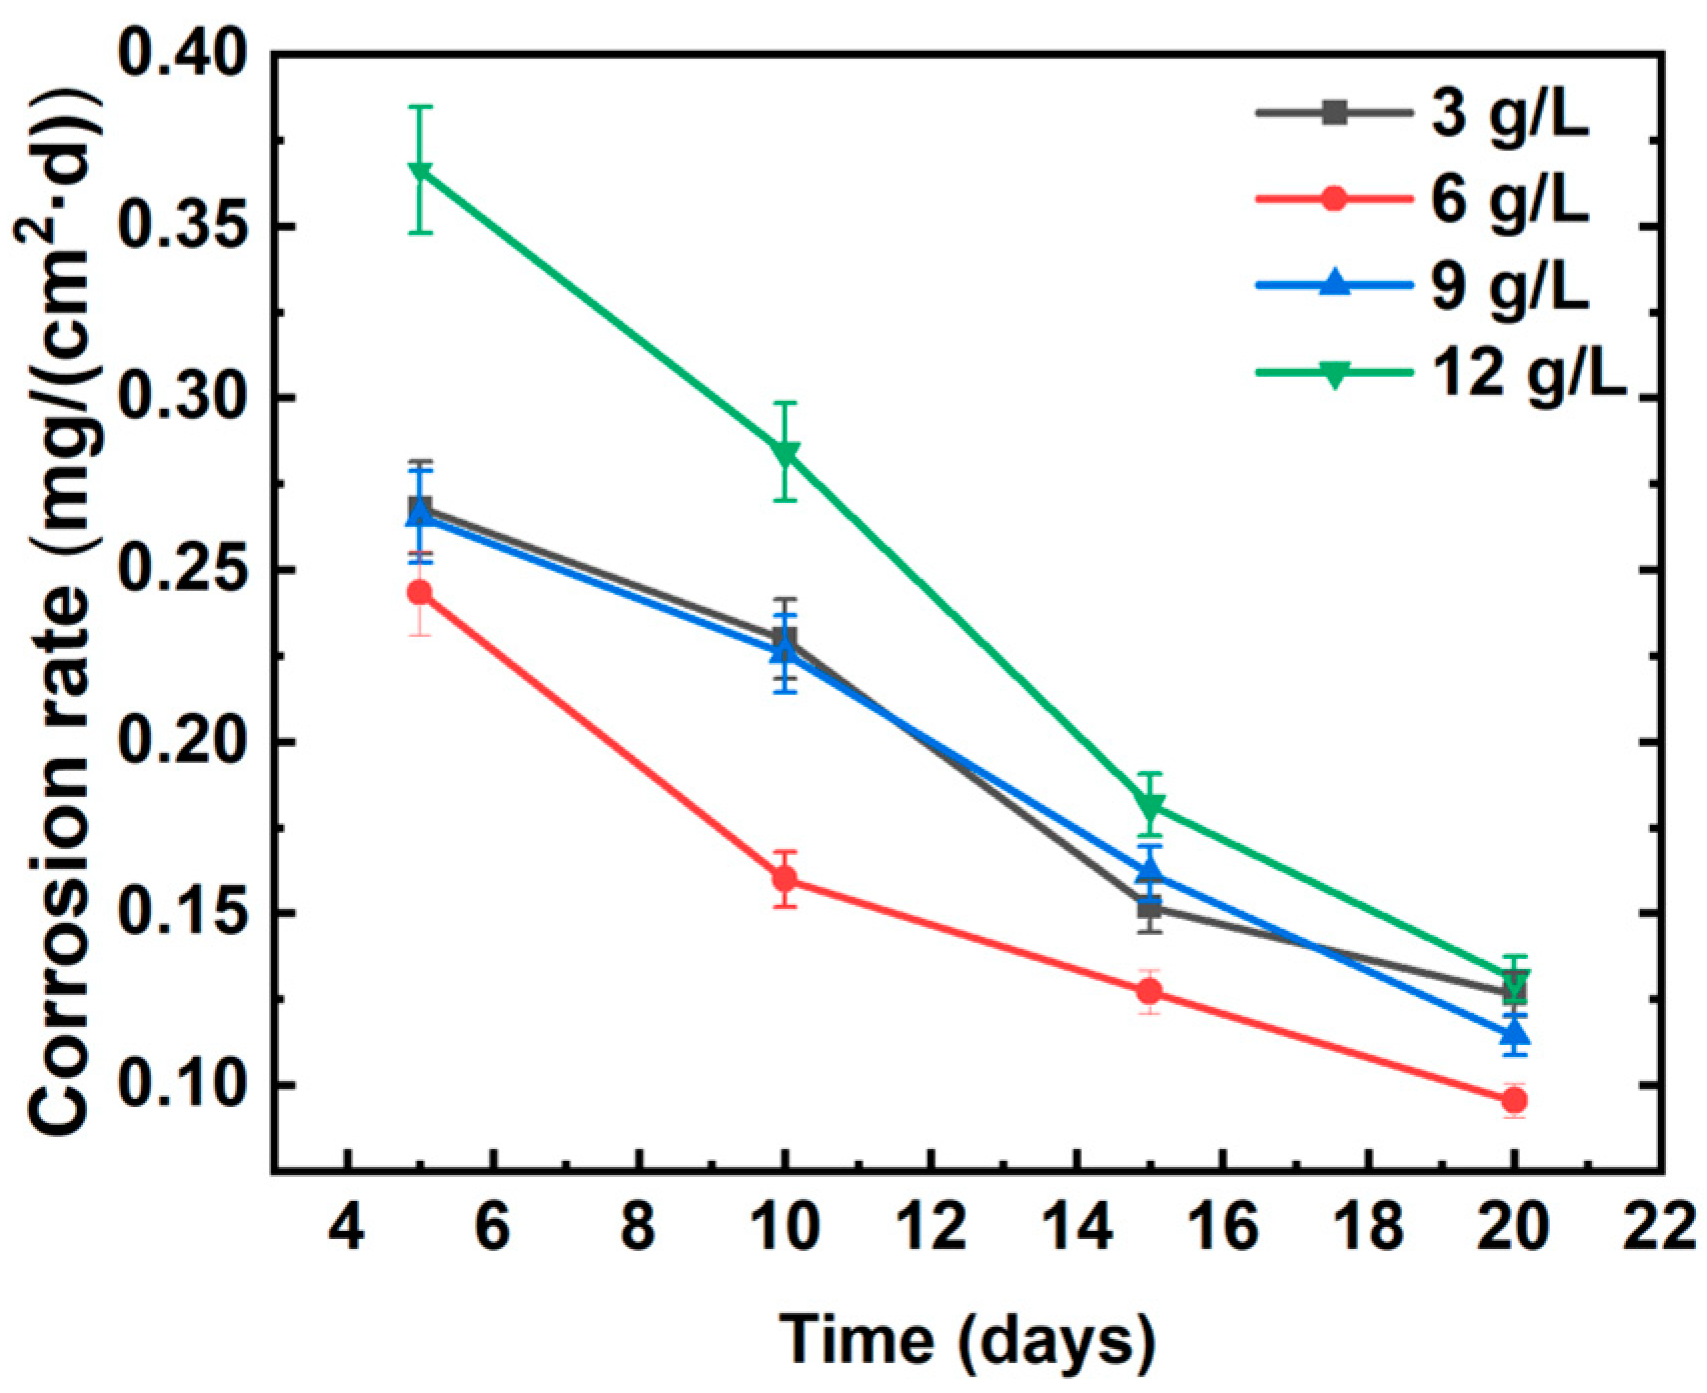
Figure 14 presents the average corrosion rates of the MAO coatings across different groups. After 5 days of immersion, the 6 g/L group exhibited a corrosion rate below 0.25 mg/(cm
2∙d), while the 12 g/L group experienced a slightly higher corrosion rate at 0.37 mg/(cm
2∙d). Over time, the corrosion rates in all groups gradually decreased, with the 6 g/L group consistently maintaining the lowest level. Despite the proximity of corrosion rates in the 3 g/L and 9 g/L groups, notable differences in thickness and porosity were observed. The MAO coating thickness in the 9 g/L group was almost twice that in the 3 g/L group, while its porosity was 12.4% compared to 10.5% in the 3 g/L group. This finding implies that higher porosity, which leads to more channels for the corrosive solution to reach the Mg alloy substrate, would significantly impact corrosion resistance more than coating thickness does. Therefore, coatings with lower porosity and better uniformity may possess stronger corrosion resistance. In this study, the MAO coating prepared with 6 g/L NaAlO
2 aligned most closely with this criterion, being consistent with the test results. Other research corroborates that modifying the concentration of a single electrolyte ingredient can enhance the compactness; surface quality; and, consequently, the corrosion resistance of MAO coatings [
61,
62,
63].
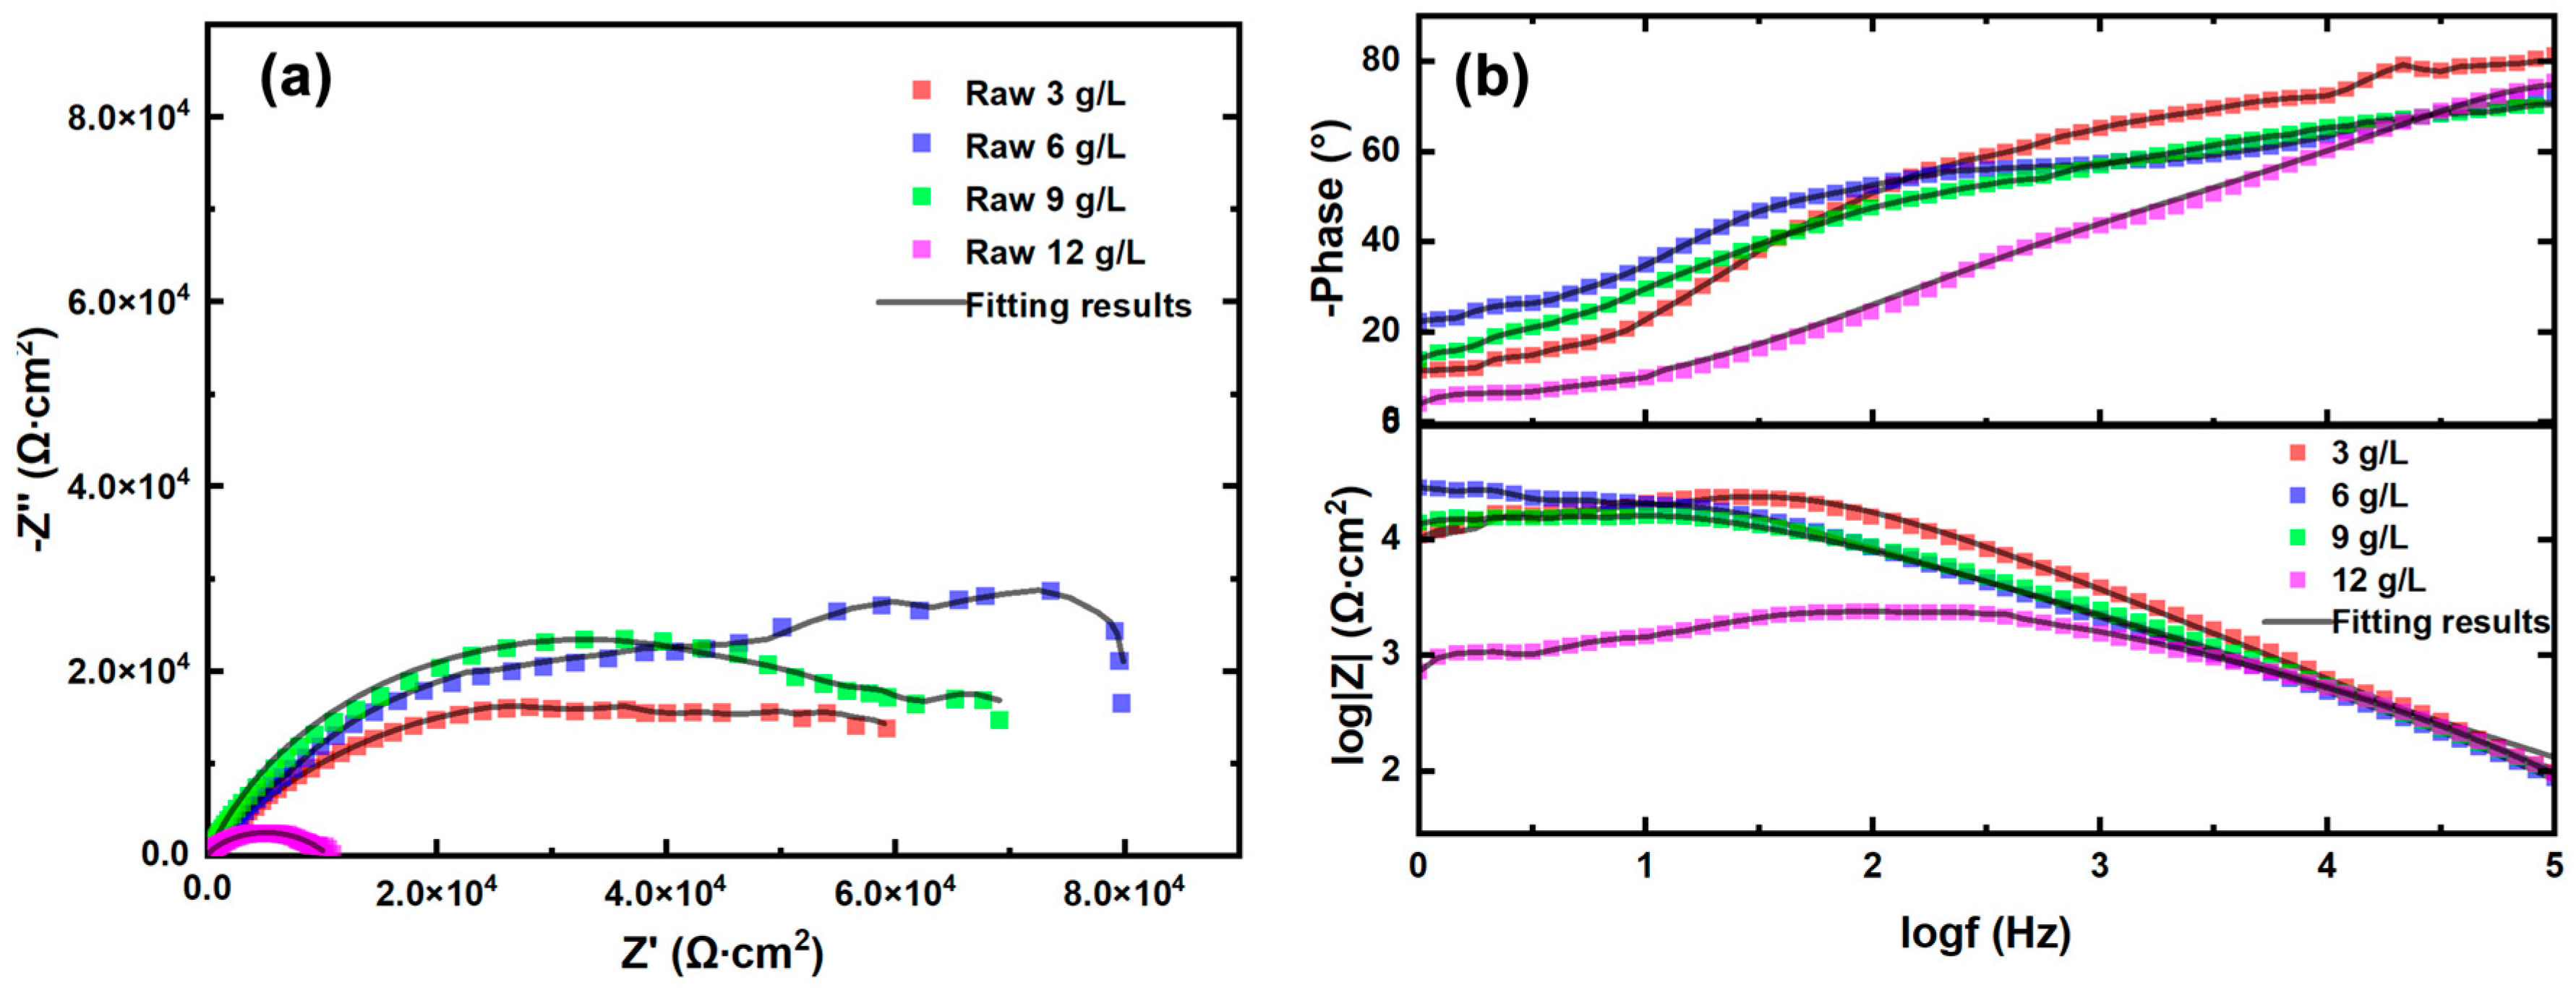
The equivalent electrical circuit (EEC) is presented in
Figure 15. In the circumstances of this paper, R
1 stands for the electrolyte solution resistance, R
2 is the charge transfer resistance, R
3 represents the coating resistance, and R
4 together with L are used to describe the resistance and inductance of pores in coating. CPE
1, which stands for constant phase element, represents the capacitance behavior of coating-substrate interface in this paper [
64,
65]. The impedance of CPE can be defined as Formula (6), being applied usually in a non-uniform system, which is apparently coherent with the circumstance of this paper, with C
1 being the capacitance of the coating surface.
In the equation, Q represents the constant associated with CPE, ω denotes the angular frequency (in rad/s), j signifies the imaginary unit where j2 equals −1, and n stands for the CPE exponent.
The electrochemical results are presented in
Figure 16. The Nyquist plotting shows the impedance of MAO coating (
Figure 17a). Statistic fitting results are shown in
Table 11.
Taking into consideration both surface and cross-sectional morphologies, alterations in coating thickness and coating compactness indicate the evolution of impedance. With an escalation in the concentration of NaAlO2 in the electrolyte, the coating thickened with a concomitant decline in coating uniformity, flatness, and perfectness.
The fitting results delineated in
Table 11 and
Figure 16 elucidate that R
1, the impedance of the electrolyte solution, remained relatively stable at 10–15 Ω∙cm
2, with a tiny decline due to the increased concentrations of the electrolyte. R
2 was also stable at about 4 × 10
4 Ω∙cm
2 because it related directly with temperature T and exchange current i
0. R
3, which represents the resistance of the MAO coating, differed significantly in each group, rising with the introduction of NaAlO
2 at the beginning, then peaking in the 6 g/L group with the impedance of 8.14 × 10
4 Ω∙cm
2, and finally declining to 1.7 × 10
4 Ω∙cm
2 in the 12 g/L group. R
4 and L, which are related to the resistance and inductance of pores in MAO coatings, showed synchronized evolvement with coating compactness. They firstly rose with the introduction of NaAlO
2 in electrolytes; peaked at 6.32 × 10
4 Ω∙cm
2 and 5.82 × 10
4 H∙cm
2, respectively, in the 6 g/L group, which possessed the least pores and cracks, etc.; and then declined with when NaAlO
2 was overdosed in electrolytes, in the 9 and 12 g/L groups. On the other hand, CPE
1 and R
2, associated with the outer porous layer, peaked in the 6 g/L group and declined with higher NaAlO
2 concentration, but the impedance of 9 g/L was still considerably higher than those of the 3 and 12 g/L groups.
Though the resistances R
1, R
2, R
3, and R
4 cannot be simply summed together, it can be concluded from the results that the MAO coating in the 6 g/L group possessed higher impedance, in other words, better corrosion resistance. The results can be related to the coating’s thickness and perfectness. The MAO coating in the 6 g/L group, though having lower thickness compared to the coating in the 9 and 12 g/L groups, also possessed much less pores and cracks, providing easy access for corrosive medium to Mg substrate, severely damaging the corrosion resistance of a coating. In other studies, where bare ZK60 alloy subjected to EIS testing in Hank’s solution demonstrated an impedance of approximately 1000 Ω∙cm
2 at 37 °C [
66]. It can be seen that the MAO coating significantly improved the corrosion resistance.
3.6. Influence of NaAlO2 Concentration on the Antibacterial Behavior of MAO Coating
This section investigates and discusses the antibacterial ability of the MAO coating and the influence of NaAlO2 concentration on it. Since the antibacterial test provided qualitative data, it offers evidence for a comparative analysis of the antibacterial capabilities of MAO coatings prepared with varying NaAlO2 concentrations.
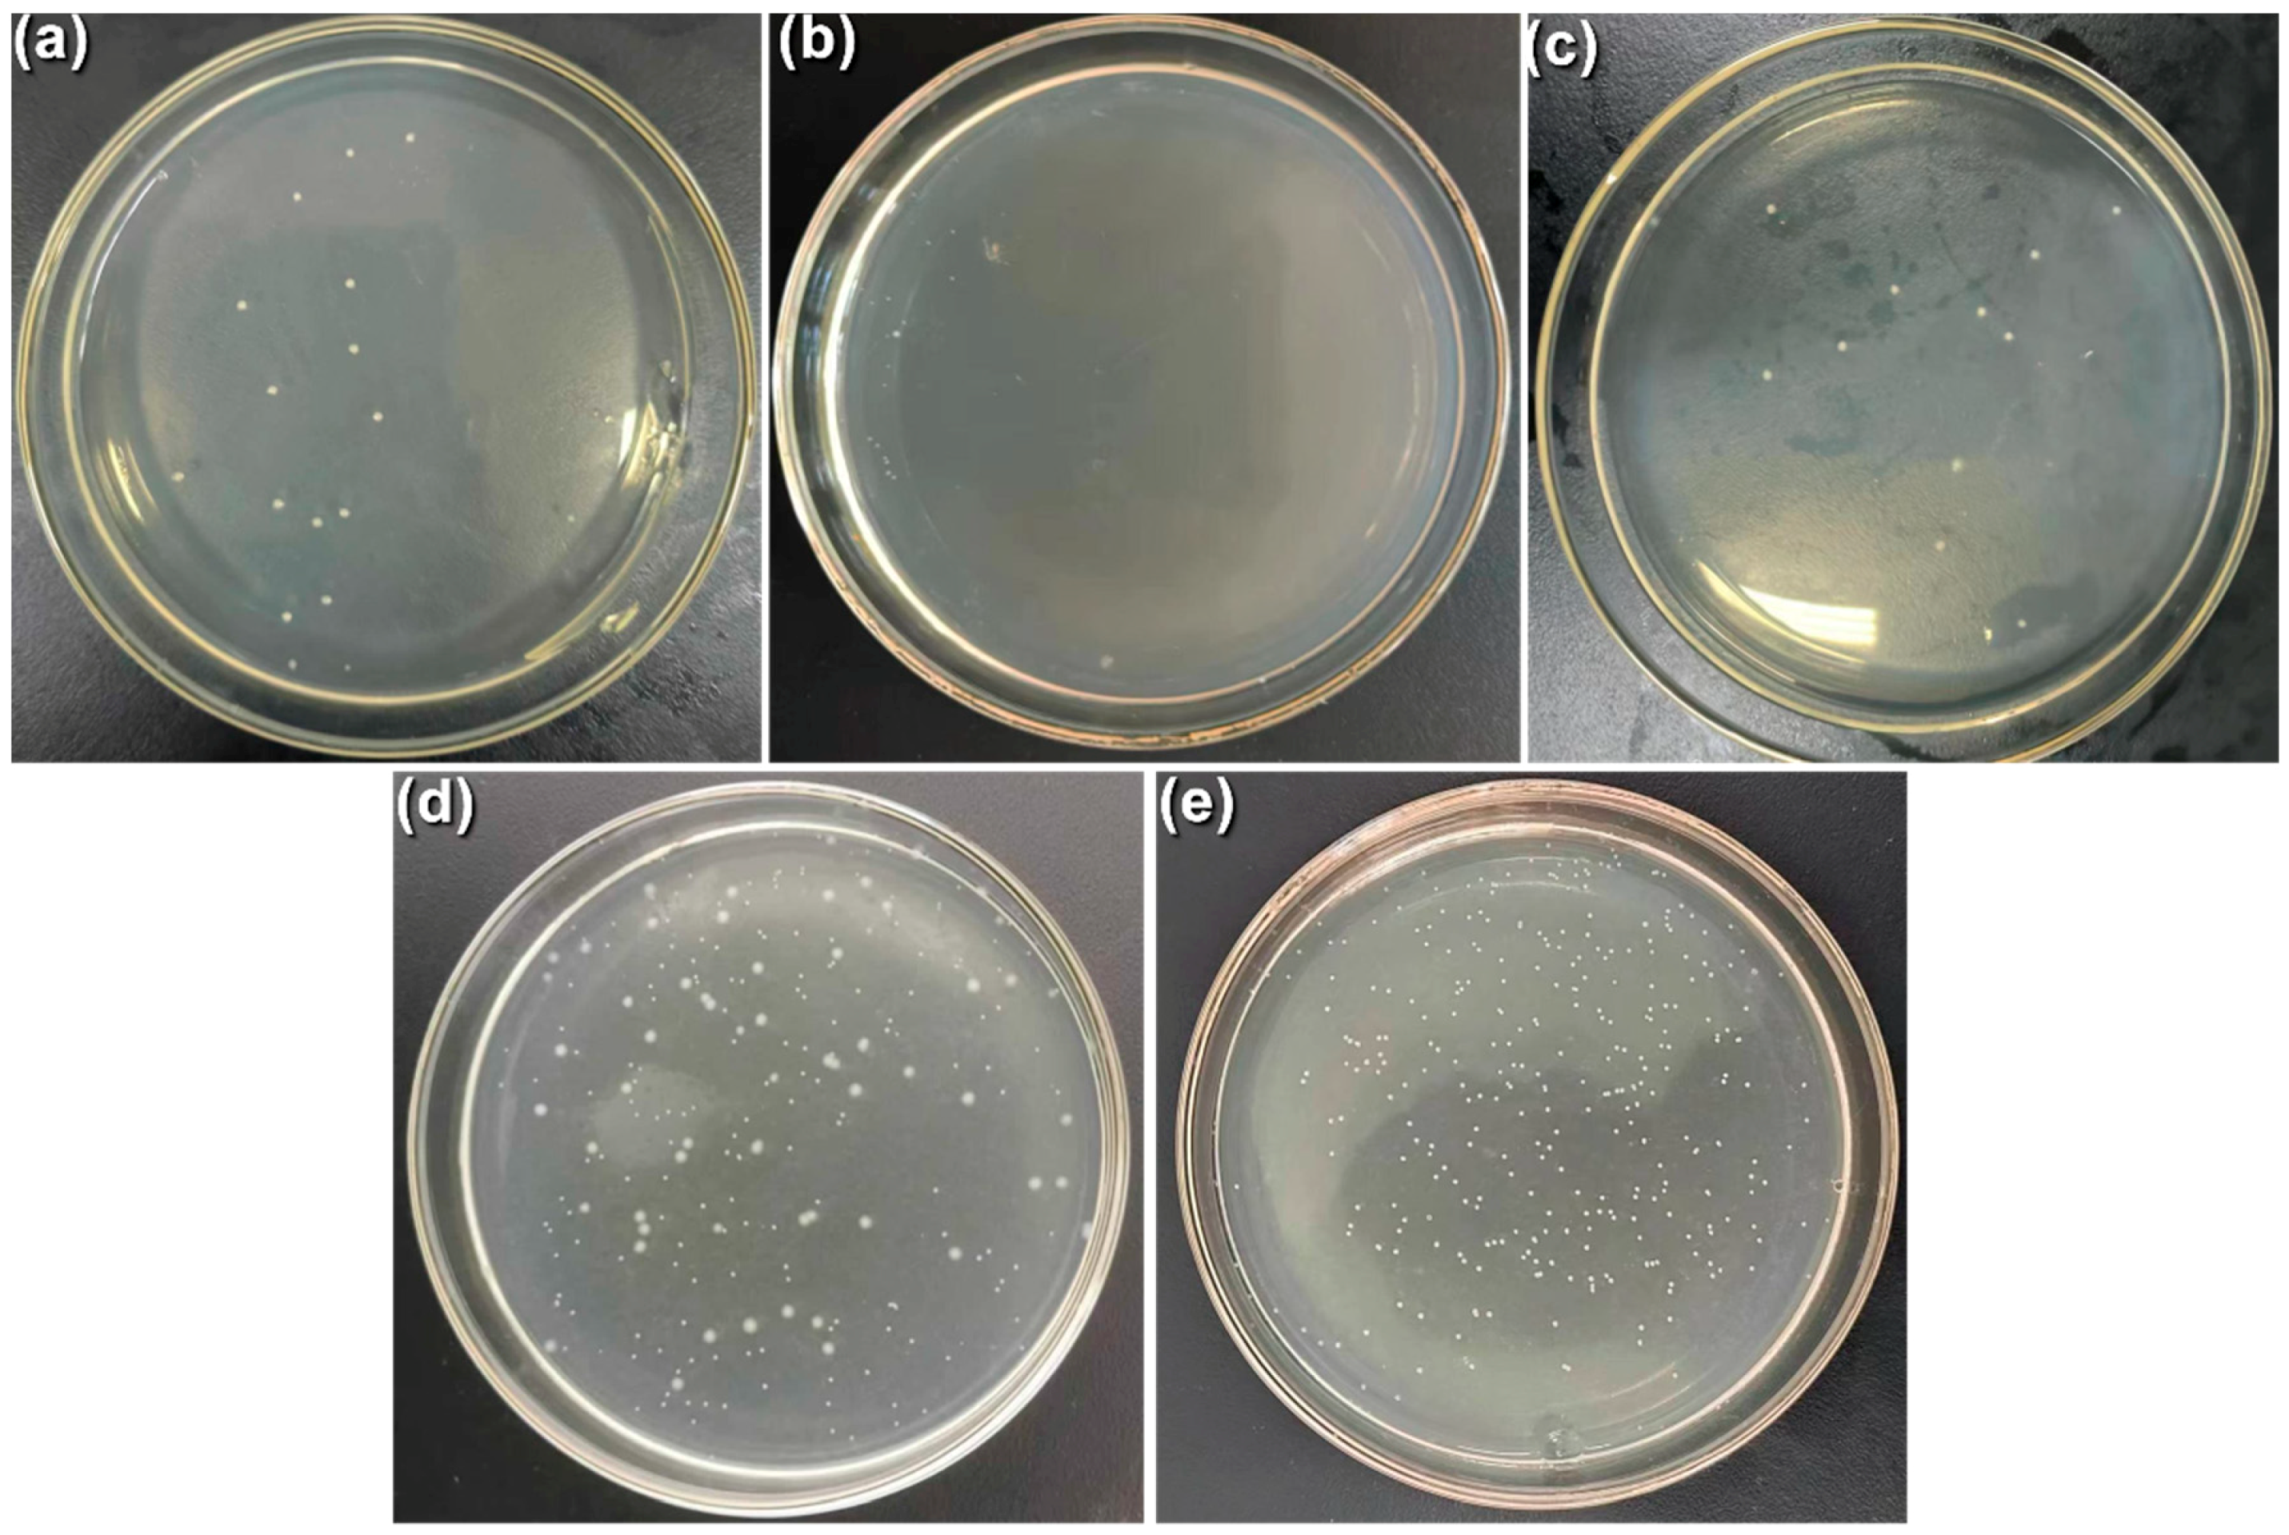
Figure 17 displays the results of the antibacterial ability test for MAO coatings in four groups. The figure reveals a significantly higher number of bacterial colonies in the 12 g/L group (
Figure 18d), indicating a comparatively weaker antibacterial ability in this group. In the 3 g/L group, large bacterial colonies were observed. The 6 g/L group exhibited nine small colonies, while the 9 g/L group displayed twelve large colonies. The 12 g/L group substantially increased with 45 large colonies. The control group (
Figure 17e) had 309 bacterial colonies. Consequently, the antibacterial rate (R
ab), calculated using Formula (7), quantitatively measured the antibacterial ability.
In this formula, Nx represents the numbers of bacterial colonies in the four groups, while Nc denotes the number of bacterial colonies in the control group. Consequently, the calculated antibacterial rates Rab were 95.47%, 97.08%, 96.11%, and 85.4% for the respective groups.


