Article

An Oxide Growth-Coupled Viscoplasticity Model and Its Application to Interfacial Stress Analysis near an Air Hole within a Thermal Barrier Coating

1
School of Aeronautic Science and Engineering, Beihang University, Beijing 100191, China
2
International Innovation Institute, Beihang University, Hangzhou 311115, China
3
School of Mechanical Engineering, Inner Mongolia University of Science & Technology, Baotou 014010, China
4
Faculty of Engineering, University of Nottingham, Nottingham NG7 2RD, UK
*
Authors to whom correspondence should be addressed.
Coatings 2024, 14(3), 362; https://doi.org/10.3390/coatings14030362
Submission received: 15 February 2024 / Revised: 15 March 2024 / Accepted: 17 March 2024 / Published: 19 March 2024
(This article belongs to the Section Ceramic Coatings and Engineering Technology)

Abstract

:
Strength assessment for thermal barrier coatings (TBCs) is vital in the safety design of hot-section components in engines. However, several crucial factors, including thermally grown oxide (TGO) growth and creep–plasticity interaction, have been less considered in thermo-mechanical analyses for TBCs near air holes. In this study, a unified viscoplastic constitutive model incorporating TGO growth is developed and integrated into a finite element framework. The model considers multiple factors, including TGO growth, creep–plasticity interaction, interface undulation, and temperature gradient. Additionally, an analytical solution for the non-uniform temperature field of a TBC is derived. The model is then applied to calculate interfacial stresses and accumulated strain energies in the TBC near an air hole, which promote interface debonding. The obtained results can be utilized to investigate the mechanisms of hole edge delamination in TBCs, considering the combined effects of multiple complex factors. A competition for the potential failure initiation location is revealed between the first oxide layer and the evolving TGO/bond coat interface. The developed viscoplasticity model demonstrates effective capability in modelling a range of dynamic behaviors that collectively contribute to hole edge delamination failure.

1. Introduction

Thermal barrier coatings (TBCs) are widely utilized in hot-section components, such as combustors, turbine blades, and vanes, due to their effective thermal insulation properties [1,2,3,4]. The TBC system consists of a multilayer structure, typically including the ceramic top coat (TC), thermally grown oxides (TGOs), metallic bond coat (BC), and superalloy substrate. Various types of air holes are strategically engineered in both hot-section components and applied TBCs to ensure stable combustion and efficient cooling in gas turbines. Secondary air holes, comprising primary holes and dilution holes, are machined into engine combustor liners, while film-cooling holes are present in both combustor liners and turbine blades. These holes have diameters ranging from hundreds of microns to tens of millimeters.
Near the air hole, complex stress and strain fields emerge due to thermal expansion misfit and the free-edge effect. Experimental observations have shown that under cyclic stresses, interfacial cracks can initiate from the hole edge and propagate towards the inboard region in multilayer structures, exacerbating the structural integrity of both TBCs and the underlying components [5]. Therefore, conducting strength assessments for the TBC near an air hole is crucial in the safety design of TBC systems and hot-section components. Hsueh et al. [6] identified that peeling stress perpendicular to the interface and shear stress contribute to hole edge delamination and spallation in TBCs near the air holes. Liu et al. [7] developed a finite element (FE) model for a guide vane coated with TBCs and explored the impact of film hole geometries on stress distributions. Chiu et al. [8] examined temperature and stress distributions in TBCs with film-cooling holes and calcium–magnesium–aluminum–silicate (CMAS) infiltration using a thermo–fluid–solid coupling FE model. However, the above studies simplified or overlooked the multilayered geometry of TBCs, particularly neglecting the presence of TGO, consequently failing to investigate crucial peeling and shear stresses near the TGO and hole edge. Jiang et al. [9,10] performed cyclic thermal tests and finite element (FE) simulations on TBCs with air holes. They observed a rise in interfacial stresses towards the hole, resulting in a notable decrease in the lifespan of TBCs. Cai et al. [11] explored the impact of TGO interface morphology on stress distribution near an inclined film-cooling hole using a two-dimensional FE model. The results indicated that the maximum tensile stress in the TC initially increased and then decreased with increasing amplitude. Importantly, the cyclic thermal load experienced by TBCs encompasses a wide temperature range, fluctuating from over 1000 °C to room temperature. The combination of severe load conditions with stress concentrations near the hole edge and TGO leads to plastic and creep deformations, which consequently interact with each other. However, in most studies, the materials of TBCs are assumed to be either elastic or ideally elastoplastic. This assumption neglects the nonlinearity of the stress–strain relationship and the strain rate effect caused by creep–plasticity interaction, potentially leading to remarkable errors in stress evaluation for TBCs with air holes under cyclic thermo-mechanical loading [12].
To accurately calculate stress and investigate the creep (viscous) and plastic behaviors of materials at elevated temperatures, two groups of viscoplasticity modelling frameworks have been developed over the past few decades: non-unified and unified constitutive modellings. In the non-unified viscoplastic model, creep and plastic strains are separately quantified as rate-dependent and -independent variables [13]. Therefore, predictions concerning ratcheting and the creep–plasticity interaction may not align with experimental results [14]. In contrast, the unified viscoplasticity model considers the viscoplastic strain as a unique rate-dependent quantity for the creep–plasticity interaction [15]. The present authors [16,17,18,19] developed a unified Chaboche–Lemaitre constitutive model integrating a power flow rule with nonlinear anisothermal evolution of isotropic and kinematic hardenings. Subsequently, in study [20], they implemented this model into a FE modelling framework for TBCs near air holes subjected to cyclic thermo-mechanical loading. Their findings revealed that the maximum interfacial peeling and shear stresses near the hole edge increase with the hole radius, raising the likelihood of edge delamination. However, it is noteworthy that the constitutive model and numerical modelling framework developed in [20] did not account for dynamic TGO growth and interface undulations, which play crucial roles in stress and strain energy distributions and evolutions in TBCs [1].
The bond coat in TBCs, typically composed of MCrAlY, is rich in aluminum. During prolonged exposure to high-temperature environments, oxygen anions diffuse inward through the TC and react with aluminum cations from the BC, resulting in the formation of α-Al2O3, the primary component of TGO [21]. Previous research has extensively simulated TGO growth, but few studies consider air holes and the creep–plasticity interaction [22,23,24,25,26,27,28]. Two predominant approaches for the mechanical equivalent method to model TGO growth are discussed: element volumetric swelling [24,25,26] and element conversion with the imposition of growth strains [23,27,28]. The former approach involves imposing swelling strains on a layer of elements in the initial TGO, thus limiting the growth thickness to usually not exceed the initial TGO thickness [24]. The latter approach allows for large-scale TGO thickening and provides a better description of the actual behavior of TGO growth [23]. The present work develops a unified viscoplastic constitutive model that couples the dynamic growth of TGO and derives an analytical solution for the non-uniform temperature field of TBCs. Integrating the constitutive model into a FE framework enables the effective investigation of interfacial stresses, strain energies, and hole edge delamination mechanisms in the TBC near an air hole. This study considers the combined effects of TGO growth, creep–plasticity interaction, interface undulation, temperature gradient, sintering, etc.
This paper is structured as follows: In Section 2, we elaborate on the development of an oxide growth-coupled unified viscoplastic constitutive model. Section 3 presents the derivation of an analytical solution for the temperature field of the TBC during the high-temperature holding phase. In Section 4, we explore the application of the developed constitutive model in TBCs near air holes, establishing a comprehensive viscoplasticity FE modelling framework. Here, we analyze the interfacial stresses and strain energies and examine the hole edge delamination mechanism under various factors. Finally, the paper concludes with a summary of key findings and conclusions in Section 5.

2. The Unified Viscoplastic Constitutive Model Incorporating TGO Growth

A unified viscoplastic constitutive model is presented to incorporate TGO growth and the creep–plasticity interaction in TBCs. This model is developed based on the advanced unified Chaboche–Lemaitre constitutive model for TBC systems proposed by the present authors in [20].

2.1. The Unified Viscoplasticity Model

In the unified viscoplasticity model, the viscoplastic strain is considered a single rate-dependent quantity, which incorporates the interaction between creep and plasticity. The strain resulting from TGO growth can be linearly superimposed onto the total strain [24]. Hence, the total strain ε i j is expressed by
ε i j = ε i j e + ε i j v p + ε i j T G O ,
where ε i j e , ε i j v p , and ε i j T G O are the elastic, viscoplastic, and TGO growth strain tensors, respectively. The quantity ε i j e is obtained by
ε i j e = D i j k l 1 σ k l ,
where D i j k l and σ k l are the stiffness and corresponding stress tensors, respectively. The viscoplastic strain rate ε ˙ i j v p is expressed by a power flow law, that is,
ε ˙ i j v p = p ˙ N i j = 3 2 f Z ( T ) n ( T ) S i j X i j S i j X i j ,
with
x = x ,   x > 0 0 ,   x 0
In Equation (3), p ˙ is the viscoplastic multiplier rate and defined as p ˙ = 2 / 3 ε ˙ i j v p : ε ˙ i j v p , and N i j indicates the viscoplastic flow direction. Z ( T ) and n ( T ) are temperature-dependent material parameters representing the viscoplastic resistance and viscous exponent functions, respectively. S i j is the deviatoric stress tensor of σ i j , which is given by
S i j = σ i j σ k k δ i j / 3 ,
where δ i j is the Kronecker delta. In addition, X i j in Equation (3) denotes the kinematic hardening, i.e., back stress tensor. In this constitutive model, the anisothermal evolution of X i j using the Chaboche decomposition [15] is given as
X i j = k = 1,2 X i j ( k )
and the rate of X i j is given as
X ˙ i j ( k ) ( T ) = γ ( k ) ( T ) 2 / 3 β ( k ) ( T ) ε ˙ i j v p X i j ( k ) ( T ) p ˙ + γ ( k ) ( T ) 1 γ , T ( k ) ( T ) + β ( k ) ( T ) 1 β , T ( k ) ( T ) X i j ( k ) ( T ) T ˙ ,
where γ ( k ) ( T ) and β ( k ) ( T ) are temperature-dependent material parameters and hardening moduli. The quantities γ , T ( k ) ( T ) and β , T ( k ) ( T ) represent the derivative of γ ( k ) ( T ) and β ( k ) ( T ) concerning temperature, respectively. Besides, T ˙ is the rate of temperature.
Furthermore, the von Mises yield function f in Equation (3) is given as
f ( σ i j , X i j , R , T ) = J 2 ( σ i j , X i j ) R ( T , p ( T ) ) σ i y ( T ) ,
where R ( T , p ( T ) ) is the isotropic hardening parameter, p ( T ) is the viscoplastic multiplier, and σ i y ( T ) is the yield stress. The anisothermal evolution of R ( T , p ( T ) ) is expressed by
R ˙ ( T , p ( T ) ) = μ ( T ) R ( T , p ( T ) ) + υ 1 ( T ) H ( T ) υ ( T ) p ˙ ( T ) + p ( T ) H , T ( T ) + R ( T , p ( T ) ) H ( T ) p ( T ) υ 1 ( T ) υ , T ( T ) + μ 1 ( T ) μ , T ( T ) T ˙ ,
where H ( T ) represents the linear drag stress evolution, υ ( T ) and μ ( T ) are temperature-dependent material parameters. The terms H , T ( T ) , υ , T ( T ) and μ , T ( T ) are the derivatives of H ( T ) , υ ( T ) and μ ( T ) concerning temperature. The second invariant J 2 in Equation (8) also depends on X i j and σ i j , which is expressed by
J 2 ( σ i j , X i j ) = 3 / 2 ( S i j X i j ) :   ( S i j X i j ) .

2.2. TGO Growth Modelling

In high-temperature environments, oxygen anions diffuse inward through the TC and react with Al cations from the BC at the TGO/BC interface and at the grain boundaries within TGO. This process leads to through-thickness and lateral growth strains, respectively, while the thickness of TGO increases [1,3,24]. Experimental observations indicate that the growth of TGO thickness, denoted as h, generally conforms to the parabolic law [1,25]:
h = A exp ( E A k B T ) t o x i d n o x i d + h 0 ,
where h 0 is the initial TGO thickness, A is the TGO growth coefficient, E A is the TGO growth activation energy, k B is the Boltzmann constant, t o x i d is the oxidation time, and n o x i d is the oxidation exponent.
As mentioned above, the TGO growth strain ε i j T G O in Equation (1) can be divided into two components, ε and ε , representing the strains normal and parallel to the TGO/BC interface, respectively. The corresponding growth strain rates can be calculated using Equations (12) and (13) [23,29]:
ε · = C o x h · / h = C o x n o x i d A exp ( E A k B T ) n o x i d t o x i d n o x i d 1 ( A exp ( E A k B T ) t o x i d ) n o x i d + h 0 ,
and
ε · = D o x h · = D o x n o x i d A exp ( E A k B T ) n o x i d t o x i d n o x i d 1 ,
where C o x and D o x are the through-thickness and lateral growth strain rate constants, respectively.
During the high-temperature holding phase, TGO undergoes growth. In the constitutive model, the material properties of the layer adjacent to the TGO transition gradually from those of the BC to TGO properties throughout the holding phase. This transition occurs layer by layer, with one layer transforming in each cycle. Simultaneously, both normal and parallel TGO growth strains are applied to the initial and converted TGO layers during the holding phases. Specifically, normal growth strains are applied during the holding phase when the layer is transforming to TGO. Subsequently, parallel growth strains are applied in the remaining holding phases after the layer has completed the conversion.

2.3. UMAT Implementation of the Constitutive Model

The developed unified viscoplastic constitutive model, which incorporates TGO growth, was implemented in a user-defined material subroutine (UMAT) for subsequent integration into a viscoplasticity FE modelling framework. The numerical implementation of this constitutive model employed the return mapping algorithm [30]. The process consists of two steps: elastic prediction and viscoplastic correction. In the first step, the total strain is assumed to be entirely elastic, and therefore, the viscoplastic strain and other internal variables are not considered. In the second step, known as viscoplastic correction, the total strain is held fixed while the internal variables evolve. This step involves numerical integrations of the rate-form equation of the viscoplastic strain, typically performed using the Newton–Raphson algorithm.
By employing Hooke’s law and the unified viscoplasticity framework, the following expressions can be derived:
σ = σ t r D : Δ ε v p ,
J 2 = J 2 t r 3 G p · Δ t , N = N t r ,
Φ   : = p · ( f / Z ( T ) ) ,
where Δ ε v p denotes the increment in the viscoplastic strain, G is the shear modulus, Δ t is the time increment, and σ t r , J 2 t r , N t r and Φ are the trial stress, trial second invariant, trial flow direction and viscoplastic residue, respectively.
The nullity of the residual function in Equation (16) can be used to solve the accumulated plastic strain when f > 0 . This is iteratively performed through the Newton–Raphson scheme. After rearrangement, the Newton increment in the accumulated plastic strain rate can be expressed as follows:
δ p · = n R ω + k Ω ( k ) : X ( k ) T · + Φ Δ t 1 Z n f 1 n Z n f 1 n + n Δ t 3 G + υ ( μ R ) + k γ ( k ) ( β ( k ) N : X ( k ) ) ,
where ω = μ 1 μ , T + υ 1 υ , T and Ω ( k ) = ( β ( k ) ) 1 γ ( k ) , T + ( γ ( k ) ) 1 β ( k ) , T .
The Newton–Raphson increment in the accumulated plastic strain, δ p , can be determined and updated by δ p = p · Δ t . When the norm of Φ is less than the tolerance, the iterative scheme stops and the time increment in the viscoplastic strain, Δ ε v p , is updated by Δ ε v p = N p · Δ t , while the total stress σ is corrected by Equation (14).

3. Analytical Solution for the Non-Uniform Temperature Field

From Equations (11)–(13), it is evident that the TGO growth rate and growth strains exhibit temperature dependence. This section derives the analytical solution for the non-uniform temperature field during the high-temperature holding phase, taking into account the thermal gradient.

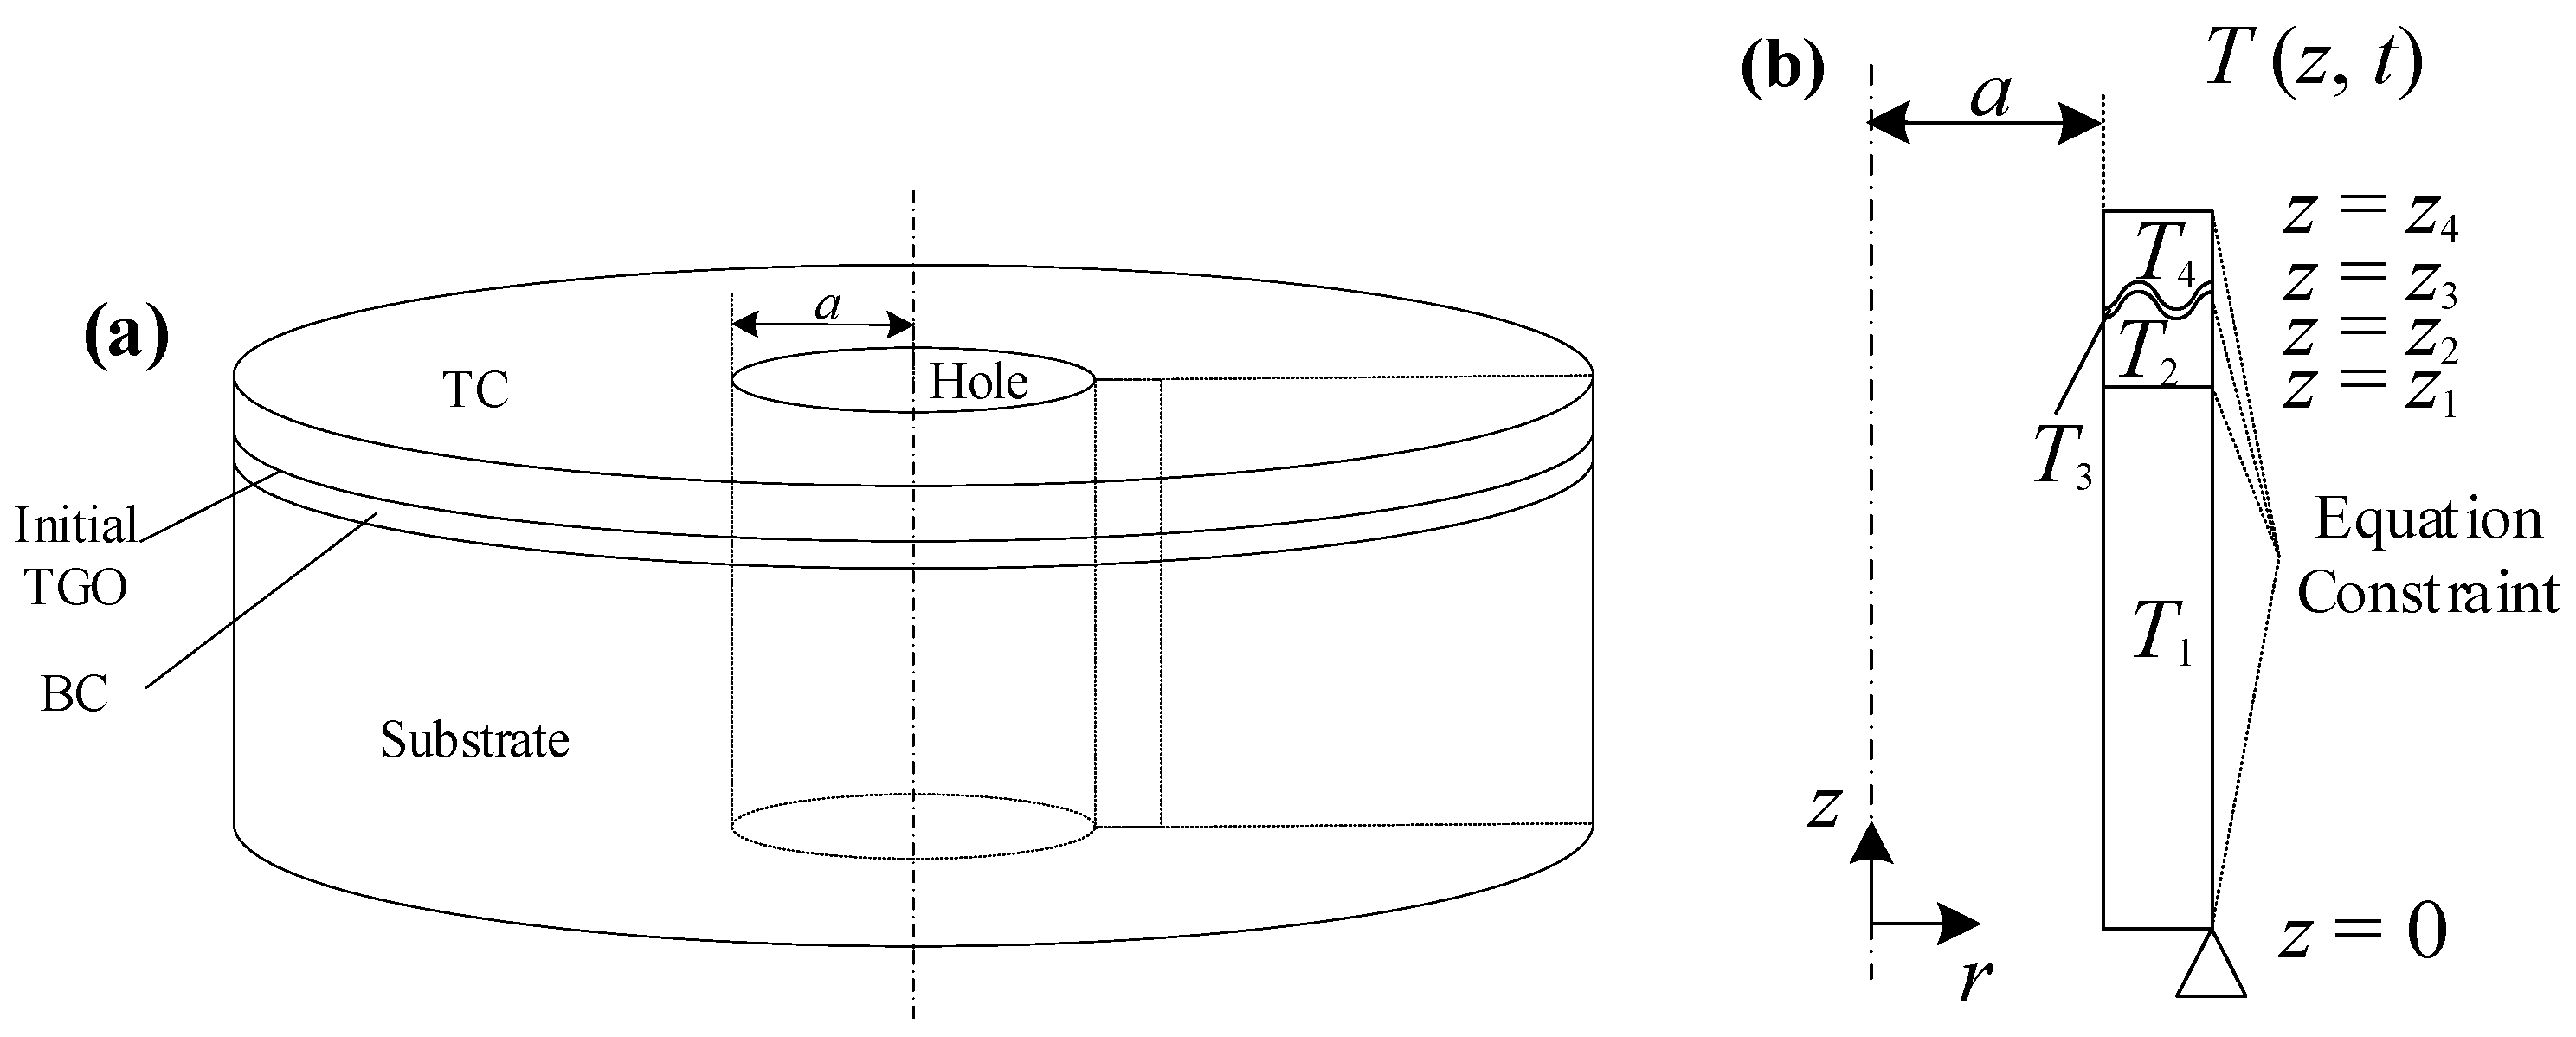
3.1. Problem Description

Figure 1a illustrates the three-dimensional axisymmetric structure of a TBC system with a central air hole. The system consists of four layers: substrate, BC, initial TGO, and TC. The top and bottom surfaces represent the hot and cooling sides, respectively, resulting in a temperature gradient along the thickness direction. The TBC under investigation experiences axisymmetric thermo-mechanical loads. Hence, we establish an axisymmetric unit model using a cylindrical coordinate system, depicted in Figure 1b. Here, the z-axis aligns with the centerline of the air hole, while the r-axis lies in the plane of the bottom. The surface of each layer is represented by z i , where the subscript i ranges from 1 to 4. Failures in TBCs commonly occur at or near the undulations of the TGO layer [31]. The model accounts for the irregular TC/TGO and TGO/BC interfaces by employing sinusoidal curves, as shown in Figure 1b.

3.2. Analytical Solution for the Non-Uniform Temperature Field

The temperature of the TBC remains constant during the high-temperature holding phase. Heat transfer within the TBC system along the thickness direction can be modeled as one-dimensional steady state. Therefore, the temperature in the ith layer of the TBC (see Figure 1b), denoted as T i , satisfies
d d z ( k i d T i d z ) = 0 ,
where k i is the conductivity coefficient for the ith layer. The corresponding heat flux q i can be expressed by
q i = k i d T i d z
Next, by integrating Equation (18) twice, the general solution for T i is obtained as
T i = A i z / k i + B i ,
where A i and B i are integration constants.
To identify A i and B i in Equation (20), the continuity conditions of the temperature and heat flux at the interfaces for the adjacent layers are employed. Since the amplitude of the interface roughness is merely 10 μm, it is reasonable to treat the TC/TGO and TGO/BC interfaces as flat surfaces when applying continuity conditions in the analytical derivation, which are
T i ( z i ) = T i + 1 ( z i )
and
q i ( z i ) = q i + 1 ( z i ) .
In addition, the temperature values on the top and bottom surfaces are also used as
T 4 ( z 4 ) = T t o p
and
T 1 ( 0 ) = T b o t t o m .
Substituting Equations (21)–(24) into Equation (20) leads to A i and B i :
A i = T t o p T b o t t o m z 1 ( 1 / k 1 1 / k 2 ) + z 2 ( 1 / k 2 1 / k 3 ) + z 3 ( 1 / k 3 1 / k 4 ) + z 4 / k 4 ,
B 1 = T b o t t o m ,
B 2 = T b o t t o m + z 1 ( 1 / k 1 1 / k 2 ) ( T t o p T b o t t o m ) z 1 ( 1 / k 1 1 / k 2 ) + z 2 ( 1 / k 2 1 / k 3 ) + z 3 ( 1 / k 3 1 / k 4 ) + z 4 / k 4
B 3 = T t o p z 3 ( 1 / k 3 1 / k 4 ) + z 4 / k 4 ( T t o p T b o t t o m ) z 1 ( 1 / k 1 1 / k 2 ) + z 2 ( 1 / k 2 1 / k 3 ) + z 3 ( 1 / k 3 1 / k 4 ) + z 4 / k 4 ,
and
B 4 = T t o p z 4 ( T t o p T b o t t o m ) / k 4 z 1 ( 1 / k 1 1 / k 2 ) + z 2 ( 1 / k 2 1 / k 3 ) + z 3 ( 1 / k 3 1 / k 4 ) + z 4 / k 4 .
The accuracy of the derived analytical solution for the temperature distribution of the TBC system during the high-temperature holding phase will be verified in Section 4.4.1.

4. Application of the Constitutive Model to Stress Analysis near an Air Hole within TBCs

Complex stresses develop and evolve near the air hole within TBCs owing to the free-edge effect, dynamic TGO growth, and severe cyclic thermo-mechanical loading. Moreover, creep and plastic deformations exist and interact. To analyze stress distribution and hole edge delamination in TBCs near air holes, the developed constitutive model is implemented and integrated into a FE modelling framework.

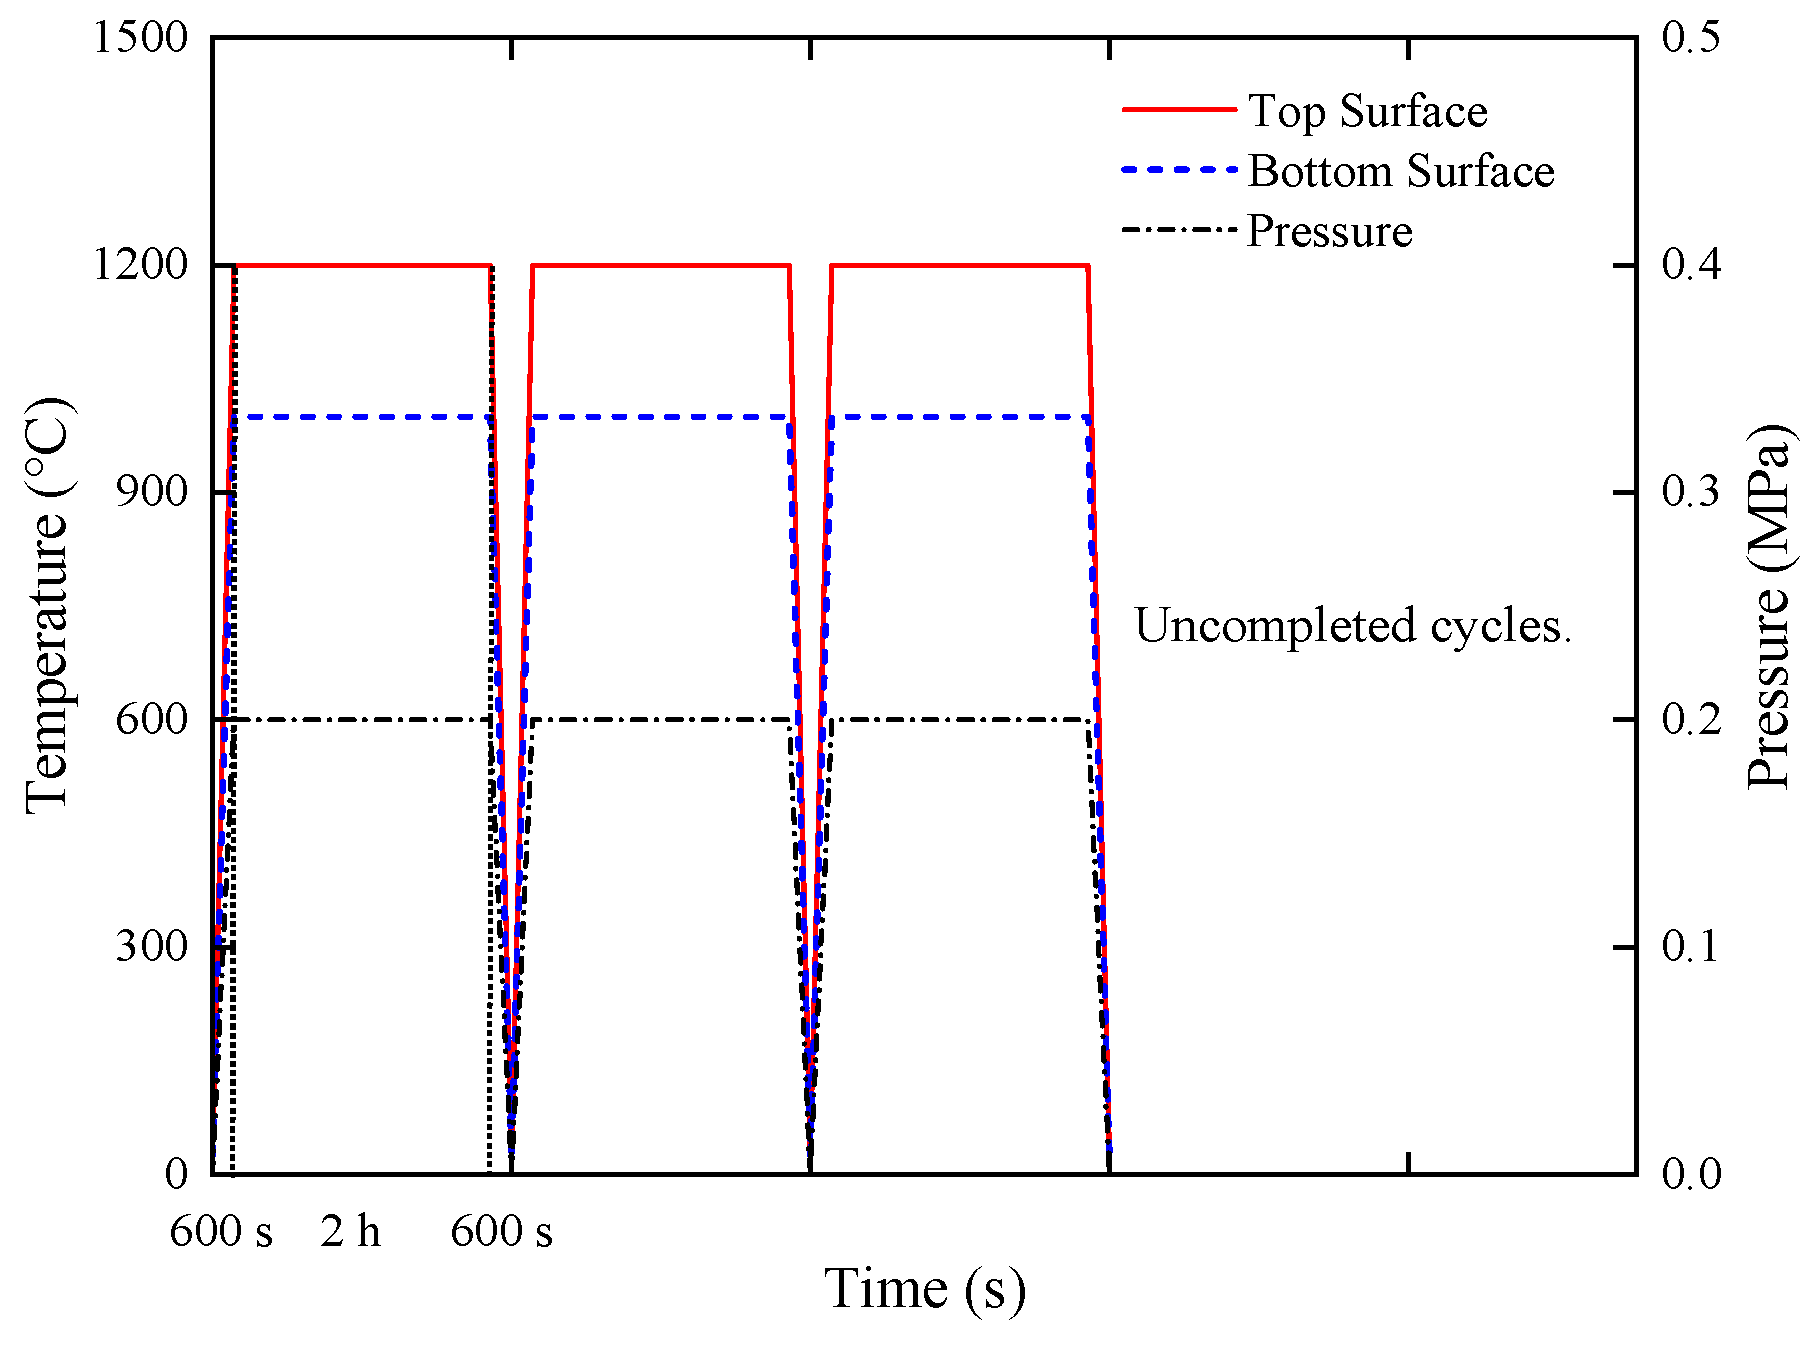
4.1. Cyclic Thermo-Mechanical Loading

The TBC system surrounding an air hole underwent cyclic thermo-mechanical loading for ten cycles. Each cycle lasted 8400 s and comprised a 10-minute heating phase, a 2-hour high-temperature holding phase, and a 10-minute cooling phase, as illustrated in Figure 2. In the heating phase, the temperatures of the TBC system gradually increased from an initial value of 25 °C to their maximum values during the high-temperature holding phase. Due to their effective thermal insulation properties, the TBCs exhibited a temperature gradient along their thickness direction. During the high-temperature holding phase, the temperatures on the top and bottom surfaces of the TBC system were 1200 °C and 1000 °C, respectively. In the cooling phase, the temperatures of the system gradually decreased from their maximum values to the final value of 25 °C. Thermal analyses determined the time-varying temperature distribution and thermal gradients during the heating and cooling phases. Apart from cyclic thermal loads, TBCs employed in hot-section components frequently encounter a pressure difference between their outer and inner surfaces. Acquiring a realistic time-dependent pressure load for TBCs in an aero-engine presents a challenge and it has often been either disregarded [32] or assumed to be constant [33]. Nevertheless, the pressure difference escalates with the increase in thermal load, peaking during engine operation [34]. Hence, in this study, the pressure difference Δ p ( t ) was presumed to be in sync with and linearly correlated to the temperature, as depicted in Figure 2. Within each cycle, the pressure difference increased from zero to its maximum value during the heating phase, remained constant throughout the holding phase, and subsequently decreased to zero during the cooling phase. A magnitude of 0.2 MPa was employed for the maximum pressure difference [34].

4.2. Finite Element Model

The sequentially coupled thermo-mechanical analysis comprised two steps: initially, a heat transfer simulation was performed to acquire the thermal input for the subsequent structural analysis and validate the derived analytical solution for the temperature field; subsequently, the structural analysis was executed utilizing the developed constitutive model from Section 2. Both heat transfer and structural analyses employed FE models with different settings, encompassing the input of material properties, element type, loading, and boundary conditions.
An axisymmetric FE model of the TBC system surrounding an air hole was constructed based on the geometry depicted in Figure 1b. The materials composing the substrate, BC, initial TGO, and TC were Inconel 718, NiCoCrAlY, α-Al2O3, and 8 wt.% yttria-stabilized ZrO2 (YSZ), respectively. The respective thicknesses were 1.2 mm, 150 μm, 1 μm, and 300 μm, with an additional air hole radius of 1.5 mm. The unit model encompassed one and a half wavelengths, incorporating features of peaks, valleys, and middles, as illustrated in Figure 3. The rough interface had a wavelength of 0.06 mm and an amplitude of 0.01 mm. The growth thickness of TGO in each cycle could be computed using Equation (11), utilizing the analytically determined temperature and the experimentally fitted growth coefficient A from [35]. Layers undergoing conversion from BC to TGO in loading cycles, denoted as growth layers l ranging from 1 to 10, were geometrically established in the FE model, as shown in Figure 3.
In the heat transfer simulation, the temperature histories depicted in Figure 2 were applied as boundary conditions to the top and bottom surfaces of the TBC system. In the structural simulation, the outer edge of the model could move radially but remained in a plane using the equation constraint [20,36], as illustrated in Figure 1b. The displacement in the z-direction of the bottom point at the outer edge, as depicted in Figure 1b, was constrained to position the FE model. Additionally, the top and bottom surfaces, as well as the hole edge, were unconstrained in the structural analysis.
Perfect bonding was assumed between adjacent layers. The geometry of the model was partitioned appropriately prior to meshing. The FE model was meshed using eight-node axisymmetric elements with reduced integration schemes. DCAX8 and CAX8R element types were employed for heat transfer and structural analyses, respectively. Mesh refinements were locally applied near the hole edge, initial TGO, and TGO growth layers, as depicted in Figure 4. Sensitivity analyses of the meshing strategy were conducted to detect potential issues associated with element mixing and size. Thermo-mechanical responses, including temperature and stress, remained stable with a minimum element size of 0.03 μm in local regions. Additionally, there was no evidence of element mixing at the boundaries in the sensitivity analyses. The FE model comprised 20,504 elements and 61,963 nodes. This approach ensures adequate computational accuracy at reasonable costs.

4.3. Material Properties

Table 1 lists the thermophysical properties, such as thermal conductivity k and specific heat C, of the four constituent layers [37,38,39,40], while Table 2 presents the thermal and mechanical properties, including the thermal expansion coefficient, Poisson’s ratio, elastic modulus, and yield stress [40,41,42,43,44]. The TGO, BC, and substrate layers utilized the embedded viscoplastic constitutive model with the parameters detailed in Table 3 [41], while the TC layer was assumed to be elastic [42]. The unified viscoplasticity constitutive model for the superalloy Inconel 718, commonly employed in TBC systems, has been validated in prior research [20], demonstrating good agreement with experimental results [45].
Elevated temperatures can induce sintering within the TC layer. The mechanical property evolution of the TC layer due to sintering was considered. During the high-temperature holding phase, micro-pores and micro-cracks underwent healing, while sintering contacts formed to bridge the gaps. The porosity of the TC layer decreased, leading to an increase in Young’s modulus over time. Experimental observations indicated an increase in the Young’s modulus of TC at a rate of 0.2% per hour under comparable conditions [46]. The initial Young’s modulus of the TC, denoted as E T C , 0 , is provided in Table 2, while the evolving Young’s modulus E T C was determined by the following equation:
E T C = E T C , 0 + E T C , 0 a T C t o x i d
where a T C is the evolution rate of Young’s modulus of the TC layer.

4.4. Results and Discussion

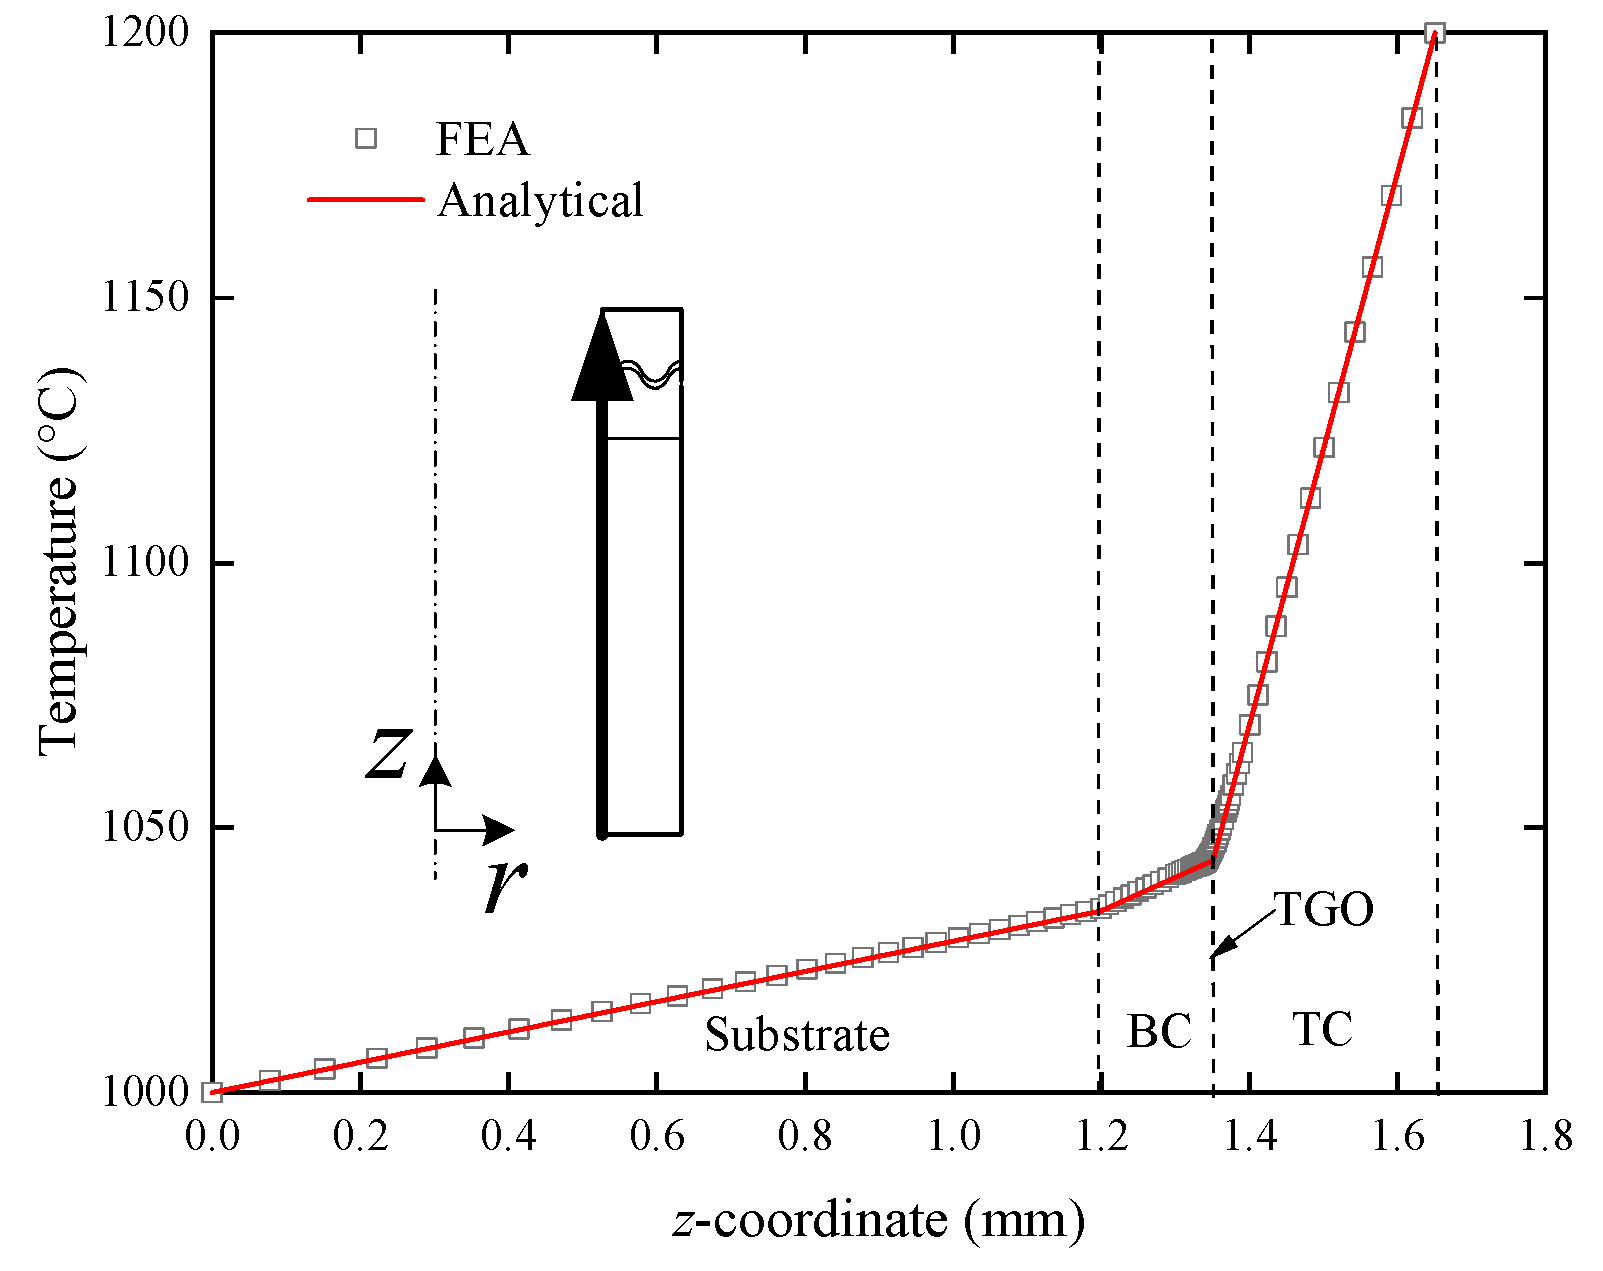
4.4.1. Temperature Fields: Analytical and Numerical Solutions

Heat transfer FE analysis was performed to validate the analytically predicted temperature field and to obtain the thermal load input for the subsequent thermo-mechanical coupling analysis. Prior to the formal heat transfer FE analysis, a preliminary heat transfer simulation accounting for material conversion occurring over multiple cycles was conducted, aiming to assess its impact on temperature values. This simulation utilized the user subroutine USDFLD, enabling the redefinition of field variables at material points, to facilitate the conversion of thermophysical properties from the BC to the TGO within the transforming layers. The results indicate that the material conversion resulting from TGO growth minimally affected the temperature distribution within the TGO layer. Therefore, neglecting TGO growth in the heat transfer analysis was justified.
As described in Section 4.1, each cycle comprised three phases: the heating phase, high-temperature holding phase, and cooling phase. Figure 5 illustrates the simulated temperature fields of the TBC system in various phases throughout a cycle. As shown in Figure 5a,e, the initial and final temperatures of the system were both 25 °C. Throughout the heating phase, the temperature gradually increased, accompanied by the emergence of a thermal gradient along the thickness direction. In the heating phase, the temperature difference between the top and bottom surfaces was 100 °C at 300 s, subsequently escalating to its peak of 200 °C during the high-temperature holding phase, as illustrated in Figure 5b,c. The thermal gradient exacerbated the thermal expansion mismatch, resulting in a more pronounced stress field near the air hole and interfaces. The proposed modelling framework utilizes the time-varying thermal outputs from the heat transfer FE analysis as inputs for the subsequent structural analysis, facilitating the incorporation of thermal gradient and time-varying temperature fields into the framework. Figure 6 presents the simulated and analytically calculated temperatures along the thickness direction of the TBC during the high-temperature holding phase, demonstrating excellent agreement between the two. The analytical formulae accurately predicted the non-uniform temperature field of the TBC during the high-temperature holding phase. Utilizing the analytically predicted temperature of the TGO layer to calculate the TGO growth rate in each cycle using Equation (11) was reliable. Moreover, the temperature of the TGO layer during the holding phase was 1044 °C. Figure 6 also shows that the temperature increased from 1000 °C at the bottom to 1200 °C at the top surface. The thermal gradient within the TC layer was much higher than in other layers due to its lower thermal conductivity.

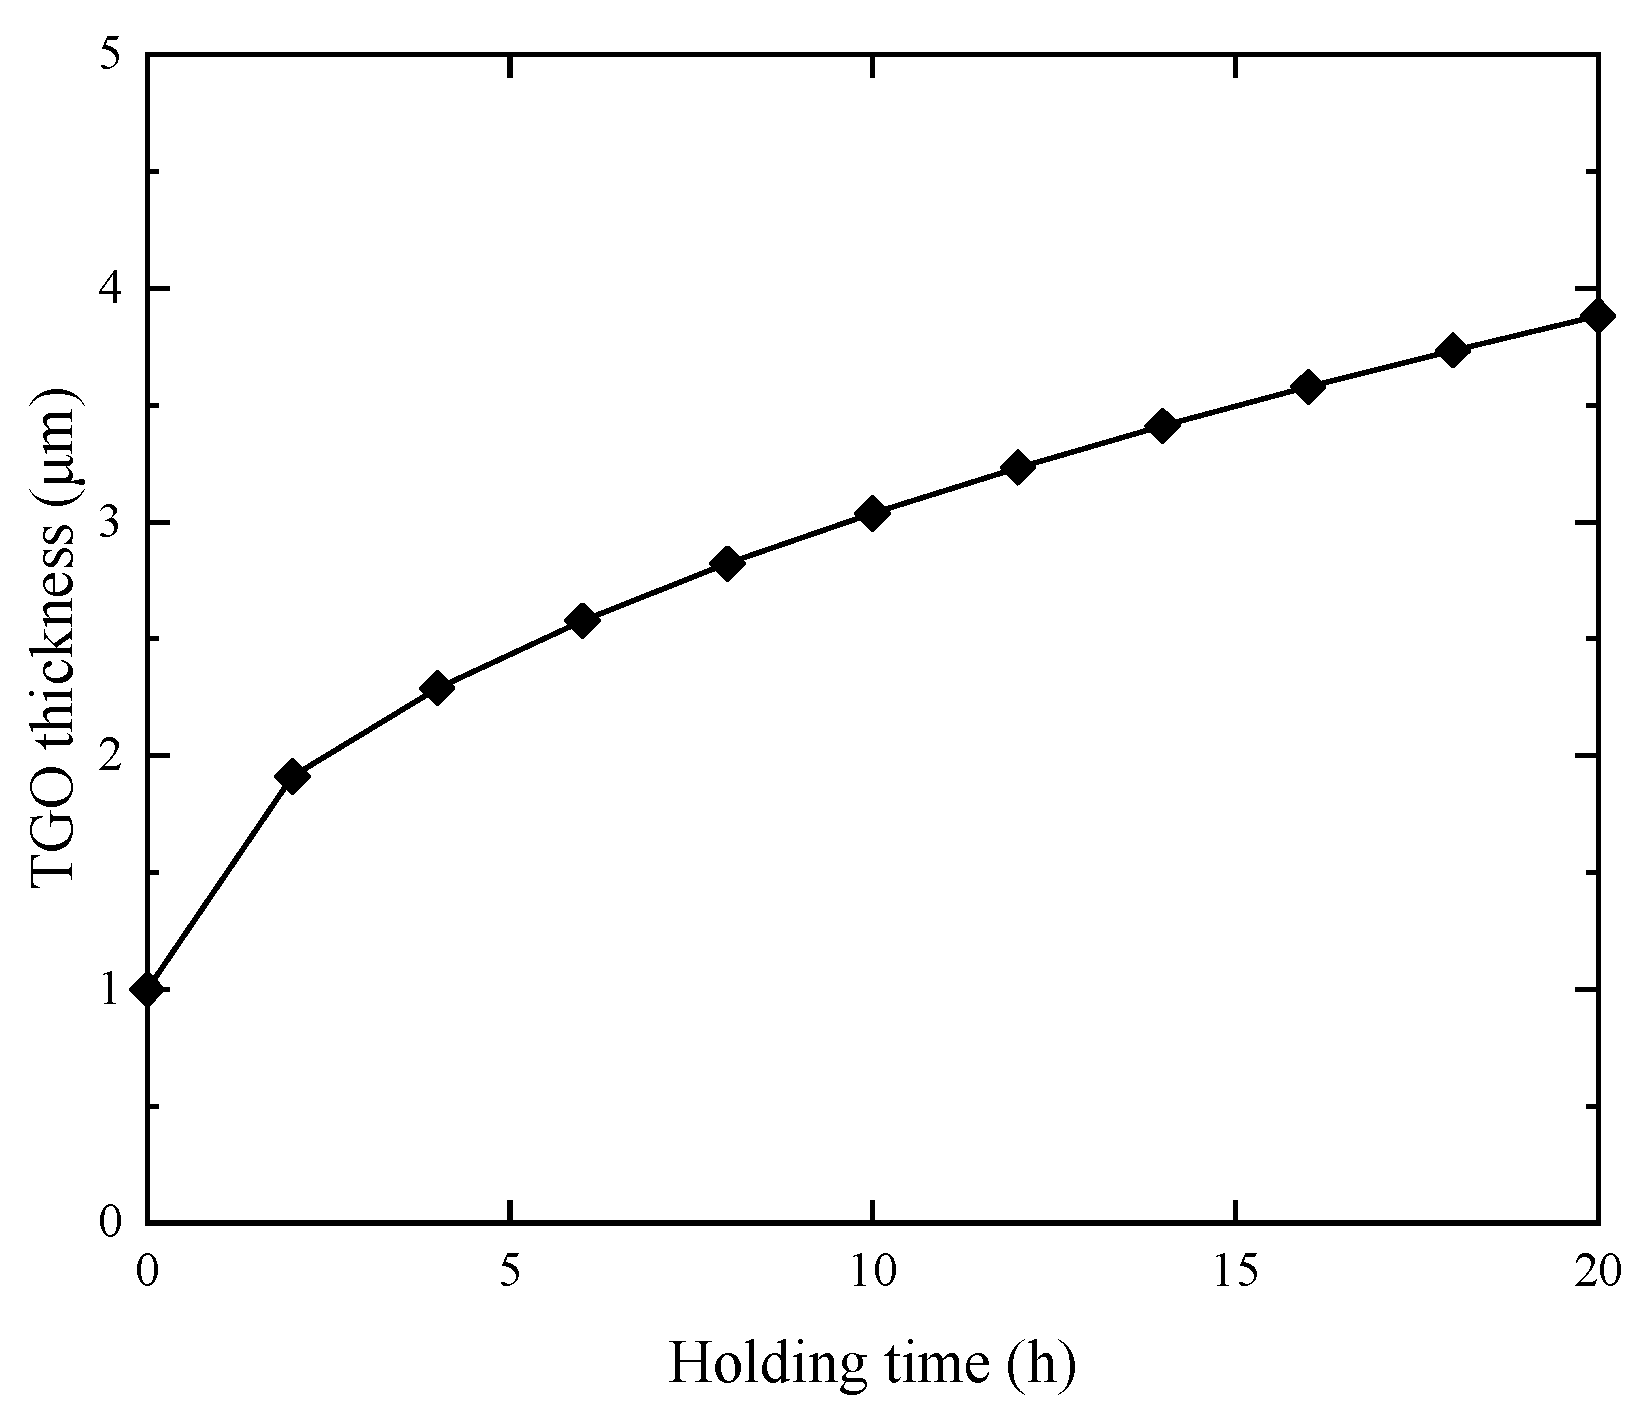
4.4.2. TGO Growth Thickness

Utilizing the temperature of the TGO layer during the holding phase, along with the experimentally determined growth parameters [35], enabled the calculation of the TGO growth rate and thickness for each cycle using Equations (11)–(13). TGO underwent growth during the high-temperature holding phase, with the TGO thickness over the holding time for ten cycles depicted in Figure 7. Over ten cycles, the TGO thickness increased from an initial value of 1 μm to 3.88 μm. The growth rate progressively decreased throughout the holding time. The decline in the TGO growth rate over time in TBCs can be ascribed to several factors, including aluminum consumption, the formation of protective oxide layers, and diffusion limitations, among others.

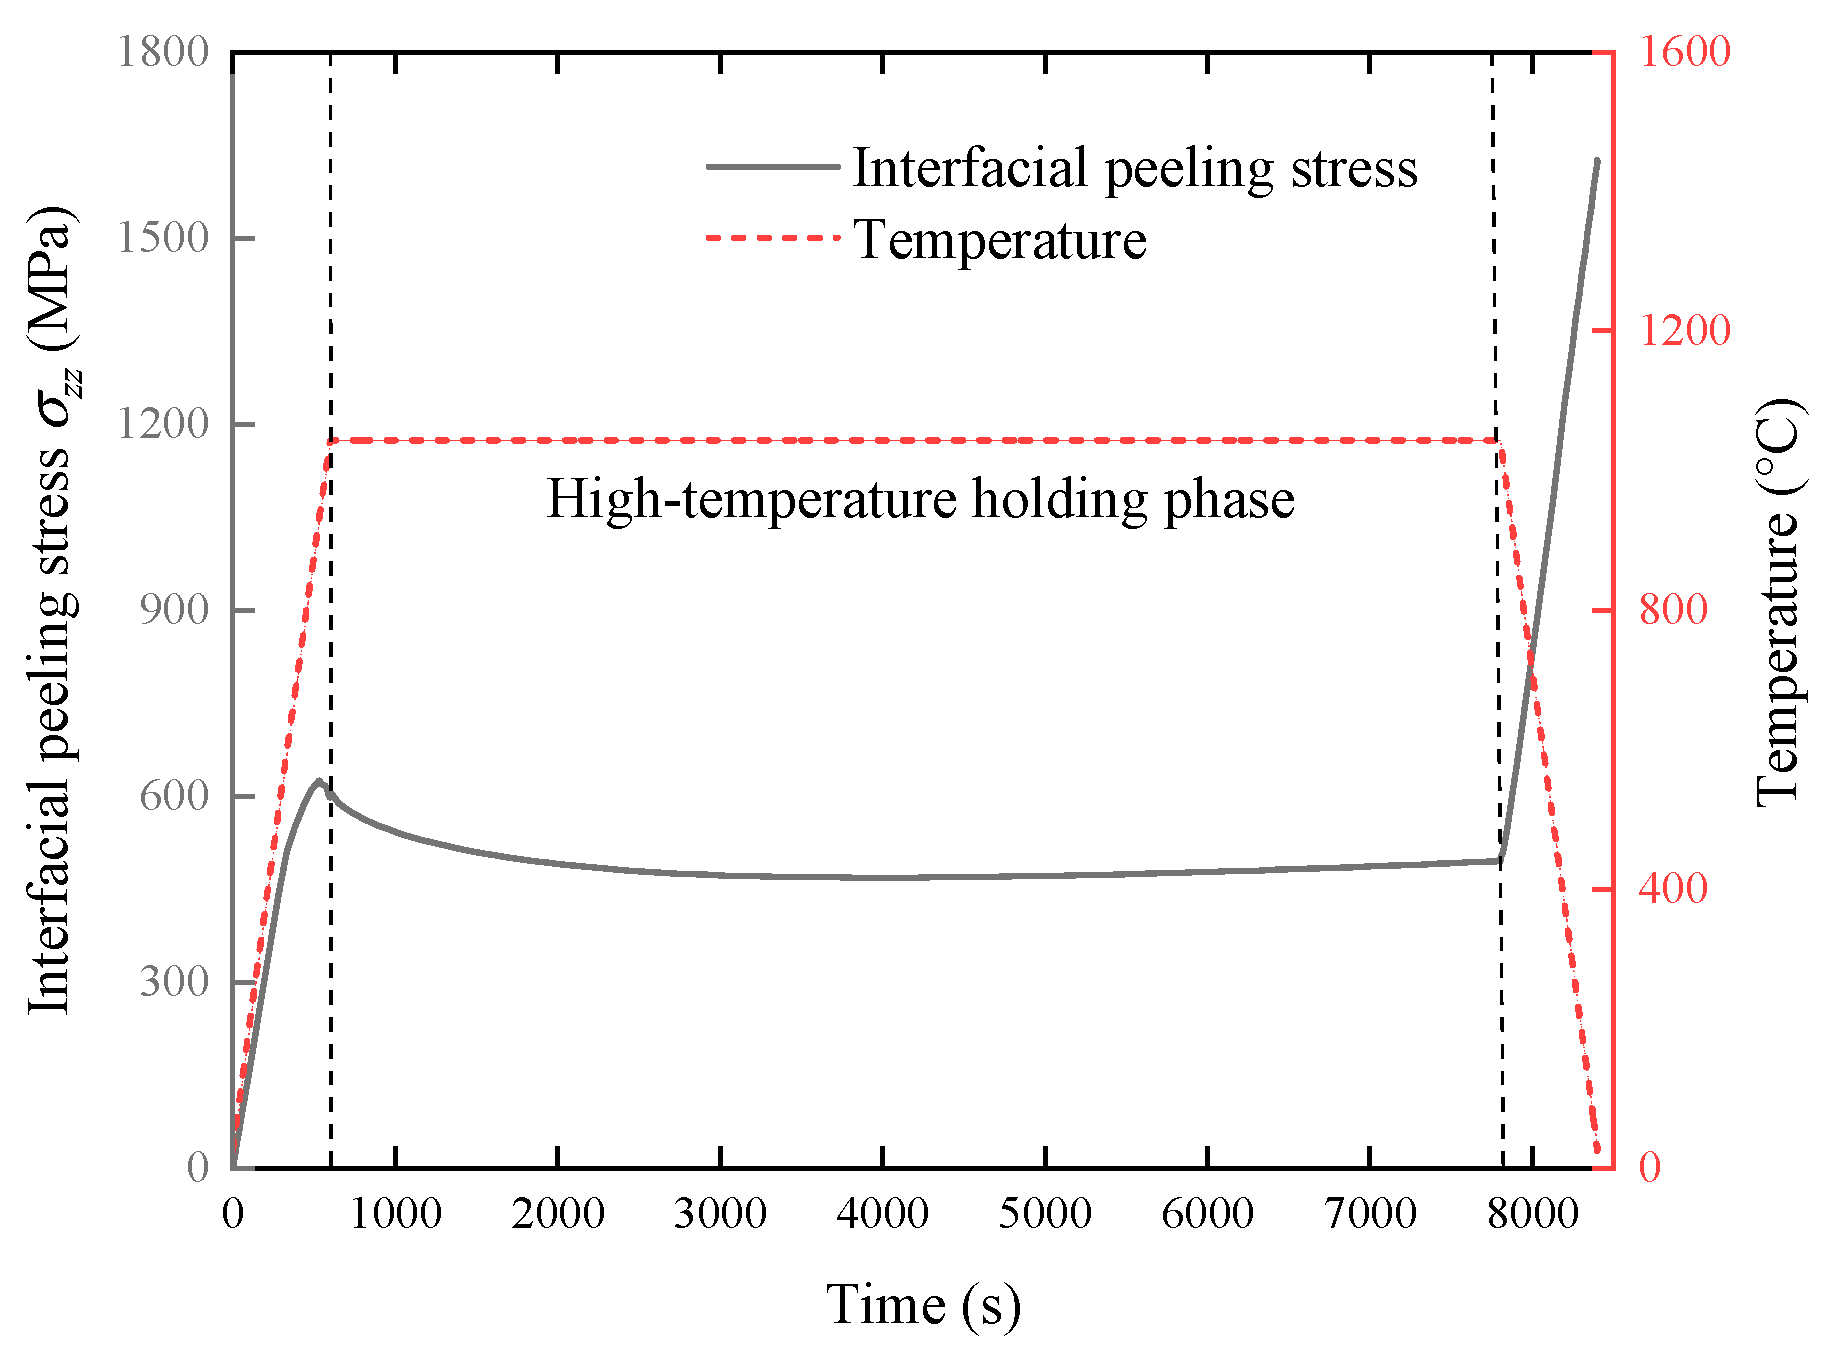
4.4.3. Interfacial Stresses

Prior to examining the interfacial out-of-plane stresses, in-plane radial stresses within the TGO were initially derived from the thermo-mechanical analysis outputs. The maximum compressive radial stress after the final cycle was 2.832 GPa, aligning with findings from previous studies in the literature [47,48]. These compressive in-plane stresses exacerbate the propensity for rumpling in the TGO layer, consequently fostering buckling and interface delamination.
Within TBCs, stress redistribution near the hole edge induces interfacial peeling stress σ z z perpendicular to the interface and shear stress τ z r parallel to the interface. Tensile peeling stress and shear stress facilitate normal and shear interfacial separations, respectively. The combined influence of these interfacial stresses and interface imperfections, such as undulations and voids, can lead to the initiation of interfacial cracks near the hole edge. Throughout continuous thermo-mechanical cycles, interfacial cracks propagate and merge with interfacial cracks or vertical cracks in the TC layer, ultimately resulting in delamination and spallation failures [1,49]. Figure 8 illustrates the evolution of σ z z at the interface between growth layers 1 and 2 during the first cycle. During the heating phase, σ z z increased to 625.5 MPa at 536 s due to rising temperature and thermal mismatch. Meanwhile, the yield strengths of the BC, TGO, and substrate materials decreased with rising temperature. After 536 s, σ z z began to decrease due to the decrease in yield strengths, reaching 597.6 MPa at 600 s. During the high-temperature holding phase, slow time-dependent deformation occurred in and near the TGO layer due to the creep (viscosity) effect, leading to a gradual decrease in interfacial stress, as depicted in Figure 8. In particular, the interfacial σ z z gradually diminished to 495.5 MPa at the end of the high-temperature holding phase. The inhibitory effect on interfacial stresses caused by creep can delay the initiation of cracks. Figure 8 also illustrates a significant increase in interfacial σ z z during the cooling phase, reaching 1625.6 MPa at the end of the first cycle. This rise is primarily attributed to two factors. Firstly, completion of the conversion of growth layer 1 from the BC to the TGO by the end of the high-temperature holding phase of the first cycle positioned the investigated σ z z at the interface between the TGO and BC layers, where thermal mismatch was particularly severe. Secondly, stresses near the interfaces entered a yielding state during the high-temperature holding phase, and as the temperature decreased, the yield strengths of the materials increased. The combined effects of severe thermal mismatch and increasing yield strengths contributed to the significant rise in interfacial σ z z after the high-temperature holding phase and during the cooling phase.
Figure 9 displays the distributions of σ z z near the hole edge and TGO after various cycles. The results indicate that tensile σ z z primarily resided in the area neighboring the hole edge and the evolving TGO/BC interface. This suggests that mode-I crack and edge delamination, induced by tensile σ z z , are more likely to occur at the TGO/BC interface near the hole edge rather than at the TC/TGO interface. With cycle progression, high-magnitude tensile peeling stresses gradually shifted downward along the hole edge toward the evolving TGO/BC interface. Additionally, the maximum residual σ z z after one cycle initially trended upward in early cycles, followed by a slight decrease in later cycles, attributed to a viscous effect induced by high-temperature environments. The spatial movement and magnitude escalation of interfacial σ z z under cyclic thermo-mechanical loading exacerbate the likelihood of crack initiation at the TGO/BC interface near the hole edge in TBC systems.
The evolutions of σ z z near the hole edge at four interfaces are depicted in Figure 10. Figure 10b,d show a change in the direction of interfacial σ z z from compression to tension after the layer above underwent oxidation, with the maximum interfacial σ z z occurring simultaneously. This change in stress direction and magnitude is attributed to oxide growth, which introduced severe thermal mismatch at the evolving TGO/BC interface. Consequently, tensile peeling stress increased, enhancing the likelihood of interfacial crack initiation and propagation near the hole edge. Subsequently, the interfacial σ z z gradually decreased with cycle progression, as the layer below oxidized to the same material as the TGO above, moving away from the evolving TGO/BC interface and the associated thermal mismatch. This observation aligns with prior research [50]. Furthermore, the maximum interfacial shear stress τ z r was observed in the middle region of the wavy interface, near the TC/TGO interface. This suggests that mode-II crack initiation due to interfacial τ z r is more likely to occur at the TC/TGO interface in regions between the peak and valley.

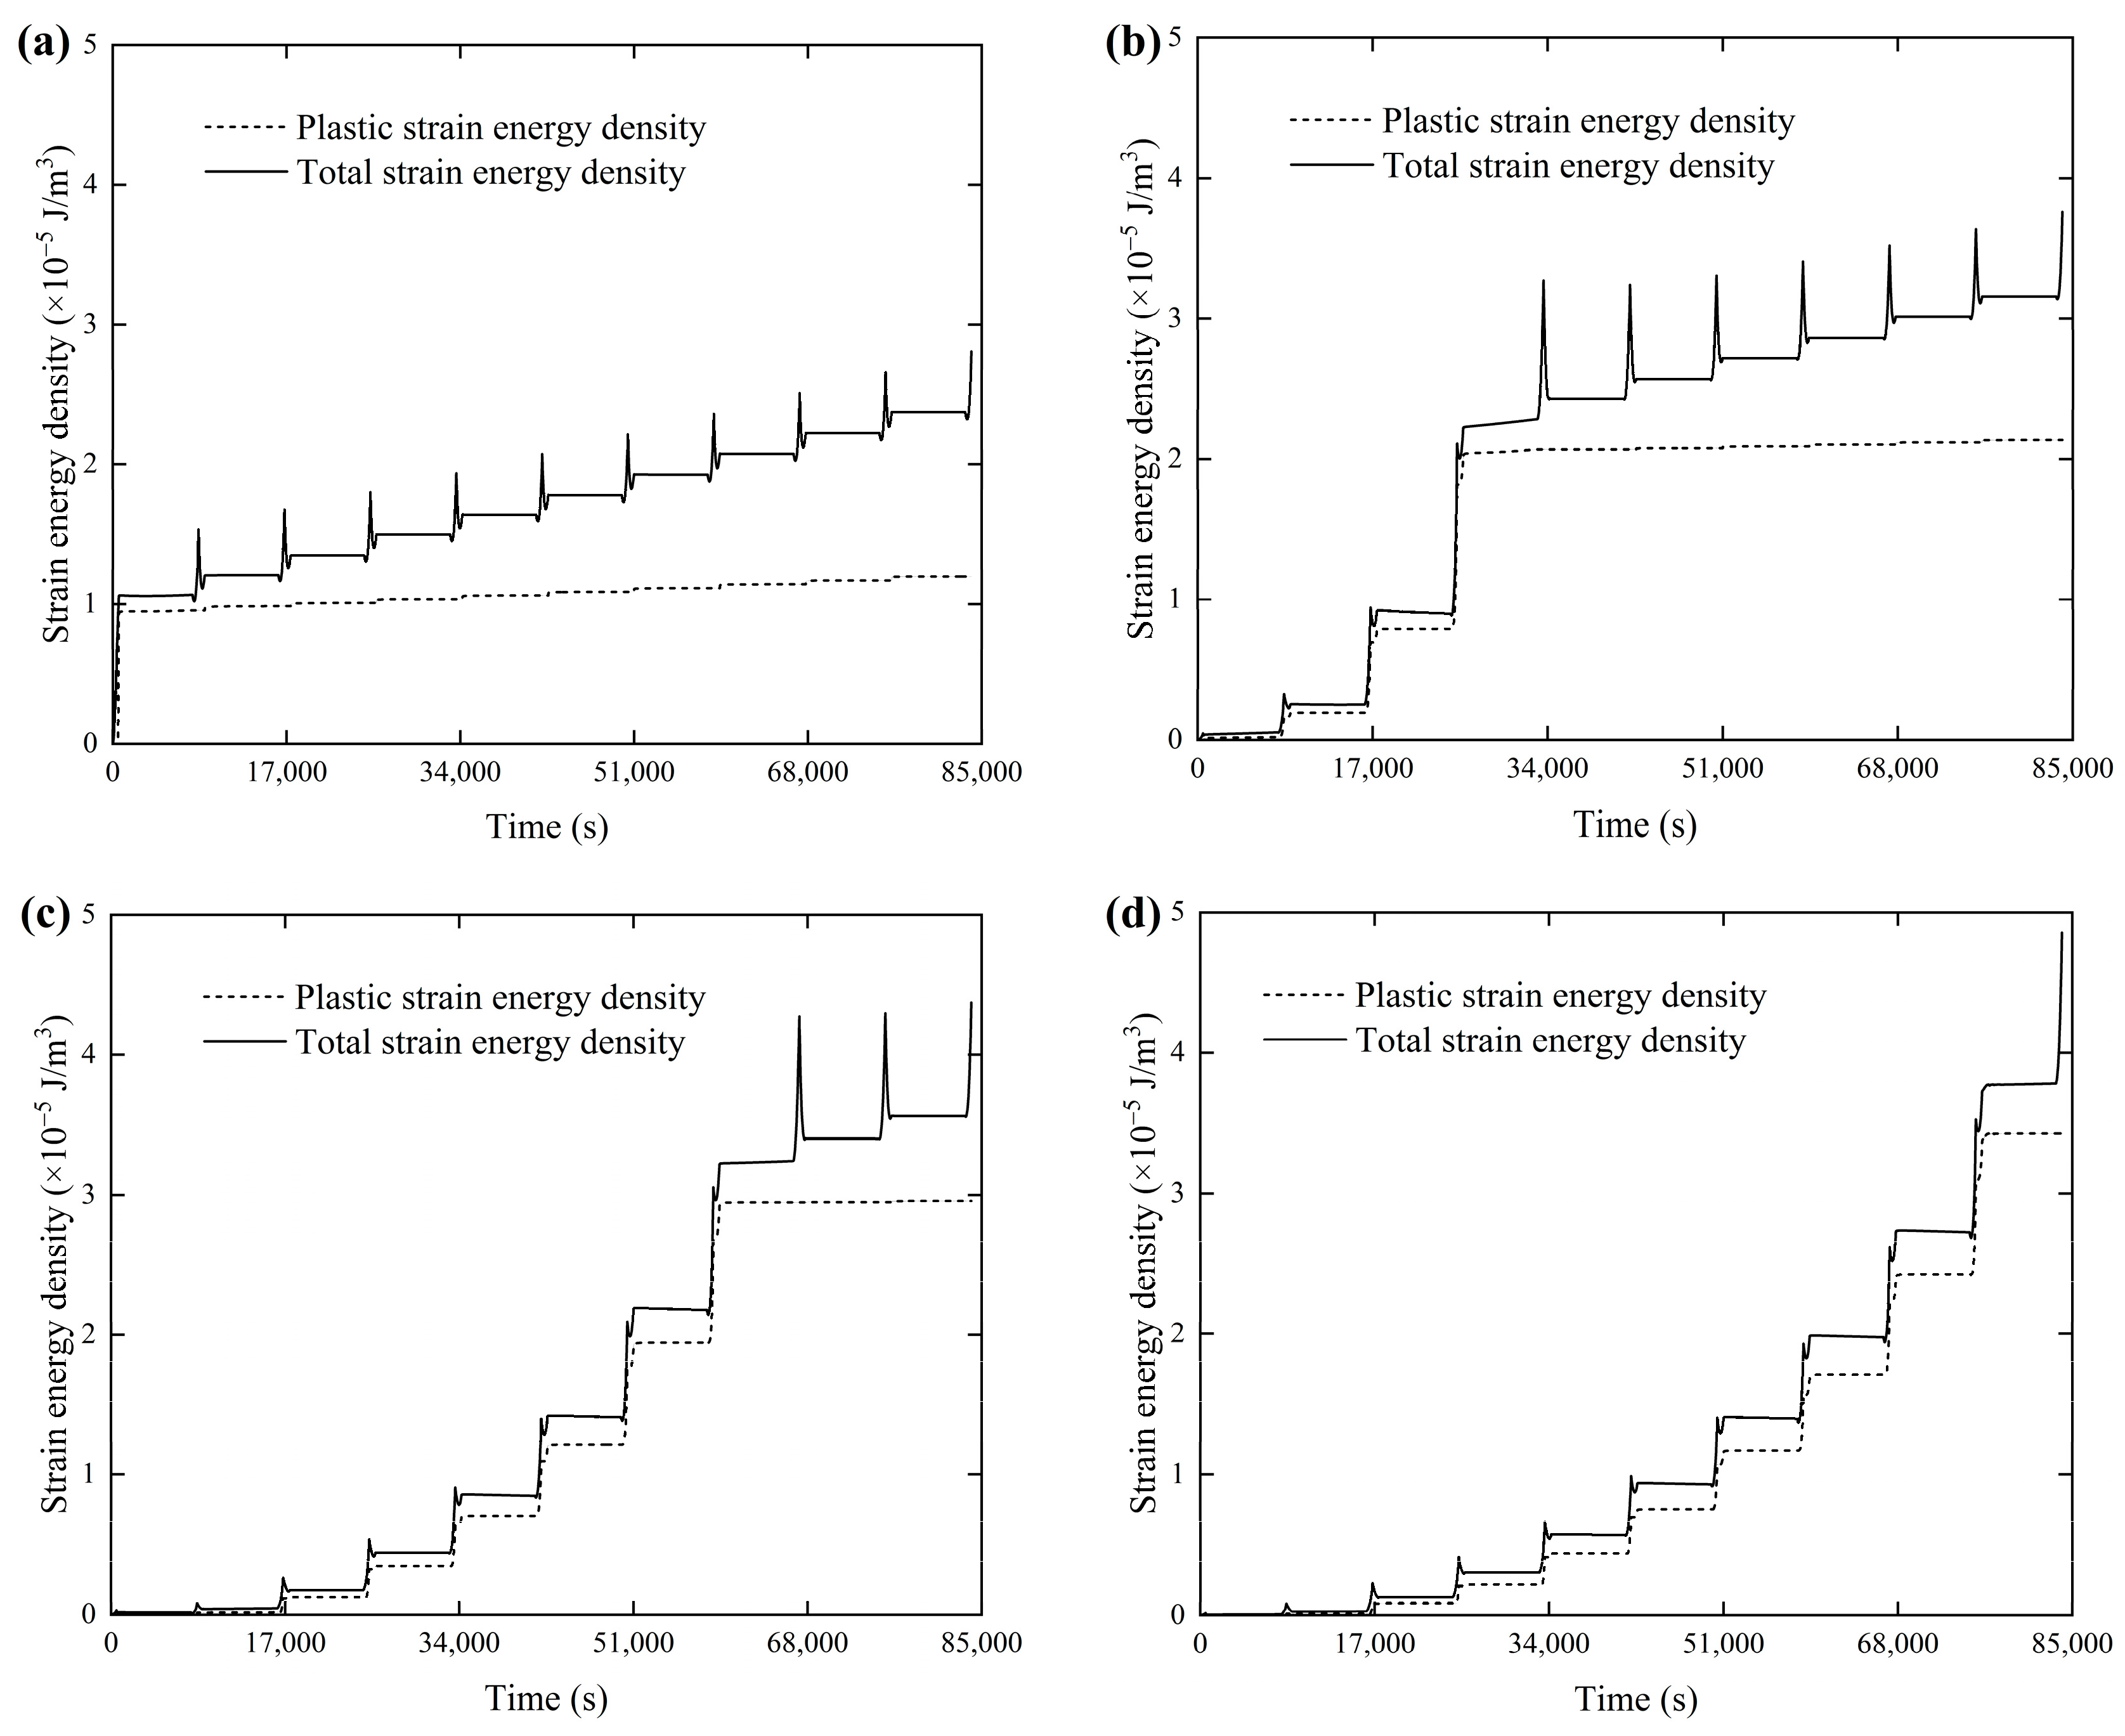
4.4.4. Strain Energy Density

The strain energy represents the energy stored within the TBC due to deformations during thermo-mechanical loading cycles, while the strain energy density quantifies the amount of strain energy per unit volume. Irreversible plastic strain energies exacerbate the damage in TBCs caused by cyclic thermo-mechanical loading. The findings indicate that the total and plastic strain energy densities, denoted as u t and u p , respectively, were higher in the growth layers near the hole edge compared to other regions, with their maximum values increasing with each cycle. Particularly, location competition for the maximum u p was found between the first growth layer and the evolving TGO/BC interface. The u p near the first growth layer increased to 3.177 × 10⁻⁵ J/m3 after the first cycle, gradually rising to 3.279 × 10⁻⁵ J/m3 by the final cycle. Meanwhile, the maximum u p near the evolving TGO/BC interface rose from 1.53 × 10⁻⁵ J/m3 after the first cycle to 3.42 × 10⁻⁵ J/m3 by the final cycle, surpassing the value near the first growth layer. This location competition for the maximum plastic strain energy implies a competition for potential failure initiation between the first oxide growth layer and the evolving TGO/BC interface in TBCs with air holes. Initially, energy-driven cracks were prone to initiate near the first oxide growth layer, while in later cycles, they tended to initiate near the evolving TGO/BC interface.
The evolutions of u t and u p in growth layers near the hole edge are plotted in Figure 11. They demonstrate that u p increases in steps before the layer above oxidizes to TGO; then, it experiences a more significant increment during the cooling phase of the cycle when the layer above oxidizes to TGO. Subsequently, it stabilizes. The findings concerning the strain energies demonstrate that, due to the combined influences of the hole edge, TGO growth, creep–plasticity interaction, interface undulation, cyclic thermo-mechanical loading, and temperature gradient, damage accumulates and intensifies near the hole edge and TGO interfaces over the cycles, rendering this region a potential failure zone susceptible to edge-delamination. In particular, prolonged TGO growth can markedly escalate damage accumulation and the likelihood of failure. Moreover, the results underscore the importance, in the design of TBCs for hot-section components, of not only ensuring that air holes meet the requirements for engine combustion and cooling but also evaluating the strength of the TBC system near the hole edge and TGO interfaces.

5. Summary and Concluding Remarks

A unified viscoplastic constitutive model incorporating TGO growth is developed and integrated into a finite element modelling framework for TBCs near air holes. A reliable analytical solution for the non-uniform temperature field is obtained. The framework comprehensively accounts for various complex factors such as dynamic TGO growth, creep–plasticity interaction, interface undulation, temperature gradient, and sintering, facilitating accurate modelling of the dynamic behaviors leading to hole edge delamination failure. Several key findings and conclusions are summarized as follows:
(1)
The derived analytical solution for the non-uniform temperature field of the TBC in the high-temperature holding phase agrees well with the simulation. Thus, utilizing the analytically predicted temperature of the TGO layer to compute the TGO growth thickness and growth strains is reliable.
(2)
The calculated in-plane stresses in the TGO layer, determined using the developed viscoplastic constitutive model integrating the dynamic growth of TGO, align well with experimental findings reported in the literature [47,48].
(3)
Integrating TGO growth into the viscoplastic constitutive model facilitates comprehensive analyses of stress evolution near the evolving TGO/BC interface, enhancing the comprehension of hole edge delamination mechanisms under the combined effects of multiple factors. TGO growth can shift the direction of peeling stress near an air hole from compression to tension, thus facilitating interface debonding.
(4)
Irreversible plastic strain energy concentrates in the TGO growth layers near the hole edge, intensifying damage induced by cyclic thermo-mechanical loading. Importantly, competition for the potential failure initiation site is revealed between the first TGO growth layer and the evolving TGO/BC interface.
Future experiments are anticipated to acquire and calibrate the material parameters in the developed viscoplastic constitutive model for the coating layers. Nonetheless, this study establishes a foundation for future modelling developments that may explore interfacial delamination, crack propagation, thermo-mechano-chemical coupling, and non-uniform oxidation during TGO growth, alongside the influences of grain size and orientation in TBCs with air holes.

Author Contributions

Conceptualization, P.C. and W.S.; methodology, P.C., B.Y., X.G. and W.S.; validation, P.C.; formal analysis, P.C.; investigation, P.C.; resources, Z.W.; data curation, P.C.; writing—original draft preparation, P.C.; writing—review and editing, B.Y. and W.S.; visualization, P.C.; supervision, B.Y., X.G. and W.S.; funding acquisition, X.G. and Z.W. All authors have read and agreed to the published version of the manuscript.

Funding

This research was supported by the National Natural Science Foundation of China (Grant No. 51805274); the Central Government in Guidance of Local Science and Technology Development (Grant No. 2022ZY0074); the Natural Science Foundation of the Inner Mongolia Autonomous Region (Grant No. 2021MS01011); the Science and Technology Youth Talent Development Program of Inner Mongolia Autonomous Region (Grant No. NJYT22071); and the Ph.D. exchange program of the China Scholarship Council (CSC) (Grant No. 201906020051).

Institutional Review Board Statement

Not applicable.

Informed Consent Statement

Not applicable.

Data Availability Statement

Data are contained within the article.

Conflicts of Interest

The authors declare no conflicts of interest.

References

  1. Evans, A.G.; Mumm, D.R.; Hutchinson, J.W.; Meier, G.H.; Pettit, F.S. Mechanisms controlling the durability of thermal barrier coatings. Prog. Mater. Sci. 2001, 46, 505–553. [Google Scholar] [CrossRef]
  2. Darolia, R. Thermal barrier coatings technology: Critical review, progress update, remaining challenges and prospects. Int. Mater. Rev. 2013, 58, 315–348. [Google Scholar] [CrossRef]
  3. Padture, N.P.; Gell, M.; Jordan, E.H. Thermal barrier coatings for gas-turbine engine applications. Science 2002, 296, 280–284. [Google Scholar] [CrossRef]
  4. Thakare, J.G.; Pandey, C.; Mahapatra, M.M.; Mulik, R.S. Thermal barrier coatings—A state of the art review. Met. Mater. Int. 2021, 27, 1947–1968. [Google Scholar] [CrossRef]
  5. Moore, T.D.; Jarvis, J.L. Peeling in bimaterial beams: The peeling moment and its relation to the differential rigidity. J. Appl. Mech. 2004, 71, 290–292. [Google Scholar] [CrossRef]
  6. Hsueh, C.H.; Luttrell, C.R.; Lee, S.; Wu, T.C.; Lin, H.Y. Interfacial peeling moments and shear forces at free edges of multilayers subjected to thermal stresses. J. Am. Ceram. Soc. 2006, 89, 1632–1638. [Google Scholar] [CrossRef]
  7. Liu, Z.Y.; Zhu, W.; Yang, L.; Zhou, Y.C. Numerical prediction of thermal insulation performance and stress distribution of thermal barrier coatings coated on a turbine vane. Int. J. Therm. Sci. 2020, 158, 106552. [Google Scholar] [CrossRef]
  8. Chiu, C.C.; Tseng, S.S.; Chao, C.K.; Fan, X.L.; Cheng, W.H. Interfacial stresses of thermal barrier coating with film cooling holes induced by CMAS infiltration. Coatings 2022, 12, 326. [Google Scholar] [CrossRef]
  9. Jiang, J.; Jiang, L.; Cai, Z.; Wang, W.; Zhao, X.; Liu, Y.; Cao, Z. Numerical stress analysis of the TBC-film cooling system under operating conditions considering the effects of thermal gradient and TGO growth. Surf. Coat. Technol. 2019, 357, 433–444. [Google Scholar] [CrossRef]
  10. Jiang, J.; Wu, D.; Wang, W.; Zhao, X.; Ma, X.; Wang, B.; Shi, H. Fracture behavior of TBCs with cooling hole structure under cyclic thermal loadings. Ceram. Int. 2020, 46, 3644–3654. [Google Scholar] [CrossRef]
  11. Cai, Z.W.; Hong, H.; Peng, D.; Zhao, X.F.; Wang, W.Z.; Liu, Y.Z. A numerical study of the influence of interface morphology on the stress behavior in thermal barrier coatings near an inclined film-cooling hole. Ceram. Int. 2020, 46, 18142–18150. [Google Scholar] [CrossRef]
  12. Chen, Y.Q.; Zhang, J.; Yu, P.S.; Wang, W.B.; Zhao, J.H. Strain-rate effect on the stress and strain concentration in a visco-plastic plate with an elliptic hole. Int. J. Steel Struct. 2020, 20, 1256–1267. [Google Scholar] [CrossRef]
  13. Velay, V.; Bernhart, G.; Penazzi, L. Cyclic behavior modeling of a tempered martensitic hot work tool steel. Int. J. Plast. 2006, 22, 459–496. [Google Scholar] [CrossRef]
  14. Krempl, E. Viscoplastic models for high temperature applications. Int. J. Solids Struct. 2000, 37, 279–291. [Google Scholar] [CrossRef]
  15. Chaboche, J.L. A review of some plasticity and viscoplasticity constitutive theories. Int. J. Plast. 2008, 24, 1642–1693. [Google Scholar] [CrossRef]
  16. Benaarbia, A.; Rae, Y.; Sun, W. Unified viscoplasticity modelling and its application to fatigue-creep behaviour of gas turbine rotor. Int. J. Mech. Sci. 2018, 136, 36–49. [Google Scholar] [CrossRef]
  17. Benaarbia, A.; Rouse, J.P.; Sun, W. A thermodynamically-based viscoelastic-viscoplastic model for the high temperature cyclic behaviour of 9–12% Cr steels. Int. J. Plast. 2018, 107, 100–121. [Google Scholar] [CrossRef]
  18. Rae, Y.; Benaarbia, A.; Hughes, J.; Sun, W. Experimental characterisation and computational modelling of cyclic viscoplastic behaviour of turbine steel. Int. J. Fatigue 2019, 124, 581–594. [Google Scholar] [CrossRef]
  19. Guo, X.F.; Benaarbia, A.; Sun, W.; Becker, A.; Morris, A.; Pavier, M.; Flewitt, P.; Tierney, M.; Wales, C. Optimisation and thermo-mechanical analysis of a coated steam dual pipe system for use in advanced ultra-supercritical power plant. Int. J. Press. Vessel. Pip. 2020, 186, 104157. [Google Scholar] [CrossRef]
  20. Chen, P.F.; Yuan, B.; Guo, X.F.; Xiong, Y.X.; Wan, Z.Q.; Sun, W. Interfacial peeling loads in the TBC with an air hole: Analytical solutions and viscoplasticity modelling. Ceram. Int. 2022, 48, 27388–27400. [Google Scholar] [CrossRef]
  21. Liu, J.; Lu, Z.; Zhou, Y.; Zhang, J.; Lyu, G. A review on the failure behavior and countermeasures of thermal barrier coatings. J. Ceram. Process. Res. 2023, 24, 285–307. [Google Scholar] [CrossRef]
  22. Buschinelli, M.; Huang, X.; Chen, W. TGO evolution and coating property changes for EB-PVD TBC coatings under cyclic oxidation condition. In Proceedings of the Turbo Expo, Glasgow, UK, 14–18 June 2010; The American Society of Mechanical Engineers: New York, NY, USA, 2010; Volume 43963, pp. 891–898. [Google Scholar] [CrossRef]
  23. Chen, Z.; Jia, W.; Zhao, K.; Fang, L. Comparison of stress evolution under TGO growth simulated by two different methods in thermal barrier coatings. Ceram. Int. 2020, 46, 2915–2922. [Google Scholar] [CrossRef]
  24. Karlsson, A.M.; Evans, A.G. A numerical model for the cyclic instability of thermally grown oxides in thermal barrier systems. Acta Mater. 2001, 49, 1793–1804. [Google Scholar] [CrossRef]
  25. Cen, L.; Qin, W.Y.; Yu, Q.M. Analysis of interface delamination in thermal barrier coating system with axisymmetric structure based on corresponding normal and tangential stresses. Surf. Coat. Technol. 2019, 358, 785–795. [Google Scholar] [CrossRef]
  26. Ranjbar-Far, M.; Absi, J.; Mariaux, G.; Dubois, F. Simulation of the effect of material properties and interface roughness on the stress distribution in thermal barrier coatings using finite element method. Mater. Des. 2010, 31, 772–781. [Google Scholar] [CrossRef]
  27. Wei, Z.Y.; Cai, H.N.; Meng, G.H.; Tahir, A.; Zhang, W.W. An innovative model coupling TGO growth and crack propagation for the failure assessment of lamellar structured thermal barrier coatings. Ceram. Int. 2020, 46, 1532–1544. [Google Scholar] [CrossRef]
  28. Wang, L.; Li, Z.; Ding, K.; Deng, C.; Zhang, S.; Zheng, R.; Yang, L.; Lin, X. Effects of TGO growth on the stress distribution and evolution of three-dimensional cylindrical thermal barrier coatings based on finite element simulations. Ceram. Int. 2022, 48, 7864–7875. [Google Scholar] [CrossRef]
  29. Sun, Y.; Li, J.; Zhang, W.; Wang, T.J. Local stress evolution in thermal barrier coating system during isothermal growth of irregular oxide layer. Surf. Coat. Technol. 2013, 216, 237–250. [Google Scholar] [CrossRef]
  30. Simo, J.C.; Hughes, T.J. Computational Inelasticity; Springer Science & Business Media: New York, NY, USA, 2006. [Google Scholar]
  31. Wang, X.; Fan, X.; Sun, Y.; Xu, R.; Jiang, P. Modelling and analysis of the oxide growth coupling behaviour of thermal barrier coatings. J. Mater. Sci. 2019, 54, 10270–10283. [Google Scholar] [CrossRef]
  32. Shrivastava, S.; Andrade, P.; Carpenter, V.; Masal, R.; Nakod, P.; Orsino, S. Multi-physics simulation based approach for life prediction of a gas turbine combustor liner. In Proceedings of the Turbo Expo, Phoenix, AZ, USA, 17–21 June 2019; The American Society of Mechanical Engineers: New York, NY, USA, 2019; Volume 58646, p. V05AT20A001. [Google Scholar] [CrossRef]
  33. Hong, J.; Gao, J.; Ma, Y.; Chen, M. Local thermal buckling analysis method of combustor liner. In Proceedings of the Turbo Expo, Orlando, FL, USA, 8–12 June 2009; The American Society of Mechanical Engineers: New York, NY, USA, 2009; Volume 48845, pp. 1373–1386. [Google Scholar] [CrossRef]
  34. Fan, Y.H. Structural Design Criteria for Aviation Turbojet and Turbofan Engines; Aviation Industry Corporation of China, Ltd.: Beijing, China, 1997. [Google Scholar]
  35. Traeger, F.; Ahrens, M.; Vaßen, R.; Stöver, D. A life time model for ceramic thermal barrier coatings. Mater. Sci. Eng. A 2003, 358, 255–265. [Google Scholar] [CrossRef]
  36. Jiang, J.; Ma, X.; Wang, B. Stress analysis of the thermal barrier coating system near a cooling hole considering the free-edge effect. Ceram. Int. 2020, 46, 331–342. [Google Scholar] [CrossRef]
  37. Hermosilla, U. Mechanical Modelling of Thermal Barrier Coatings at High Temperatures. Ph.D. Thesis, University of Nottingham, Nottingham, UK, 2008. [Google Scholar]
  38. Munro, R.G. Evaluated material properties for a sintered alpha-alumina. J. Am. Ceram. Soc. 1997, 80, 1919–1928. [Google Scholar] [CrossRef]
  39. Khor, K.A.; Gu, Y.W. Thermal properties of plasma-sprayed functionally graded thermal barrier coatings. Thin Solid. Films 2000, 372, 104–113. [Google Scholar] [CrossRef]
  40. Widjaja, S.; Limarga, A.M.; Yip, T.H. Modeling of residual stresses in a plasma-sprayed zirconia/alumina functionally graded-thermal barrier coating. Thin Solid. Films 2003, 434, 216–227. [Google Scholar] [CrossRef]
  41. Liu, F.L. Research on Thermomechanical Fatigue Behavior and Life Prediction Approaches of Nickel-Based Superalloy. Master’s Thesis, Nanjing University of Aeronautics and Astronautics, Nanjing, China, 2019. [Google Scholar]
  42. Białas, M. Finite element analysis of stress distribution in thermal barrier coatings. Surf. Coat. Technol. 2008, 202, 6002–6010. [Google Scholar] [CrossRef]
  43. Bednarz, P. Finite Element Simulation of Stress Evolution in Thermal Barrier Coating Systems. Ph.D. Thesis, Forschungszntrum Jülich, GmbH, Germany, 2006. [Google Scholar]
  44. Zhou, Y.C.; Hashida, T. Coupled effects of temperature gradient and oxidation on thermal stress in thermal barrier coating system. Int. J. Solids Struct. 2001, 38, 4235–4264. [Google Scholar] [CrossRef]
  45. Sun, J.Y.; Yuan, H. Cyclic plasticity modelling of nickel-based superalloy Inconel 718 under multi-axial thermo-mechanical fatigue loading conditions. Int. J. Fatigue 2019, 119, 89–101. [Google Scholar] [CrossRef]
  46. Zotov, N.; Bartsch, M.; Eggeler, G. Thermal barrier coating systems—Analysis of nanoindentation curves. Surf. Coat. Technol. 2009, 203, 2064–2072. [Google Scholar] [CrossRef]
  47. Stiger, M.J.; Yanar, M.M.; Topping, M.G.; Pettit, F.S.; Meier, G.H. Thermal barrier coatings for the 21st century. Int. J. Mater. Res. 1999, 90, 1069–1078. [Google Scholar] [CrossRef]
  48. Christensen, R.J.; Lipkin, D.M.; Clarke, D.R.; Murphy, K.S. Nondestructive evaluation of the oxidation stresses through thermal barrier coatings using Cr3+ piezospectroscopy. Appl. Phys. Lett. 1996, 69, 3754–3756. [Google Scholar] [CrossRef]
  49. Naumenko, D.; Shemet, V.; Singheiser, L.; Quadakkers, W.J. Failure mechanisms of thermal barrier coatings on MCrAlY-type bondcoats associated with the formation of the thermally grown oxide. J. Mater. Sci. 2009, 44, 1687–1703. [Google Scholar] [CrossRef]
  50. Wang, T.J.; Fan, X.L. Thermal Barrier Coating Strength Theory and Detection Technology; Xi’an Jiaotong University Press: Xi’an, China, 2016. [Google Scholar]
Figure 1. Schematic diagrams of the TBC with a central air hole: (a) three-dimensional axisymmetric structure; (b) the axisymmetric unit model.
Coatings 14 00362 g001
Figure 2. Cyclic thermo-mechanical loading for the TBC system near an air hole.
Coatings 14 00362 g002
Figure 3. Local geometry of the axisymmetric FE model of the TBC system around an air hole.
Coatings 14 00362 g003
Figure 4. Local mesh refinements of the TBC FE model.
Coatings 14 00362 g004
Figure 5. The FE simulated temperature fields of the TBC in different phases during a cycle: (a) the initial state at t = 0 s; (b) the heating phase at t = 300 s; (c) the high-temperature holding phase at t = 7800 s; (d) the cooling phase at t = 8100 s; (e) the final state at t = 8400 s.
Coatings 14 00362 g005
Figure 6. Simulated and analytically predicted temperatures along the thickness direction of the TBC in the high-temperature holding phase.
Coatings 14 00362 g006
Figure 7. TGO thickness with respect to the holding time in ten cycles.
Coatings 14 00362 g007
Figure 8. The evolution of interfacial peeling stress σ z z at the growth layer 1/2 interface during the first cycle.
Coatings 14 00362 g008
Figure 9. Distributions of peeling stress σ z z near the hole edge after different cycles: (a) N = 1; (b) N = 2; (c) N = 4; (d) N = 6; (e) N = 8; (f) N = 10.
Coatings 14 00362 g009
Figure 10. Evolutions of interfacial peeling stress σ z z near the hole edge: (a) initial TGO/growth layer 1; (b) growth layer 1/2; (c) growth layer 4/5; (d) growth layer 10/BC.
Coatings 14 00362 g010
Figure 11. Evolutions of total and plastic strain energy densities near the hole edge in (a) initial TGO; (b) growth layer 4; (c) growth layer 8; (d) growth layer 10.
Coatings 14 00362 g011
Table 1. Thermophysical properties of the constituent layers in the TBC system.
T (°C)k (W/m °C)C (J/kg °C)T (°C)k (W/m °C)C (J/kg °C)
TC (YSZ) [37]TGO (α-Al2O3) [38]
251.4998455.602033.0000755.00
1271.4998516.1450011.40001165.00
3271.4998568.0810007.22001255.00
5271.4998595.6712006.67001285.00
7271.4998616.77
9271.4998635.44
11271.4998652.48
11771.4998719.84
BC (NiCoCrAlY) [39]Substrate (Inconel 718) [40]
284.3042542.902511.5000431.00
3005.9646659.2040017.3000524.00
5006.9534712.1080023.8000627.00
7009.7197738.50
90010.6836757.50
110013.1745772.00
Table 2. Thermal and mechanical properties of the constituent layers in the TBC system.
T (°C)α (10−6/°C)νE (GPa)σiy (MPa)
TC (YSZ) [42]
209.68000.217.500/
2209.67480.216.341
4209.70580.215.182
6209.80980.214.023
82010.02400.212.864
102010.38400.211.705
TGO (α-Al2O3) [42,43]
205.07940.27380.3658000.0
2205.90400.27369.0608000.0
4206.72850.27361.2258000.0
6207.55310.27351.8765433.3
8208.37760.27336.0322866.7
10209.20220.27308.708300.0
BC (NiCoCrAlY) [42,44]
2012.3580.3189151.857426.0
22013.0410.3271150.746410.4
42013.9120.3343145.253392.6
62014.970.3409132.337354.2
82016.2170.3466108.921275.8
102017.6520.351571.890184.4
Substrate (Inconel 718) [40,41]
2014.40.30204.988729.0
22014.40.30194.868728.8
42014.40.30184.748726.3
62014.40.30174.628695.5
82014.40.30164.508313.6
102014.40.30154.388313.6
Table 3. Material parameters in the unified viscoplastic constitutive model for the TBC system [41].
Mechanical FeatureParameterTemperature-Dependent Value
Nonlinear viscosityZ (MPa.s1/n)−1.4 × 10−1T + 9.82 × 10²
n1.04 × 10−3T + 3.27
Nonlinear kinematic hardening β 1 (MPa)−2.89 × 10⁻²T + 2.01 × 10²
γ 1 1.32 × 10⁻¹T + 4.13 × 10²
β 2 (MPa)−1.66 × 10⁻²T + 1.99 × 10²
γ 2 1.72 × 10⁻¹T + 2.32 × 10²
Isotropic hardening μ (MPa)−3.54 × 10⁻¹T − 1.40 × 10²
υ −6.60 × 10⁻³T + 1.75 × 101
H−5.50 × 10⁻³T − 4.00 × 10⁻¹
Note: Z = viscoplastic resistance; n = viscous exponent; β 1 , β 2 = kinematic hardening moduli; γ 1 , γ 2 = kinematic hardening parameters; υ , μ = isotropic hardening parameters; and H = linear drag stress evolution. The unit for T is °C.
Disclaimer/Publisher’s Note: The statements, opinions and data contained in all publications are solely those of the individual author(s) and contributor(s) and not of MDPI and/or the editor(s). MDPI and/or the editor(s) disclaim responsibility for any injury to people or property resulting from any ideas, methods, instructions or products referred to in the content.

