
A Comprehensive Assessment of Al-Si Coating Growth at Various Heating Rates, Soaking Temperatures, and Times

1
School of Engineering, University of Guelph, 50 Stone Road East, Guelph, ON N1G 2W1, Canada
2
Research & Advanced Engineering, Ford Motor Company, 2101 Village Road, Dearborn, MI 48121, USA
3
Promatek Research Centre, 2550 Steeles Ave. E, Brampton, ON L6T 5R3, Canada
*
Author to whom correspondence should be addressed.
Coatings 2024, 14(4), 399; https://doi.org/10.3390/coatings14040399
Submission received: 1 March 2024
/
Revised: 26 March 2024
/
Accepted: 26 March 2024
/
Published: 28 March 2024
(This article belongs to the Special Issue Recent Progress on Functional Films and Surface Science)
Abstract
:In conventional hot stamping, an Al-Si-coated blank is first heated above the austenitization temperature and then soaked for a period of time within a furnace, prior to the stamping operation. In this work, the impacts of furnace heating rate, soaking temperature, and soaking time on the Al-Si coating evolution were investigated for two commercial coating weights, 80 and 150 g/. These heat treatment parameters during heating and soaking affect the coating microstructure and the thickness of the interdiffusion layer, which affect the properties of the as-formed coatings. The transformation and growth of binary Fe-Al and ternary Fe-Al-Si intermetallic layers were characterized and quantified for soak times up to 240 s. The results show that the effect of the heating rate on the Al-Si intermetallic distribution and ternary phase morphology was more severe than the soaking time and soaking temperature. The (η) phase was the dominant layer at the beginning of the soaking stage with a () layer formed within it, and then the layer transformed into ( as the soaking time increased due to the interdiffusion of Fe and Al. The transformation of to occurred at a higher rate for elevated soaking temperatures due to the greater diffusivity of Al and Fe. The interdiffusion layer (IDL) consisted of ( and . Higher soaking temperatures of 1000 °C resulted in a thicker IDL for the same soak time when compared with 900 °C and 950 °C, but when the heating rate was lower, the IDL was thicker than that at the higher heating rate since a longer heating time was required to reach the soaking temperature of 900 °C, which prolonged the diffusion time during the heating stage. The findings were similar for AS80.
1. Introduction
Hot stamping is a mature metal-forming process that has been used to produce advanced high-strength steel (AHSS) and ultra-high-strength steel (UHSS) automotive components that fulfill the demands of a light weight and high vehicle safety performance [1,2,3]. The hot-stamping process is mainly applied to boron-alloyed steels and consists of three stages, austenitization, blank transfer, and stamping. During austenitization, the blank is heated beyond its austenitization temperature (850 °C to 950 °C) and soaked for 3–10 min to transform the pearlite–ferrite mixed microstructure into austenite [4]. In the second stage, the austenitized blank is quickly transferred to the press without losing significant heat and then, in the final stage, the blank is simultaneously formed and quenched (~30 °C/s–100 °C/s) within a cooled die to fully transform the austenite into martensite, resulting in a part with UHSS properties [5,6,7,8,9].
Typically, the sheet metal used for hot stamping is coated with an Al-Si protective layer (by hot dipping) to prevent significant oxidation and decarburization during heating and austenitization [10,11]. Fan et al. [12] stated that the Al-Si coating effectively protects the base metal from oxidation, as it was shown that, after 120 min of soaking for a 25 µm coating, oxygen was detected only 5 µm below the coating’s surface. The Al-Si coating also provides a protective barrier to prevent the decarburization of the base metal, which occurs during austenitization when carbon escapes from the steel surface and results in a low-carbon microstructure that cannot be adequately hardened via the martensite transformation [11].
The typical Al-Si coating contains 90 wt% aluminum and 10 wt% silicon [13]. After the hot-dipping process, a thin () inhabitation layer exists at the interface of the coating and steel [14]. During heating and austenitization, the Al-Si coating transforms into a complex multilayer intermetallic system driven by the interdiffusion between Fe and Al at the interface of the coating and steel [10]. At a temperature of ~577 °C, the coating begins to melt [15], and Fe quickly diffuses into the liquid coating. According to previous studies [12,16,17,18,19,20,21,22,23,24], when heated from 577 °C to approximately 900 °C (heating stage), the phase first reaches the surface of the coating. The transformation of binary intermetallic phases, including , (η), and , occurs gradually as the temperature increases. Furthermore, Fe-Al-Si ternary intermetallic phases, including and , are observed as thin white phases. The majority of the previous studies dealing with the initial heating phase identified the layer grown from the steel/coating interface as [17,18,19,20,21,22,23], while Fan et al. [12] and Chang et al. [16] identified it as . The formation of was observed by Chang et al. [16], Grigorivea et al. [19], and Cheng et al. [25]. A comprehensive characterization of the intermetallic phase transformations that occur during the heating stage (at varying heating rates) is presented in our previous study, where we identified the initial formation of . The disagreements among research groups can be caused by different factors, such as the heating rate, heating time, and the coating thickness, which are often not all reported.
During the soaking stage, the blank is held for several minutes after reaching the austenitization temperature to obtain a fully austenitic microstructure in the steel substrate. During this soaking stage, the intermetallic phase transformation progresses and the phase gradually replaces all of the previously formed Fe-Al phases and becomes the dominant layer, with the τ-family of ternary intermetallics resulting from the Si being rejected by [19]. This ternary intermetallic phase becomes thicker as more Si is rejected from newly transformed . This Fe-Al-Si precipitate that forms at the boundaries was identified as a mixture of and by Grigorieva et al. [19] and Klassen et al. [26], while Windmann et al. [27] identified it as . As the soaking time further increases, starts to replace the previously formed from the interface between the coating and steel substrate, which is attributed to Fe enrichment due to the inward diffusion of Al to the steel substrate [17,28,29]. Simultaneously, previously formed Fe-Al-Si ternary phases are also transformed into from the middle of the coating due to the high solubility of 16 at.% for silicon in the phase [30]. The interdiffusion layer separates the substrate/intermetallic coating and the thickness of this interdiffusion layer increases during the soaking stage when the Al-Si coating completely transforms into and Si-rich ternary phases [17]. A recent study by Cui et al. [31] investigated the coating microstructure when soaked for 5 min at different temperatures from 500 ℃ to 900 ℃, and they found that , , and α-Fe transformed at 900 °C. Pogrebnjak et al. [32] identified the formation of , , and within the diffusion layer after the annealing of the aluminized sample. This is due to strong Al atom diffusion into the steel [33] because the diffusion coefficient of Al in the aforementioned intermetallic phases is greater than that of Fe [34].
The in-service properties of the as-formed coatings is crucial to the final performance of the hot-stamped part. Corrosion resistance is offered by the coating because it creates a relatively long diffusion barrier to prevent corrosive compounds from reaching the steel substrate [35]. Moreover, Allely et al. [36,37] reported that the corrosion rate of aluminum-coated steel was very slow during their cyclic corrosion test. They observed stable corrosion products consisting of the Fe-i-Al compounds that filled the corrosion cavities to prevent further corrosion from blocking the inward diffusion of oxygen. The corrosion resistance of the coating also depends on the Al content, and Maki et al. [38] reported that a lower Al content in the coating caused a greater corrosion depth. Moreover, Grandhi et al. [39] found that the addition of Ca to Al-Si coatings offered better short-term corrosion resistance than Al-Si; however, the overall corrosion resistance decreased with increasing Ca concentration due to increased cathodic kinetics. The morphology of the Fe-Al-Si layer is one of the factors that influences the weldability of a hot-stamped part. Drillet et al. [40] found that non-layered (or island-type) Fe-Al-Si intermetallic phases are not desired, since they reduce the welding current range. The formability of the coating is strongly affected by the type of intermetallic phases and thickness of the interdiffusion layer. It has been reported that crack initiation and propagation could be reduced if the phase transforms into [17]. Gui et al. [41,42] suggested that a higher soaking temperature could improve the formability of the coating due to the formation and growth of a more ductile phase. Takagi et al. [43] stated that the interdiffusion layer should be 50% of the coating thickness for good resistance to coating crack propagation. On the other hand, a recent study by Cho et al. [20] found that the cracks initiated in the coating with a thicker interdiffusion layer propagated further into the steel substrate compared with a coating with a thinner interdiffusion layer. Moreover, they stated that the phase was more susceptible to brittle intergranular fracture when compared with .
The aforementioned properties of the as-formed coatings depend on their microstructure characteristics, such as the intermetallic species, morphology of the layers, and thickness of the interdiffusion layer, which is, in turn, affected by different heat treatment parameters during the heating and soaking stage. The impact of heating rate on coating growth was characterized in our previous study [44]. The focus of the current work is to comprehensively characterize coating growth and phase transformations during the soaking stage, which includes three soaking temperatures, five soaking times, and considers two commercial coating weights. This study helps to better understand the intermetallic phases that transform and the growth of the interdiffusion layer (IDL) with respect to a variety of process parameters. The results of this study will help hot-stamping-process engineers to optimize the austenitization process by reducing furnace run-time costs while generating an as-formed coating microstructure with acceptable in-service properties.
2. Materials and Methods
2.1. Materials
A commercial 22MnB5 boron steel was used in this research. The two coating weights employed for this study were nominally 80 g/m2 and 150 g/m2, denoted as AS80 and AS150, respectively. These are the same materials examined in [44]. The heat treatment samples cut from the AS80 and AS150 sheets were 38.5 mm in length and 19 mm in width. The cut samples were then hot-mounted and polished for metallographic characterization. The AS80 coating thickness was ~20 µm, with a nominal sheet thickness of 1.7 mm, and the AS150 coating thickness was ~30 µm, with a nominal sheet thickness of 1.9 mm. The nominal mass composition of the as-received coating was 90% Al and 10% Si, and the base metal consisted of ferrite and pearlite. The as-received structure was generated by hot-dip-coating the bare steel with an Al-Si alloy. A thin layer of from the hot-dipping process was formed at the interface of the coating and steel substrate. Based on previous studies, an extremely thin phase should be formed between the layer and steel substrate, but it is difficult to observe in the optical micrographs or detect in the EDS analysis due to its thin thickness.
2.2. Heat Treatment in Chamber Furnace
A chamber furnace with a small port hole opening was used for heat treatment to reproduce similar heat treatment conditions as in a conventional roller hearth furnace. A servo-controlled custom specimen-handling apparatus was developed for this work. The apparatus was used to position the specimen to the same position in the furnace for different heating trials, which allows for a repeatable (position and time) thermal cycle to heat-treat the specimens. The specimens were quenched quickly with compressed air to halt the phase transformation and preserve the coating structure. The furnace setpoint was adjusted to 900 °C and 1000 °C to achieve Medium and High heating rates (terminology will be used throughout). For the Medium-heating-rate tests, the specimens were soaked at 900 °C for different dwell times ranging from 30 s to 240 s. For the High-heating-rate tests, the specimens were soaked at 900 °C, 950 °C, and 1000 °C for different dwell times ranging from 30 s to 240 s. During the High-heating-rate tests, the specimens were first transferred to the middle of the furnace, where the ambient temperature was 1000 °C in order to achieve the High heating rate. When the specimen temperature reached the designated soaking temperature (900 °C or 950 °C), the specimen was moved to a position within the furnace where the ambient temperature was the same as the designated soaking temperature. Table 1 summarizes the soaking study tests for both coating weights. The soak times in Table 1 represent the time between reaching the soaking temperature and quenching, not the time required to reach the soaking temperature, which is a factor of the heating rate.
Before each heat treatment test, high-temperature inconel braided thermocouple wires were welded to the specimens. An Omega OMB-DAQ-2408 USB data-acquisition module was used to measure and record the temperature–time history at a sampling rate of 10 Hz. An example of the temperature–time profile for the five High-heating-rate soaking time tests for AS150 is shown in Figure 1a. In Figure 1b, the two coating weights show a nearly identical temperature–time profile, but AS80 shows a slightly higher heating rate (a negligible difference) due to its slightly lower thickness.
2.3. SEM and EDS Analysis
After heat treatment, the specimens were wet-cut at the thermocouple welding location and then hot-mounted and polished to achieve a mirror finish. The coating on the opposite side of the thermocouple was used for metallurgical analysis. The cross-sectional microstructures were captured using an FEI Inspect S50 SEM microscope operating at 20 kV, with a working distance of approximately 10 mm. The SEM was equipped with an Oxford Instruments X-Max (20) EDS Detector and was used to quantitatively analyze the chemical composition of different intermetallic phases through the thickness of the coating.
3. Results and Discussion
3.1. Heating Rate Determination
The temperature–time curve is nonlinear during the heating stage, as presented in [44], where a comprehensive assessment of Al-Si transformations that occur during heating are presented. The Medium and High heating rates presented in [44] are used in the current work and will only be covered briefly herein. A temperature–time and heating rate curve for the AS150 High-heating-rate test, with a 60 s soak time at 900 °C is shown in Figure 2. The secondary y-axis in this plot shows the heating rate of the specimen. The heating stage is divided into three regions in Figure 2a. The first heating rate region (HRI) starts when the specimen is placed in the furnace and ends when the melting temperature of the Al-Si coating is reached. HRII represents the region from TAS,m to TAc1, when austenite starts to form. HRIII represents the region of austenitization from TAc1 to TAc3. The entire heating stage is also considered as the nominal heating rate region from 600 °C to 900 °C (HR600–900), as shown in Figure 2b. This heating rate region is selected as it includes the entire coating transformation during the heating stage, and the conventional austenitization soaking process begins when the blank reaches 900 °C. Instead of TAS,m, 600 °C is selected to make the heating rate region consistent with our previous heating stage study [44] for future coating evolution model development. Moreover, 600 °C is just slightly above the coating melting temperature, so there is a negligible amount of phase transformation expected.
The nominal heating rates for both coating weights are presented in Table 2. Linear regression was applied to the temperature–time data in these different heating rate regions, and the slope of the regression lines represents the heating rate values within these regions. The R2 values in Table 2 indicate the heating rates, showing good linearity at different regions.
For a production-scale process, Jhajj et al. [45] measured the heating rate and showed that it varied from ~1 to 2.5 °C/s as the temperature increased from 600 to 900 °C; therefore, the Medium-heating-rate tests in the current work are realistic from a production process. The High heating rate reflects a process boundary condition that could be used to reduce the furnace run time on the premise that an acceptable coating microstructure is achieved.
3.2. Intermetallic Phase Formation
In this section, the intermetallic phase formation for both the AS150 and AS80 specimens is characterized as a function of heating rate, soaking time, and soaking temperature. Cross-sectional SEM micrographs and EDS chemical analysis were used to assess coating evolution and characterization/identify the intermetallic phases.
3.2.1. AS150
The transformed intermetallic species (), (, and (η), and an interdiffusion layer (IDL) are labeled and shown in Figure 3. The white-colored phases shown in Figure 3 are identified as Fe-Al-Si ternary intermetallics, as presented in previous studies [17,19,27,28,41,43,46] and verified by our EDS chemical analysis. The morphology of this phase is different with respect to the heat treatment condition, as shown in Figure 3. For the Medium-heating-rate tests, the Fe-Al-Si ternary intermetallic (lite gray color, ) always appeared as a continuous banded structure for all the soak times. However, for the High heating rate with soaking at 900 °C, the Fe-Al-Si ternary intermetallic showed an island-type morphology for all the soaking times. When comparing the three different soaking temperatures of the High-heating-rate tests, island-type Fe-Al-Si ternary intermetallic morphology was observed for all three soaking temperatures and soaking times. This suggests that the heating rate had more of an effect on the morphology of the aforementioned Fe-Al-Si intermetallic phase than the soaking time and soaking temperature. This is consistent with the findings reported by Fan et al. [10], who stated that the Fe-Al-Si ternary intermetallic phase tended to form as a continuous layer when the heating rate up to 930 °C was low, which allowed more time for the Si to saturate the continuous layer. Moreover, the thickness (or the area fraction) of this silicon-rich phase significantly increased as the soaking time increased, especially at higher soaking temperatures. This could be caused by the faster iron enrichment due to higher diffusivity at the higher soaking temperature.
Voids were observed at the interface of the coating and base metal (IDL region). These voids were related to the Kirkendall effect, which was due to the different diffusivities of Fe and Al. The Al diffusion into the steel became more active when the Al-Si coating completely transformed into solid intermetallic phases. Novak et al. [47] and Bakker et al. [32] indicated that the phase transformation was mainly controlled by the diffusion of Al when the coating was completely transformed into intermetallics, and the diffusivity of Al was greater than that of Fe. Figure 3 shows that the specimens soaked at higher temperatures (950 °C and 1000 °C) had more Kirkendall voids, and this was a result of an even stronger diffusion of Al at higher soaking temperatures. This statement is supported by the work of Windmann et al. [17].
In the current study, different intermetallic phases () were determined based on an atomic ratio calculation. Moreover, the Fe-Al-Si ternary phase diagrams provided in [30,48,49] were used to determine the region that consisted of more than one intermetallic phase. The weight percent ranges of Fe-Al-Si for different ternary/binary intermetallic phases and mixture of multiple phases are listed in Table 3, which have been cited in numerous articles on similar Al-Si coating characterization.
Figure 4 shows the EDS analysis for the AS150 specimens. For the Medium-heating-rate test with a 30 s soak at 900 °C (Figure 4a), the dominant phase (0 µm to 28 µm) containing approximately 47 weight percent of Fe, 50 weight percent of Al, and 3 weight percent of Si, is identified as and will be referred to as η. The Fe-Al-Si intermetallic phase in the middle of the coating is identified as the combination of () and because the atomic ratio of this phase does not align directly with any common individual Fe-Al-Si ternary intermetallic compound; therefore, the layer was identified as the combination of two intermetallics using the ternary phase diagram provided in [49]. This agrees with the findings of Windmann et al. [17,27], who stated that normally precipitated at the grain boundaries of as the Si was rejected since the solubility of Si was low in . The interdiffusion layer (IDL) consists of three phases, which are (, () and . The transformation from to was caused by the enrichment of Fe due to the strong diffusion of Al into the steel substrate. There was a peak in the weight percentage of Si observed at the interface between the coating and steel substrate, which indicated a high solubility of Si in the intermetallic. The second part of the IDL consisted of () and . The formation of the layer resulted from the diffusion of Si and Al, which stabilized the BCC lattice of Fe and transformed the austenitic microstructure into α-Fe during austenitization. As the soaking time increased (Figure 4b–d), in addition to the growth of the IDL ( and ), there was no significant intermetallic phase changes within the coating region from the soaking times of 30 s to 180 s. The previously formed layer transformed into when the soaking time was 240 s (Figure 4e) because Si in continuously diffused towards the steel substrate and Fe was simultaneously enriched in the coating. Windmann et al. [17,27] mentioned the transformation of to occurred as a result of the high solubility of 16 at.% for silicon in the phase, which is in good agreement with the EDS chemical analysis. Moreover, Windmann et al. [17] and Fan et al. [10] indicated that the Si also diffused towards the coating surface during austenitization to form Si-rich ternary intermetallic phases, which explained the peaks of the Si percentage at the coating surface in the EDS chemical analysis. However, the type of the Fe-Al-Si phase formed near the surface of the coating was difficult to identify due to its low thickness.
For the High-heating-rate tests soaked at 900 °C (Figure 4f–j), the structure of the layered microstructure was similar to that in the Low-heating-rate soaking study. However, the phase was not transformed into during the entire soaking period; moreover, the IDL was thinner than that in the Medium-heating-rate soaking tests. The aforementioned difference could be caused by the shorter overall furnace time of the High-heating-rate soaking test, since it took less time to reach the soaking temperature of 900 °C. Furthermore, the High heating rate could also change the distribution of the Fe-Al-Si ternary phase from one continuous band to multiple bands/islands dispersed throughout the entire thickness of the coating, as shown in Figure 4h–j.
For the High-heating-rate tests soaked at 950 °C (Figure 4k–o), the significant growth of the IDL started as early as 60 s of soaking (Figure 4l), and the previously formed layer started to transform into at the soaking time of 120 s, which was faster when compared with the lower soaking temperature of 900 °C. This was attributed to the faster diffusion of Si and Al at the higher soaking temperature. The phase was still the dominant phase for the soaking times of 180 s and 240 s (Figure 4n–o).
When the soaking temperature increased to 1000 °C, the transformation of to occurred within the first 30 s of soaking since no phase was observed at 30 s (Figure 4p). The previously formed was gradually replaced by as the soaking time increased (Figure 4q–r). The started to become the dominant phase with a few thin layers at the soaking time of 180 s (Figure 4s). The thickness of the IDL ( and ) increased to half of the original coating thickness at the soaking time of 240 s (Figure 4t), which indicated that the layered microstructure should be transformed into one Al-rich α-Fe layer if a higher temperature or longer soaking time is applied.
3.2.2. AS80
Figure 5 shows the intermetallic phase distribution of AS80 at the two different heating rates and three soaking temperatures. Similar to AS150, continuous and banded Fe-Al-Si ternary layers were observed for all the Medium-heating-rate soaking tests. The location of the Fe-Al-Si layers was in the middle of the coating, which was ~10 µm away from the interface between the coating and steel substrate, while the location of the Fe-Al-Si layers for AS150 was ~15 µm away from the interface when heat-treated at a Medium heating rate. This indicates that the continuous Fe-Al-Si ternary intermetallic phase started to grow from the interface of the coating and steel, and it stopped at the middle of the coating, regardless of the initial coating thickness when the heating rate was relatively low. Moreover, the thickness of the ternary intermetallic layers slightly increased as the soaking time increased. For the High-heating-rate soaking tests, island-type Fe-Al-Si intermetallic phases were observed, and the volume fraction of the Si-rich phases increased for higher soaking temperatures or longer soaking times. The amount of Kirkendall voids in AS80 was similar to that in AS150 and indicates that the diffusion rates of Al and Si into the steel substrate were similar for the two coating weights. When the specimen was soaked at 1000 °C for 240 s, the layered structure completely transformed into one single diffusion layer while AS150 still showed a layered microstructure. This was caused by the shorter diffusion path in the thinner AS80 coating.
The EDS profiles of AS80 are shown in Figure 6. For the Medium-heating-rate soaking tests, the Si-rich layer in the middle of the coating was a mixture of () and from the soak time of 30 s to 120 s (Figure 6a–c). The phase transformed into the Si-rich at 180 s for AS80 (Figure 6d), which occurred quicker than AS150. This verifies that the transformation of to was also caused by the diffusion of Fe towards the coating surface in addition to the diffusion of Si into the steel substrate, since the shorter Fe diffusion path in the thinner coating provided faster Fe-enrichment into the layer. For the High-heating-rate tests with soaking at 900 °C (Figure 6f–j), similar to AS150, was the dominant layer for all of the soaking times from 30 s to 240 s, and the transformation of to did not occur due to shorter furnace time and lower soaking temperature. For the High-heating-rate tests soaked at 950 °C (Figure 6k–o), the coating mainly consisted of , and the IDL grew faster when compared with the soaking temperature of 900 °C, which is consistent with AS150. The layered structure between and was formed for a soak temperature of 1000 °C for 120 s and 180 s (Figure 6r,s), and then the layered microstructure transformed into a single diffusion layer consisting of , , and at the soaking time of 240 s (Figure 6t).
3.3. Interdiffusion Layer Growth
3.3.1. Effect of Soaking Temperature on the IDL
Figure 7 quantifies the thicknesses of the IDL for the Medium-heating-rate tests at the three different soaking temperatures. Please keep in mind that the IDL consisted of , and . The rate of IDL growth was obtained by fitting a first-order polynomial function to the heat treatment time and thickness data, and the slope represented the IDL growth rate. When AS150 was soaked for 30 s, the thicknesses of the interdiffusion layer were about 3.9, 5.8, and 13.1 µm for soaking temperatures of 900, 950, and 1000 °C, respectively (Figure 7a). The thickness of the IDL increased as the soaking time increased, and this trend was consistent for all soaking temperatures. According to Takagi et al. [43], the thickness of the interdiffusion layer needs to be 50% of the coating thickness to have good resistance to crack propagation. Therefore, the thickness of the IDL for AS150 needed to be at least ~15 µm when soaked for 60 s and 240 s at 1000 °C and 950 °C, respectively. The examination of the growth rate showed that soaking temperatures of 900, 950, and 1000 °C resulted in IDL growth rates of 0.030, 0.049, and 0.056 µm/s, which was due to the higher diffusivity of Si and Al into the steel substrate at the higher soaking temperatures.
The IDL growth for AS80 is shown in Figure 7b and the thicknesses of the IDL were 3.7, 7.0, and 12.5 µm when soaked at 900, 950, and 1000 °C for 30 s, respectively, which was comparable to AS150. For the interdiffusion layer to be 50% of the coating thickness, the IDL thickness needs to be at least ~10 µm for AS80, which requires soaking times of 30 s and 120 s when soaked at 1000 °C and 950 °C, respectively. The AS80 IDL growth rates were also comparable to that of AS150, resulting in the conclusion that the coating thickness does not have a significant effect on the overall growth of the IDL.
3.3.2. Effect of Heating Rate on the IDL
Figure 8a shows the IDL growth of AS150 when soaked at 900 °C. For 30 s of soaking, the thicknesses of the IDL were 3.9 and 5.8 µm for the High and Medium heating rates, respectively. The difference in IDL thickness was a result of the Medium-heating-rate tests requiring more time to reach 900 °C during the heating stage, which provides a longer diffusion time for Si and Al. The IDL growth rates were very similar for the two heating rates which were 0.028 and 0.030 µm/s for the Medium- and High-heating-rate tests, respectively.
AS80 (Figure 8b) followed a similar trend, despite the less accurate fit to the data compared with AS150. Nonetheless, the AS80 IDL growth rates were similar to the AS150 growth rates, indicating that coating thickness had little effect on IDL growth for the two heating rates considered in this work.
3.3.3. IDL Thickness Growth Model
Owing to the linear growth of the IDL, an empirical model was calibrated using non-linear regression (of the equation constant in Figure 7 and Figure 8) to predict IDL thickness as a function of heating rate (HR), soaking temperature (T), and soaking time (), as shown below in Equations (1)–(4). The model constants are shown in Table 4.
The IDL thickness model was a linear function, and the growth rate (µm/s) was shown to increase with respect to soaking temperature (Section 3.3.1) in an exponential manner and was represented by . The increase in growth rate was due to the increased diffusivity at the higher temperatures. Figure 9a shows a schematic of the temperature–time profiles used in the experiments for the AS150 case (AS80 is similar), and the nominal heating rates shown in the figure are those measured as HR600–900 in Section 3.1. Please note that the time axis began at the Al-Si coating melting temperature (577 °C), because heating up to this temperature did not result in the reaction of the coating with the steel substrate, as discussed comprehensively in [44]. The IDL thickness at the beginning of the soaking stage ( = 0 s) is represented by , which is the y-intercept of Equation (1). The initial IDL thickness corresponded to the growth of the IDL during the heating stage of the heat treatment process. As the heating rate was held constant, but the soaking temperature increased as shown in Figure 9a, the initial IDL grew exponentially due to the higher temperature and longer heating time, which all facilitated diffusion and growth. The effect of heating rate was only shown to increase the starting IDL thickness, not the growth rate, as discussed in Section 3.3.2 for the 900 °C soaking temperature and change in heating rate from Medium (1.6 °C/s) to High (3.6 °C/s). It was assumed that the initial IDL thickness, , scaled linearly with respect to heating rate by the factor , which was normalized by the initial IDL thickness, or .
A comparison of the experimental and predicted IDL thickness is shown in Figure 9b for AS150. All the experimental cases were predicted very well by the model and the results were similar for the AS80 model. This model can now be used to predict the IDL thickness as a function of the anticipated hot-stamping austenitization process variables. Two additional soaking temperatures that are outside of those used to calibrate the model for the High heating rate are shown in Figure 9b and predict the slightly increasing growth rate (slope) that is expected at the higher soaking temperatures. It should be noted that this model is intended to be used within the boundary variables that are used for calibration.
4. Conclusions
In this work, the effect of the soaking temperature, soaking time, and initial heating rate on the phase formation of Al-Si-coated 22 MnB5 specimens was investigated for two coating weights. The transformation and growth of Fe-Al and Fe-Al-Si intermetallic layers was characterized and quantified within a range of industrially pertinent soaking times up to 240 s. The conclusions of the current research are as follows:
- For the Medium-heating-rate soaking tests, coating materials of both weights had a banded and continuous Fe-Al-Si intermetallic phase morphology for all the soaking times, while the specimens soaked at 900 °C, but heated at the High heating rate, resulted in an island-type ternary microstructure for all of the soak times. This indicates that the heating rate had more of an effect on the ternary phase morphology than the other heat treatment parameters. For the Medium heating rate, the continuous Fe-Al-Si ternary intermetallic layers started from the interface and stop in the middle of the coating, regardless of the initial coating thickness.
- The intermetallic phase is the dominant layer at the beginning of the soaking stage, and the () phase is formed within the phase. gradually transforms into ( as the soaking time increases due to the interdiffusion of Fe and Al. The transformation of to occurred faster for higher soaking temperatures due to the greater diffusivity of Al and Fe.
- For both coating weights, the IDL consisted of and and the thickness of the IDL increased as the soaking time increased at a relatively constant growth rate. Higher soaking temperatures result in a thicker IDL for the same soaking time, which is a result of the higher diffusivity of Si and Al into the steel substrate at the higher soaking temperatures. The IDL growth of AS80 is generally the same as the growth quantified for AS150, which indicates that the coating thickness does not have a noticeable effect on the overall growth of the IDL.
- For both coating weights, the impact of heating rate had little effect on the IDL growth rate, but the Medium-heating-rate IDL was thicker than the High-heating-rate IDL, since the Medium heating rate tests required a longer time to reach the soaking temperature of 900 °C and therefore prolonged the diffusion time during heating.
- Utilizing the experimental results found in this work, an empirical IDL thickness model was successfully developed to predict IDL growth as a function of heating rate, soaking temperature, and soaking time.
Author Contributions
Conceptualization, S.W. and A.B.; methodology, S.W. and A.B.; formal analysis, S.W.; investigation, S.W.; resources, C.C.; writing—original draft preparation, S.W.; writing—review and editing, A.B., C.C., and C.S.; supervision, A.B.; project administration, C.C.; funding acquisition, A.B. All authors have read and agreed to the published version of the manuscript.
Funding
This research was supported and funded by the Ford Motor Company, Promatek Research Centre (Cosma International), the Natural Sciences and Engineering Research Council (NSERC) Grant CRDPJ#5322078-18, and the Ontario Centres of Excellence (OCE). The funder was not involved in the study design, collection, analysis, interpretation of data, the writing of this article or the decision to submit it for publication.
Data Availability Statement
The data presented in this study are available on request from the corresponding author.
Conflicts of Interest
Constantin Chiriac was employed by the Ford Motor Company. Cangji Shi was employed by the Promatek Research Centre. The remaining authors declare that the research was conducted in the absence of any commercial or financial relationships that could be construed as a potential conflict of interest.
References
- Karbasian, H.; Tekkaya, A.E. A Review on Hot Stamping. J. Mater. Process. Technol. 2010, 210, 2103–2118. [Google Scholar] [CrossRef]
- Åkerström, P. Modelling and Simulation of Hot Stamping. Ph.D. Thesis, Luleå University of Technology, Luleå, Sweden, 2006. [Google Scholar]
- Bian, J.; Mohrbacher, H.; Zhang, J.S.; Zhao, Y.T.; Lu, H.Z.; Dong, H. Application Potential of High Performance Steels for Weight Reduction and Efficiency Increase in Commercial Vehicles. Adv. Manuf. 2015, 3, 27–36. [Google Scholar] [CrossRef]
- Merklein, M.; Lechler, J. Determination of Material and Process Characteristics for Hot Stamping Processes of Quenchenable Ultra High Strength Steels with Respect to a FE-Based Process Design. SAE Int. J. Mater. Manuf. 2008, 1, 411–426. [Google Scholar] [CrossRef]
- Jonasson, J.; Billur, E.; Ormaetxea, A. A Hot Stamping Line. In Hot Stamping of Ultra High-Strength Steels; Springer International Publishing: Cham, Switzerland, 2019; pp. 77–104. [Google Scholar]
- Bardelcik, A.; Salisbury, C.P.; Winkler, S.; Wells, M.A.; Worswick, M.J. Effect of Cooling Rate on the High Strain Rate Properties of Boron Steel. Int. J. Impact Eng. 2010, 37, 694–702. [Google Scholar] [CrossRef]
- Fan, D.W.; Kim, H.S.; De Cooman, B.C. A Review of the Physical Metallurgy Related to the Hot Press Forming of Advanced High Strength Steel. Steel Res. Int. 2009, 80, 241–248. [Google Scholar] [CrossRef]
- Maikranz-Valentin, M.; Weidig, U.; Schoof, U.; Becker, H.-H.; Steinhoff, K. Components with Optimised Properties due to Advanced Thermo-Mechanical Process Strategies in Hot Sheet Metal Forming. Steel Res. Int. 2008, 79, 92–97. [Google Scholar] [CrossRef]
- Merklein, M.; Lechler, J. Investigation of the Thermo-Mechanical Properties of Hot Stamping Steels. J. Mater. Process. Technol. 2006, 177, 452–455. [Google Scholar] [CrossRef]
- Fan, D.W.; De Cooman, B.C. State-of-the-Knowledge on Coating Systems for Hot Stamped Parts. Steel Res. Int. 2012, 83, 412–433. [Google Scholar] [CrossRef]
- Vander Voort, G.F. Understanfing and measuring decarbruization. Adv. Mater. Process. 2015, 173, 22–27. [Google Scholar]
- Fan, D.W.; Kim, H.S.; Oh, J.-K.; Chin, K.-G.; De Cooman, B.C. Coating Degradation in Hot Press Forming. ISIJ Int. 2010, 50, 561–568. [Google Scholar] [CrossRef]
- ArcelorMittal. Steels Coated with Alusi®, an Aluminium-Silicon Alloy. Available online: https://automotive.arcelormittal.com/products/flat/coatings/alusi (accessed on 12 June 2023).
- Shin, D.; Lee, J.-Y.; Heo, H.; Kang, C.-Y. TEM Microstructural Evolution and Formation Mechanism of Reaction Layer for 22MnB5 Steel Hot-Dipped in Al–10% Si. Coatings 2018, 8, 467. [Google Scholar] [CrossRef]
- Murray, J.L.; McAlister, A.J. The Al-Si (Aluminum-Silicon) System. Bull. Alloy Phase Diagr. 1984, 5, 74–84. [Google Scholar] [CrossRef]
- Chang, Y.Y.; Tsaur, C.C.; Rock, J.C. Microstructure Studies of an Aluminide Coating on 9Cr-1Mo Steel during High Temperature Oxidation. Surf. Coat. Technol. 2006, 200, 6588–6593. [Google Scholar] [CrossRef]
- Windmann, M.; Röttger, A.; Theisen, W. Phase Formation at the Interface between a Boron Alloyed Steel Substrate and an Al-Rich Coating. Surf. Coat. Technol. 2013, 226, 130–139. [Google Scholar] [CrossRef]
- Jenner, F.; Walter, M.E.; Mohan Iyengar, R.; Hughes, R. Evolution of Phases, Microstructure, and Surface Roughness during Heat Treatment of Aluminized Low Carbon Steel. Metall. Mater. Trans. A Phys. Metall. Mater. Sci. 2010, 41, 1554–1563. [Google Scholar] [CrossRef]
- Grigorieva, R.; Drillet, P.; Mataigne, J.M.; Redjaïmia, A. Phase Transformations in the Al-Si Coating during the Austenitization Step. In Proceedings of the Solid State Phenomena; Trans Tech Publications Ltd.: Stafa-Zurich, Switzerland, 2011; Volume 172–174, pp. 784–790. [Google Scholar]
- Cho, L.; Golem, L.; Seo, E.J.; Bhattacharya, D.; Speer, J.G.; Findley, K.O. Microstructural Characteristics and Mechanical Properties of the Al–Si Coating on Press Hardened 22MnB5 Steel. J. Alloys Compd. 2020, 846, 156349. [Google Scholar] [CrossRef]
- Liang, W.; Duan, J.; Wang, Q.; Dong, J.; Liu, Q.; Lin, C.; Zhang, Y. Influence of Multi-Step Heating Methods on Properties of al–Si Coating Boron Steel Sheet. Coatings 2021, 11, 164. [Google Scholar] [CrossRef]
- Zaman, S.B.; Hazrati, J.; de Rooij, M.B.; van den Boogaard, A.H. Effect of Heating Temperatures on AlSi Coating Microstructure and Fracture during Hot-Tensile Tests. IOP Conf. Ser. Mater. Sci. Eng. 2021, 1157, 012018. [Google Scholar] [CrossRef]
- Liang, W.K.; Tao, W.J.; Zhu, B.; Zhang, Y.S. Influence of Heating Parameters on Properties of the Al-Si Coating Applied to Hot Stamping. Sci. China Technol. Sci. 2017, 60, 1088–1102. [Google Scholar] [CrossRef]
- Klassen, C.M.; Daun, K.J. Investigating Coating Liquefaction and Solidification of Furnace-Heated Al-Si Coated 22MnB5 Steel Using Laser Reflectance. Surf. Coat. Technol. 2020, 393, 125795. [Google Scholar] [CrossRef]
- Cheng, W.J.; Wang, C.J. Study of Microstructure and Phase Evolution of Hot-Dipped Aluminide Mild Steel during High-Temperature Diffusion Using Electron Backscatter Diffraction. Appl. Surf. Sci. 2011, 257, 4663–4668. [Google Scholar] [CrossRef]
- Klassen, C.M.; Smith, R.D.L.; Daun, K.J. Characterizing the Al-Si Coating on 22MnB5 Steel Using Raman Spectroscopy. Mater. Charact. 2022, 189, 112002. [Google Scholar] [CrossRef]
- Windmann, M.; Röttger, A.; Theisen, W. Formation of Intermetallic Phases in Al-Coated Hot-Stamped 22MnB5 Sheets in Terms of Coating Thickness and Si Content. Surf. Coat. Technol. 2014, 246, 17–25. [Google Scholar] [CrossRef]
- Cheng, W.J.; Wang, C.J. Microstructural Evolution of Intermetallic Layer in Hot-Dipped Aluminide Mild Steel with Silicon Addition. Surf. Coat. Technol. 2011, 205, 4726–4731. [Google Scholar] [CrossRef]
- Sasaki, T.; Yakou, T. Features of Intermetallic Compounds in Aluminized Steels Formed Using Aluminum Foil. Surf. Coat. Technol. 2006, 201, 2131–2139. [Google Scholar] [CrossRef]
- Maitra, T.; Gupta, S.P. Intermetallic Compound Formation in Fe-Al-Si Ternary System: Part II. Mater. Charact. 2003, 49, 293–311. [Google Scholar] [CrossRef]
- Cui, G.; Meng, Y.; Ju, X.; Yan, C. Microstructure Characterization of Al–Si Coatings on Hot Stamping Steel under Different Heat Treatment Processes. ISIJ Int. 2023, 63, 719–726. [Google Scholar] [CrossRef]
- Pogrebnjak, A.D.; Shumakova, N.I. Effect of ‘Duplex’ Treatment on Changes of Physical and Mechanical Properties of Steel (0.3 wt% C) 1999. Available online: www.elsevier.nl/locate/surfcoat (accessed on 15 June 2023).
- Yakubtsov, I.; Sohmshetty, R. Evolution of Al-Si Coating Microstructure during Heat-Treatment of Usibor® 1500. IOP Conf. Ser. Mater. Sci. Eng. 2018, 418, 012015. [Google Scholar] [CrossRef]
- Bakker, H. Diffusion in Solid Metals and Alloys; Mehrer, H., Ed.; Springer: Berlin/Heidelberg, Germany, 1990; Volume 26, ISBN 3-540-50886-4. [Google Scholar]
- Suehiro, M.; Maki, J.; Kusumi, K.; Ohgami, M.; Miyakoshi, T. Properties of Aluminum-Coated Steels for Hot-Forming; Nippon Steel Technical Report; Nippon Steel Corporation: Tokyo, Japan, 2003. [Google Scholar]
- Allély, C.; Dosdat, L.; Clauzeau, O.; Ogle, K.; Volovitch, P. Anticorrosion Mechanisms of Aluminized Steel for Hot Stamping. Surf. Coat. Technol. 2014, 238, 188–196. [Google Scholar] [CrossRef]
- Alley, C.; Petitjean, J.; Vietoris, T. Corrosion Resistance of Zinc Based and Aluminized Coatings on Press-Hardened Steels for Automotive. In Proceedings of the 3rd, International Conference on Hot Sheet Metal Forming of High Performance Steel, Kassel, Germany, 13–17 June 2011; pp. 153–160. [Google Scholar]
- Maki, J.; Kurosaki, M.; Kusumi, K.; Abe, M. Effect of Heating Condition and Hot Forming on Corrosion Resistance of Hot Stamped Aluminized Steels. In Proceedings of the 3rd International Conference on Hot Sheet Metal Forming of High-Performance Steel, Kassel, Germany, 13–17 June 2011; pp. 499–507. [Google Scholar]
- Grandhi, S.; Oh, M.S. Influence of calcium on the morphology and corrosion performance of hot-dip Al–Si coatings. Mater. Lett. 2023, 353, 135278. [Google Scholar] [CrossRef]
- Drillet, P.; Spehner, D.; Kefferstein, R. Coated Steel Strips, Methods of Making The Same, Methods of Using the Same, Stamping Blanks Prepared from the Same, Stamped Products Prepared from the Same, and Articles of Manufacture Which Contain Such a Stamped Product. French Patent WO08053273, 8 May 2008. [Google Scholar]
- Gui, Z.X.; Wang, K.; Zhang, Y.S.; Zhu, B. Cracking and Interfacial Debonding of the Al-Si Coating in Hot Stamping of Pre-Coated Boron Steel. Appl. Surf. Sci. 2014, 316, 595–603. [Google Scholar] [CrossRef]
- Gui, Z.X.; Liang, W.K.; Zhang, Y.S. Enhancing Ductility of the Al-Si Coating on Hot Stamping Steel by Controlling the Fe-Al Phase Transformation during Austenitization. Sci. China Technol. Sci. 2014, 57, 1785–1793. [Google Scholar] [CrossRef]
- Takagi, K.; Nakanishi, E.; Yoshida, T. Aluminium-Coated Structural Member and Production Method. European Patent EP1380666, 10 May 2004. [Google Scholar]
- Wu, S.; Bardelcik, A.; Chiriac, C.; Elsayed, A.; Shi, C. The Effect of Heating Rate and Coating Weight on the Intermetallic Growth of Al Si Coated Hot Stamping Steel. Surf. Coat. Technol. 2023, 471, 129913. [Google Scholar] [CrossRef]
- Jhajj, K.S.; Slezak, S.R.; Daun, K.J. Inferring the Specific Heat of an Ultra High Strength Steel during the Heating Stage of Hot Forming Die Quenching, through Inverse Analysis. Appl. Therm. Eng. 2015, 83, 98–107. [Google Scholar] [CrossRef]
- Klassen, C.M.; Emmert, J.; Daun, K.J. Effect of Coating Thickness on the In-Situ Reflectance and Surface Roughness of Al-Si Coated 22MnB5 Steel. Surf. Coat. Technol. 2021, 414, 127100. [Google Scholar] [CrossRef]
- Novák, P.; Michalcová, A.; Marek, I.; Mudrová, M.; Saksl, K.; Bednarčík, J.; Zikmund, P.; Vojtěch, D. On the Formation of Intermetallics in Fe-Al System—An in Situ XRD Study. Intermetallics 2013, 32, 127–136. [Google Scholar] [CrossRef]
- Gupta, S.P. Intermetallic Compound Formation in Fe-Al-Si Ternary System: Part I. Mater. Charact. 2003, 49, 269–291. [Google Scholar] [CrossRef]
- Rivlin, V.G.; Raynor, G.V. 4: Critical Evaluation of Constitution of Aluminium-Iron-Silicon System. Int. Met. Rev. 1981, 26, 133–151. [Google Scholar] [CrossRef]
Figure 1.
(a) The AS150 High-heating-rate soaking time tests (b) The temperature–time data comparison between the two coating weights for the different heating rates (soaking time of 240 s is shown as an example).
Figure 1.
(a) The AS150 High-heating-rate soaking time tests (b) The temperature–time data comparison between the two coating weights for the different heating rates (soaking time of 240 s is shown as an example).
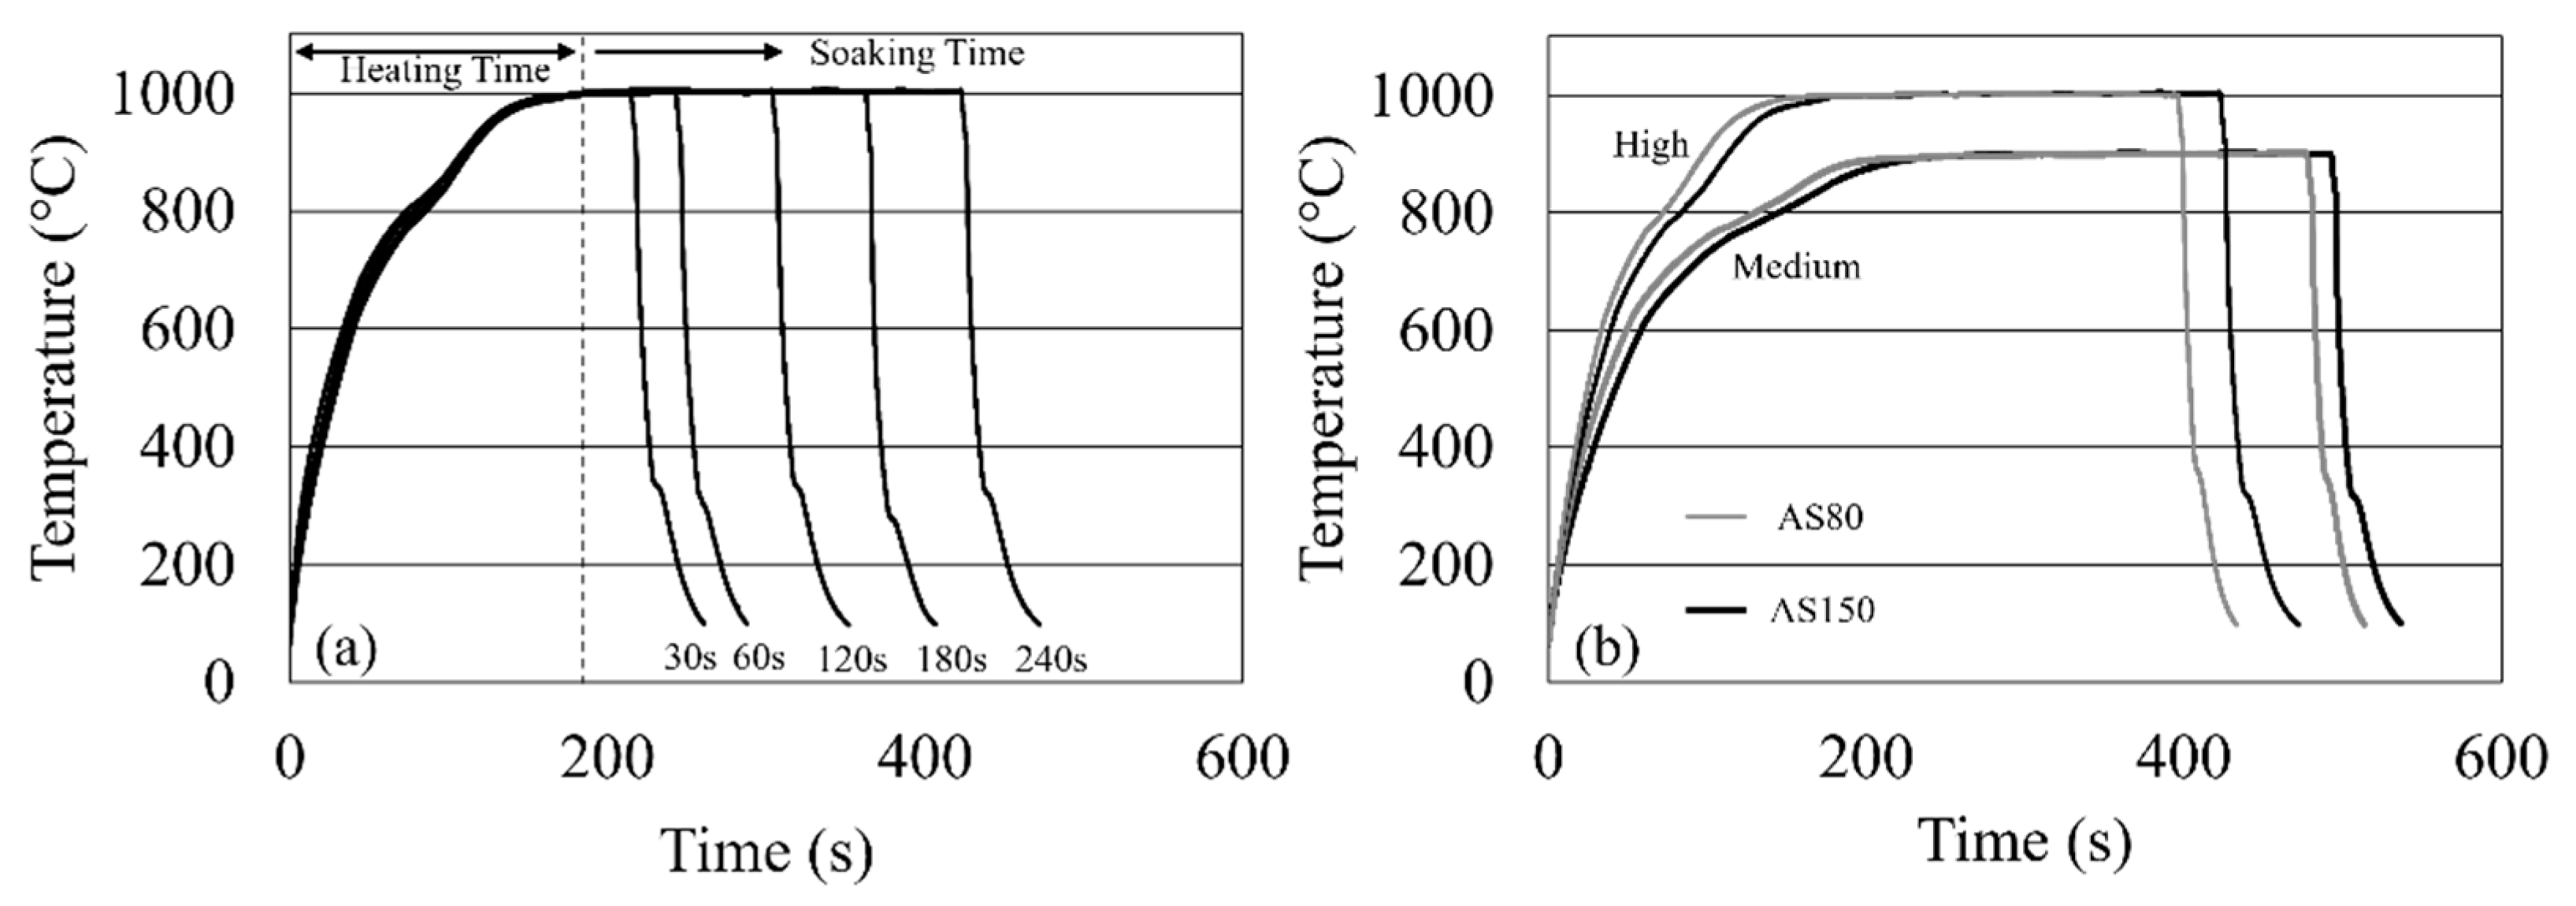
Figure 2.
The temperature–time (green) and heating rate (blue) curves for the AS150 High-heating-rate test with a 60 s soaking stage at 900 °C. Heating rate regions for (a) coating and steel substrate phase transformations and (b) from 600 to 900 °C, HR600–900.
Figure 2.
The temperature–time (green) and heating rate (blue) curves for the AS150 High-heating-rate test with a 60 s soaking stage at 900 °C. Heating rate regions for (a) coating and steel substrate phase transformations and (b) from 600 to 900 °C, HR600–900.
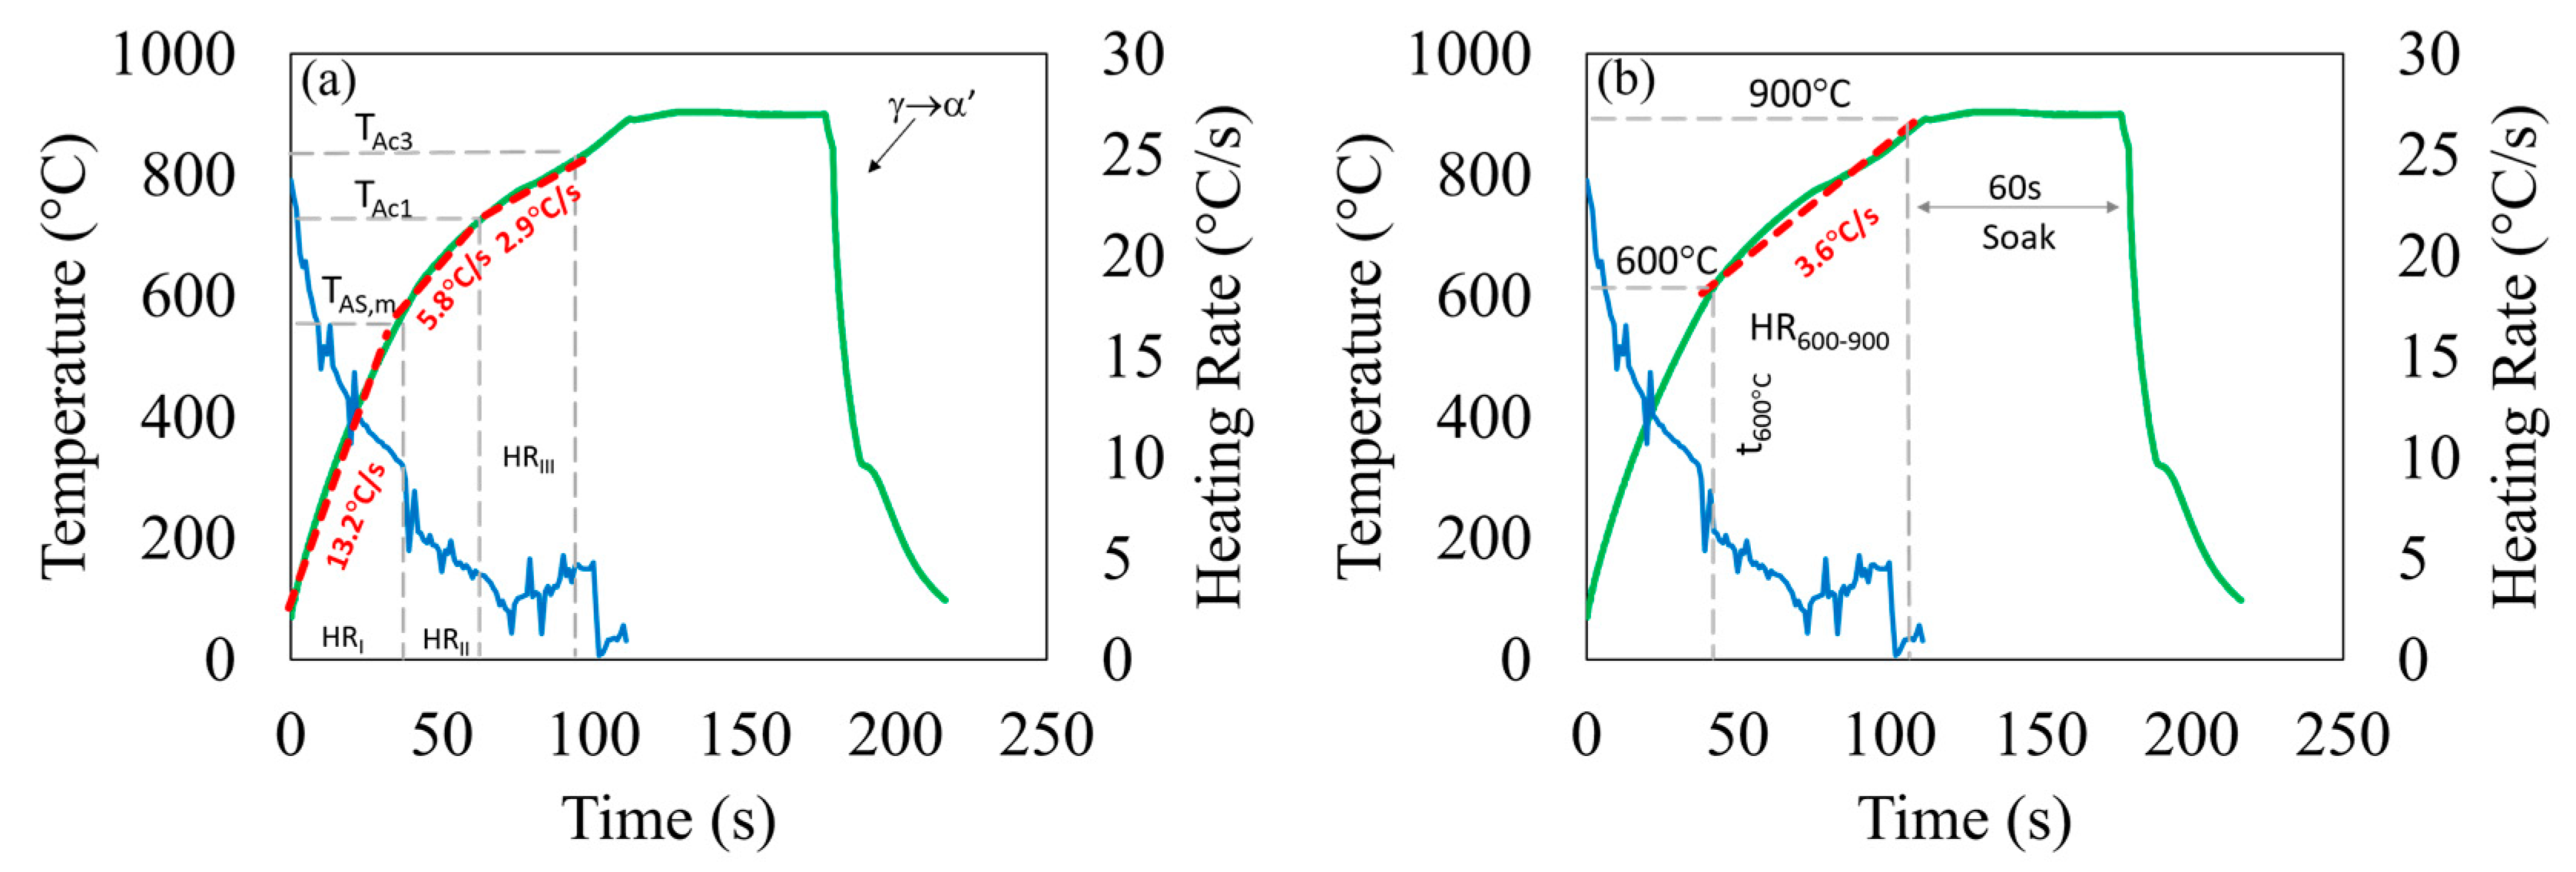
Figure 3.
SEM micrographs of AS150 (cross-section view).

Figure 4.
(a–t) EDS chemical scans of AS150.

Figure 5.
SEM micrographs of AS80 (cross-section view).

Figure 6.
(a–t) EDS chemical scans of AS80.

Figure 7.
Effect of soak temperature on IDL growth for (a) AS150 and (b) AS80.
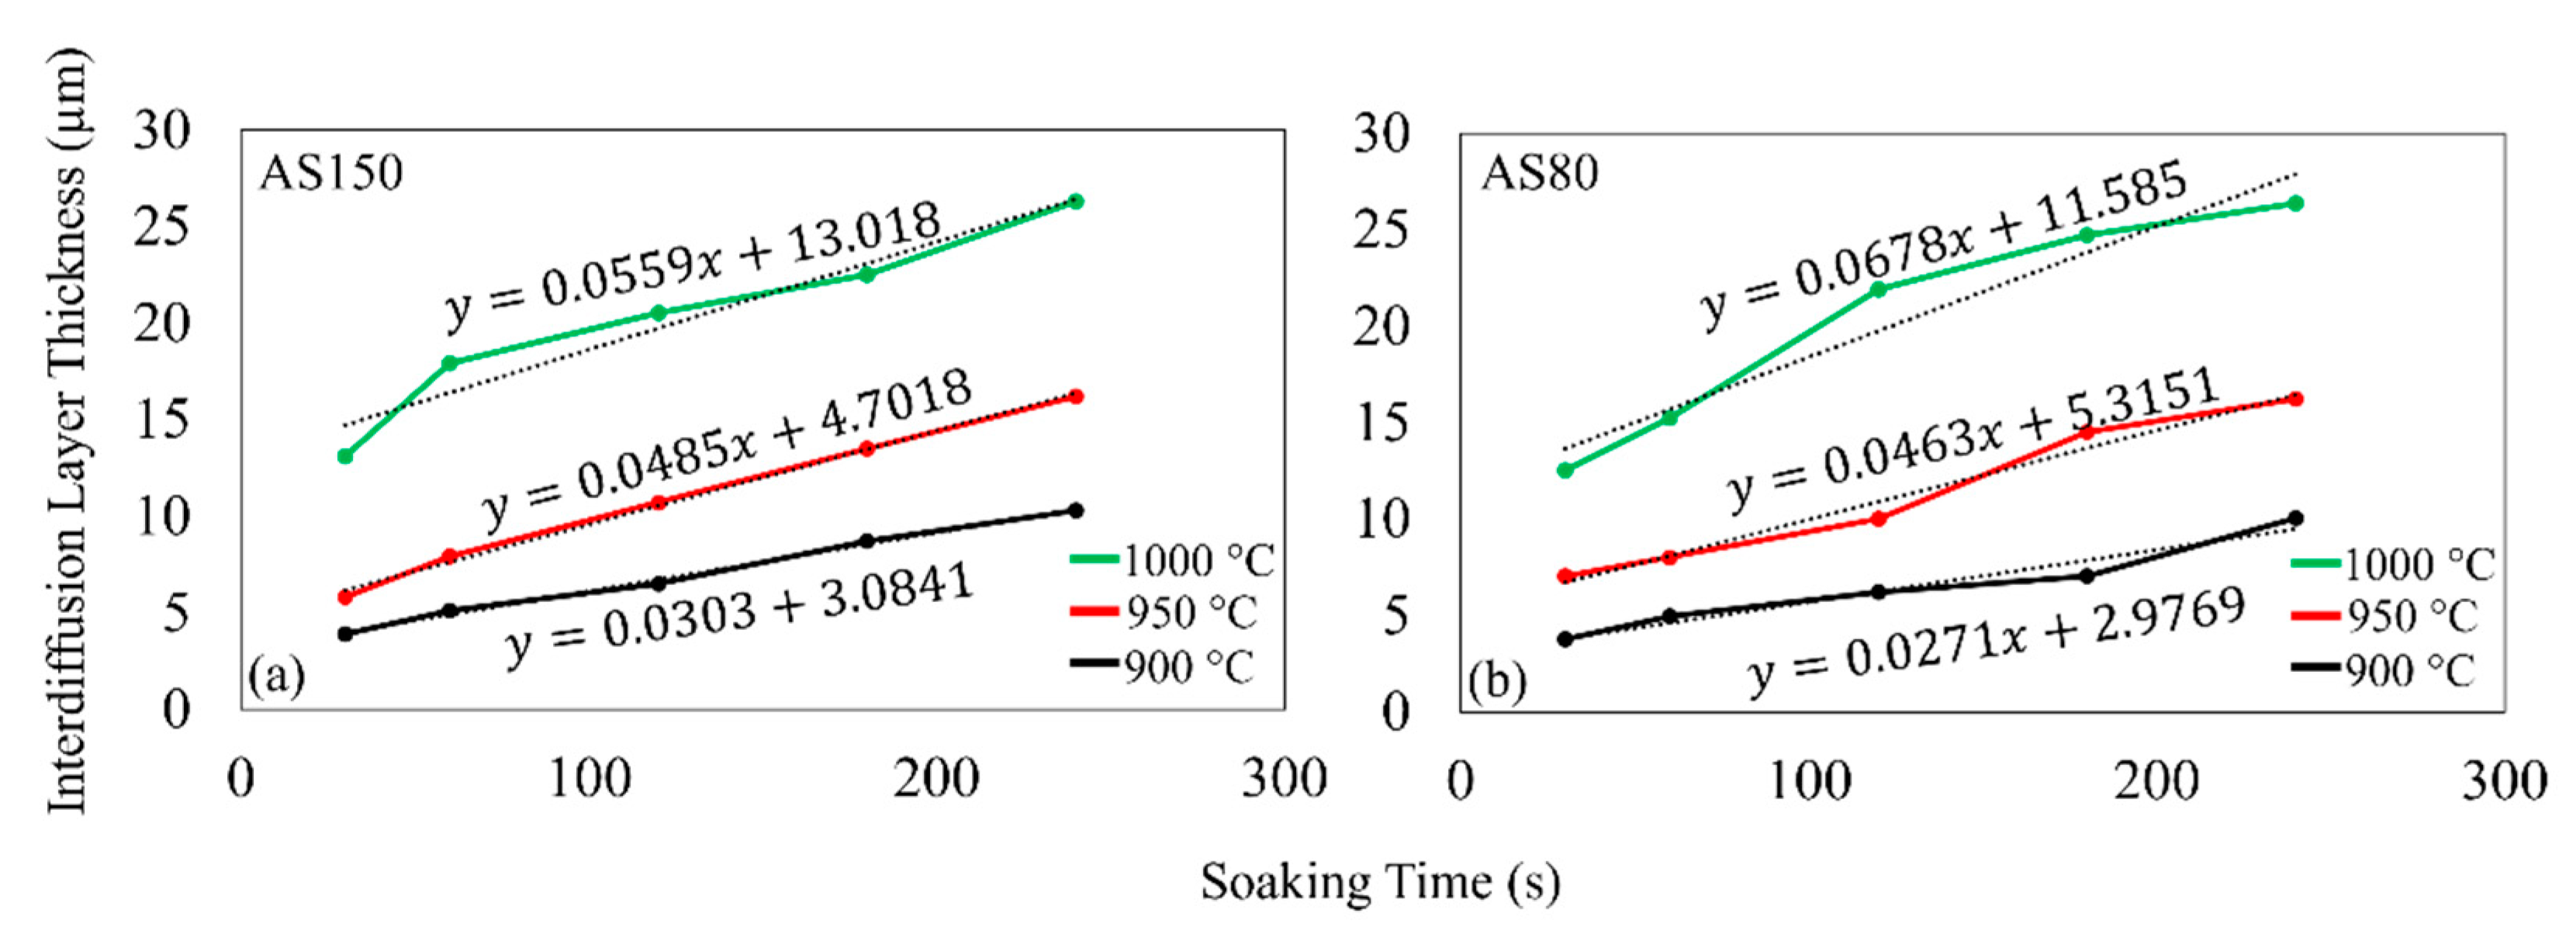
Figure 8.
IDL growth for (a) AS150 and (b) AS80 at different heating rates.

Figure 9.
(a) Schematic of the AS150 heat treatment experiments; (b) measured and predicted interdiffusion layer (IDL) growth at various soaking temperatures and heating rates for AS150. The data points correspond to those shown in (a).
Figure 9.
(a) Schematic of the AS150 heat treatment experiments; (b) measured and predicted interdiffusion layer (IDL) growth at various soaking temperatures and heating rates for AS150. The data points correspond to those shown in (a).


Table 1.
Soaking study test matrix for both coating weights.
| Heating Rate | Furnace Temperature (°C) | Soaking Temperature (°C) | Soaking Time (s) |
|---|---|---|---|
| Medium | 900 | 900 | 30, 60, 120, 180, 240 |
| High | 1000 | 900 | 30, 60, 120, 180, 240 |
| 950 | 30, 60, 120, 180, 240 | ||
| 1000 | 30, 60, 120, 180, 240 |
Table 2.
Nominal heating rates in °C/s. Square parentheses indicate the regression R2 value.
| HRI | HRII | HRIII | HR600–900 | |||||
|---|---|---|---|---|---|---|---|---|
| Heating Rate | AS80 | AS150 | AS80 | AS150 | AS80 | AS150 | AS80 | AS150 |
| Medium | 10 [0.98] | 8.8 [0.98] | 3.4 [0.98] | 3.16 [0.98] | 1.6 [0.99] | 1.4 [0.99] | 1.6 [0.95] | 1.6 [0.96] |
| High | 16 [0.98] | 13.2 [0.98] | 6.7 [0.99] | 5.8 [0.99] | 3.2 [0.99] | 2.9 [0.99] | 3.9 [0.97] | 3.6 [0.98] |
Table 3.
Weight percentage ranges of the phases in the current study.
| Weight Percentage (%) | Phase | References | ||
|---|---|---|---|---|
| Al | Fe | Si | ||
| 30–36 | 53–59 | 9–13 | ) | [17,19,27,49] |
| 53–57 | 36–39 | 5–8 | [19,26] | |
| 49–53 | 45–50 | 2–5 | ) | [19,26,27,28] |
| 0–19 | 78–100 | 0–5 | [19,20] | |
| 27–33 | 62–70 | 7–10 | ) | [17,20] |
Table 4.
IDL thickness model constants.
| AS80 | AS150 | |||||
|---|---|---|---|---|---|---|
| Constants | 1 | 2 | 3 | 1 | 2 | 3 |
| 4.6 × 10⁻⁷ | −0.000467 | 0.0748 | −2.16 × 10⁻⁶ | 0.00436 | −2.1441 | |
| 0.00078634 | −1.407965 | 633.21 | 0.0013397 | −2.446091 | 1119.409 | |
| −0.81183 | 6.143 | 2.9769 | −1.0993 | 7.0416 | 3.0841 |
Disclaimer/Publisher’s Note: The statements, opinions and data contained in all publications are solely those of the individual author(s) and contributor(s) and not of MDPI and/or the editor(s). MDPI and/or the editor(s) disclaim responsibility for any injury to people or property resulting from any ideas, methods, instructions or products referred to in the content. |
© 2024 by the authors. Licensee MDPI, Basel, Switzerland. This article is an open access article distributed under the terms and conditions of the Creative Commons Attribution (CC BY) license (https://creativecommons.org/licenses/by/4.0/).
Share and Cite
MDPI and ACS Style
Wu, S.; Bardelcik, A.; Chiriac, C.; Shi, C. A Comprehensive Assessment of Al-Si Coating Growth at Various Heating Rates, Soaking Temperatures, and Times. Coatings 2024, 14, 399. https://doi.org/10.3390/coatings14040399
AMA Style
Wu S, Bardelcik A, Chiriac C, Shi C. A Comprehensive Assessment of Al-Si Coating Growth at Various Heating Rates, Soaking Temperatures, and Times. Coatings. 2024; 14(4):399. https://doi.org/10.3390/coatings14040399
Chicago/Turabian StyleWu, Siyu, Alexander Bardelcik, Constantin Chiriac, and Cangji Shi. 2024. "A Comprehensive Assessment of Al-Si Coating Growth at Various Heating Rates, Soaking Temperatures, and Times" Coatings 14, no. 4: 399. https://doi.org/10.3390/coatings14040399
Note that from the first issue of 2016, this journal uses article numbers instead of page numbers. See further details here.