
Surface-Enhanced Raman Scattering for Probe Detection via Gold Nanorods and AuNRs@SiO2 Composites
by
Huiqin Li
*,
Yanyu Tian
,
Shaotian Yan
,
Lijun Ren
,
Rong Ma
,
Weiwei Zhao
,
Hongge Zhang
* and
Shumei Dou
* Department of Chemistry and Chemical Engineering, Baoji University of Arts and Sciences, Baoji 721013, China
*
Authors to whom correspondence should be addressed.
Coatings 2024, 14(5), 530; https://doi.org/10.3390/coatings14050530
Submission received: 6 April 2024
/
Revised: 15 April 2024
/
Accepted: 19 April 2024
/
Published: 24 April 2024
(This article belongs to the Section Plasma Coatings, Surfaces & Interfaces)
Abstract
:In this paper, a self-assembly method was used to prepare gold nanorod composites, and a seed-growth method was used to adjust the amount of AgNO3 solution, enabling the preparation of gold nanorods with different aspect ratios. AuNRs@SiO2 nanocomposite particles were then prepared by using the Stöber method to coat the gold nanorod surface with silica. Transmission electron microscopy showed that the maximum aspect ratio of the gold nanorods was 4.53, which was achieved using 2 mL of 10 mM AgNO3 solution. The Raman-scattering intensity of the gold nanorods was studied using rhodamine 6G, thiram, melamine, and piroxicam, and detection limits of 10−8 M, 10−5 M, and 10−3 M were, respectively, achieved. As a substrate, these gold nanorods showed good repeatability and reproducibility, and trace detection was successfully achieved. A transmission electron microscopy analysis shows that the SiO2 shell became thicker with increasing tetraethyl orthosilicate addition. Using AuNRs@SiO2 as the base and R6G, thiram, and piroxicam as the probes, measurable detection limits of 10−9 M, 10−6 M, and 10−5 M were achieved, and this composite also showed excellent repeatability and reproducibility.
1. Introduction
As global living standards have improved, food safety, drug safety, and environmental safety have become urgent issues that need to be addressed. In recent years, the field of nanotechnology has rapidly developed due to the unique properties of nanoscale materials and their wide range of applications [1,2]. Gold nanoparticles are very stable and have been widely used in biomedical applications, particularly for drug delivery [3,4,5], biosensors and imaging [6,7,8], and cancer diagnosis and treatment [9,10,11]. Fast and effective detection methods are highly desirable in the biomedical field.
Noble-metal nanostructures exhibit strong optical absorption and optical-scattering properties due to local plasmon resonance. As noble-metal nanomaterials, gold nanomaterials have unique surface Raman-enhancement characteristics. Therefore, gold nanomaterials can be used as Raman-enhanced substrates to detect target compounds. This means that the test results can be exponentially amplified, enabling quantitative analyte detection. Precious-metal nanomaterials have unique local surface plasmon formant (SPR) and surface-enhanced Raman scattering (SERS), two important properties of gold nanomaterials, which can be controlled by controlling the size and shape of metal nanostructures [12]. Among the different gold nanostructures, gold nanorods are the most widely used, mainly because they have two formant peaks, the longitudinal local surface plasma resonance (LSPR) peak and the transverse local surface plasma absorption (TSPR) peak [13], corresponding to the longitudinal and transverse SPR, respectively. The position of the LSPR peak is very sensitive to the aspect ratio of gold nanorods [14]. According to needs, we can adjust the peak position in the near-infrared region by changing the aspect ratio (AR) of the gold nanorods, while the position of the TSPR peak is not affected by the aspect ratio of the gold nanorods, and is still close to the wavelength range of visible light [15]. In addition, the SERS activity of metal nanoparticles is significantly related to the morphology and size of the nanoparticles. The larger the nanoparticle, the higher the SERS activity [16,17]. In addition, in most studies, the seed-growth method is used to prepare gold nanorods. When there are small gold nuclei in the solution, adding weak reducing agents such as hydrogen peroxide to the solution can convert HAuCl4 into gold and slowly deposit gold nanorods. Gold nanoparticles can be prepared by changing the size of the gold nanoparticles and the ratio of gold ions to gold nanorods. Under the constraint of the template, AuNRs with corresponding aspect ratios are directionally grown. This method has low requirements for equipment, a mild reaction, and can expand reproduction. However, the rapid agglomeration of gold nanorods in organic solvents means that test results are difficult to replicate. Coating gold nanorods with another material can effectively avoid this problem. Silica shows good promise as a coating material for the preparation of AuNR composites. The adhesion of a silicon layer keeps the gold nanomaterial stable. Furthermore, methods for coating nanoparticles with SiO2 are well established, and methods for the coating of precious metals, semiconductors, and magnetic nanoparticles have been reported [18,19,20,21,22]. SiO2 shells can improve the stability of gold nanorods and inhibit their degradation in harsh thermochemical environments. Moreover, by providing a barrier between cationic surfactants and the environment, SiO2 coatings can improve the biocompatibility of gold nanorods [23]. However, the variation in SERS signals caused by different silica-coating thicknesses is rarely reported.
A Raman spectrum is a kind of scattering spectrum; based on the Raman-scattering effect, the information of a molecular vibration and rotation is obtained, which is applied to the study of molecular structure. However, Raman spectroscopy requires a lot of energy, and fluorescence has great interference in it. SERS enhanced by 104~106 orders of magnitude compared with the Raman-scattering effect: the relative shape and intensity of bands in SERS are different from those in common Raman spectra. Many vibrational bands that do not exist in ordinary Raman spectra can be observed in SERS. Therefore, Raman spectroscopy is not ideal as a means of detection, and the development of SERS techniques means that trace detection is possible. Yang Liu et al. [24] designed ZnO nanorods (NRs) decorated with Au nanoparticles (NPs), which were grafted into a nanowire forest (NWF, 3D) to prepare a Au-ZnO@NWF hybrid material. This composite material had a rich 3D SERS “hotspot” generated by the electromagnetic coupling of the Au NPs densely distributed on the ZnO NRs in three types of spatial locations. Under experimental conditions, the limit of detection (LOD) of this hybrid material for R6G was as high as 10−10 M, and good spectral reproducibility was achieved. In addition, their prepared SERS device successfully achieved the trace detection of various biochemical molecules, with LODs of 10−7 M and 10−9 M for adenine and p-aminothiophenol, respectively. Yaqian Zhao et al. [25] designed nanocone forests consisting of gold nanoparticles (AuNPs), which were then attached to silver NPs. The prepared 3D Ag-AuNPs@NCFs exhibited a plasma hybrid mode, which enabled the formation of an enhanced electromagnetic field. Therefore, this sensor had high sensitivity, excellent performance, and intelligent classification capabilities. The LOD for R6G was as low as 10−9 M. These studies demonstrate that precious-metal nanosurface-enhanced Raman trace-detection technology is highly compelling. Thus, this strategy is a major research focus.
In this paper, a seed-growth method was used to change the amount of silver nitrate solution used to prepare AuNRs, resulting in the formation of AuNRs with different aspect ratios. The SERS performance of these AuNRs was then evaluated using R6G as the probe molecule, and the LOD was established. Moreover, the AuNRs were also used as a substrate for the detection of thiram and piroxicam. Next, AuNRs@SiO2 nanocomposite particles were prepared by coating the AuNRs with silica using the Stöber method, and the relationship between the thickness of the SiO2 shell and R6G-detection performance was explored by changing the amount of tetraethyl orthosilicate (TEOS). The R6G-detection limit, repeatability, and reproducibility of AuNRs@SiO2 were determined. This work provides ideas and detection methods for the trace detection and daily application of precious-metal nanoparticles as the substrate.
2. Materials and Methods
2.1. Chemicals
All the chemical reagents used in this experiment were of an analytical grade. Hexadecyl trimethy lammomium bromide (CTAB, 99.0 wt%), Chloroauric acid (H3AuCl4O4, purity 98%), Sodium borohydride (NaBH4, purity 98%), and Ascorbic acid (C6H8O6, purity 99%) were purchased from Sinopharm Group Chemical Preparations Co., Ltd. (Shanghai, China). Silver nitrate (AgNO3, purity ≥ 99.8%), Tetraethyl orthosilicate (TEOS, C8H20O4Si, purity ≥ 98%), Methyl alcohol (CH3OH, purity ≥ 99.7%), Anhydrous ethanol (C2H5OH, purity ≥ 99.7%), Sodium hydroxide (NaOH, purity ≥ 96%), and Hydrochloric acid (HCl, 37%) were purchased from the Tianjin Beichen Founder reagent factory; Rhodamine 6G (C28H31N2O3Cl, purity 99%) and thiram (C6H12N2S4, purity 97%) were purchased from Shanghai War Cloud Chemical Co., Ltd. (Shanghai, China). Melamine (C3H6N6,purity 99%) and Piroxicam (C15H13N3O4S, purity 98%) were purchased from Tianjin Zhiyuan Chemical Reagent Co., Ltd. (Tianjin, China). Deionized water was used for all experiments.
2.2. Synthesis of AuNRs and AuNRs@SiO2
First, 0.3644 g of CTAB was added to 10 mL of deionized water. This mixture was magnetically stirred at 27 °C and 500 r/min to achieve complete dissolution. Next, 250 μL of 10 mM chloroauric acid aqueous solution and 600 μL of 10 mM NaBH4 aqueous solution were added to the CTAB solution. The combined solution was stirred for 1 h, then was allowed to stand for 3 h before further use. During the experiment, NaBH4 was configured with ice water.
Second, 3.644 g of CTAB was added to 100 mL of deionized water and magnetically stirred at 27 °C and 1000 r/min to achieve complete dissolution. Then, 5 mL of 10 mM chloroauric acid aqueous solution, 2 mL of 10 mM AgNO3 aqueous solution, 2 mL of 1 M HCl, and 800 μL of 0.1 M ascorbic acid were added to the CTAB solution. At this time, the color of the solution rapidly changed from golden yellow to colorless. Next, 240 μL of the Au seed solution from first step was added, and stirring continued for 2 h. During this stirring period, the color of the solution gradually changed to faint burgundy within 30 min. After the synthesis of AuNRs was complete, the solution was centrifuged for 15 min at 10,000 r/min, washed with deionized water 2–3 times, and dispersed in 4.0 mL of deionized water for later use. This preparation process was repeated using different volumes of AgNO3 aqueous solution (1.0 mL, 1.25 mL, 1.5 mL, 1.75 mL, 2.0 mL, and 2.25 mL) to prepare AuNRs with different aspect ratios. No other changes were made to the synthesis procedure.
The room-temperature hydrolysis condensation of TEOS at pH 9–10 was used to coat the surface of the AuNRs with a silica layer. First, the AuNRs were sonicated using an ultrasonic cleaner for 10 min, Next, 1.0932 g of CTAB was added to 30 mL of deionized water. This mixture was magnetically stirred at 22 °C and 600 r/min to completely dissolve the CTAB. Then, the sonicated AuNR solution was added to the CTAB solution. Under continuous stirring, 10 mL of absolute ethanol and 250 μL of 1.0 M NaOH were sequentially added to the gold solution, and the pH was adjusted to 9–10. Next, a total of 150 μL of TEOS solution (20% in methanol solution) was divided into three portions and added to the gold solution within 15 min. This mixture was continuously stirred for 6 h. When the reaction was complete, the solution was centrifuged at 8000 r/min, washed 2–3 times with deionized water, and washed with absolute ethanol 2 times. The obtained AuNRs@SiO2 composite was then dispersed in 4 mL of deionized water for later use. This preparation process was repeated using different TEOS solution volumes (150 μL, 270 μL, 360 μL, and 540 μL) to prepare AuNRs@SiO2 composites with silicon layers of different thicknesses.
2.3. Characterization
Transmission electron microscopy (TEM) was adapted to Tecnai GF20 S-TWIN and characterized at a 200 kV acceleration voltage. The manufacturer is the FEI Company (Hillsboro, OR, USA) of the United States. Raman spectra were recorded for the aqueous solution in the presence of NPs placed in the square groove of a silicon substrate using a RENISHAW-invia Raman microscope with a 785 nm excitation light. The manufacturer is Renishaw UK (Wotton-under-Edge, UK).
3. Results and Discussion
3.1. TEM Analysis of AuNRs and AuNRs@SiO2
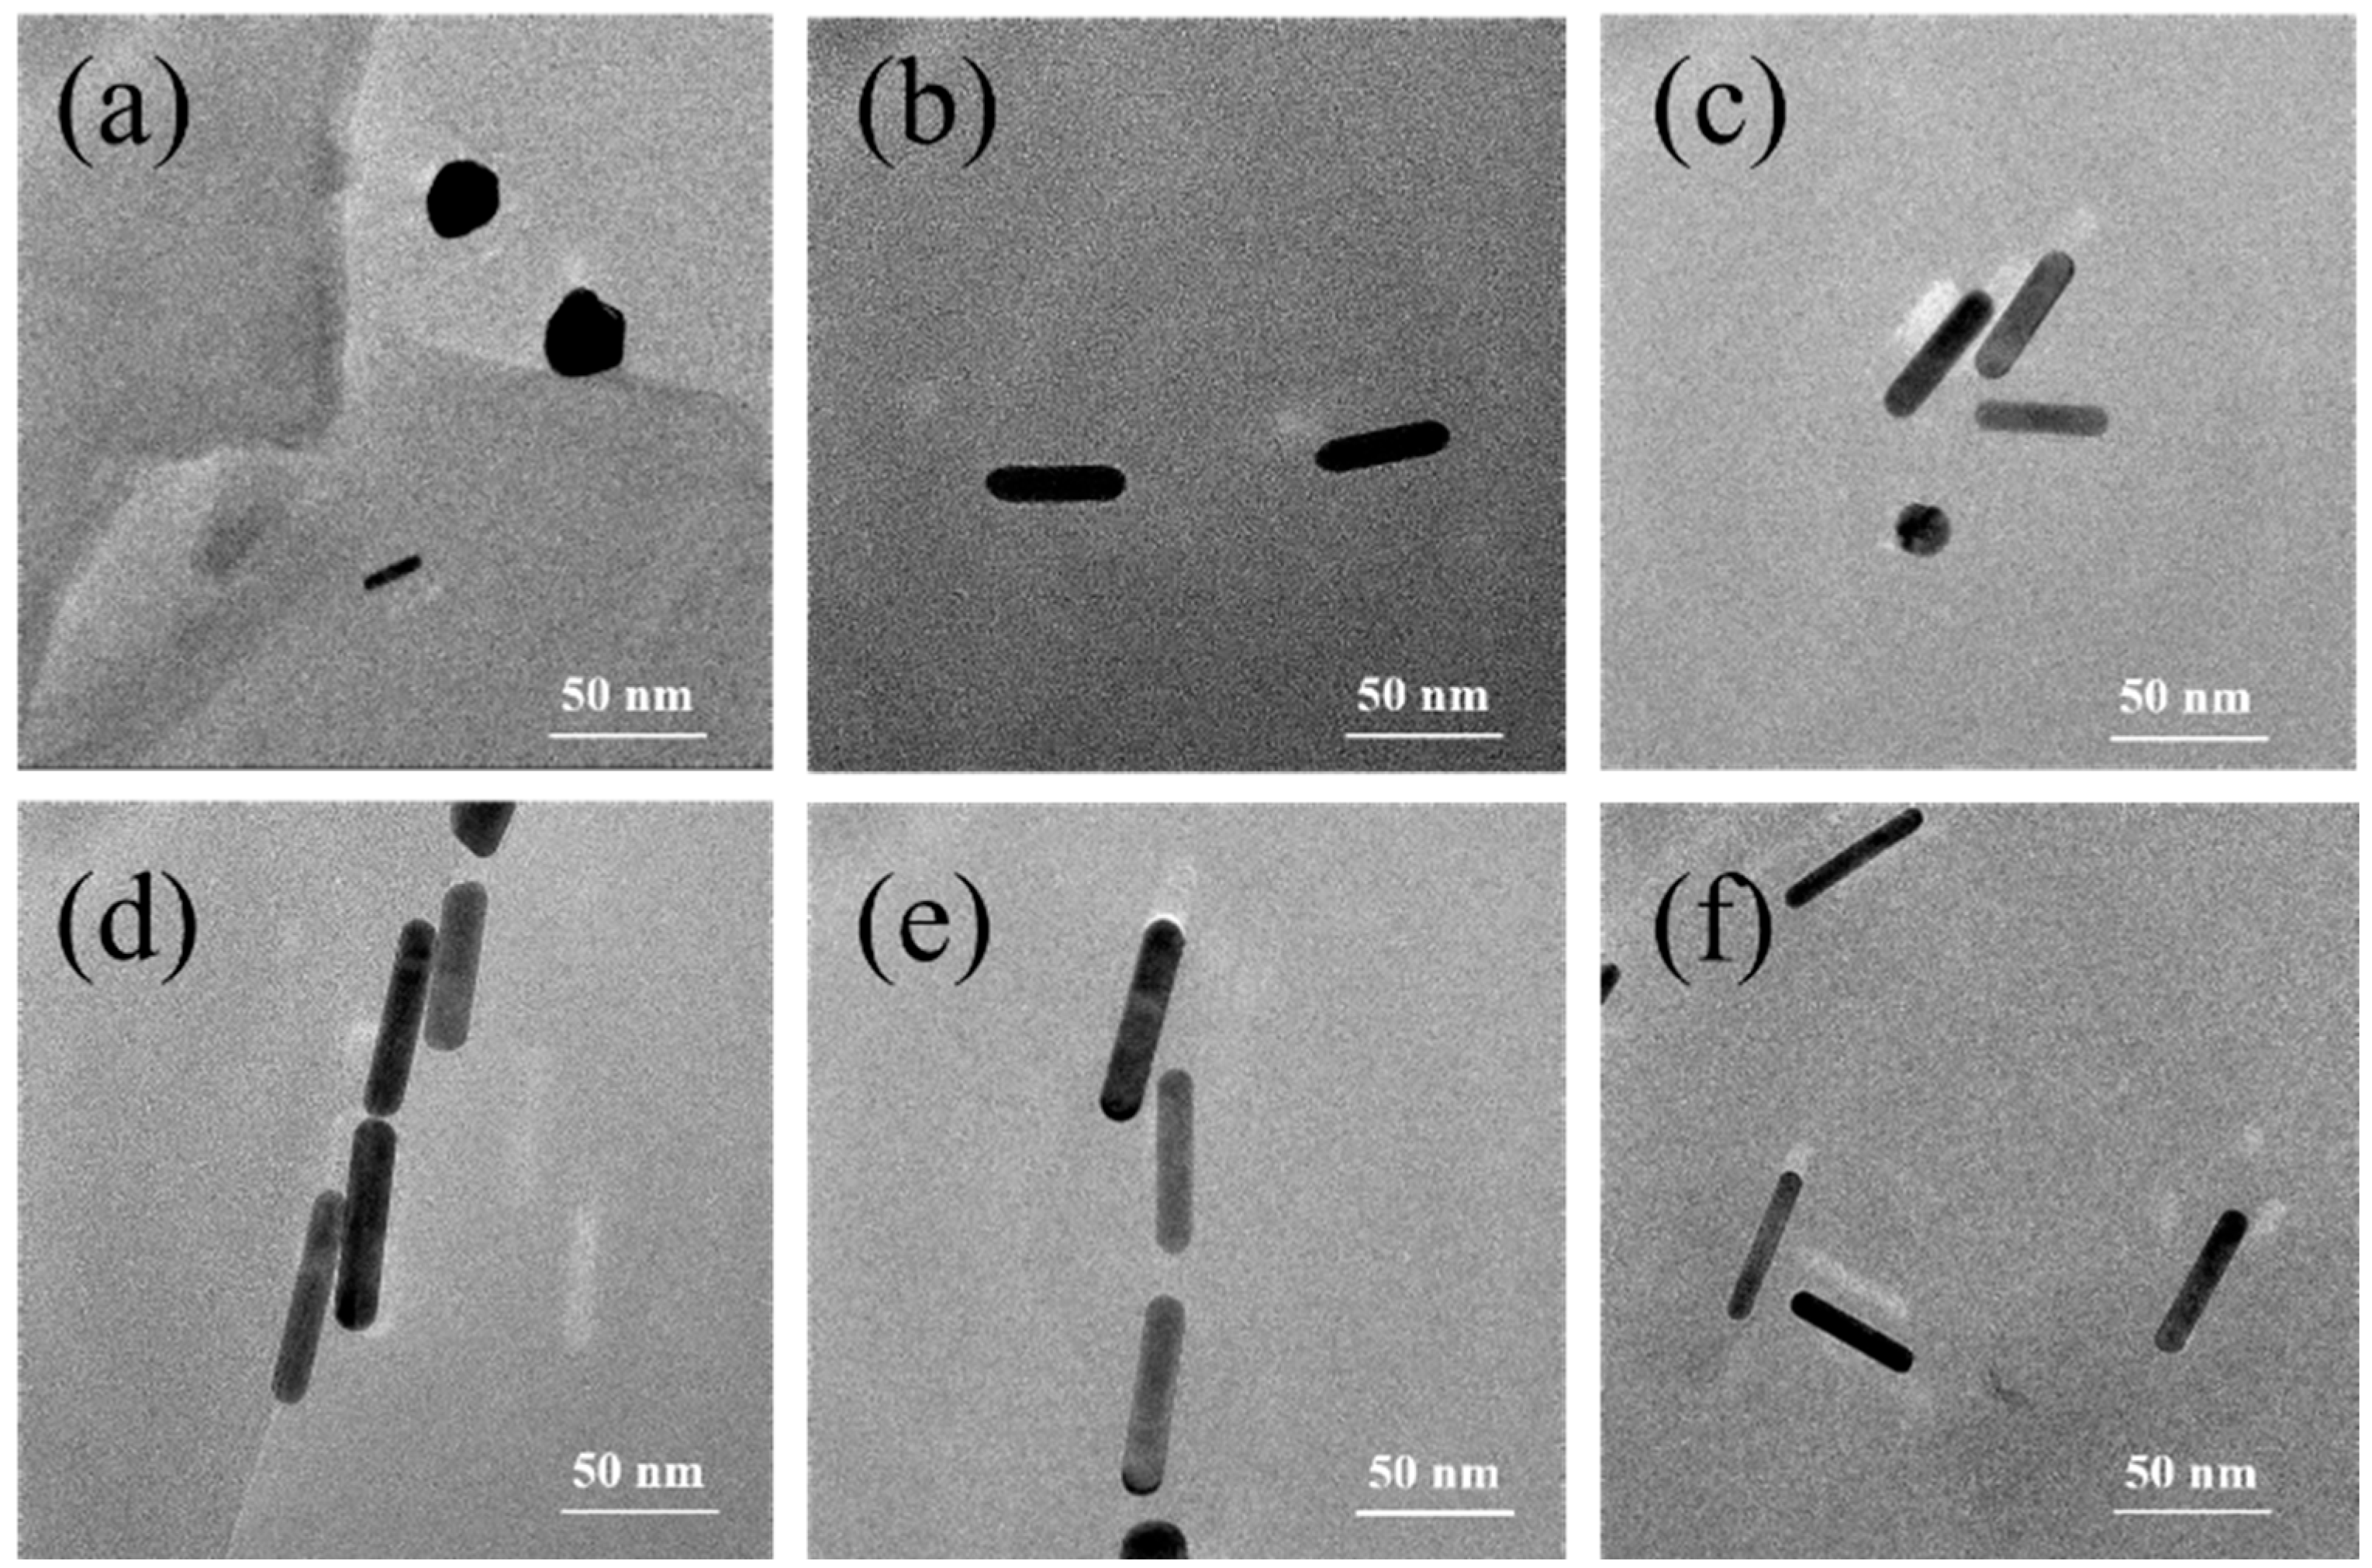
TEM images of the AuNRs show that the length of the Au nanorods gradually increases with increasing silver-ion content in the reaction, while the width does not significantly change (Figure 1). Using 1.0 mL, 1.25 mL, 1.5 mL, 1.75 mL, 2.0 mL, and 2.25 mL of the AgNO3 solution during synthesis provides gold nanorods with aspect ratios of 1.97, 3.06, 4.34, 4.48, 4.53, and 4.33, respectively. When less than 20 μmol Ag+ is present in the nanorod growth solution, the length of the Au nanorods increases with increasing Ag+ concentration, while the nanorod diameter remains the same. However, when more than 20 μmol Ag+ is present in the growth solution, the aspect ratio of the Au nanorods significantly decreases with increasing Ag+ concentration.
AuNRs with an aspect ratio of 4.53 were coated with SiO2 shells of different thicknesses, as shown in the TEM images in Figure 2. Using TEOS solution (20% in methanol) volumes of 150 μL, 270 μL, 360 μL, and 540 μL results in silicon-shell thicknesses of 15 nm, 30 nm, 40 nm, and 45 nm, respectively. Clearly, the thickness of the silicon shell is positively correlated with the amount of TEOS added during synthesis.
3.2. SERS Performance of AuNR and AuNRs@SiO2 Substrates
3.2.1. SERS Performance of AuNR Substrates
The SERS performance of the AuNRs was evaluated using R6G as a probe. A solution containing 1 × 10⁻⁵ M R6G solution was configured and mixed with the AuNRs at a 1:1 ratio. This mixture was sonicated for 10 min, and the Raman signal was then measured, as shown in Figure 3. The R6G solution prepared without AuNRs only exhibits a relatively weak signal. In contrast, the solutions containing gold nanorods show significant signal enhancement. Strong signals can be seen at 610 cm−1, 770 cm−1, 1124 cm−1, 1186 cm−1, 1284 cm−1, 1361 cm−1, 1510 cm−1, and 1647 cm−1. The peak at 1510 cm−1 is particularly strong and can be regarded as a valid representative peak of the test signal. Comparing these Raman spectra shows that the strongest Raman signal is achieved by the AuNRs prepared using 2 mL of 10 mM AgNO3 solution. These nanorods have the highest aspect ratio of 4.53 and are the longest of the prepared nanorods, as indicated by the TEM analysis (Figure 1).
The gold nanorods prepared with 2 mL of 10 mM AgNO3 solution were used for the detection of R6G solutions with concentrations ranging from 10−5 M to 10−10 M, as displayed in Figure 4. When the R6G concentration is 10−10 M, the peak strength of the peak at 1510 cm−1 is difficult to observe. Therefore, the LOD for R6G is reached at a concentration of 10−9 M.
The reproducibility of the AuRs prepared with 2 mL of 10 mM AgNO3 solution was evaluated for the detection of the 10−5 M R6G solution, as shown in Figure 5. The prepared AuNRs were tested after storage in a dry environment at room temperature in the dark for 1 day, 5 days, 10 days, 15 days, and 30 days. As displayed in Figure 5a, the intensity of the characteristic peaks does not significantly change after storage for up to 30 days, confirming the good stability and reproducibility of the AuNRs. Figure 5b displays a comparison of the peak intensity at 1361 cm−1, obtained by taking any ten points on the “coffee ring” for signal acquisition. The variation in intensity is small, demonstrating the good repeatability of AuNRs as a substrate for the trace detection of R6G.
The AuNRs prepared using 2 mL of 10 mM AgNO3 solution were further studied as a substrate for the detection of thiram in acetone. The Raman-scattering intensities obtained for solutions of different concentrations are shown in Figure 6, indicating that the LOD is 10−5 M. These results confirm the ideal detection performance of the AuNR substrate for thiram solutions.
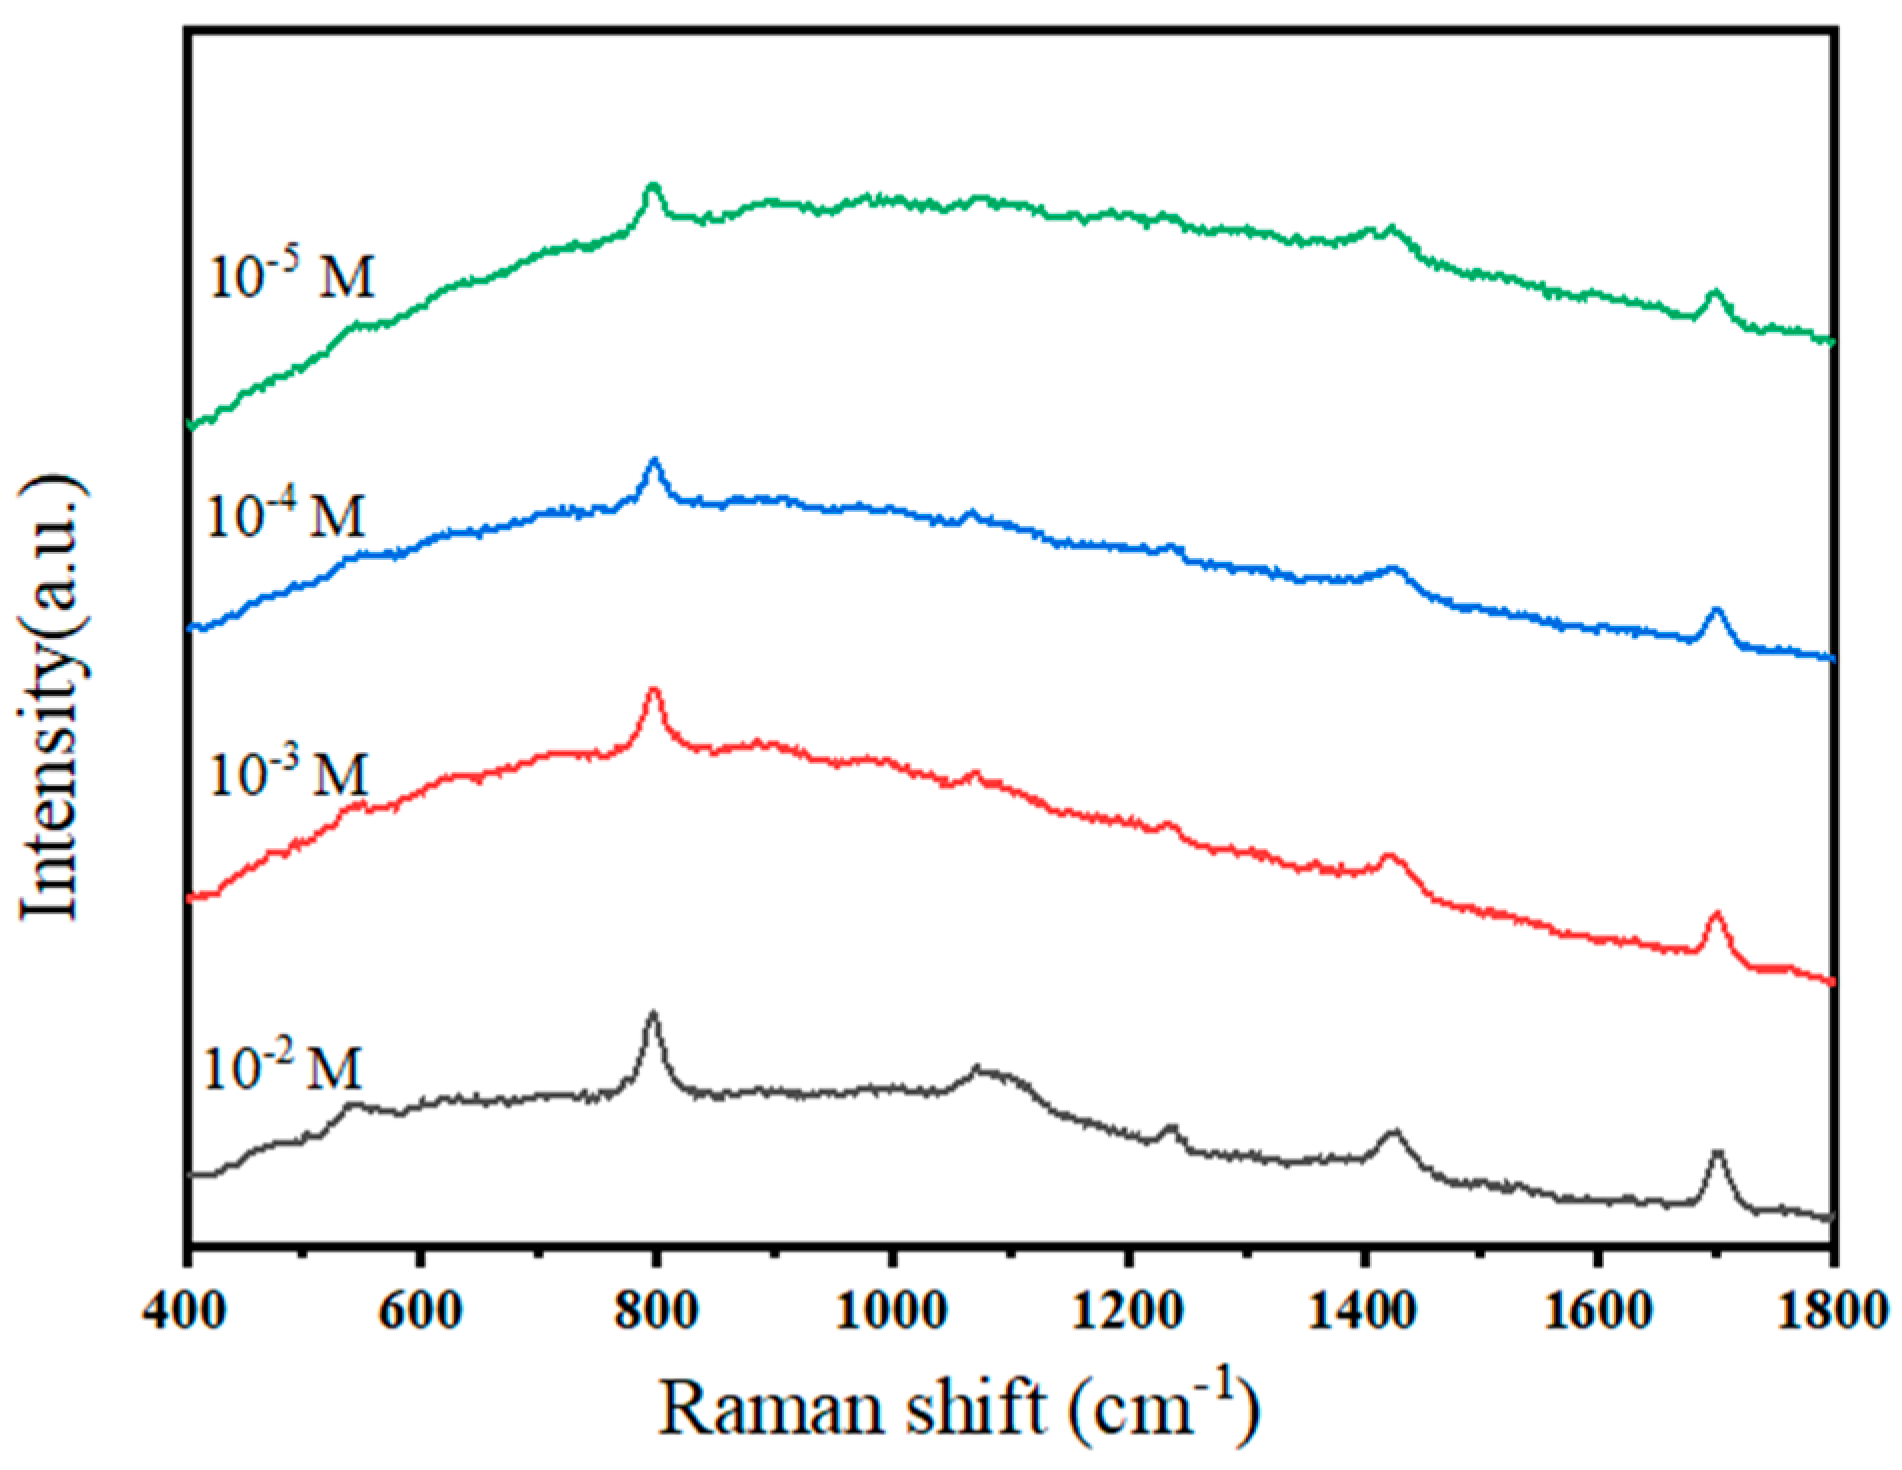
The AuNRs prepared using 2 mL of 10 mM AgNO3 solution were also studied as a substrate for the detection of solutions with different piroxicam concentrations. The Raman-scattering intensities obtained for different piroxicam concentrations are shown in Figure 7, and the LOD for piroxicam is 10−3 M. This indicates that the Raman-signal intensity of the piroxicam solution is enhanced by using the AuNRs as a substrate.
3.2.2. SERS Performance of AuNRs@SiO2 Substrates
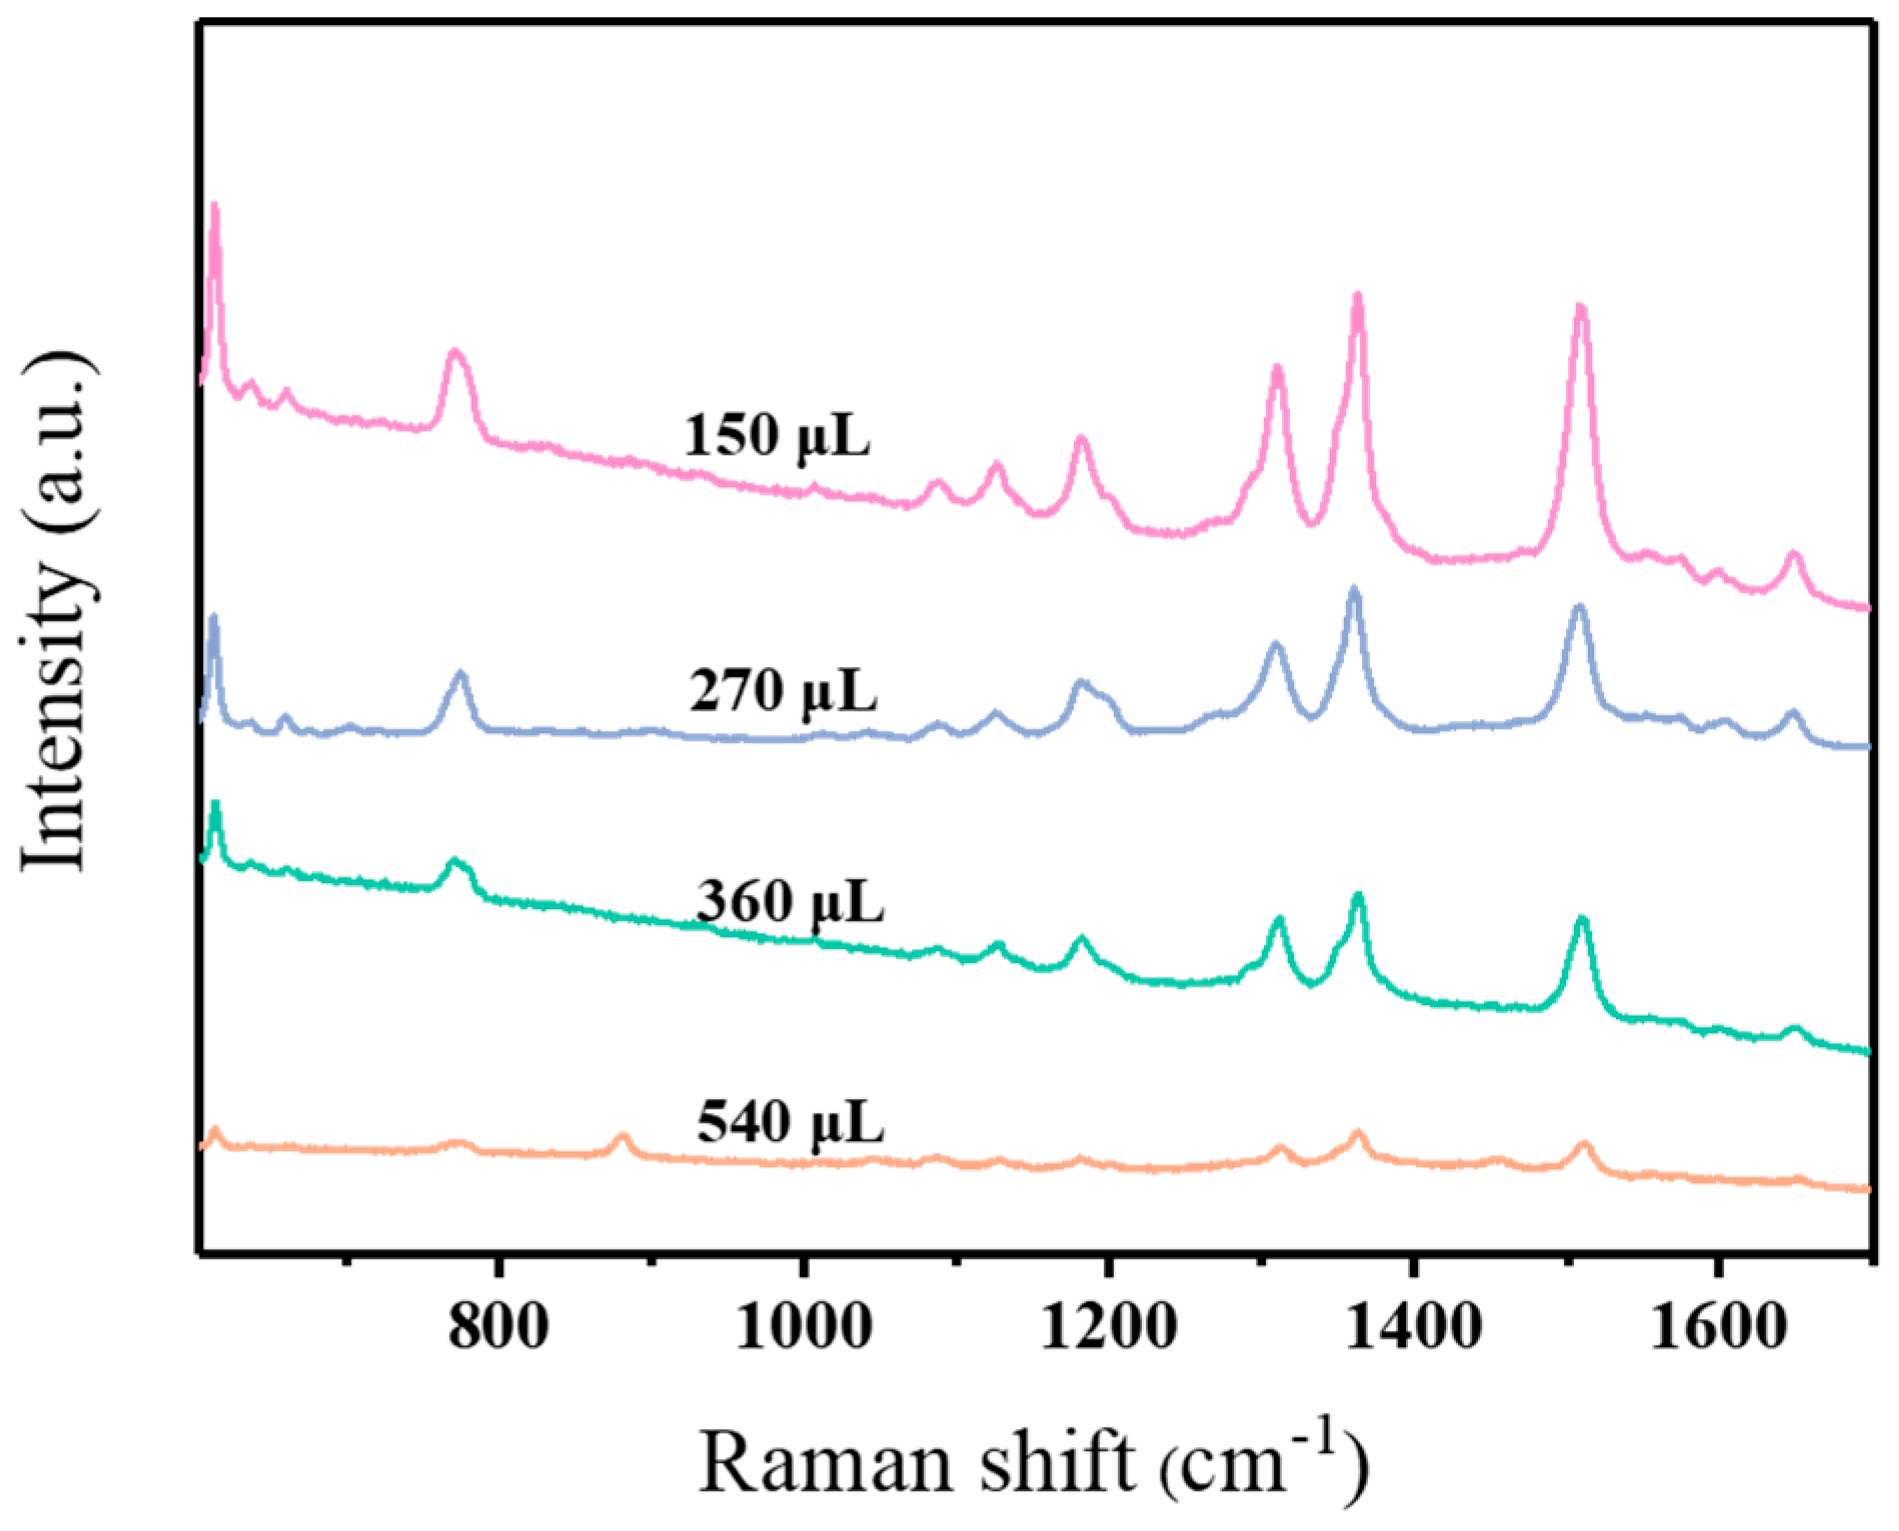
AuNRs@SiO2 substrates with different SiO2 coating thicknesses were prepared using the AuNRs with an aspect ratio of 4.53 for the detection of a 10−5 M R6G solution, as shown in Figure 8. Using the TEOS solution (20% in methanol, volumes of 150 μL, 270 μL, 360 μL, or 540 μL) to coat the AuNRs negatively affects the signal enhancement of the R6G solution. This is because silica acts as a spacer to hinder the exchange of electrons, which affects the Raman signal. The AuNRs@SiO2 substrate with a SiO2-shell thickness of about 15 nm (i.e., prepared with 150 μL of TEOS solution) provides the strongest R6G Raman signal of these substrates. As the SiO2-shell thickness increases, the exchange of electrons is increasingly hindered, leading to an increasingly reduced Raman signal.
The use of AuNRs@SiO2 as a substrate was studied using different R6G concentrations (10−6 M to 10−10 M) to determine the LOD for R6G, as shown in Figure 9. With decreasing R6G concentration, the characteristic peak of R6G declines. A very low-intensity peak can be observed at a concentration of 10−9 M, but this characteristic peak is no longer observable at 10−10 M. Therefore, the lower LOD for R6G is 10−9 M.
The reproducibility and repeatability of detecting the 10−5 M R6G solution using AuNRs@SiO2 with a thickness of about 15 nm as the substrate were studied, as shown in Figure 10. The prepared AuNRs@SiO2 substrate was stored under dry conditions at room temperature in the dark for 0 days, 5 days, 10 days, 15 days, and 30 days prior to testing, as displayed in Figure 10a. After storage for different lengths of time, similar characteristic peak intensities were obtained, demonstrating that the AuNRs@SiO2 substrate has stable properties and good reproducibility. Figure 10b shows a comparison of the peak intensity at 1361 cm−1 obtained by taking any ten points on the “coffee ring” for signal acquisition. The intensity of this peak does not significantly vary, confirming the good repeatability of the AuNRs@SiO2 substrate. This is attributed to the adhesion of the silica layer stabilizing the gold nanorods.
The AuNRs@SiO2 prepared using 150 μL of TEOS solution were also studied as a substrate for the detection of solutions with different thiram concentrations. The Raman-scattering intensities obtained for different thiram concentrations are shown in Figure 11, and the LOD for thiram is 10−5 M.
As shown in Figure 12, the acetone solution of Piroxicam of different concentrations was used as the probe, and AuNRs@SiO2 prepared with 150 μL of TEOS solution was added as the substrate. The Piroxicam solution of different concentrations was tested to analyze Raman-scattering intensity. The detection limit of the Piroxicam solution was 10−5 M. AuNRs@SiO2 as a substrate can enhance well the Raman-signal strength of a Piroxicam solution.
4. Conclusions
Based on the above comparison, it was found that for AuNRs@SiO2, the detection sensitivity is slightly higher, which is due to the efficiency of the non-radiative energy transfer between the metal surface and the detection object [26,27], which is theoretically believed to depend on the competition between Au and the detection object due to distance [28,29]. The non-radiative energy transfer between Au and the analyte forms a competitive mechanism with the radiative energy transfer, indicating the important role played by the thickness of the interlayer SiO2. The result of competition will be an appropriate thickness of the interlayer, which will result in the detection lower limit reaching the highest value.
Core–shell structures consisting of gold nanorods coated with SiO2 (AuNRs@SiO2) were prepared, and the crystal structures, microscopic morphologies, and elemental compositions of the uncoated AuNRs and coated AuNRs@SiO2 nanomaterials were analyzed by TEM and SERS. Raman spectroscopy was used to analyze the surface Raman-enhancement effect of the prepared substrates and to detect rhodamine 6G at low concentrations. The conclusions are as follows:
Au nanorods were prepared by reducing chloroauric acid in an alkaline environment by a seed-growth method using CTAB as a template, and AuNRs with different length–diameter ratios were prepared by changing the amount of AgNO3 added during synthesis. Next, a SiO2-shell layer was coated on the surface of the AuNRs using TEOS as a silicon source via self-assembly. The Raman-scattering intensity of the gold nanorods was studied using rhodamine 6G (R6G), thiram, melamine, and piroxicam, and detection limits of 10−8 M, 10−5 M and 10−3 M were, respectively, achieved. Using AuNRs@SiO2 as the base and R6G, thiram, and piroxicam as the probes, measurable detection limits of 10−9 M, 10−6 M, and 10−5 M were achieved, and this composite also showed excellent repeatability and reproducibility. This is due to the competition between Au and the detected object due to distance, indicating the important role played by the thickness of the spacer layer of SiO2.
Author Contributions
H.L. and S.D. proposed the concept of this work. Y.T. and S.Y. conducted the experiments and data analysis. L.R. and R.M. carried out measurements. W.Z. and H.Z. supervised the research. H.L., Y.T. and S.D. wrote the manuscript. All authors have read and agreed to the published version of the manuscript.
Funding
This work was supported by the National Natural Science Foundation of China (Grant No. 51702006), the Youth Science and Technology New Star Plan of Shaanxi Province (Grant No. 2021KJXX-50), the Natural Science Foundation Research Project of Shaanxi Province (2023-JC-YB-120), and the Shaanxi Provincial Department of Education Special Scientific Research Project (grant number 22JK0244).
Institutional Review Board Statement
Not applicable.
Informed Consent Statement
Not applicable.
Data Availability Statement
Data are contained within the article.
Conflicts of Interest
The authors declare no conflicts of interest.
References
- Mokobia, K.E.; Ifijen, I.H.; Ikhuoria, E.U. ZnO-NPs-coated implants with osteogenic properties for enhanced osseointegration. In TMS Annual Meeting & Exhibition; Springer Nature: Cham, Switzerland, 2023; pp. 288–300. [Google Scholar]
- Rahman, A.; Rasid, H.; Ali, M.I.; Yeachin, N.; Alam, M.S.; Hossain, K.S.; Kafi, M.A. Facile Synthesis and Application of Ag-NPs for Controlling Antibiotic-Resistant Pseudomonas spp. and Bacillus spp. in a Poultry Farm Environment. J. Nanosci. Nanotechnol. 2023, 2023, 6260066. [Google Scholar] [CrossRef]
- Ziental, D.; Błaszkiewicz, P.; Długaszewska, J.; Güzel, E.; Dudkowiak, A.; Sobotta, L. Modified gold nanoparticles modulated fluorescence and singlet oxygen generation of pheophorbide a as an effective platform for photodynamic therapy against Staphylococcus aureus. Eur. J. Inorg. Chem. 2024, 27, e202300668. [Google Scholar] [CrossRef]
- Chen, S.; Zhu, P.; Mao, L.; Wu, W.; Lin, H.; Xu, D.; Lu, X.; Shi, J. Piezocatalytic medicine: An emerging frontier using piezoelectric materials for biomedical applications. Adv. Mater. 2023, 35, 2208256. [Google Scholar] [CrossRef] [PubMed]
- Pandit, C.; Roy, A.; Ghotekar, S.; Khusro, A.; Islam, M.N.; Emran, T.B.; Lam, S.E.; Khandaker, M.U.; Bradley, D.A. Biological agents for synthesis of nanoparticles and their applications. J. King Saud Univ. Sci. 2022, 34, 101869. [Google Scholar] [CrossRef]
- Wen, C.; Guo, X.; Gao, C.; Zhu, Z.; Meng, N.; Shen, X.C.; Liang, H. NIR-II-responsive AuNRs@ SiO2–RB@MnO2 nanotheranostic for multimodal imaging-guided CDT/PTT synergistic cancer therapy. J. Mater. Chem. B 2022, 10, 4274–4284. [Google Scholar] [CrossRef] [PubMed]
- Zhao, L.; Li, T.; Xu, X.; Xu, Y.; Li, D.; Song, W.; Zhan, T.; He, P.; Zhou, H.; Xu, J.J.; et al. Polyhedral Au Nanoparticle/MoOx Heterojunction-Enhanced Ultrasensitive Dual-Mode Biosensor for miRNA Detection Combined with a Nonenzymatic Cascade DNA Amplification Circuit. Anal. Chem. 2023, 95, 9271–9279. [Google Scholar] [CrossRef] [PubMed]
- Wang, Z.; Liu, Y.; Wang, H.; Wang, S.; Liu, K.; Xu, T.; Jiang, J.; Chen, Y.C.; Liu, T. Ultra-sensitive DNAzyme-based optofluidic biosensor with liquid crystal-Au nanoparticle hybrid amplification for molecular detection. Sens. Actuators B Chem. 2022, 359, 131608. [Google Scholar] [CrossRef]
- Zheng, W.J.; Zhou, Z.L.; Lv, Q.Y.; Song, X.; Zhang, W.X.; Cui, H.F. Oxygen-Generated Hierarchical-Structured AuNRs@MnO2@SiO2 Nanocarrier for Enhanced NIR-and H2O2-Responsive Mild-Hyperthermia Photodynamic/Photothermal Combined Tumor Therapy. Adv. Ther. 2022, 5, 2200108. [Google Scholar] [CrossRef]
- Gupta, N.; Malviya, R. Understanding and advancement in gold nanoparticle targeted photothermal therapy of cancer. Biochim. Biophys. Acta (BBA) Rev. Cancer 2021, 1875, 188532. [Google Scholar] [CrossRef]
- Han, H.H.; Kim, S.J.; Kim, J.; Park, W.; Kim, C.; Kim, H.; Hahn, S.K. Bimetallic hyaluronate-modified Au@ Pt nanoparticles for noninvasive photoacoustic imaging and photothermal therapy of skin cancer. ACS Appl. Mater. Interfaces 2023, 15, 11609–11620. [Google Scholar] [CrossRef]
- Wang, C.; Nie, X.G.; Shi, Y.; Zhou, Y.; Xu, J.J.; Xia, X.H.; Chen, H.Y. Direct Plasmon-Accelerated Electrochemical Reaction on Gold Nanoparticles. ACS Nano 2017, 11, 5897–5905. [Google Scholar] [CrossRef] [PubMed]
- Mao, W.F.; Wang, M.M. Influencing Factors and Research Progress of Local Surface Plasmon Resonance. Adv. Anal. Chem. 2021, 11, 18. [Google Scholar] [CrossRef]
- Zhang, Y.Y.; Yuan, G.F.; Ye, Z.H.; Yang, S.; Yang, Z.R. Polarization-Dependent Surface Enhanced Raman Scattig on Sliver Nanowires. Spectrosc. Spect. Anal. 2023, 43, 171–172. [Google Scholar]
- Xu, J.; Zhang, Y.; Yan, J.; Yang, Y.; Zhou, D.; Qiu, J.; Wang, Q.; Liu, C. Varying aspect ratios of Au nanorods with LSPR effect for efficient enhanced upconversion luminescence. Inorg. Chem. Commun. 2023, 156, 111134. [Google Scholar] [CrossRef]
- Chen, T.; Tong, F.; Enderlein, J.; Zheng, Z. Plasmon-driven modulation of reaction pathways of individual Pt-modified Au nanorods. Nano Lett. 2020, 20, 3326–3330. [Google Scholar] [CrossRef] [PubMed]
- Cai, C.; Liu, J.C.; Ji, P.; Lin, Y.X.; Chen, L. Synthesis of high-density Au@Ag core-shell nanoparticles composite PA66 nanofibers and application in SERS detection of dyes. Mod. Chem. Ind. 2024, 44, 234–238+242. [Google Scholar]
- Zhang, W.X.; Zhou, Z.L.; Lv, Q.Y.; Song, X.; Chen, J.; Niu, C.B.; Cui, H.F. O2-Generation-Enhanced Responsive Starvation/Photothermal Synergistic Tumor Therapy Based on the AuNRs@MnO2@SiO2 Nanocarrier and Thermosensitive Biomimetic Camouflaging. ACS Appl. Bio Mater. 2023, 6, 4775–4790. [Google Scholar] [CrossRef]
- Ansah, I.B.; Lee, S.H.; Yang, J.Y.; Mun, C.; Jung, S.; Jung, H.S.; Lee, M.Y.; Kang, T.; Lee, S.; Kim, D.H.; et al. In-situ fabrication of 3D interior hotspots templated with a protein@ Au core–shell structure for label-free and on-site SERS detection of viral diseases. Biosens. Bioelectron. 2023, 220, 114930. [Google Scholar] [CrossRef]
- Guo, X.H.; Ma, J.Q. Fabrication of Magnetic Fe3O4@SiO2@TiO2-Au with Core-shell Structure and Its Photocatalytic Reduction Activity. Acta Mater. Compos. Sin. 2024, 42, 1–11. [Google Scholar]
- Zhang, J.; Teng, F.; Hu, B.; Liu, W.; Huang, Y.; Wu, J.; Wang, Y.; Su, H.; Yang, S.; Zhang, L.; et al. Early Diagnosis and Prognosis Prediction of Pancreatic Cancer Using Engineered Hybrid Core-Shells in Laser Desorption/Ionization Mass Spectrometry. Adv. Mater. 2024, 2311431. [Google Scholar] [CrossRef]
- Zhao, Y.; Sang, L.; Ren, Z. Decoupling the role of thermoplasmonics effect and hot electron injection of metallic nanoparticles in photoelectrochemical system. Sol. Energy Mater. Sol. Cells 2024, 267, 112728. [Google Scholar] [CrossRef]
- Wu, P.; Sun, X.; Hao, N.; Wang, L.; Huang, J.; Tang, J. Facile In-Situ photocatalytic reduction of AuNPs on multilayer Core-Shell Fe3O4@SiO2@PDA magnetic nanostructures and their SERS application. Spectrochim. Acta A 2023, 302, 123101. [Google Scholar] [CrossRef] [PubMed]
- Liu, Y.; Li, R.; Zhou, N.; Li, M.; Huang, C.; Mao, H. Recyclable 3D SERS devices based on ZnO nanorod-grafted nanowire forests for biochemical sensing. Appl. Surf. Sci. 2022, 582, 152336. [Google Scholar] [CrossRef]
- Zhao, Y.; Huang, R.; Li, X.; Mao, X.; Xu, S.; Zhou, N.; Li, S.; Mao, H.; Huang, C. A SERS sensor based on 3D nanocone forests capable of intelligent classification of aquatic product dyes. J. Mater. Chem. C 2023, 11, 14237–14247. [Google Scholar] [CrossRef]
- Prasad, R.; Selvaraj, K. Effective Distribution of Gold Nanorods in Ordered Thick Mesoporous Silica: A Choice of Noninvasive Theranostics. ACS Appl. Mater. Interfaces 2023, 15, 47615–47627. [Google Scholar] [CrossRef] [PubMed]
- Liu, N.; Prall, B.S.; Klimov, V.I. Hybrid gold/silica/nanocrystal-quantum-dot superstructures: Synthesis and analysis of semiconductor-metal interactions. J. Am. Chem. Soc. 2006, 128, 15362–15363. [Google Scholar] [CrossRef] [PubMed]
- Park, W.; Lu, D.; Ahn, S. Plasmon enhancement of luminescence upconversion. Chem. Soc. Rev. 2015, 44, 2940–2962. [Google Scholar] [CrossRef]
- Wu, D.M.; García-Etxarri, A.; Salleo, A. Plasmon-enhanced upconversion. J. Phys. Chem. Lett. 2014, 5, 4020–4031. [Google Scholar] [CrossRef]
Figure 1.
TEM images of AuNRs prepared with different volumes of 10 mM AgNO3 solution: (a) 1.0 mL, (b) 1.25 mL, (c) 1.5 mL, (d) 1.75 mL, (e) 2.0 mL, and (f) 2.25 mL.
Figure 1.
TEM images of AuNRs prepared with different volumes of 10 mM AgNO3 solution: (a) 1.0 mL, (b) 1.25 mL, (c) 1.5 mL, (d) 1.75 mL, (e) 2.0 mL, and (f) 2.25 mL.

Figure 2.
TEM images of AuNRs@SiO2 composites prepared with different volumes of TEOS solution (20% in methanol): (a) 150 μL, (b) 270 μL, (c) 360 μL, and (d) 540 μL.
Figure 2.
TEM images of AuNRs@SiO2 composites prepared with different volumes of TEOS solution (20% in methanol): (a) 150 μL, (b) 270 μL, (c) 360 μL, and (d) 540 μL.

Figure 3.
SERS-detection profiles of 10−5 M R6G probe molecules enhanced by AuNR substrates prepared with different volumes of AgNO3 solution.
Figure 3.
SERS-detection profiles of 10−5 M R6G probe molecules enhanced by AuNR substrates prepared with different volumes of AgNO3 solution.
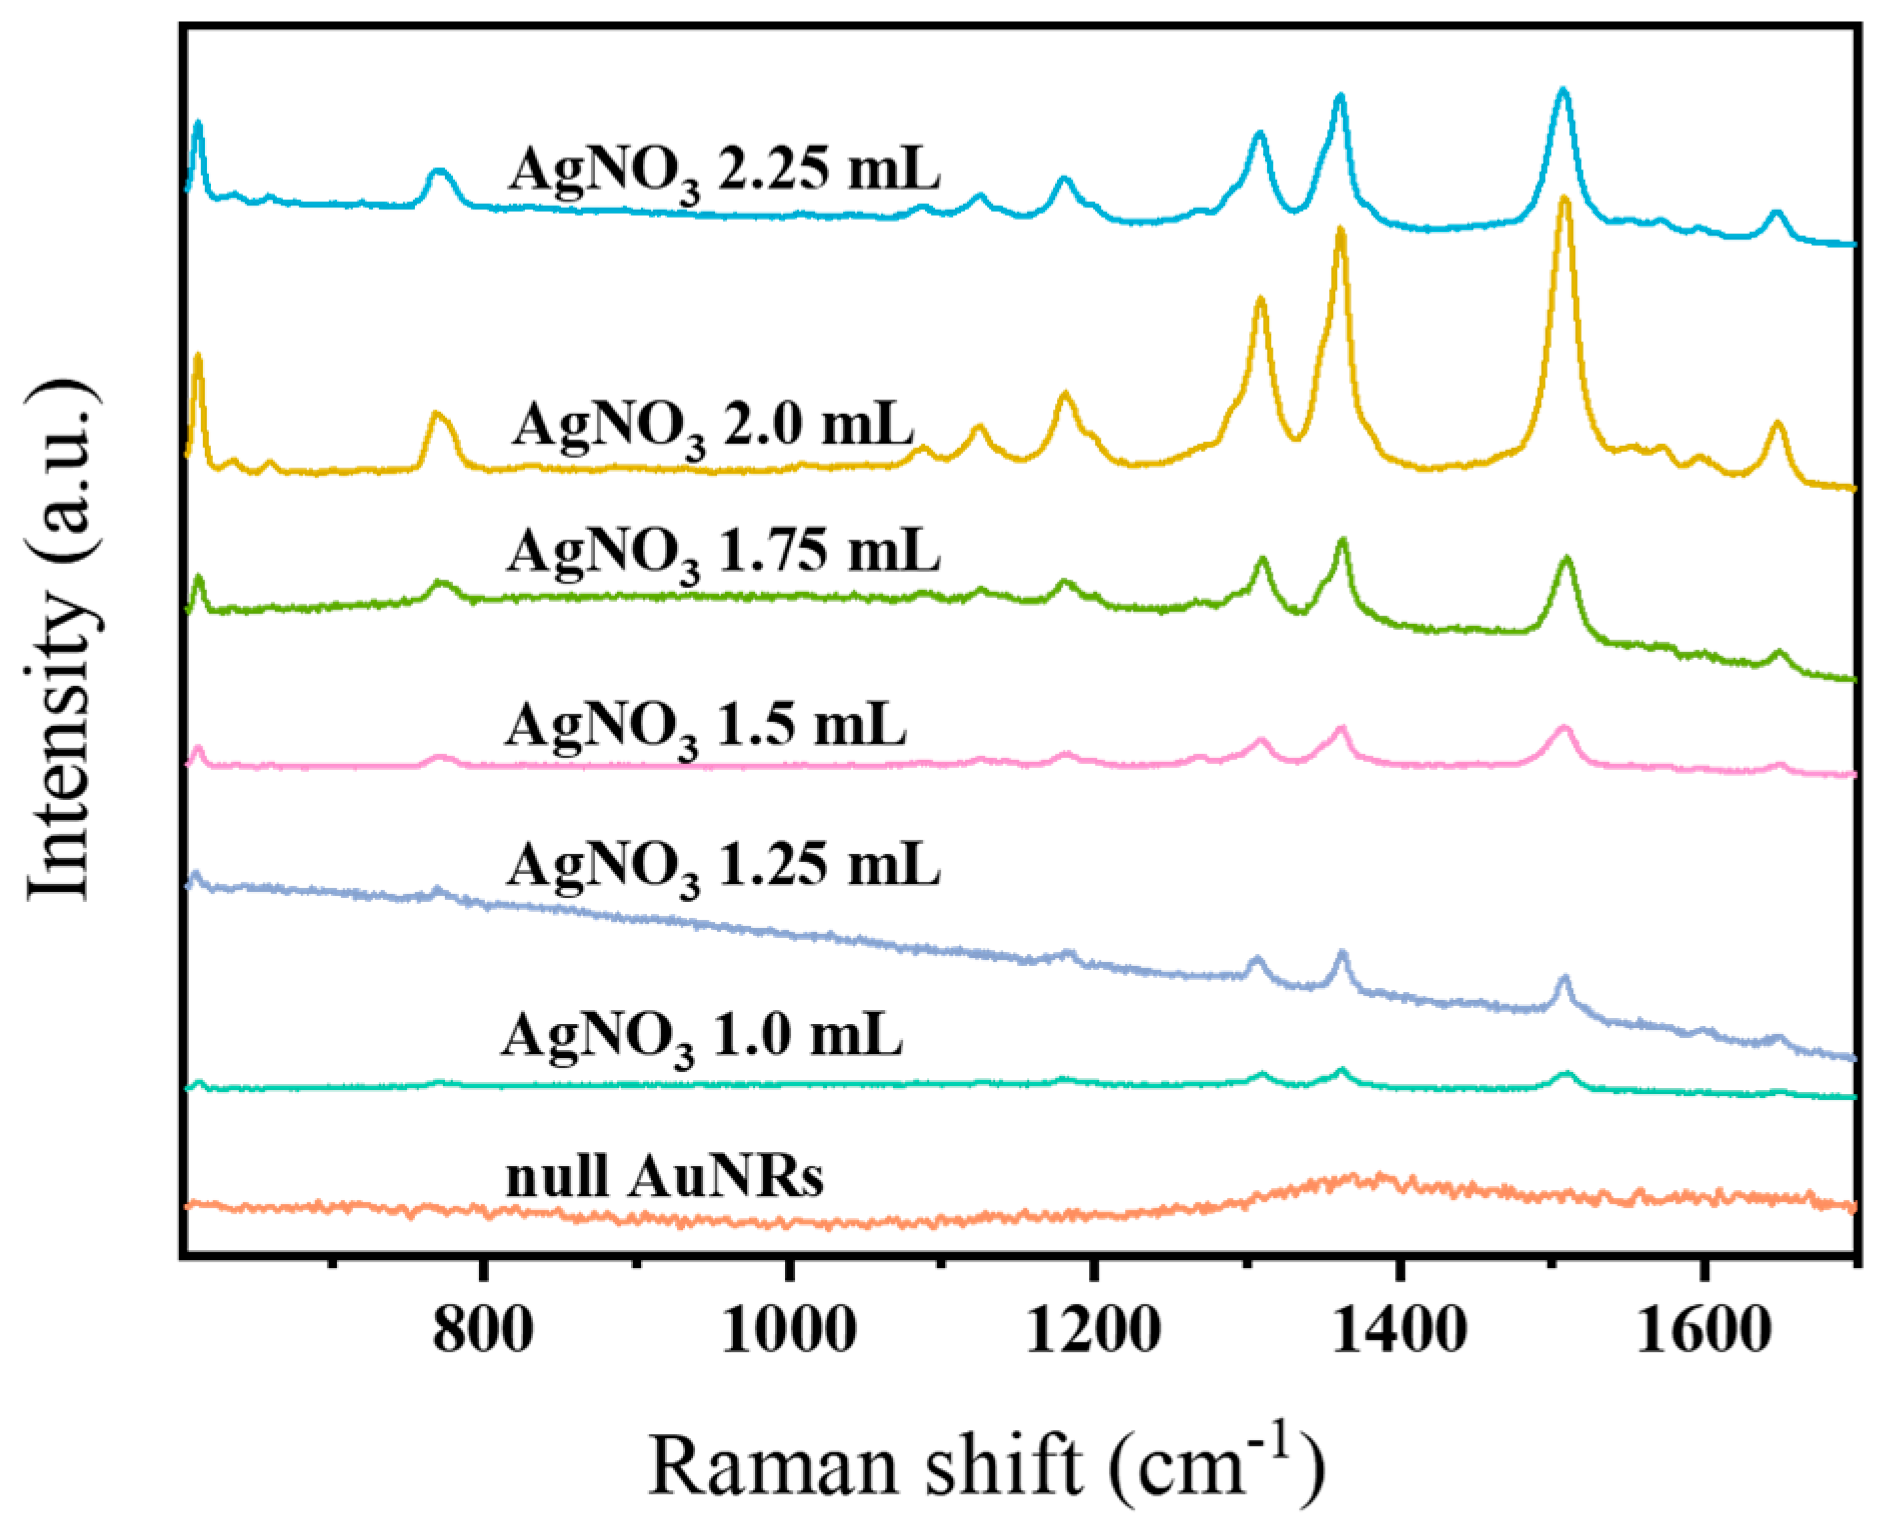
Figure 4.
SERS-detection profiles of R6G solutions of different concentrations enhanced by AuNR substrates prepared with 2 mL of 10 mM AgNO3 solution.
Figure 4.
SERS-detection profiles of R6G solutions of different concentrations enhanced by AuNR substrates prepared with 2 mL of 10 mM AgNO3 solution.

Figure 5.
(a) SERS-detection profiles of R6G probe molecules enhanced by AuNR substrates stored for different amounts of time; (b) intensity histogram of the peak at 1361 cm−1 obtained using 10 randomly acquired signals.
Figure 5.
(a) SERS-detection profiles of R6G probe molecules enhanced by AuNR substrates stored for different amounts of time; (b) intensity histogram of the peak at 1361 cm−1 obtained using 10 randomly acquired signals.

Figure 6.
SERS-detection profiles of thiram solution probe molecules with a AuNR substrate.

Figure 7.
SERS-detection profiles of piroxicam solutions enhanced by a AuNR substrate.

Figure 8.
SERS-detection profiles of 10−5 M R6G probe molecules enhanced by AuNRs@SiO2 substrates prepared with different volumes of TEOS solution (20% in methanol).
Figure 8.
SERS-detection profiles of 10−5 M R6G probe molecules enhanced by AuNRs@SiO2 substrates prepared with different volumes of TEOS solution (20% in methanol).

Figure 9.
SERS-detection profiles of different R6G concentrations enhanced by using AuNRs@SiO2 as a substrate.
Figure 9.
SERS-detection profiles of different R6G concentrations enhanced by using AuNRs@SiO2 as a substrate.
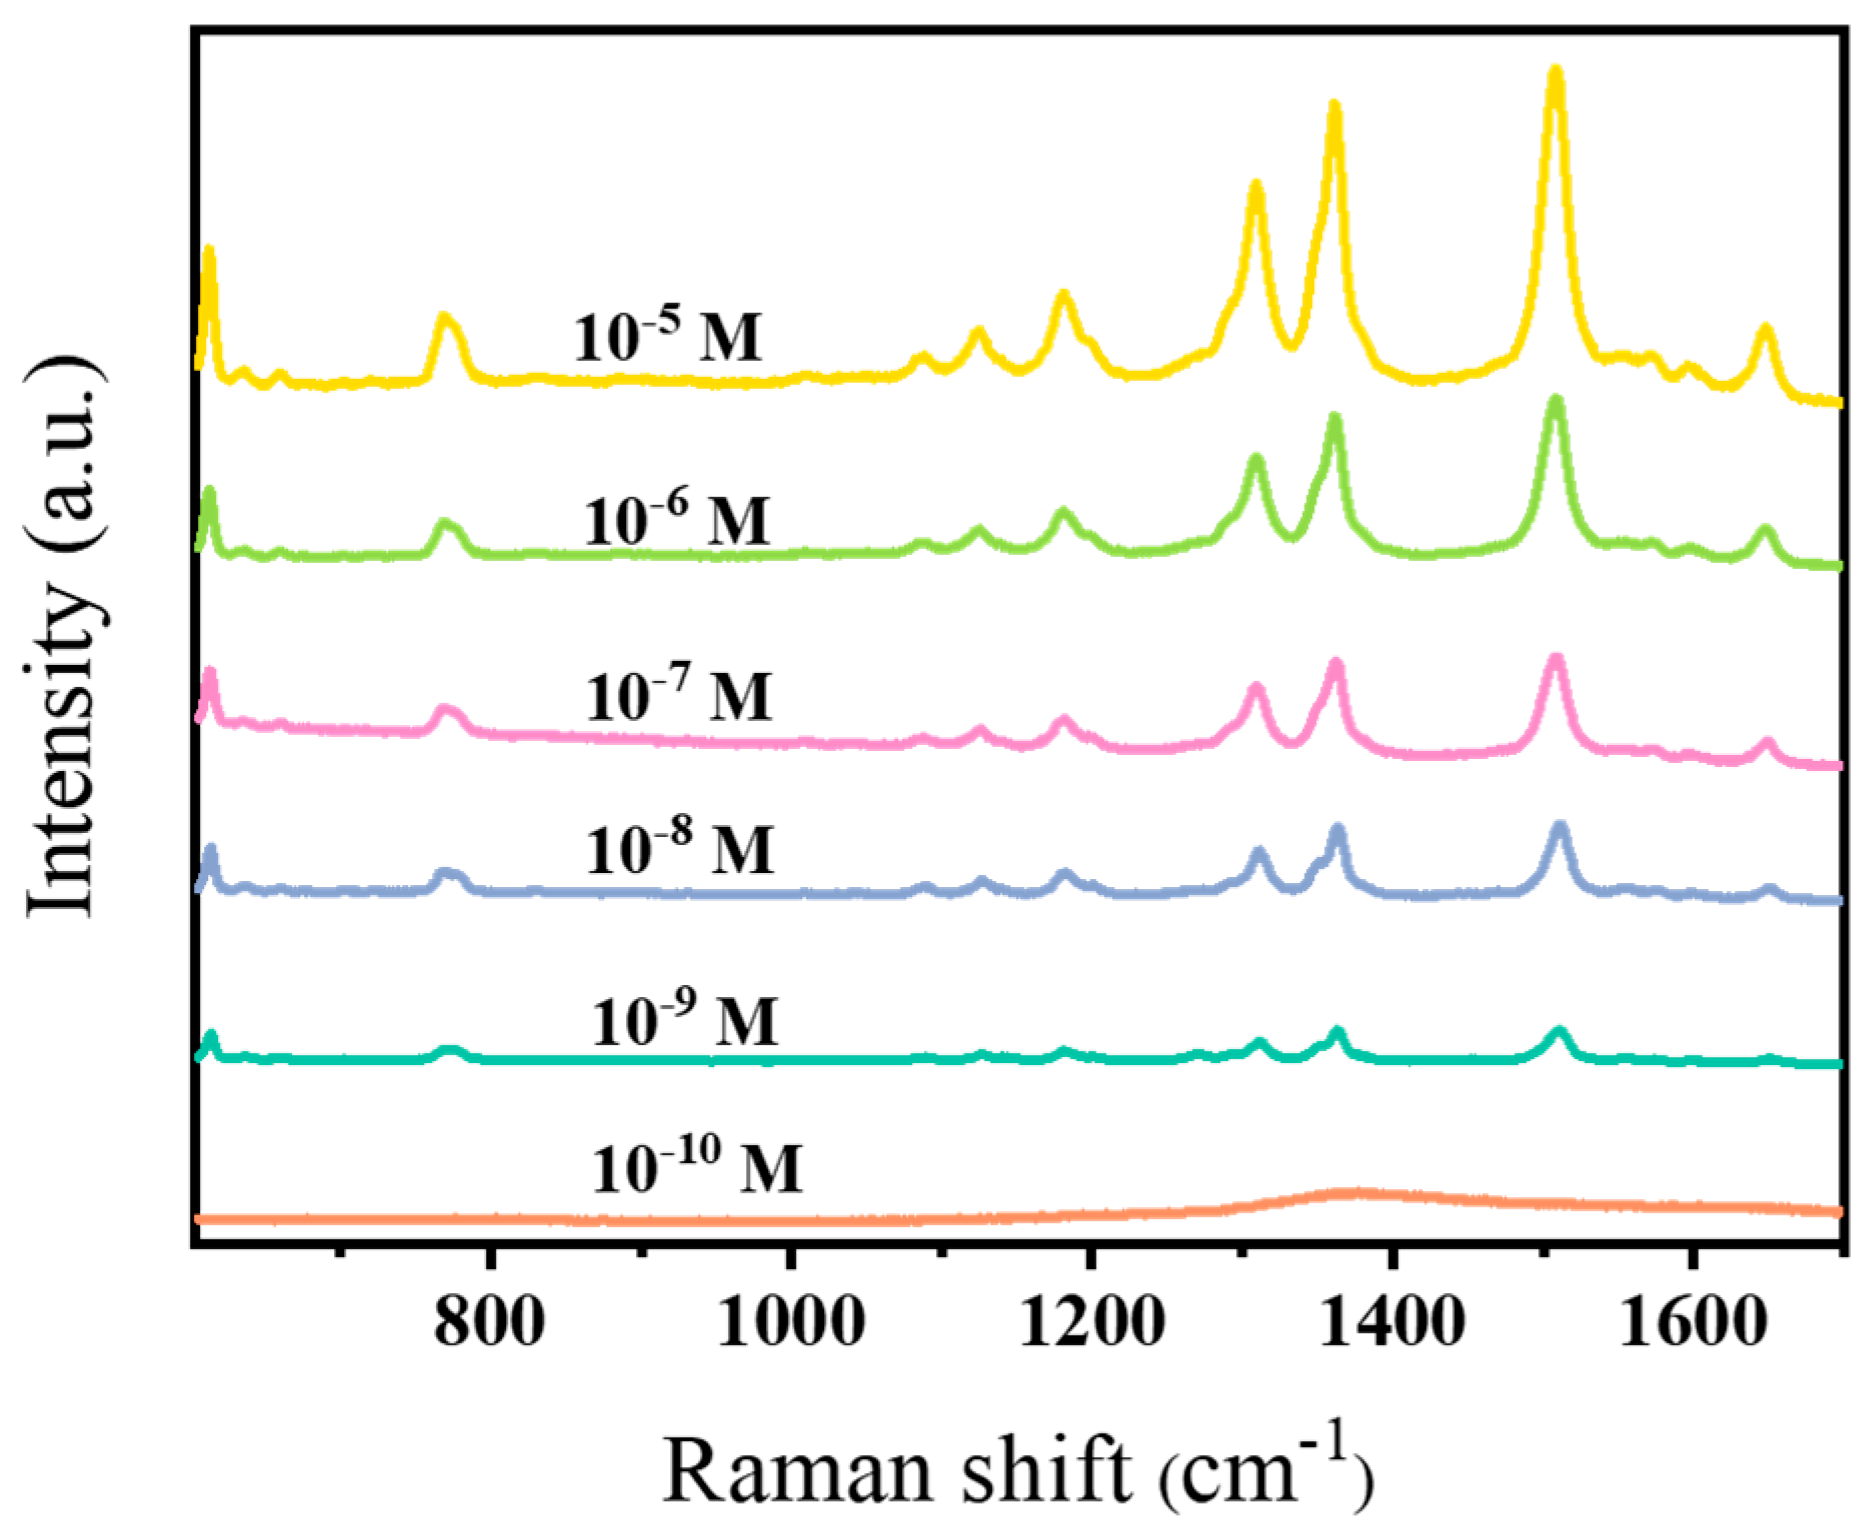
Figure 10.
(a) SERS-detection profiles of the R6G probe molecule enhanced by AuNRs@SiO2 substrates after storage for different amounts of time; (b) intensity histogram of the peak at 1361 cm−1 obtained using 10 randomly acquired signals.
Figure 10.
(a) SERS-detection profiles of the R6G probe molecule enhanced by AuNRs@SiO2 substrates after storage for different amounts of time; (b) intensity histogram of the peak at 1361 cm−1 obtained using 10 randomly acquired signals.
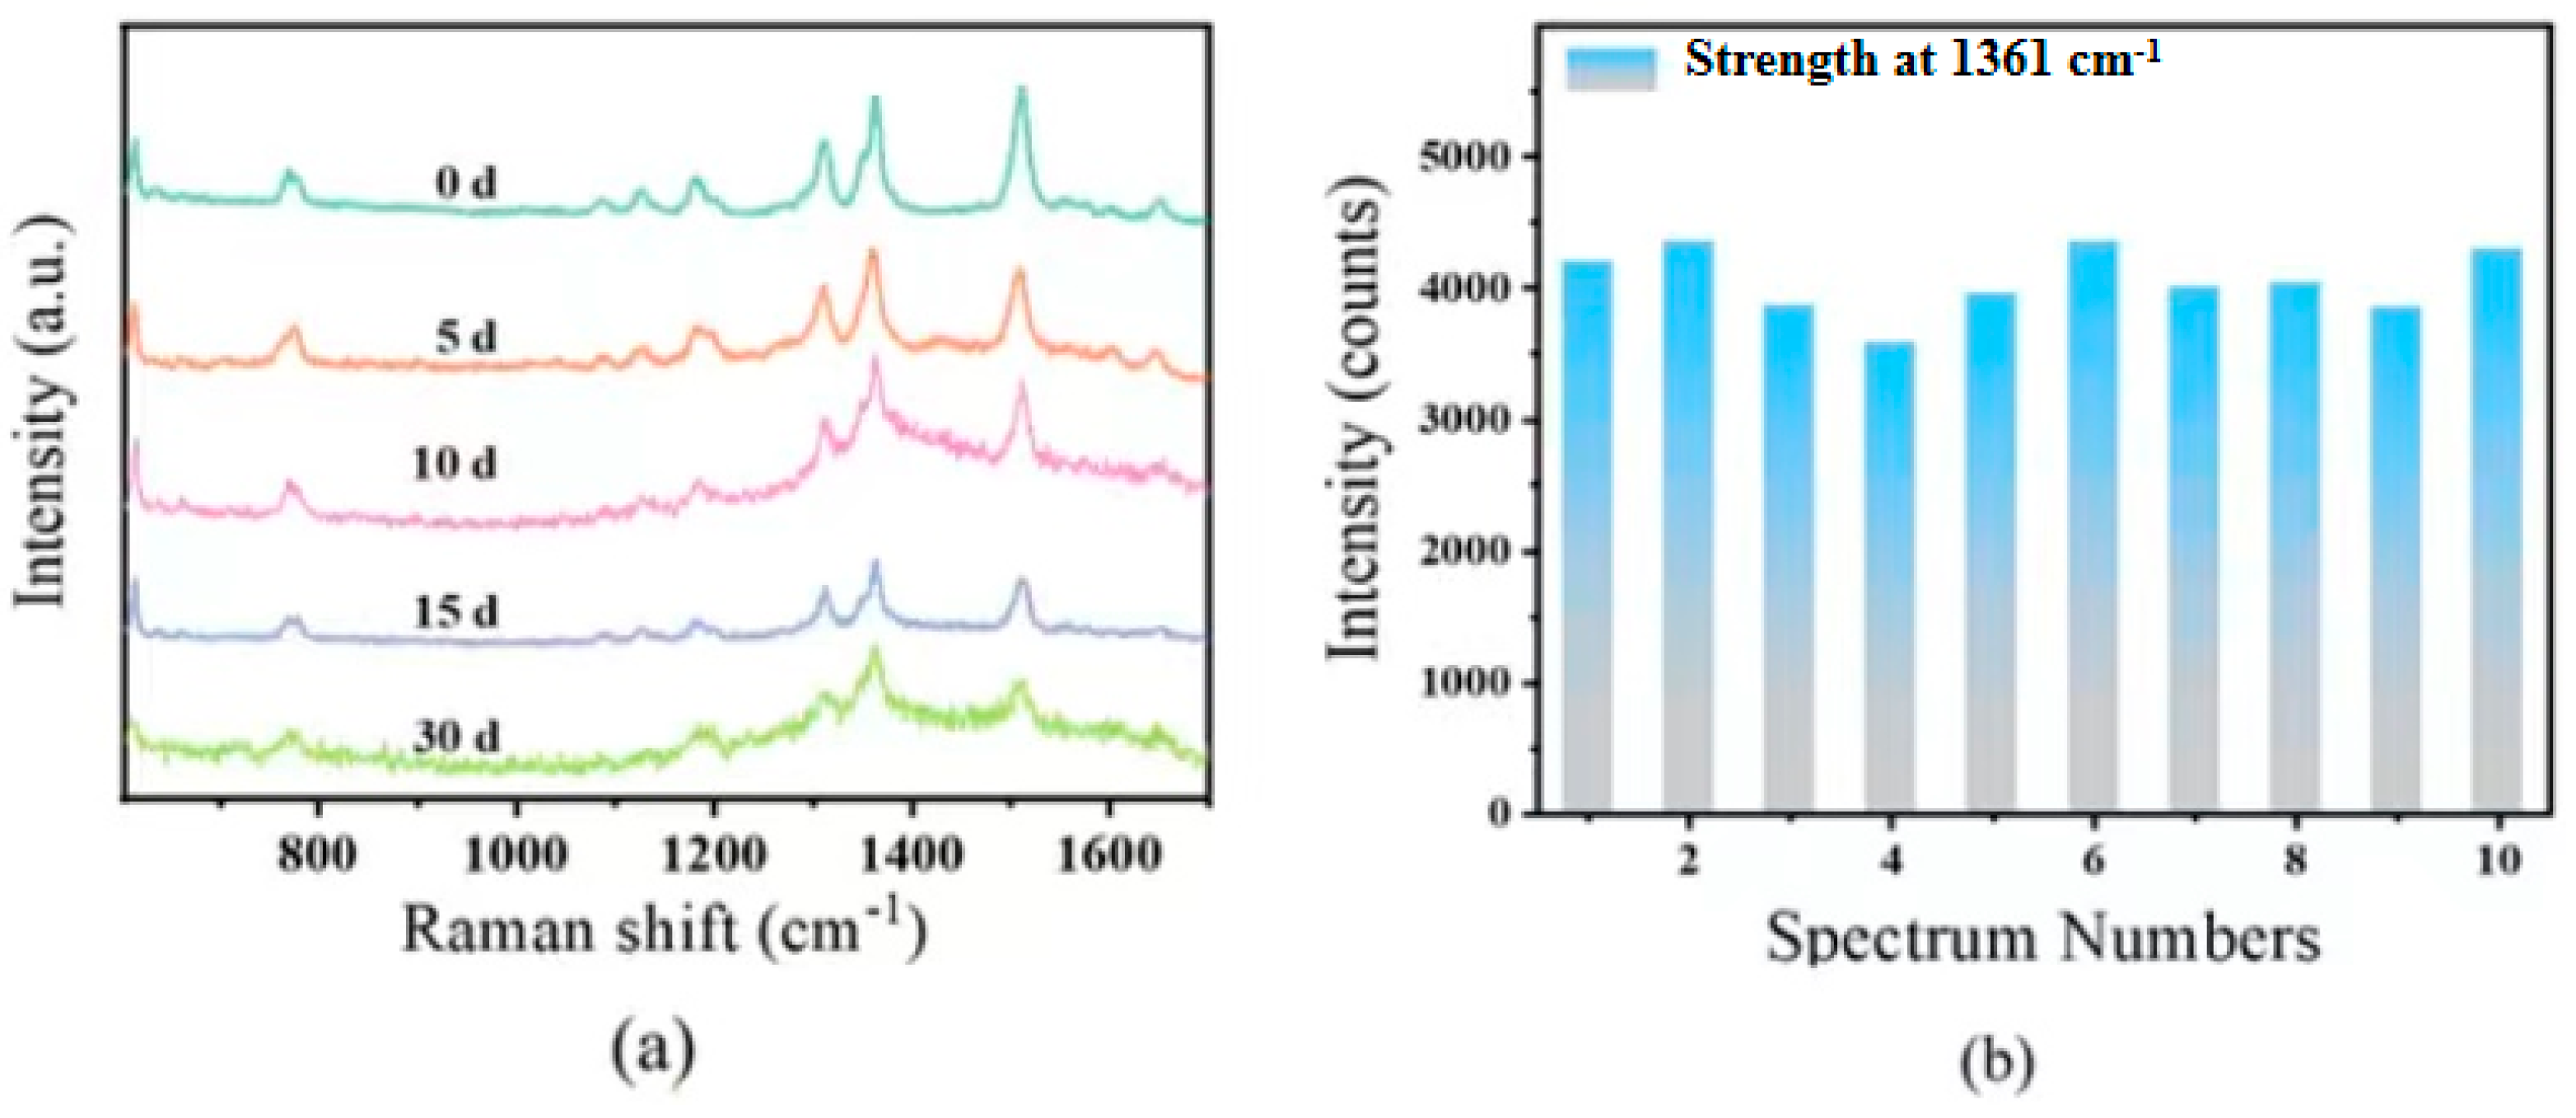
Figure 11.
SERS-detection profiles of thiram solutions enhanced by a AuNR@SiO2 substrate.

Figure 12.
SERS-detection profiles of piroxicam solutions enhanced by a AuNR@SiO2 substrate.
Disclaimer/Publisher’s Note: The statements, opinions and data contained in all publications are solely those of the individual author(s) and contributor(s) and not of MDPI and/or the editor(s). MDPI and/or the editor(s) disclaim responsibility for any injury to people or property resulting from any ideas, methods, instructions or products referred to in the content. |
© 2024 by the authors. Licensee MDPI, Basel, Switzerland. This article is an open access article distributed under the terms and conditions of the Creative Commons Attribution (CC BY) license (https://creativecommons.org/licenses/by/4.0/).
Share and Cite
MDPI and ACS Style
Li, H.; Tian, Y.; Yan, S.; Ren, L.; Ma, R.; Zhao, W.; Zhang, H.; Dou, S. Surface-Enhanced Raman Scattering for Probe Detection via Gold Nanorods and AuNRs@SiO2 Composites. Coatings 2024, 14, 530. https://doi.org/10.3390/coatings14050530
AMA Style
Li H, Tian Y, Yan S, Ren L, Ma R, Zhao W, Zhang H, Dou S. Surface-Enhanced Raman Scattering for Probe Detection via Gold Nanorods and AuNRs@SiO2 Composites. Coatings. 2024; 14(5):530. https://doi.org/10.3390/coatings14050530
Chicago/Turabian StyleLi, Huiqin, Yanyu Tian, Shaotian Yan, Lijun Ren, Rong Ma, Weiwei Zhao, Hongge Zhang, and Shumei Dou. 2024. "Surface-Enhanced Raman Scattering for Probe Detection via Gold Nanorods and AuNRs@SiO2 Composites" Coatings 14, no. 5: 530. https://doi.org/10.3390/coatings14050530
Note that from the first issue of 2016, this journal uses article numbers instead of page numbers. See further details here.