
Structural Study of Silica Coating Thin Layers Prepared from Perhydropolysilazane: Substrate Dependence and Water Penetration Structure

Abstract
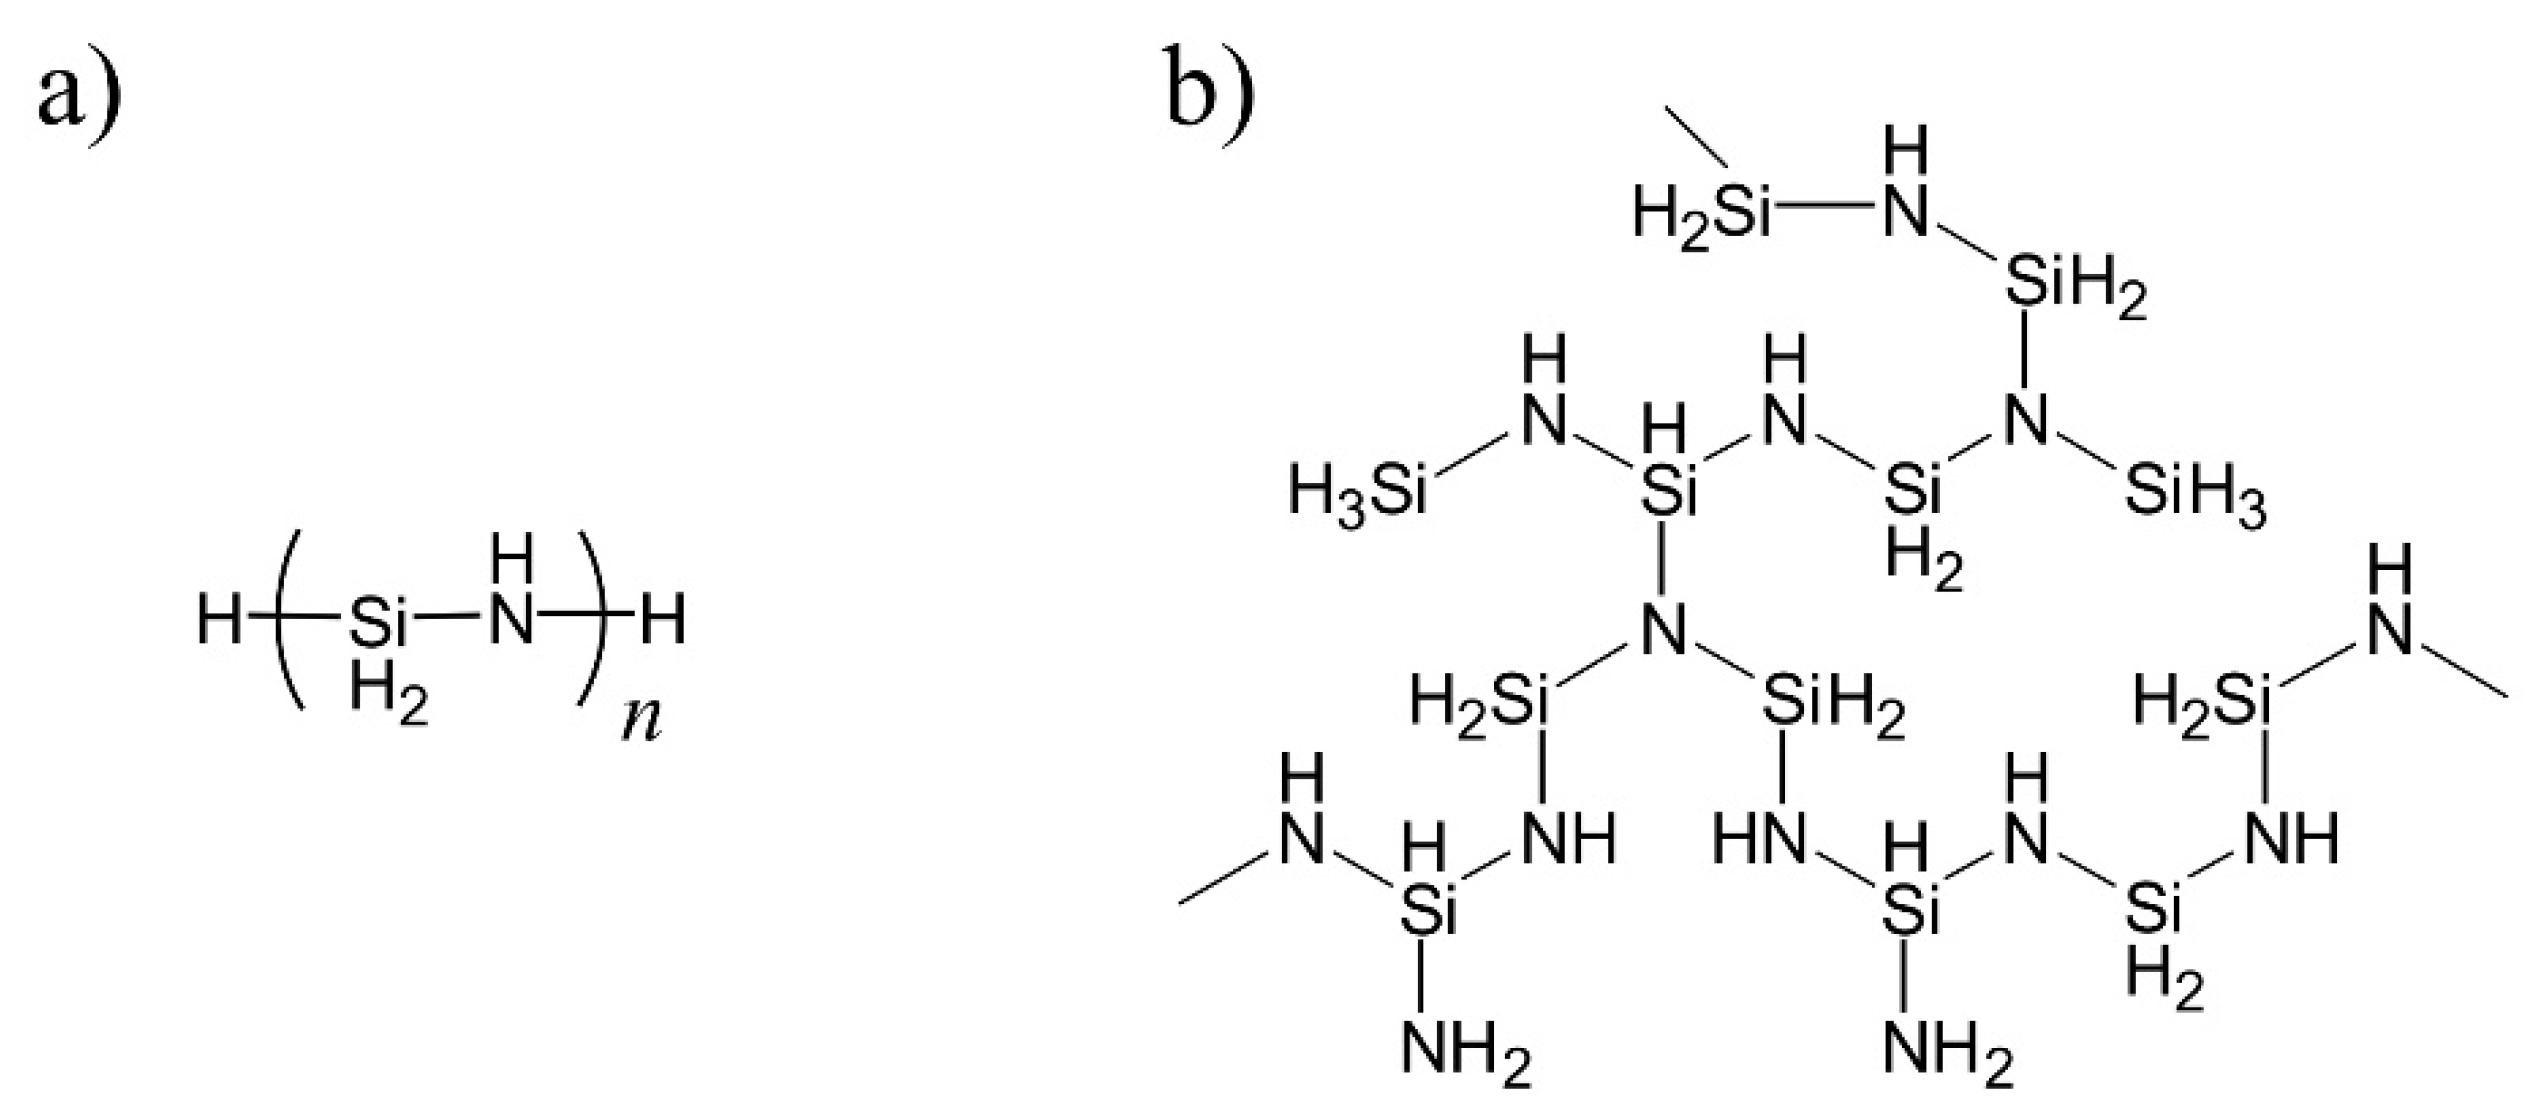
:1. Introduction
2. Materials and Methods
2.1. Materials
2.2. Sample Preparation
2.3. FT-IR Measurements
2.4. Neutron Reflectivity Measurements and Data Analysis
3. Results and Discussion
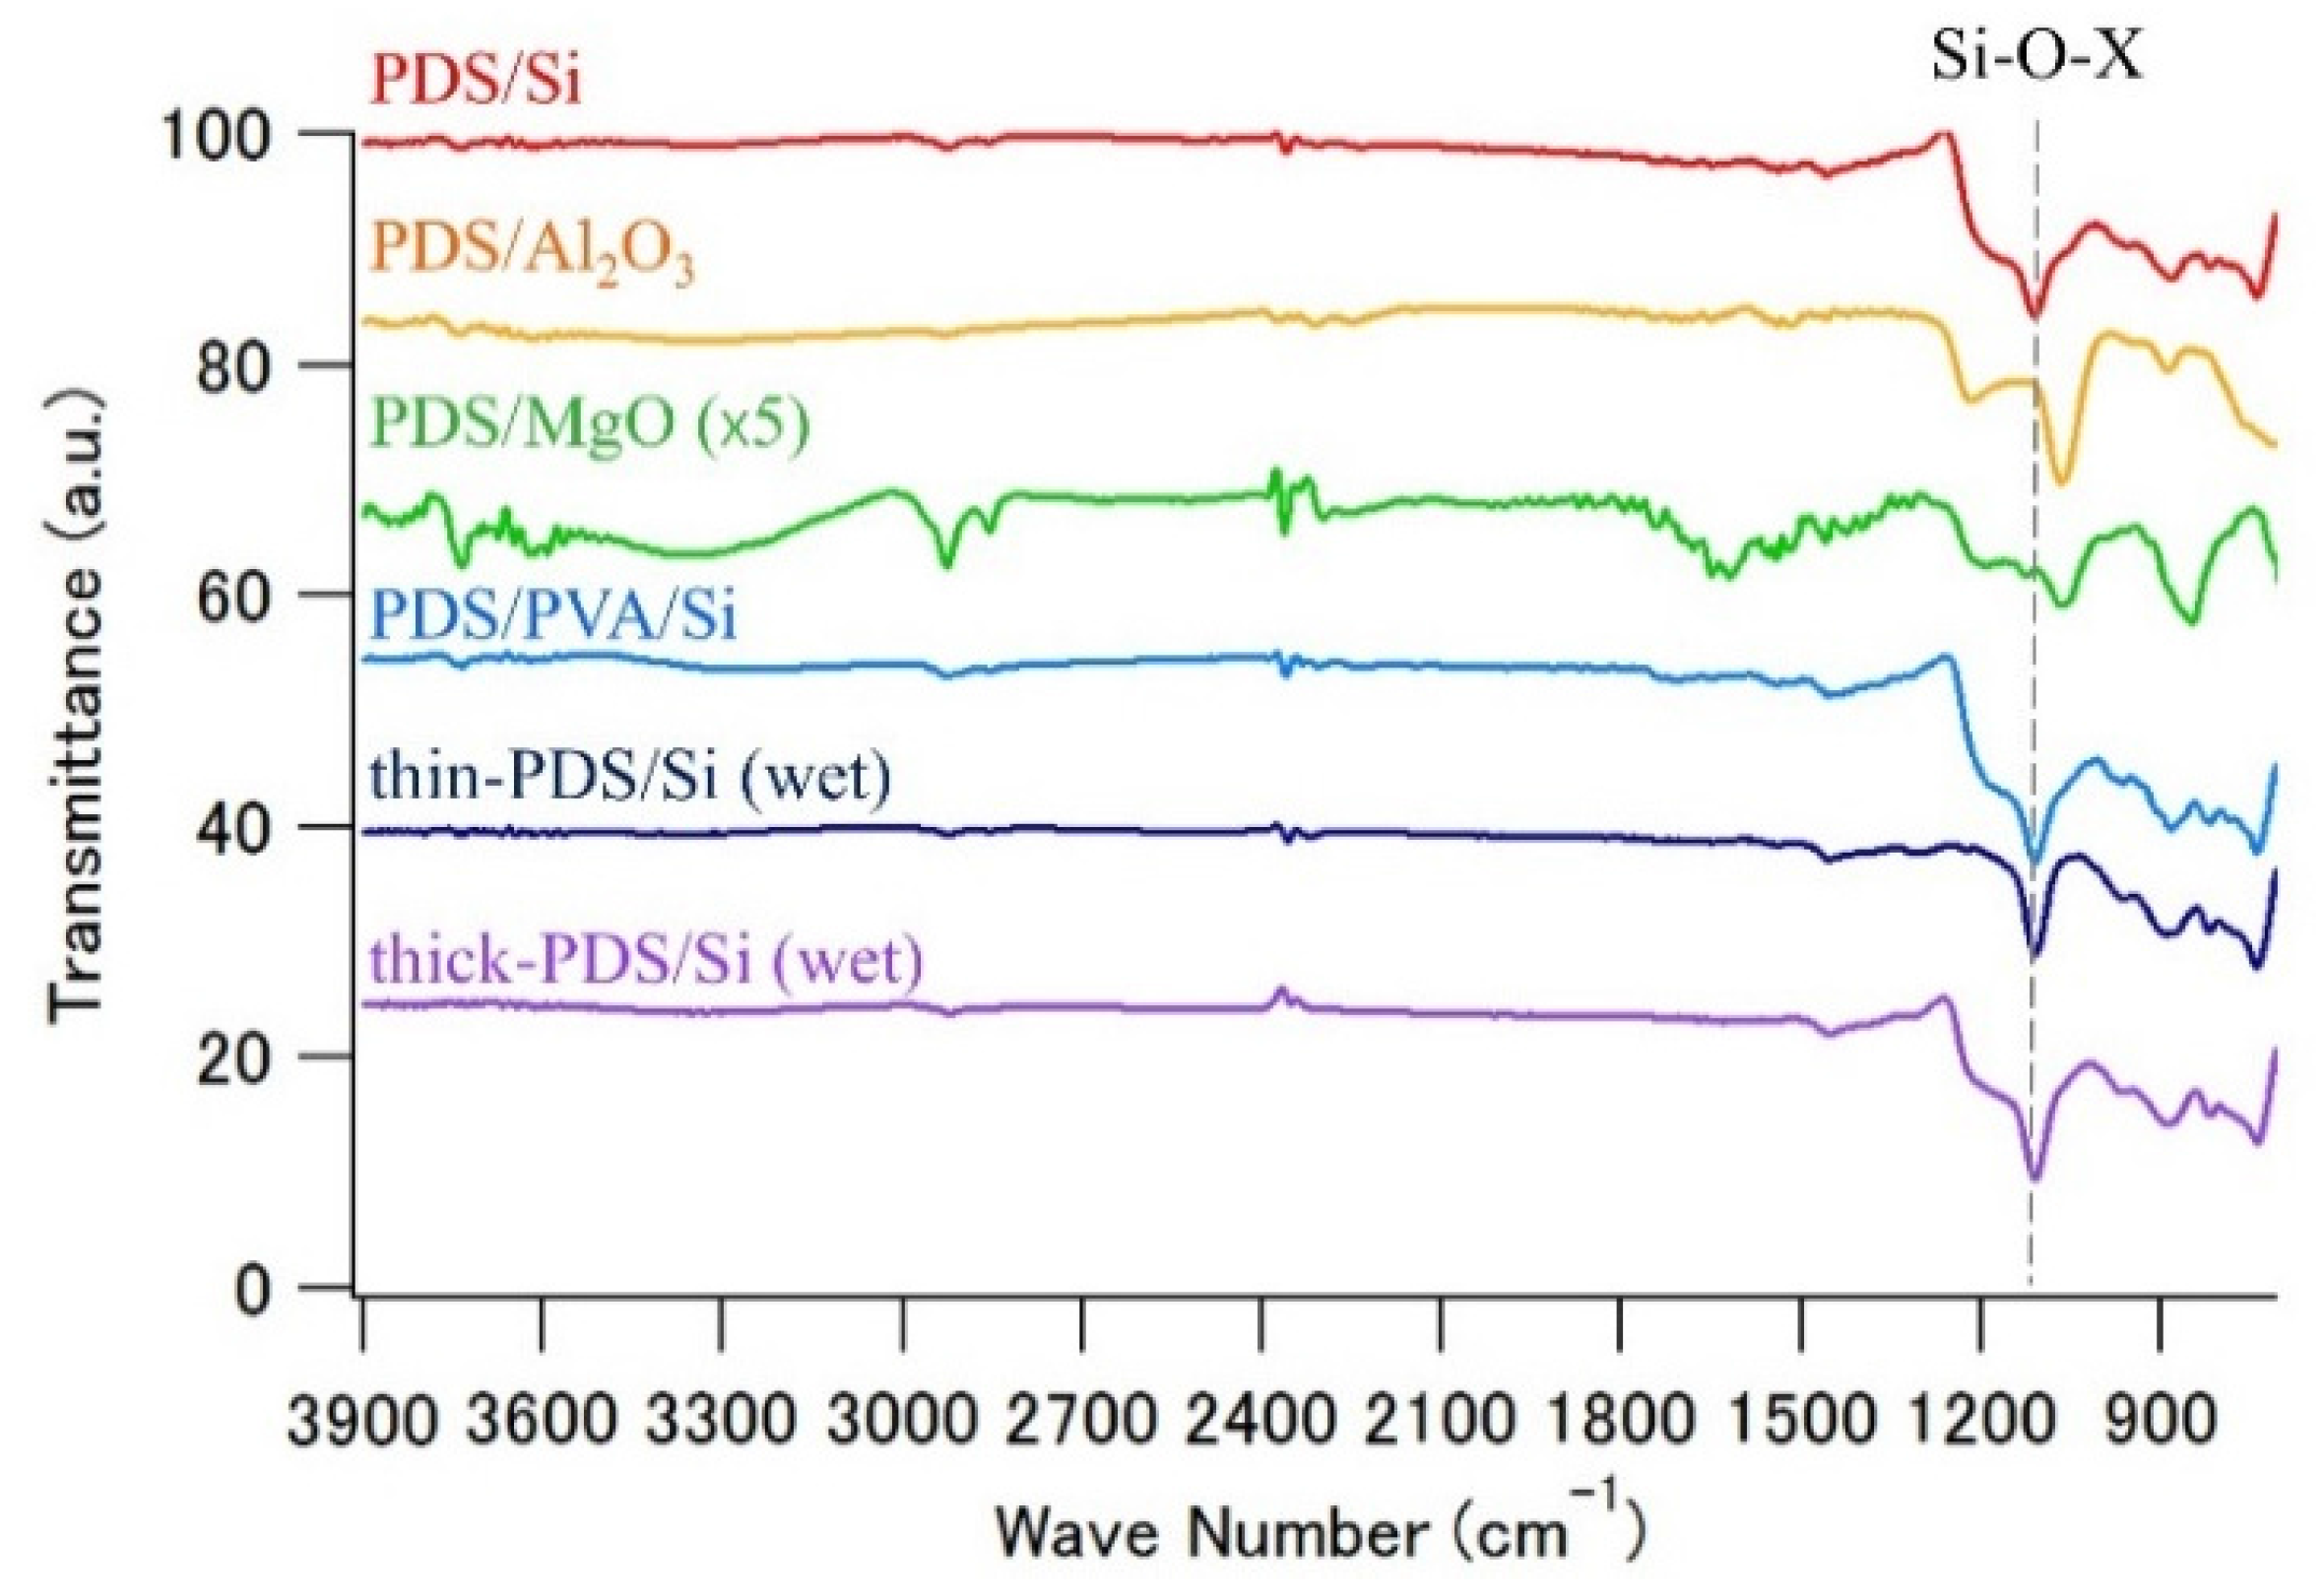
3.1. FT-IR Analysis for Thin PDS Layer Samples
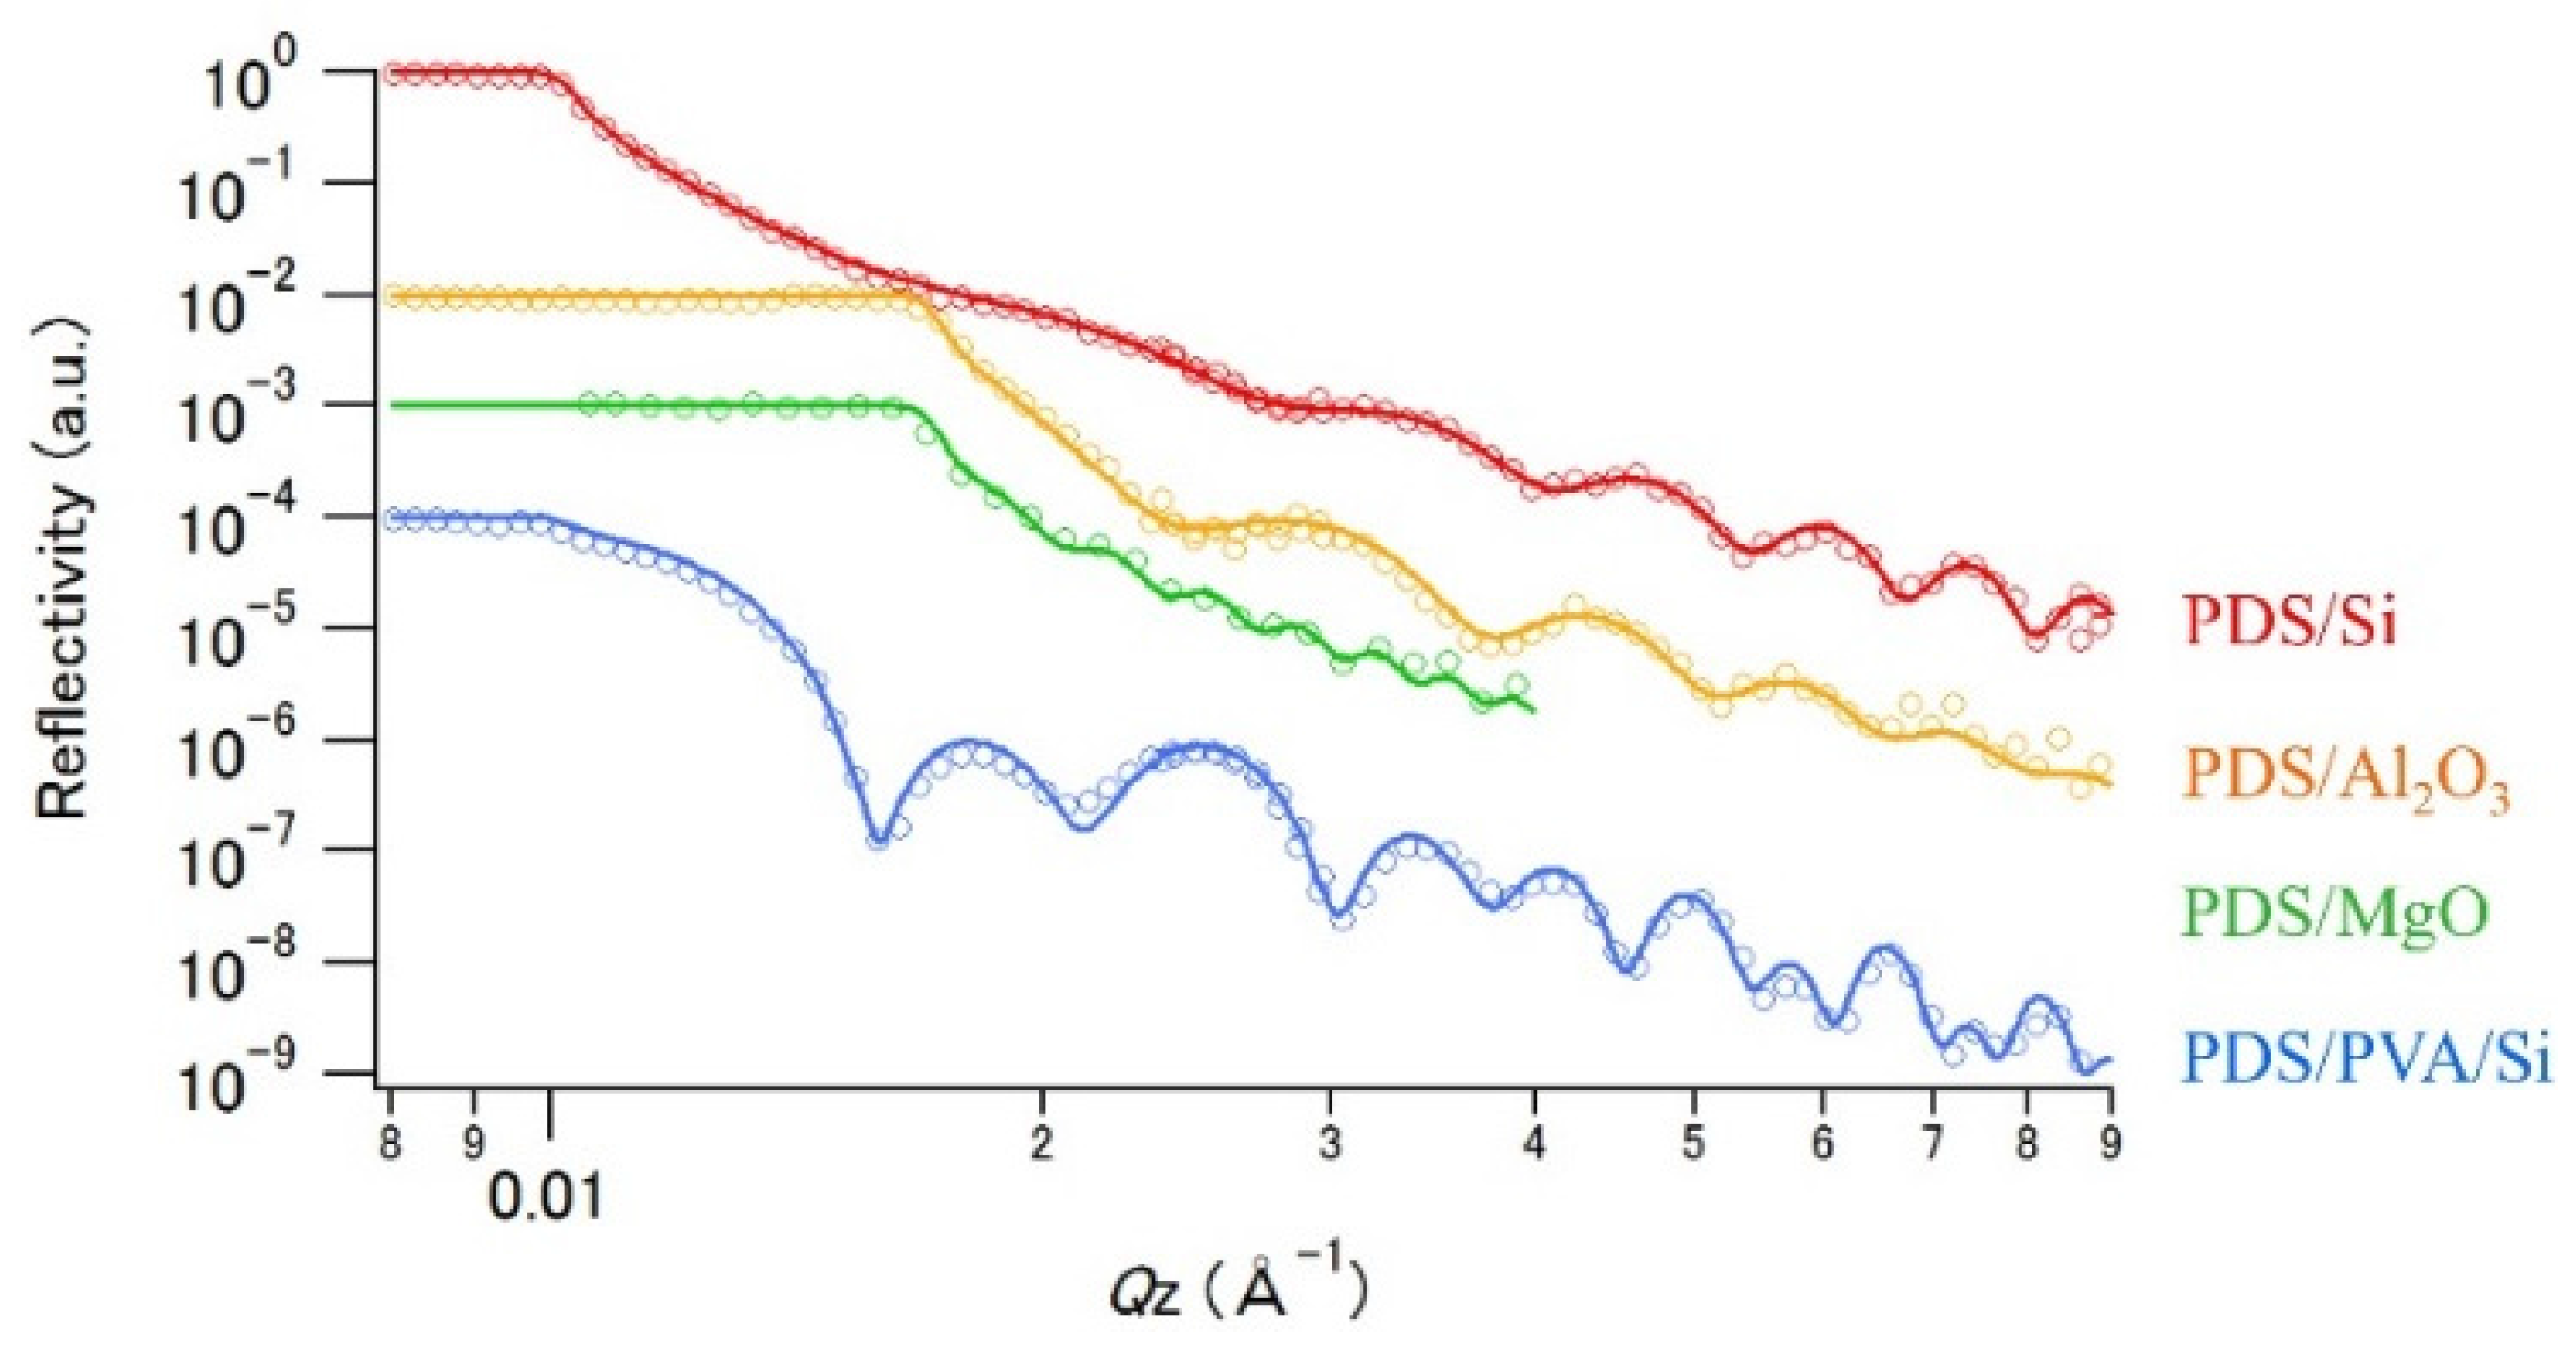
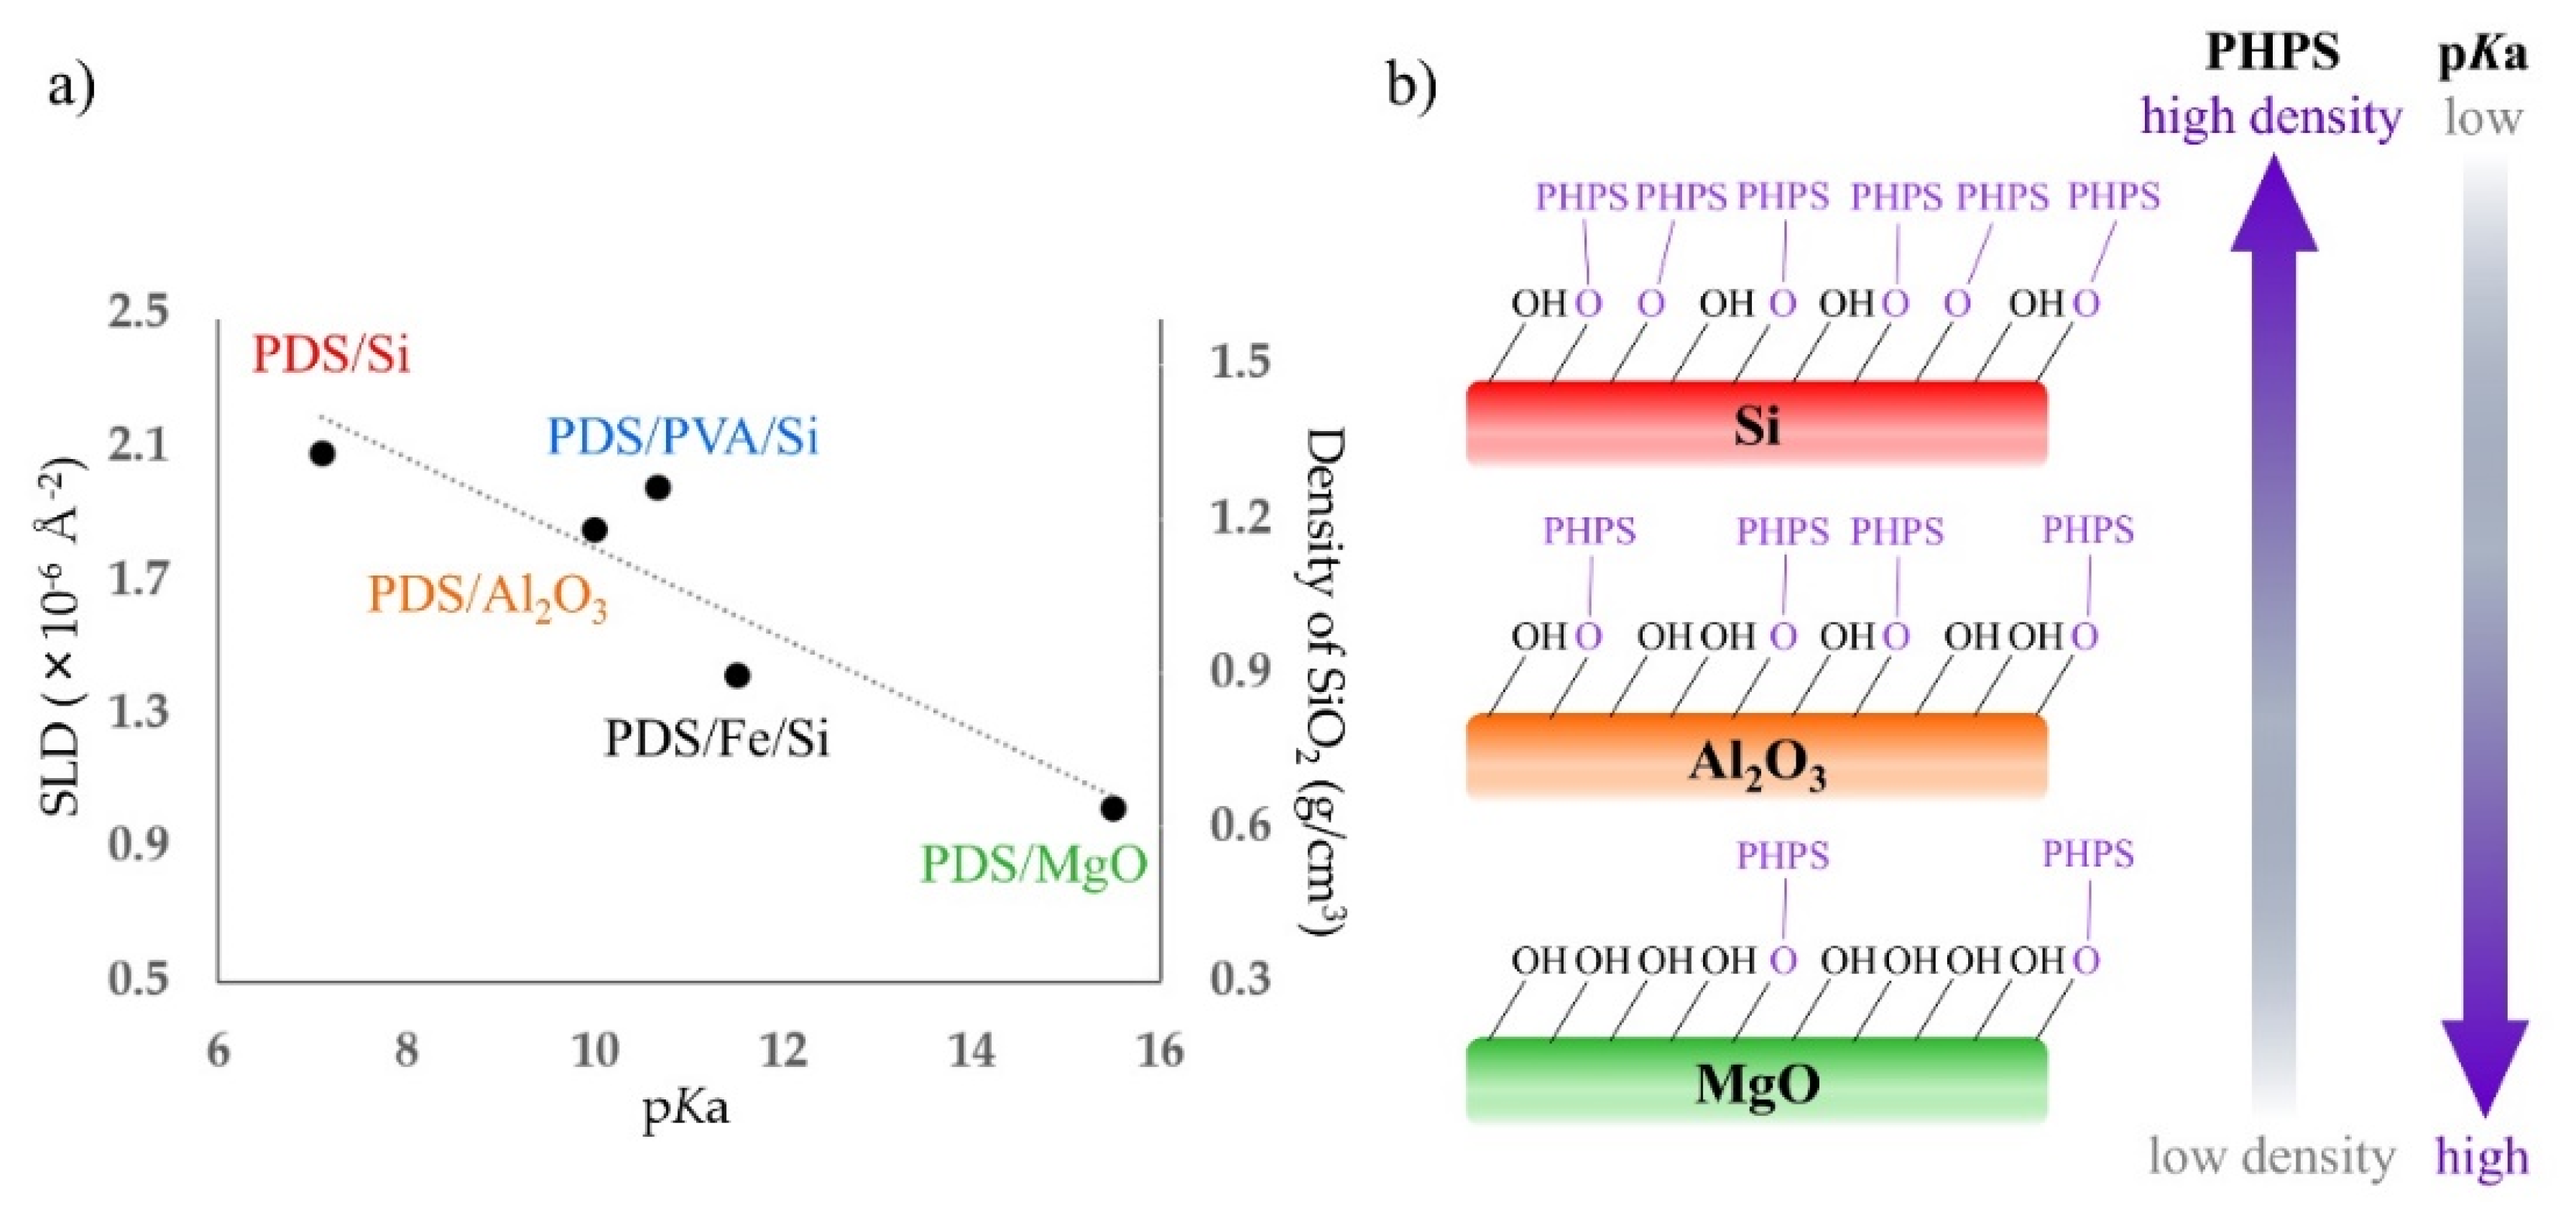
3.2. Neutron Reflectivity Analysis for PDS Thin Layer Samples
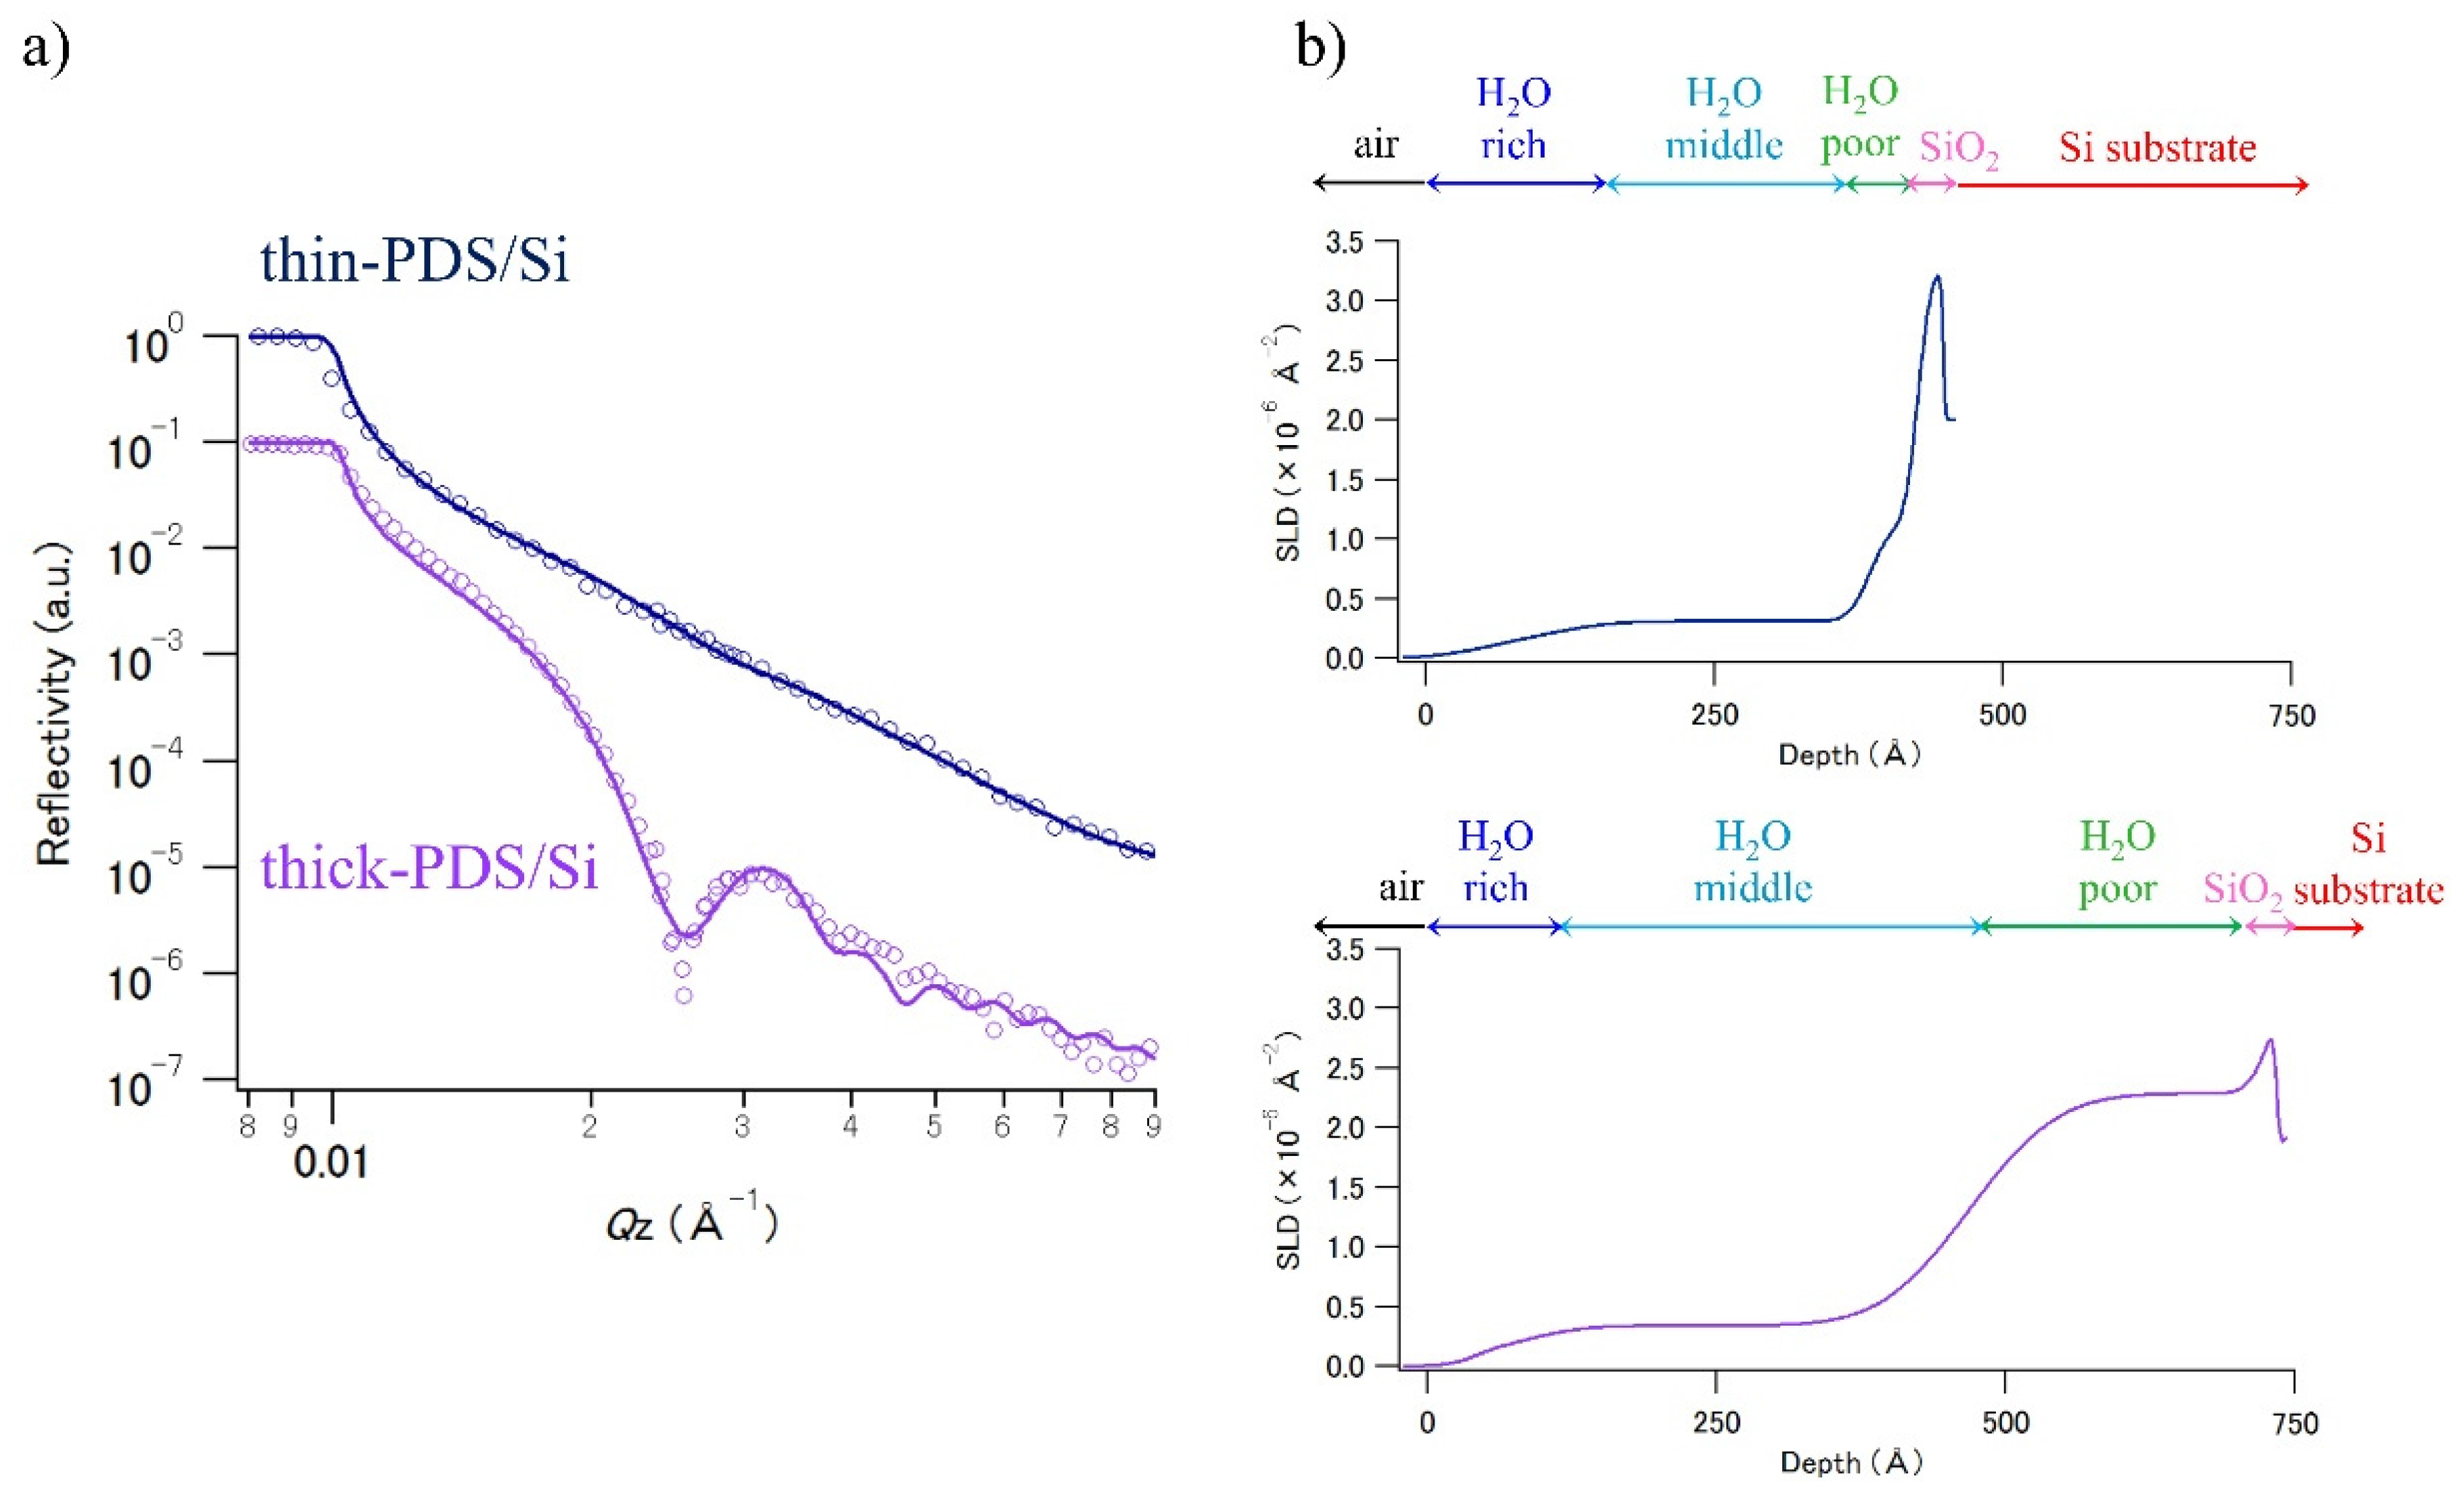
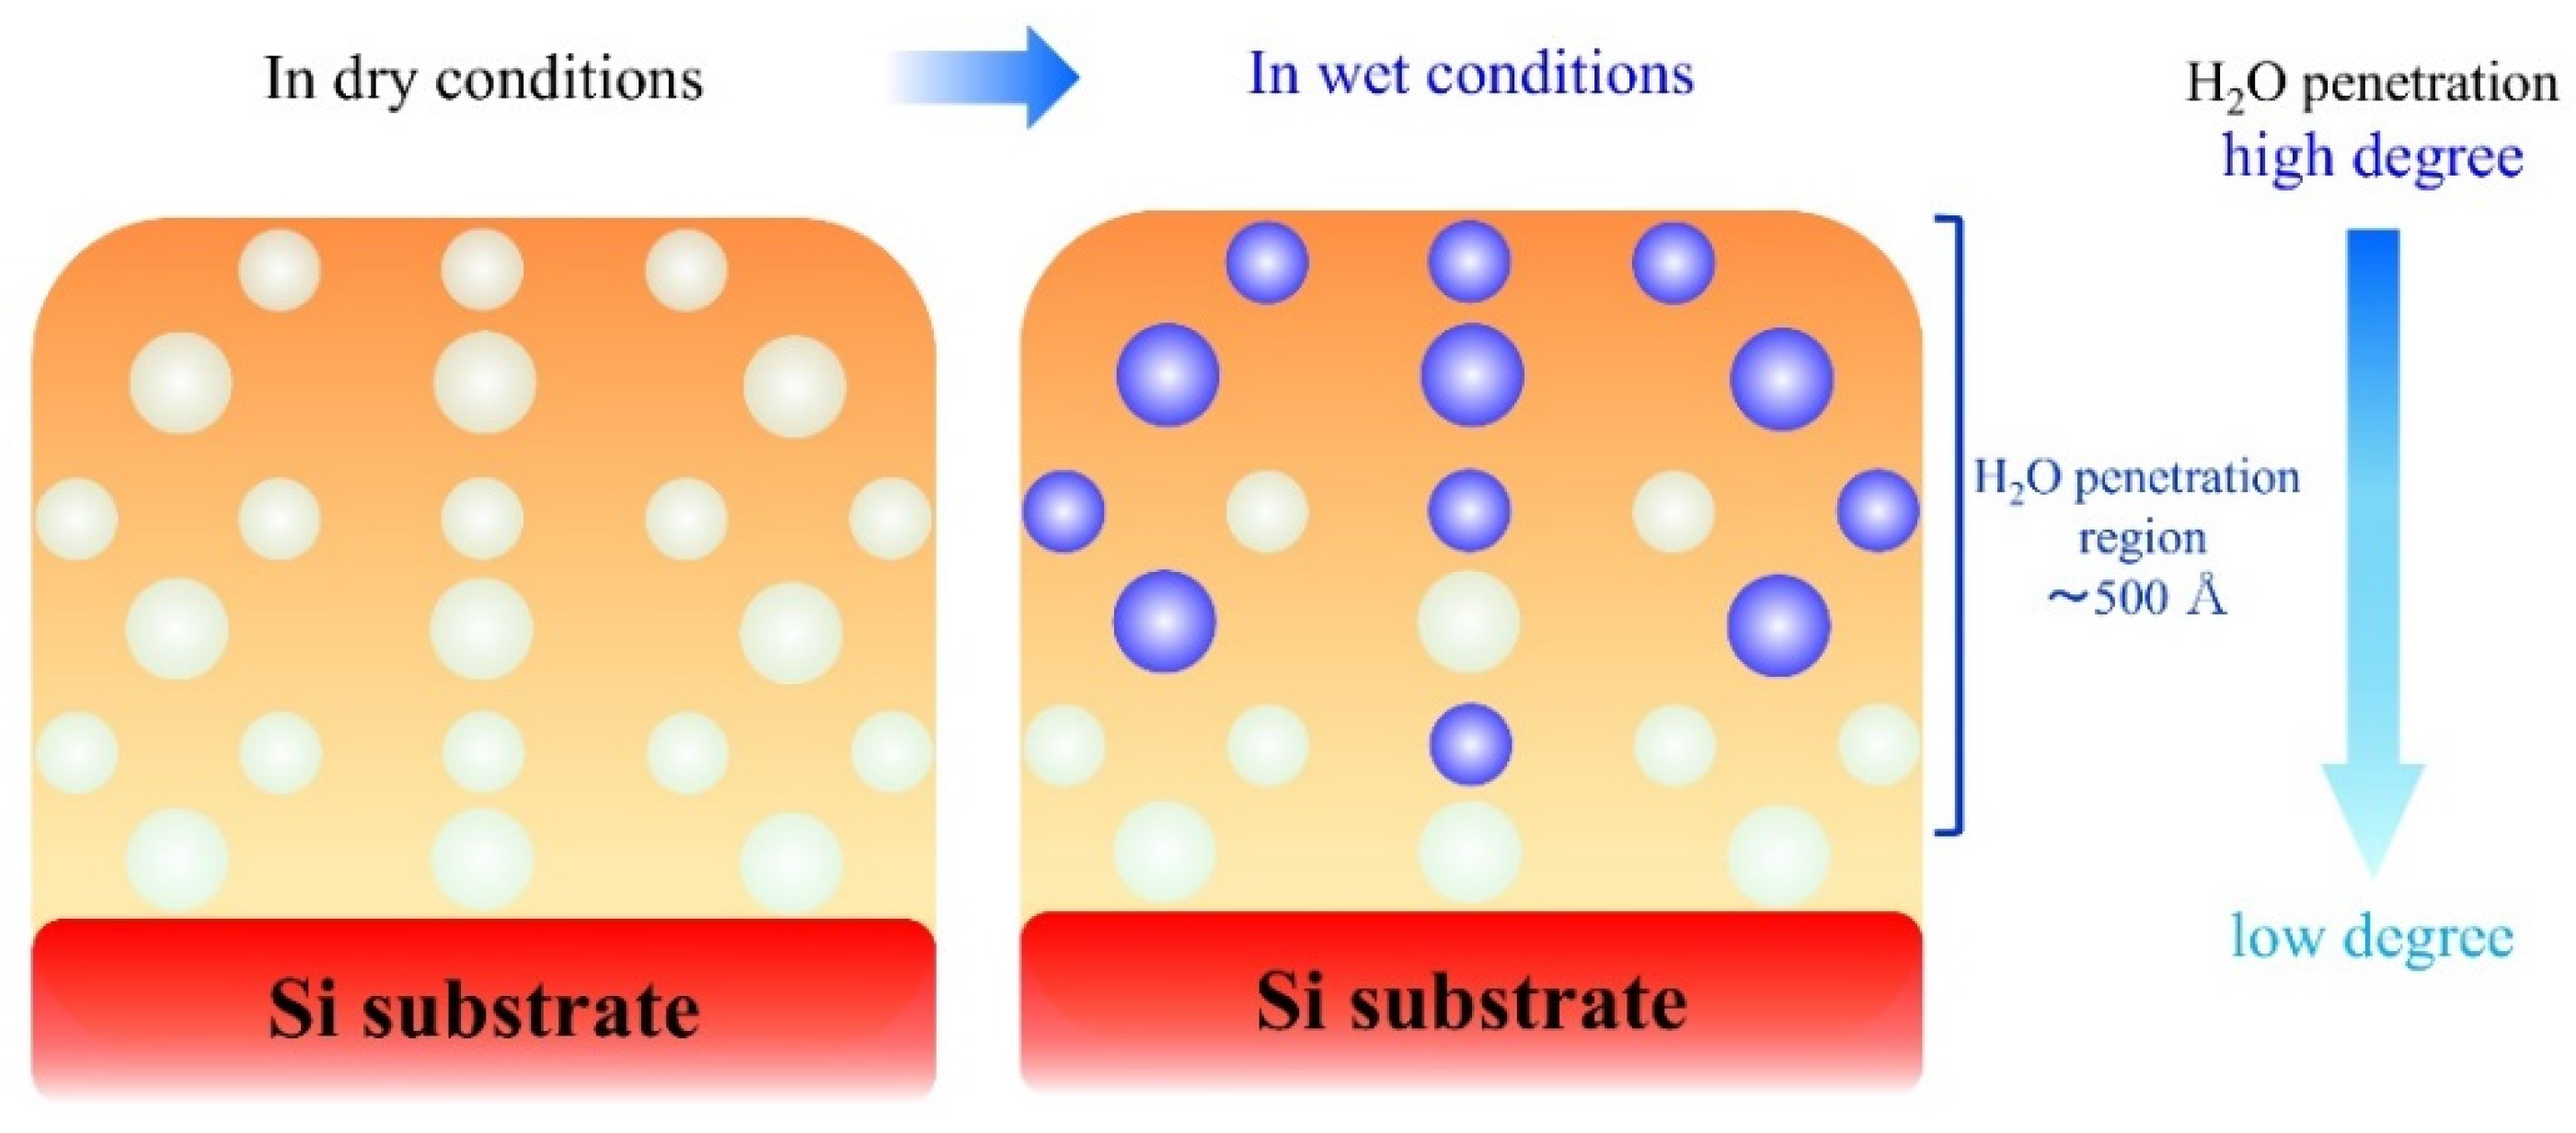
3.3. Investigation of Water Penetration Structure of PDS Thin Layer Sample
4. Conclusions
Acknowledgments
Author Contributions
Conflicts of Interest
References
- Sato, K.; Kaya, H.; Funayama, O.; Isoda, T. Evaluation of polysilazanes-perhydropolysilazane, polyborosilazane and methylhydropolysilazane-as matrix precursors of ceramic-matrix composites. J. Ceram. Soc. Jpn. 2001, 109, 440–446. [Google Scholar] [CrossRef]
- Morlier, A.; Cros, S.; Garandet, J.P.; Alberola, N. Gas barrier properties of solution processed composite multilayer structures for organic solar cells encapsulation. Sol. Energy Mater. Sol. Cells 2013, 115, 93–99. [Google Scholar] [CrossRef]
- Blankenburg, L.; Schrodner, M. Perhydropolysilazane derived silica for flexible transparent barrier foils using a reel-to-reel wet coating technique: Single- and multilayer structures. Surf. Coat. Technol. 2015, 275, 193–206. [Google Scholar] [CrossRef]
- Suzurikawa, J.; Nakao, M.; Takahashi, H. Surface passivation of the thin-film LAPS with perhydropolysilazane-derived silica treated by O2 plasma. IEEJ Trans. Electr. Electron. Eng. 2011, 6, 392–393. [Google Scholar] [CrossRef]
- Akutsu, K.; Niizeki, T.; Nagayama, S.; Miyata, N.; Sahawa, M.; Shimomura, A.; Yoshii, M.; Hasegawa, Y. Investigation of structure of a thin SiO2 layer as an antifouling and corrosion-resistant coating. J. Ceram. Soc. Jpn. 2016, 124, 172–176. [Google Scholar] [CrossRef]
- Kozuka, H.; Nakajima, K.; Uchiyama, H. Superior properties of silica thin films prepared from perhydropolysilazane solutions at room temperature in comparison with conventional alkoxide-derived silica gel films. ACS Appl. Mater. Interfaces 2013, 5, 8329–8336. [Google Scholar] [CrossRef] [PubMed]
- Prager, L.; Dierdorf, A.; Liebe, H.; Naumov, S.; Stojanovic, S.; Heller, R.; Wennrich, L.; Buchmeiser, M.R. Conversion of perhydropolysilazane into a SiOx network triggered by vacuum ultraviolet irradiation: Access to flexible, transparent barrier coatings. Chem. Eur. J. 2007, 13, 8522–8529. [Google Scholar] [CrossRef] [PubMed]
- Park, K.S.; Ko, P.S.; Kim, S.D. Effects of N2O plasma treatment on perhydropolysilazane spin-on-dielectrics for inter-layer-dielectric applications. Thin Solid Films 2014, 551, 57–60. [Google Scholar] [CrossRef]
- Morlier, A.; Cros, S.; Garandet, J.P.; Alberola, N. Thin gas-barrier silica layers from perhydropolysilazane obtained through low temperature curings: A comparative study. Thin Solid Films 2012, 524, 62–66. [Google Scholar] [CrossRef]
- Bauer, F.; Decker, U.; Dierdorf, A.; Ernst, H.; Heller, R.; Liebe, H.; Mehnert, R. Preparation of moisture curable polysilazane coatings Part I. Elucidation of low temperature curing kinetics by FT-IR spectroscopy. Prog. Org. Coat. 2005, 53, 183–190. [Google Scholar] [CrossRef]
- Je, S.Y.; Son, B.G.; Kim, H.G.; Park, M.Y.; Do, L.M.; Choi, R.; Jeong, J.K. Solution-processable LaZrOx/SiO2 gate sielectric at low temperature of 180 °C for high-performance metal oxide field-effect transistors. ACS Appl. Mater. Interfaces 2014, 6, 18693–18703. [Google Scholar] [CrossRef] [PubMed]
- Yamada, N.L.; Torikai, N.; Mitamura, K.; Sagehashi, H.; Sato, S.; Seto, H.; Sugita, T.; Goko, S.; Furusaka, M.; Oda, T.; et al. Design and performance of horizontal-type neutron reflectometer SOFIA at J-PARC/ MLF. Eur. Phys. J. Plus 2011, 126, 1–13. [Google Scholar] [CrossRef]
- Hayashida, H.; Takeda, M.; Yamazaki, D.; Maruyama, R.; Soyama, K.; Kubota, M.; Mizusawa, T.; Yoshida, N.; Sakaguchi, Y. Design and demonstration of a neutron spin flipper for a new neutron reflectometer SHARAKU at J-PARC. Phys. Proc. 2013, 42, 130–135. [Google Scholar] [CrossRef]
- Takeda, M.; Yamazaki, D.; Soyama, K. Current status of a new polarized neutron reflectometer at the intense pulsed neutron source of the materials and life science experimental facility (MLF) of J-PARC. Chin. J. Phys. 2012, 50, 161–170. [Google Scholar]
- Amemiya, K.; Sakamaki, M.; Mizusawa, M.; Takeda, M. Twisted magnetic structure in ferromagnetic ultrathin Ni films induced by magnetic anisotropy interaction with antiferromagnetic FeMn. Phys. Rev. B 2014, 89, 054404. [Google Scholar] [CrossRef]
- Nelson, A.J. Co-refinement of multiple-contrast neutron/X-ray reflectivity data using MOTOFIT. J. Appl. Crystallogr. 2006, 39, 273–276. [Google Scholar] [CrossRef]
- Launer, P.J. Infrared Analysis of Organosilicon Compounds: Spectra-Structure Correlations. Silicon Compounds Register and Review; Petrarch Systems, Inc.: Levittown, NY, USA, 1987; pp. 100–103. [Google Scholar]
- Mori, Y.; Saito, R. Synthesis of a poly(methyl methacrylate)/silica nano-composite by soaking of a microphase separated polymer film into a perhydropolysilazane solution. Polymer 2004, 45, 95–100. [Google Scholar] [CrossRef]
- Yamano, A.; Kozuka, H. Preparation of silica coatings heavily doped with spiropyran using perhydropolysilazane as the silica source and their photochromic properties. J. Phys. Chem. B 2009, 113, 5769–5776. [Google Scholar] [CrossRef] [PubMed]
- Kang, S.; Hong, S.I.; Choe, C.R.; Park, M.; Rim, S.; Kim, J. Preparation and characterization of epoxy composites® lled with functionalized nanosilica particles obtained via sol-gel process. Polymer 2001, 42, 879–887. [Google Scholar] [CrossRef]
- Yu, K.M.K.; Thompsett, D.; Tsang, S.C. Ultra-thin porous silica coated silver–platinum alloy nano-particle as a new catalyst precursor. Chem. Commun. 2003, 13, 1522–1523. [Google Scholar] [CrossRef]
- El-Gohary, M.I.; Tohamy, K.M.; El-Okr, M.M.; Ali, A.F.; Soliman, I.E. Influence of composition on the in vitro bioactivity of bioglass prepared by a quick alkali-mediated sol–gel method. Nat. Sci. 2013, 11, 26–33. [Google Scholar]
- King, S.M. Small angle neutron scattering. In Modern Techniques for Polymer Characterisation; Pethrick, R.A., Dawkins, J.V., Eds.; John Wiley & Sons: New York, NY, USA, 1999; pp. 171–232. [Google Scholar]
- Katagiri, K.; Takebatake, R.; Inumaru, K. Robust infrared-shielding coating films prepared using perhydropolysilazane and hydrophobized indium tin oxide nanoparticles with tuned surface plasmon resonance. ACS Appl. Mater. Interfaces 2013, 5, 10240–10245. [Google Scholar] [CrossRef] [PubMed]
- Hair, M.L.; Hertl, W. Acidity of surface hydroxyl groups. J. Phys. Chem. 1970, 74, 91–94. [Google Scholar] [CrossRef]
- Simmons, G.W.; Beard, B.C. Characterization of acid-base properties of the hydrated oxides on iron and titanium metal surfaces. J. Phys. Chem. 1987, 91, 1143–1148. [Google Scholar] [CrossRef]
- Jodin, M.C.; Gaboriaud, F.; Humbert, B. Limitations of potentiometric studies to determine the surface charge of gibbsite γ-Al(OH)3 particles. J. Colloid Interface Sci. 2005, 287, 581–591. [Google Scholar] [CrossRef] [PubMed]
- Hosny, W.M.; Khalaf-Alaa, P.A. Potentiometric study and biological activity of some metal ion complexes of polyvinyl alcohol (PVA). Int. J. Electrochem. Sci. 2013, 8, 1520–1533. [Google Scholar]
- Yim, H.; Kent, M.S.; Tallant, D.R.; Garcia, M.J. Hygrothermal degradation of (3-Glycidoxypropyl)trimethoxysilane films studied by neutron and X-ray reflectivity and attenuated total reflection infrared spectroscopy. Langmuir 2005, 21, 4382–4392. [Google Scholar] [CrossRef] [PubMed]
- Schalke, M.; Losche, M. Structural models of lipid surface monolayers from X-ray and neutron reflectivity measurements. Adv. Colloid Interface Sci. 2000, 88, 243–274. [Google Scholar] [CrossRef]
- Hu, L.; Li, M.; Xu, C.; Luo, Y. Perhydropolysilazane derived silica coating protecting Kapton from atomic oxygen attack. Thin Solid Films 2011, 520, 1063–1068. [Google Scholar] [CrossRef]


| Sample | Parameter | Layer 1 | Layer 2 | Layer 3 | Layer 4 |
|---|---|---|---|---|---|
| PDS/Si | PDS layer | SiO2 layer | Si substrate | ||
| t (Å) | 461 | 7.7 | – | ||
| ρ (× 10−6 Å−2) | 2.10 | 3.07 | 2.07 | ||
| σ (Å) | 3.9 | 20.7 | 4.7 | ||
| PDS/Al2O3 | PDS layer | Al2O3 substrate | |||
| t (Å) | 436 | – | |||
| ρ (× 10−6 Å−2) | 1.86 | 5.74 | |||
| σ (Å) | 22.9 | 1.1 | |||
| PDS/MgO | PDS layer | MgO substrate | |||
| t (Å) | 1809 | – | |||
| ρ (× 10−6 Å−2) | 1.00 | 5.78 | |||
| σ (Å) | 2.0 | 1.6 | |||
| PDS/PVA/Si | PDS layer | PVA layer | SiO2 layer | Si substrate | |
| t (Å) | 430 | 355 | 16.9 | – | |
| ρ (× 10−6 Å−2) | 1.99 | 0.62 | 3.34 | 2.07 | |
| σ (Å) | 4.6 | 13.0 | 15.0 | 1.0 | |
| PDS/Fe/Si [5] | PDS layer | Iron oxide layer | Fe layer | SiO2 layer | |
| t (Å) | 455 | 2.24 | 91.8 | 25.1 | |
| ρ (× 10−6 Å−2) | 1.41 | 6.73 | 8.34 | 1.71 | |
| σ (Å) | 17.5 | 1.9 | 1.9 | 2.1 |
| Sample | Parameter | Water-Rich PDS | Water-Middle PDS | Water-Poor PDS | SiO2 Layer | Si Substrate |
|---|---|---|---|---|---|---|
| thin PDS/Si | t (Å) | 73.9 | 261 | 41.5 | 21.9 | – |
| ρ (× 10−6 Å−2) | 0.18 | 0.31 | 1.12 | 3.28 | 2.01 | |
| σ (Å) | 38.1 | 37.0 | 14.3 | 9.0 | 1.7 | |
| thick PDS/Si | t (Å) | 43.4 | 386 | 259 | 5.8 | – |
| ρ (× 10−6 Å−2) | 0.09 | 0.34 | 2.29 | 3.22 | 2.07 | |
| σ (Å) | 14.6 | 41.1 | 60.3 | 14.8 | 2.56 |
© 2016 by the authors; licensee MDPI, Basel, Switzerland. This article is an open access article distributed under the terms and conditions of the Creative Commons Attribution (CC-BY) license (http://creativecommons.org/licenses/by/4.0/).
Share and Cite
Niizeki, T.; Nagayama, S.; Hasegawa, Y.; Miyata, N.; Sahara, M.; Akutsu, K. Structural Study of Silica Coating Thin Layers Prepared from Perhydropolysilazane: Substrate Dependence and Water Penetration Structure. Coatings 2016, 6, 64. https://doi.org/10.3390/coatings6040064
Niizeki T, Nagayama S, Hasegawa Y, Miyata N, Sahara M, Akutsu K. Structural Study of Silica Coating Thin Layers Prepared from Perhydropolysilazane: Substrate Dependence and Water Penetration Structure. Coatings. 2016; 6(4):64. https://doi.org/10.3390/coatings6040064
Chicago/Turabian StyleNiizeki, Tomotake, Sachiko Nagayama, Yoshio Hasegawa, Noboru Miyata, Masae Sahara, and Kazuhiro Akutsu. 2016. "Structural Study of Silica Coating Thin Layers Prepared from Perhydropolysilazane: Substrate Dependence and Water Penetration Structure" Coatings 6, no. 4: 64. https://doi.org/10.3390/coatings6040064