Article

Assessment of Environmental Performance of TiO2 Nanoparticles Coated Self-Cleaning Float Glass

by
Martina Pini
1,*,
Erika Iveth Cedillo González
2,3,
Paolo Neri
1,
Cristina Siligardi
2 and
Anna Maria Ferrari
1
1
Department of Sciences and Engineering Methods, University of Modena and Reggio Emilia, Via Amendola, 2, 42100 Reggio Emilia, Italy
2
Department of Engineering “Enzo Ferrari“, University of Modena and Reggio Emilia, Via Vignolese, 905/A, 41125 Modena, Italy
3
Facultad de Ciencias Químicas, Universidad Autónoma de Nuevo León, Guerrero y Progreso s/n Col. Treviño, Monterrey 64570, Mexico
*
Author to whom correspondence should be addressed.
Coatings 2017, 7(1), 8; https://doi.org/10.3390/coatings7010008
Submission received: 5 September 2016 / Revised: 21 December 2016 / Accepted: 3 January 2017 / Published: 12 January 2017

Abstract

:
In recent years, superhydrophilic and photocatalytic self-cleaning nanocoatings have been widely used in the easy-to-clean surfaces field. In the building sector, self-cleaning glass was one of the first nanocoating applications. These products are based on the photocatalytic property of a thin layer of titanium dioxide (TiO2) nanoparticles deposited on the surface of any kind of common glass. When exposed to UV radiation, TiO2 nanoparticles react with the oxygen and water molecules adsorbed on their surface to produce radicals leading to oxidative species. These species are able to reduce or even eliminate airborne pollutants and organic substances deposited on the material’s surface. To date, TiO2 nanoparticles’ benefits have been substantiated; however, their ecological and human health risks are still under analysis. The present work studies the ecodesign of the industrial scale-up of TiO2 nanoparticles self-cleaning coated float glass production performed by the life cycle assessment (LCA) methodology and applies new human toxicity indicators to the impact assessment stage. Production, particularly the TiO2 nanoparticle application, is the life cycle phase most contributing to the total damage. According to the ecodesign approach, the production choices carried out have exacerbated environmental burdens.

1. Introduction

Since Fujishima and Honda discovered the photo-splitting of water in a titanium dioxide (TiO2) anode photochemical cell in 1972 [1], research in the self-cleaning field based in photocatalytic nanoparticles has continuously grown. Among all the various metal oxides that have been tested for photocatalytic applications, TiO2 has received the most attention because of its chemical stability and high reactivity under ultraviolet (UV) light irradiation. When a TiO2 particle absorbs a photon with hvEg (Eg = band gap of TiO2 = 3.2 eV) [2], an electron is transferred from the valence band to the conduction band (e), leaving behind a positive hole (h+). If the e-h+ pair interacts with adsorbed species, it forms radicals capable of oxidizing a wide range of organic pollutants into H2O and CO2 [3]. This property of TiO2 can be used to impart the self-cleaning functionality to a variety of materials including tiles, glass, plastic coatings, panels, wallpapers, window blinds, paints, tunnel walls and road blocks to name a few [4,5,6]—and the field is still growing. Indeed, according to the BCC Research Advanced Materials Report AVM069B, the total market for photocatalyst products is forecasted to grow over the next five years, and is estimated to be valued at nearly $2.9 billion by 2020 [7].
Although the self-cleaning property that photocatalytic TiO2 nanoparticles can impart to common materials is promising, the unexpected growth of nanotechnology is raising several concerns about the potential negative impacts that these new materials could cause on human health and the environment. The release of nanoparticles into environmental matrices could occur during different stages of their life cycles [8,9]. Therefore, considerable efforts should be made to assess the toxicity of nanoparticles, first on humans and then—though no less important—on the environment. The European Commission encouraged the life cycle approach to assess the sustainability of nanoproducts [10]. Life cycle assessment (LCA) is the most adequate methodology for determining the potentially adverse effects on human health and the environment of a product, process or service. It has thus been recognized as a useful tool to assess the environmental performance of nanoproducts [11].
Hischier et al. [12] investigated numerous review articles about the use of LCA in the nanotechnology field [13,14,15,16,17,18,19]. A key and open issue addressed in these reviews is the human toxicity and ecotoxicity characterization factors (CFs) for nanomaterials [12]. Thus far, CFs for a toxicity assessment have been published for two nanoparticles only, namely carbon nanotubes (CNT) [20] with graphene oxide [21] and TiO2 nanoparticles (nanoTiO2) [22,23].
The present work studies the ecodesign of the industrial scale-up of nanoTiO2 self-cleaning coated float glass production performed by LCA methodology, focusing on the assessment of both human health effects and environmental loads of the entire life cycle of this new nanomaterial. Therefore, previously developed frameworks [23,24] established to evaluate the potential human toxicity impacts of nanoTiO2 have been implemented in the impact assessment stage. This study was a part of an Italian project named “ARACNE” [25]. The main aim of this project is to study and ecodesign eco-friendly building materials with higher technological properties. In addition to the present LCA study, several LCA case studies of building nanomaterials have been carried out within ARACNE [24,26,27,28].
Over the last several years, few LCA studies that deal with releases of nanoparticles have been carried out. In particular, these studies are analyses of nanoTiO2 [12,26,27,28,29,30], silver nanoparticles [31], CNT [20,32] and silica [33]. Nevertheless, only five LCA studies [26,27,28,29,30] were implemented in the life cycle impact assessment (LCIA) phase with the preliminary human toxicity factors calculated following the Ecoindicator 99 framework for carcinogenic substances [24], and only two of these [28,30] further applied the human CFs to a nanoTiO2 analysis performed with the USEtox™ (version 2.0, Lyngby, Denmark) framework [23]. Moreover, the study of Hischer et al. applied only the latter CFs in the LCIA [12].
This work, together with two Pini et al. studies [28,30] (belonging to the ARACNE project and concerning different building materials, i.e., enameled steel panels and porcelain stoneware tiles), are the first LCA case studies assessing the nanoparticles released during the building nanomaterial life cycles, subsequently using the LCIA for all human toxicity factors performed by two different frameworks before analyzing the obtained results. Again, in accordance with the ecodesign approach, the production choices carried out have led to concerns about environmental burdens and safety of human health. Finally, the benefit derived from the nanoTiO2 application of was also assessed considering toluene and NOx abatements.

2. Materials and Methods

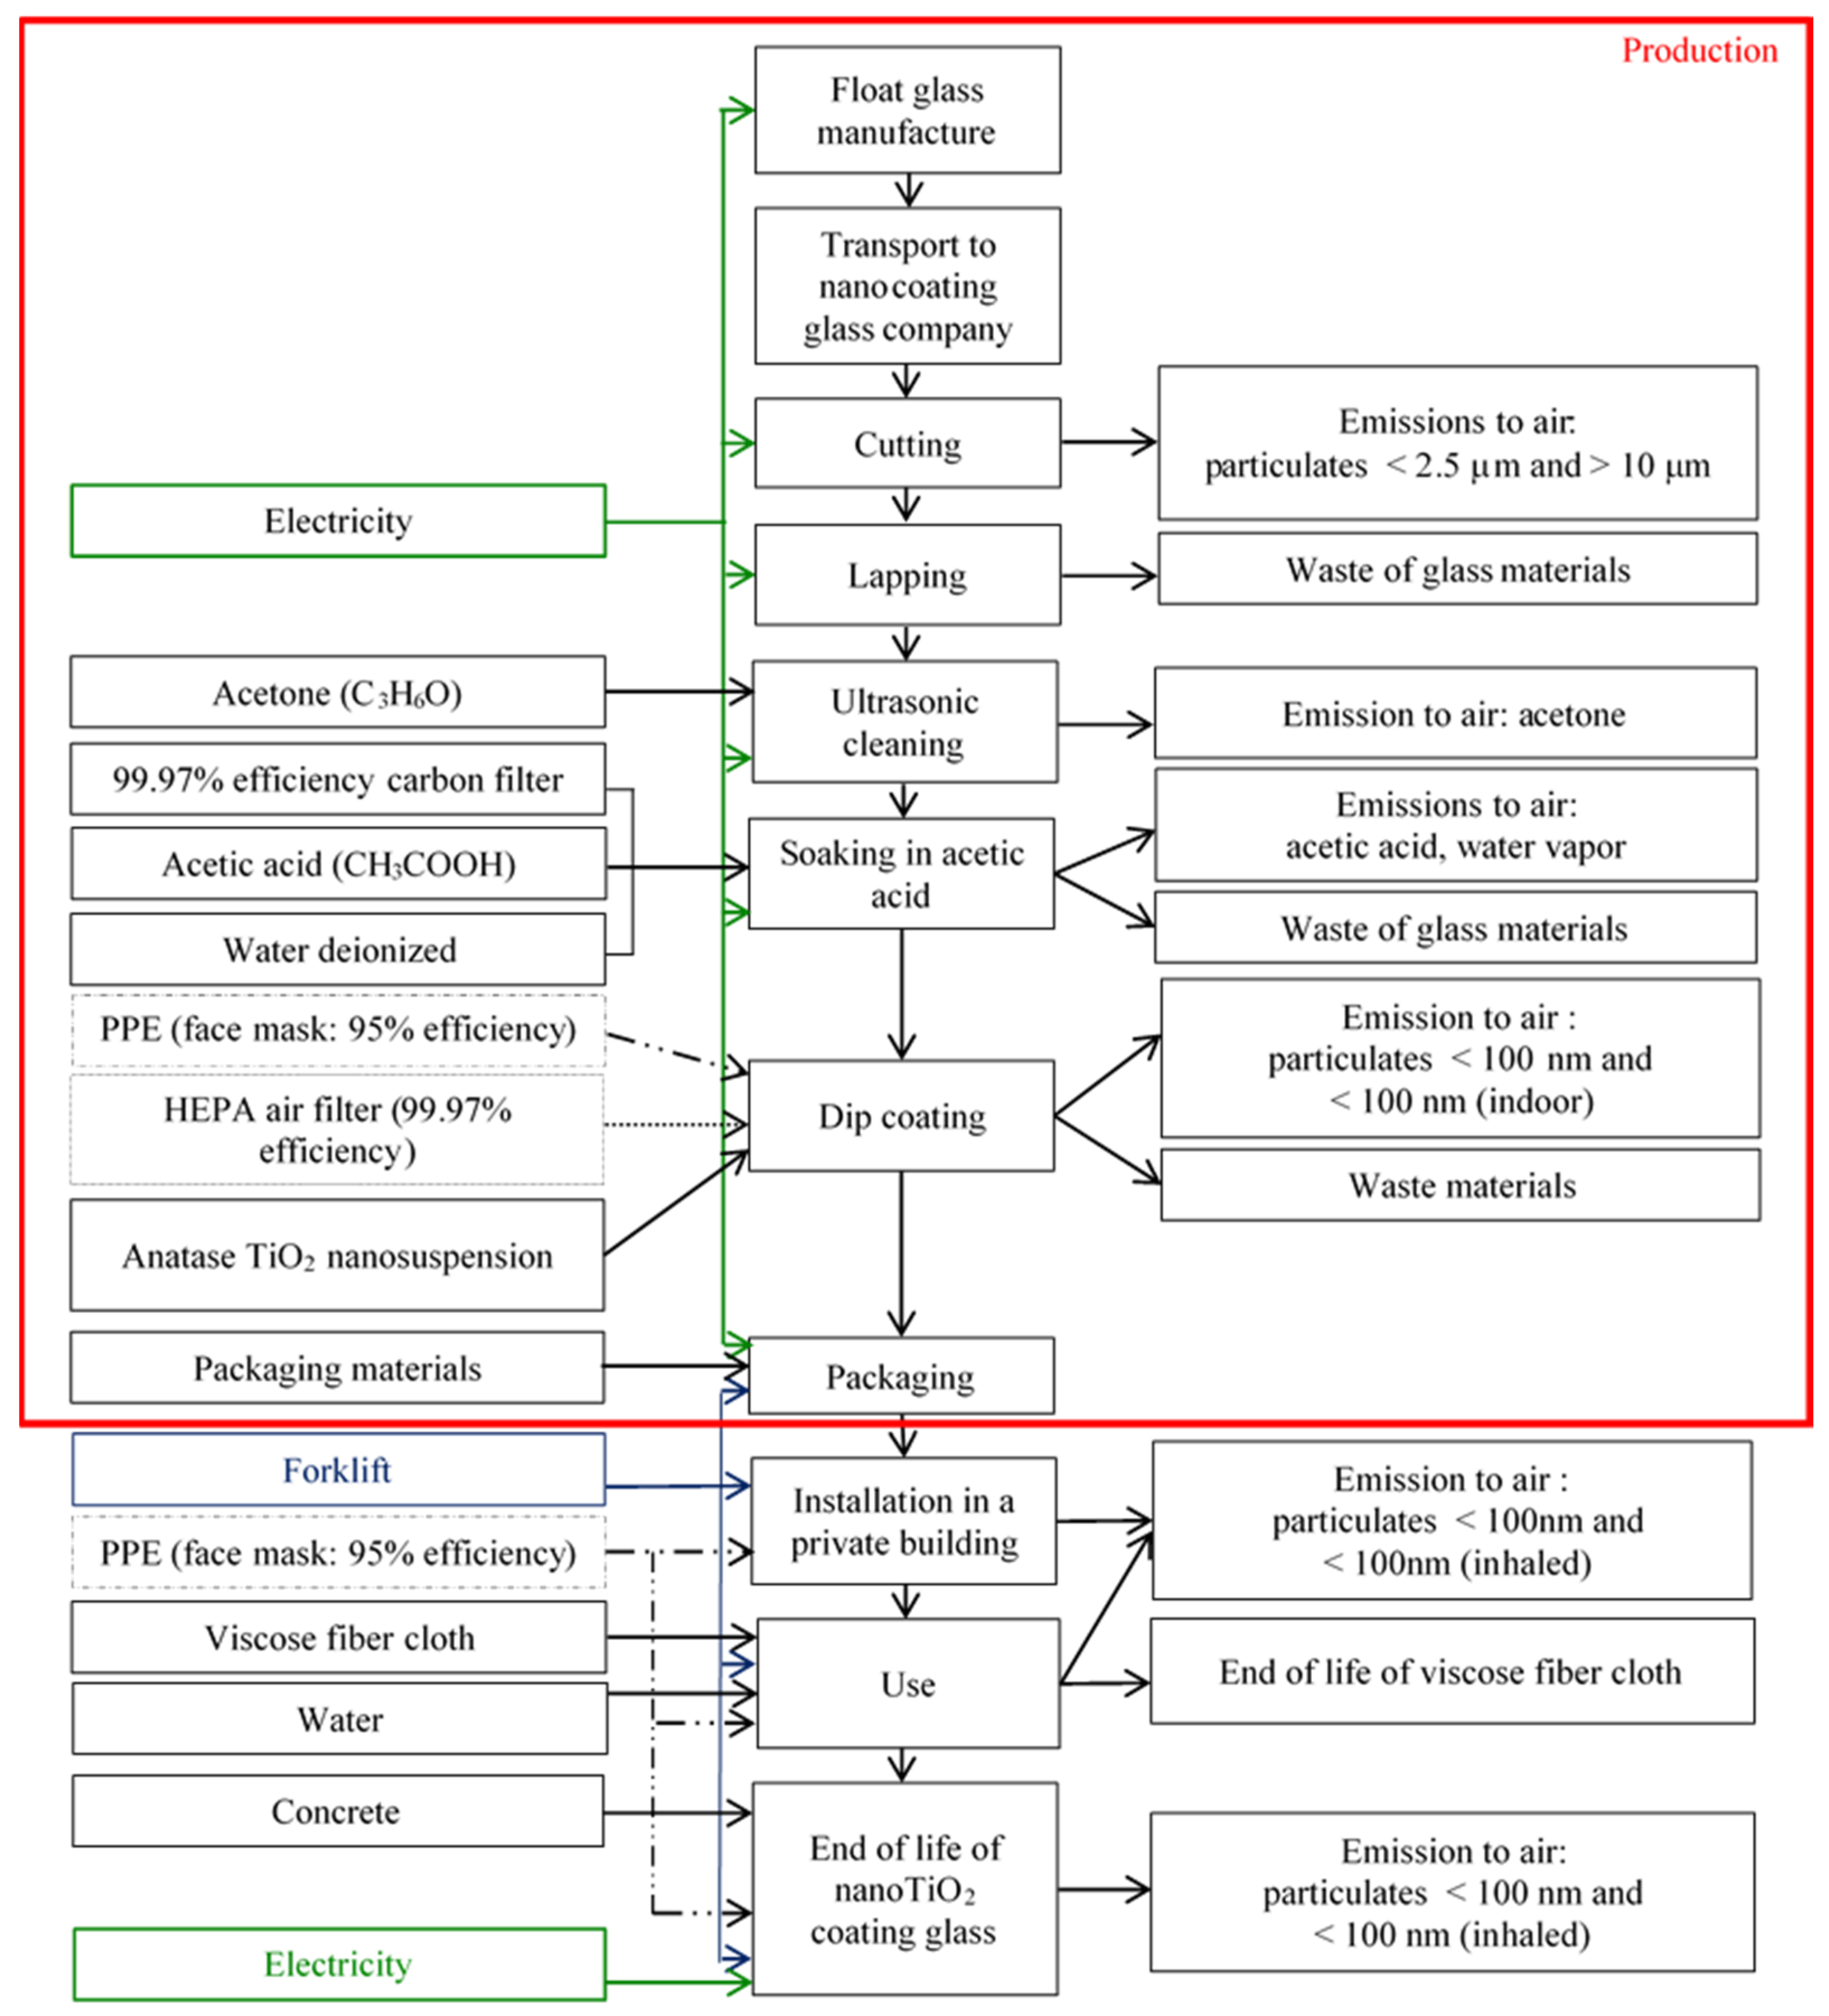
2.1. Ecodesign of an Industrial Scale Process

In this work, a modified coating method [34], consisting first of a decrease in initial substrate roughness with acetic acid and then dip-coating of the softened glass into a TiO2 acid nanosuspension, was used with the aim of producing films with enhanced adhesion to the substrate. This coating method was optimized thanks to experimental tests carried out in a chemical lab. The research continued with the intent to design an industrial scale-up of the developed coating method. Nevertheless, when a technology is not ready for the commercial scale, which is often the case with emerging technologies, sufficient data is scarcely available and so the environmental performance evaluation is based on incomplete information [35]. Therefore, LCA analysis of a production process at a laboratory scale should not be considered since the LCA results do not necessarily represent the environmental burdens which would be caused after scaling up to typical mass production [36,37,38,39]. The reasons are:
  • There might be changes due to scale up in process yield as well as in energy efficiency of the process; these can influence the environmental burdens, as these affect the material and energy use as well as the amount of emissions and waste.
  • There might be changes in technology and in the material or energy supplies.
  • In LCA analysis of pilot/laboratory plants, processes are often seen as isolated or independent from each other. The effects due to changes in plant utilization are not considered sufficiently.
Gavankar et al. [36] studied the role that scale and technology maturity play in LCA of new technologies, e.g., nanotechnologies. They stated, “the magnitude of environmental impacts of emerging technologies at their mass production scale can be significantly smaller than a linear extrapolation of early LCAs may suggest”.
In this work, starting from laboratory data, the best environmental performance of the industrial scale-up process of nanoTiO2 self-cleaning coated float glass was evaluated. Here, the authors adopted a first linear extrapolation to convert lab-scale data into industrial-scale data. Future steps would be to include more elaborate up-scaling schemes.
To ecodesign the industrial-scale process, it was necessary to consider literature data and databases included in SimaPro 8 software [40] (e.g., ecoinvent v2 database [41] was used to model the float glass process), since the laboratory scale does not give meaningful information about plants, equipment, internal transports, nor about ordinary maintenance operations of equipment and machineries. In addition, no data related to the installation, use and end-of-life stages of nanoTiO2 self-cleaning coated float glass have been provided by the laboratory.

2.2. Goal and Scope Definition

The goal of the study is to assess the environmental impacts of a nanoTiO2 self-cleaning coated float glass over its entire life cycle in order to identify the hot spots of the system during the entire life cycle. The system studied is a self-cleaning glass coated with nanoTiO2 film to create a surface that remains cleaner for longer than conventional glass. Titanium dioxide incorporation in building materials and its activation by the near-UV fraction of incident solar irradiation offers promising potential, namely the reduction of organic and inorganic pollutants. Therefore, the benefits derived from its application have been considered, i.e., the abatement of inorganic and organic substances (e.g., NOx and toluene emissions). In particular, an abatement of 4.01 mg/h·m2 for NOx substance (studied by Chen and Poon [4]) and a reduction of 100 mg/h·m2 for toluene emission (proposed by Demeestere [42]) were taken into account. To evaluate the reduction in concentration of these substances in the LCA studies, negative values were considered as input data.
The function of self-cleaning is applications in private buildings, such as traditional windows and curtain walls as well as glazing. 1 m2 of nanoTiO2 self-cleaning coated float glass is analyzed. The system boundaries cover the entire life cycle of the system analyzed, following the LCA approach. The analysis includes the supply of all raw materials involved in the coating process, packing, installation and end of life (Figure 1). The production, maintenance and disposal of facilities as well as the environmental burdens related to the production of chemicals, packaging and other auxiliary materials are also included in the present study. Emissions into the air and water, as well as the solid waste produced in each step are taken into account. The transportation to a treatment facility of the solid waste is also considered.
Starting from laboratory data, the best environmental performance of the industrial scale-up process of nanoTiO2 self-cleaning coated float glass was evaluated. Moreover, because of the limited knowledge currently available regarding the effects nanoTiO2 may have on the environment or human health [43], safe behavior was adopted for all life cycle steps in which workers may come into contact with or inhale nanoparticles released by a nanocoating surface. The following assumptions have been made:
  • HEPAs (high efficiency particulate air filters), possessing 99.97% efficiency, were installed during cutting, soaking in acetic acid and coating steps.
  • Use of PPE (personal protective equipment), particularly the face mask with its 95% efficiency [44] in protecting workers from dust and nanoparticles inhalation during coating, installation, use and end-of-life steps was implemented.
  • A closed manufacturing system was designed.
  • Use of specific packaging to limit the release of nanoparticle emissions during transportation was used.
  • Transport distances of facilities, raw material, chemicals, materials for packaging from supplier to the production site have been assumed equal to 100 km, as required by the environmental product declaration (EPD) certification [45].
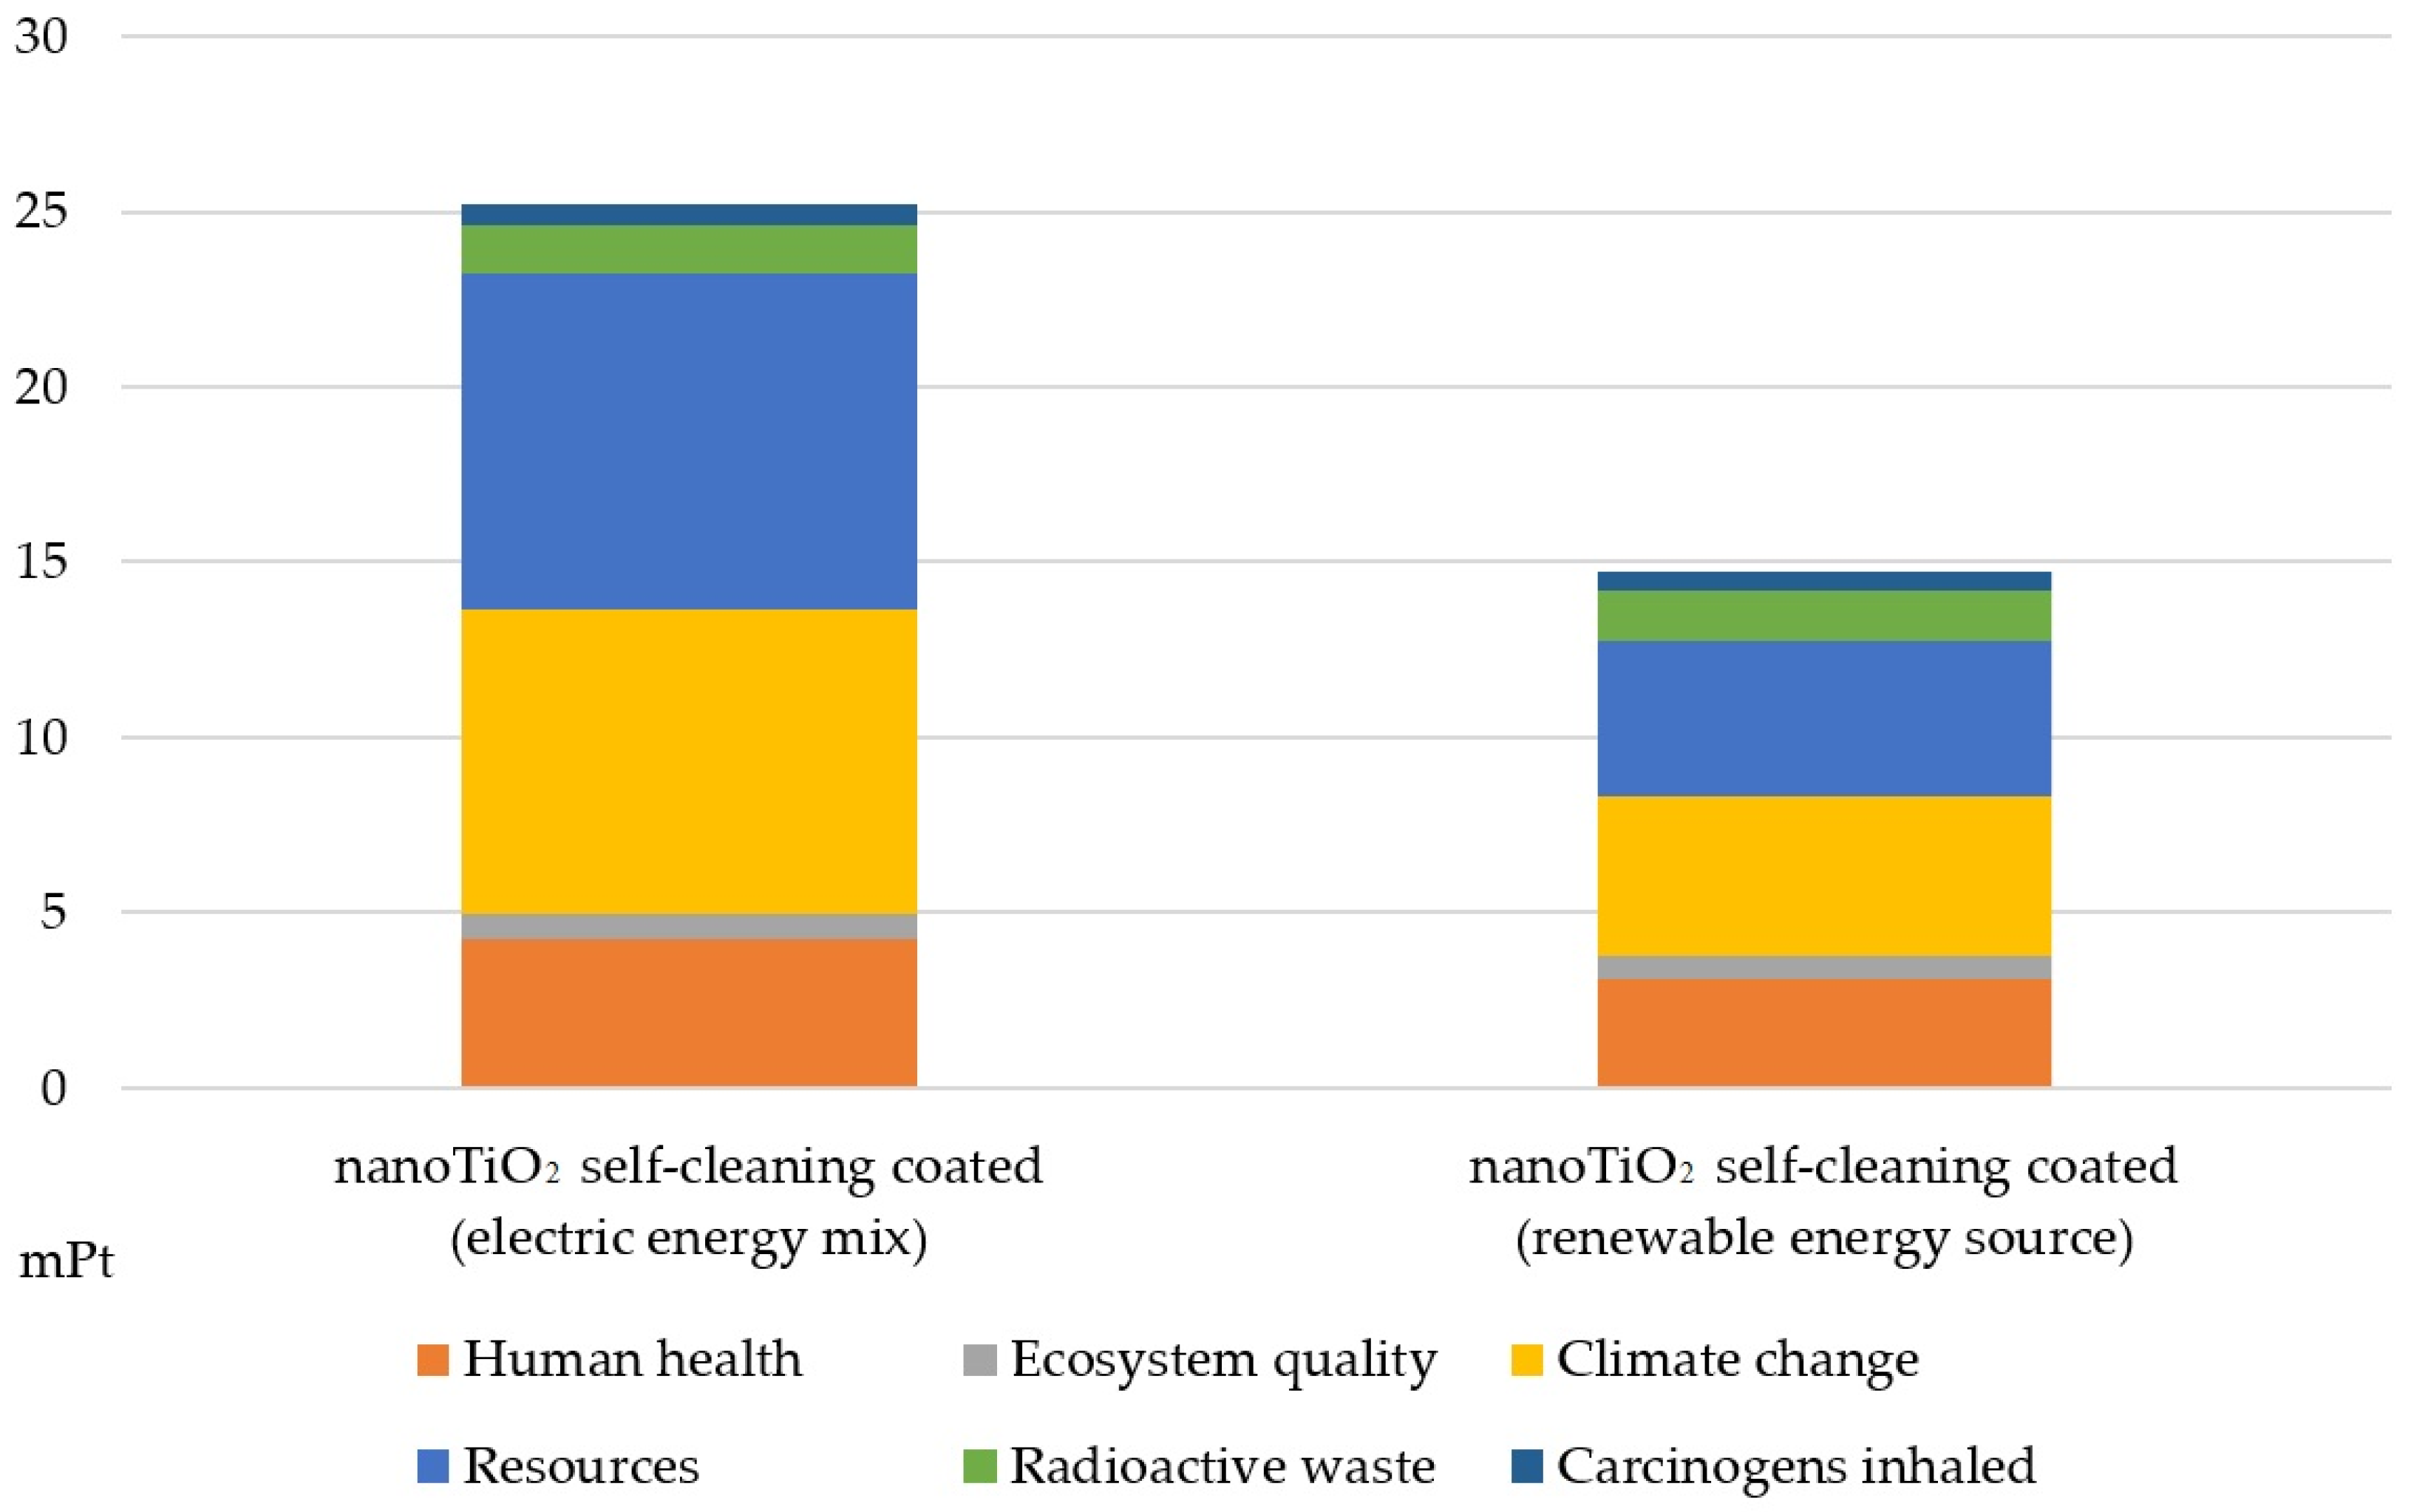
  • Italian mixed-electric energy obtained by non-renewable sources (the electricity type mainly used in Italy) and created by ecoinvent was assumed. Obviously, adopting renewable energy such as photovoltaic energy, would enhance the environmental performance. In particular, environmental damage associated with the use of renewable sources can decrease by more than 87%. Nevertheless, this study is part of a regional Italian project, so its production must be located in the Italian territory.

2.3. Impact Assessment

Life cycle impact assessment (LCIA) results were modeled by a modified IMPACT 2002+ v2.10 [46] method as described below and successively by a modified USEtox™ method v1.03 [47] in order to consider the human health CFs for nanoTiO2 in an indoor and outdoor environment as calculated by Pini et al. [23]. For a more representative index of the considered system, some additions and modifications were implemented in IMPACT 2002+, i.e., modification to the categories Land use (different types of land transformations were considered) and Mineral extraction (additional resources were added), as well as the Radioactive waste category (radioactive waste and its occupied volume was evaluated) [24,26].
Further, this study assesses the releases of nanoTiO2 into the air (outdoor environment) and those inhaled by workers. Therefore, human toxicity of nanoTiO2 for the outdoor environment and that breathed in by workers were calculated as reported in Ferrari et al. [26] and Pini, [24] and then incorporated into the IMPACT 2002+ method.
The environmental benefits derived from nanoTiO2 application were evaluated only by the IMPACT 2002+-modified method.

2.4. Life Cycle Inventory

The entire life cycle of a nanoTiO2 self-cleaning coated float glass (shown in Figure 1) consists of four main steps: (1) production; (2) installation; (3) use and (4) end of life. The production step, in turn, is divided into: (a) cutting; (b) lapping; (c) ultrasonic cleaning; (d) soaking in acetic acid; and (e) dip-coating.
The present study considers the outdoor application of a self-cleaning float glass in a private building. Inventory data, related to the life cycle of the bottom-up hydrolytic synthesis of nanoTiO2, is reported by Pini et al. in a previous work [29]. The synthesis procedure was patented and employed by Colorobbia Italia S.p.A. [48]. The entire production and the end of life are the main life cycle steps that require electric energy. The life cycle of nanoTiO2 self-cleaning coated float glass is described below.

2.4.1. Production

First, the Saint Gobain soda-lime float glass is cut into the customer’s required size. The obtained glass is then polished to bevel the edges and corners. The successive ultrasonic cleaning step is a process that is able to clean the glass surface using ultrasound and acetone as solvent media. The clean glass is soaked in 96% CH3COOH for 4 h to decrease the surface roughness of the substrate; the etched glass is subsequently coated with five layers of a nanoTiO2 suspension at a coating rate of 85 mm/min. Finally, nanoTiO2 coated float glasses are packed in a wooden box.

2.4.2. Installation and Use Phase

The nanoTiO2 self-cleaning coated float glass was used for a private building as windows. In the installation step, the transport by lorry from the production company to the installation site and the handling of glasses from the lorry to the private building were evaluated. The installation of a single glass with nanoTiO2 coating side oriented externally was considered.
In the use phase, nanoTiO2 self-cleaning coated float glass was considered for applications such as windows, external windows, conservatories, etc. In accordance with Fujishima et al. [49], the duration of ten years of nanoTiO2 coating effects was assumed. In the study, the heat reflected outside (thanks to the nanocoating) and the heat that transferred through the glass was assessed. Therefore, in summertime, the nanoTiO2 coating kept the indoor room cooler thus obtaining a benefit. On the contrary, in winter, this phenomenon meant that part of the solar heat did not pass through the glass windows, decreasing the radiation heat inside the room. Furthermore, the benefits of nanocoating such as the reduction of NOx and VOCs concentrations was evaluated. Finally, annual maintenance of glazing with only water and viscose fiber cloth was included.

2.4.3. End of Life

To protect human health, and considering the uncertainty of the potential damage caused by nanoparticles after ten years (duration of nanoTiO2 coating effects), making the glass inert through specific waste treatment was assumed; the waste glass was covered with concrete and then buried. Different glass lifetimes were evaluated in order to take into account the real lifetime of glass compared to that of the coating. Therefore, refunctionalization of glass after ten years was assumed. Considering a glass lifetime of 30 years and two functionalization treatments are needed. A final inertization treatment was considered.
The compilation of inventory data was carried out using databases included in SimaPro 8 software [40]. The ecodesign of industrial scale-up production of self-cleaning glass coated with nanoTiO2 film was performed on lab data, carried out by the experiments to determinate the optimized coating method. The remaining data was obtained from specialized databases and literature such as devices, machineries, plants, internal transports, ordinary maintenance operations and all data regarding installation, use and end-of-life steps. A selection of important data used in the LCI (life cycle inventory) of nanoTiO2 self-cleaning coated float is reported in Table 1.

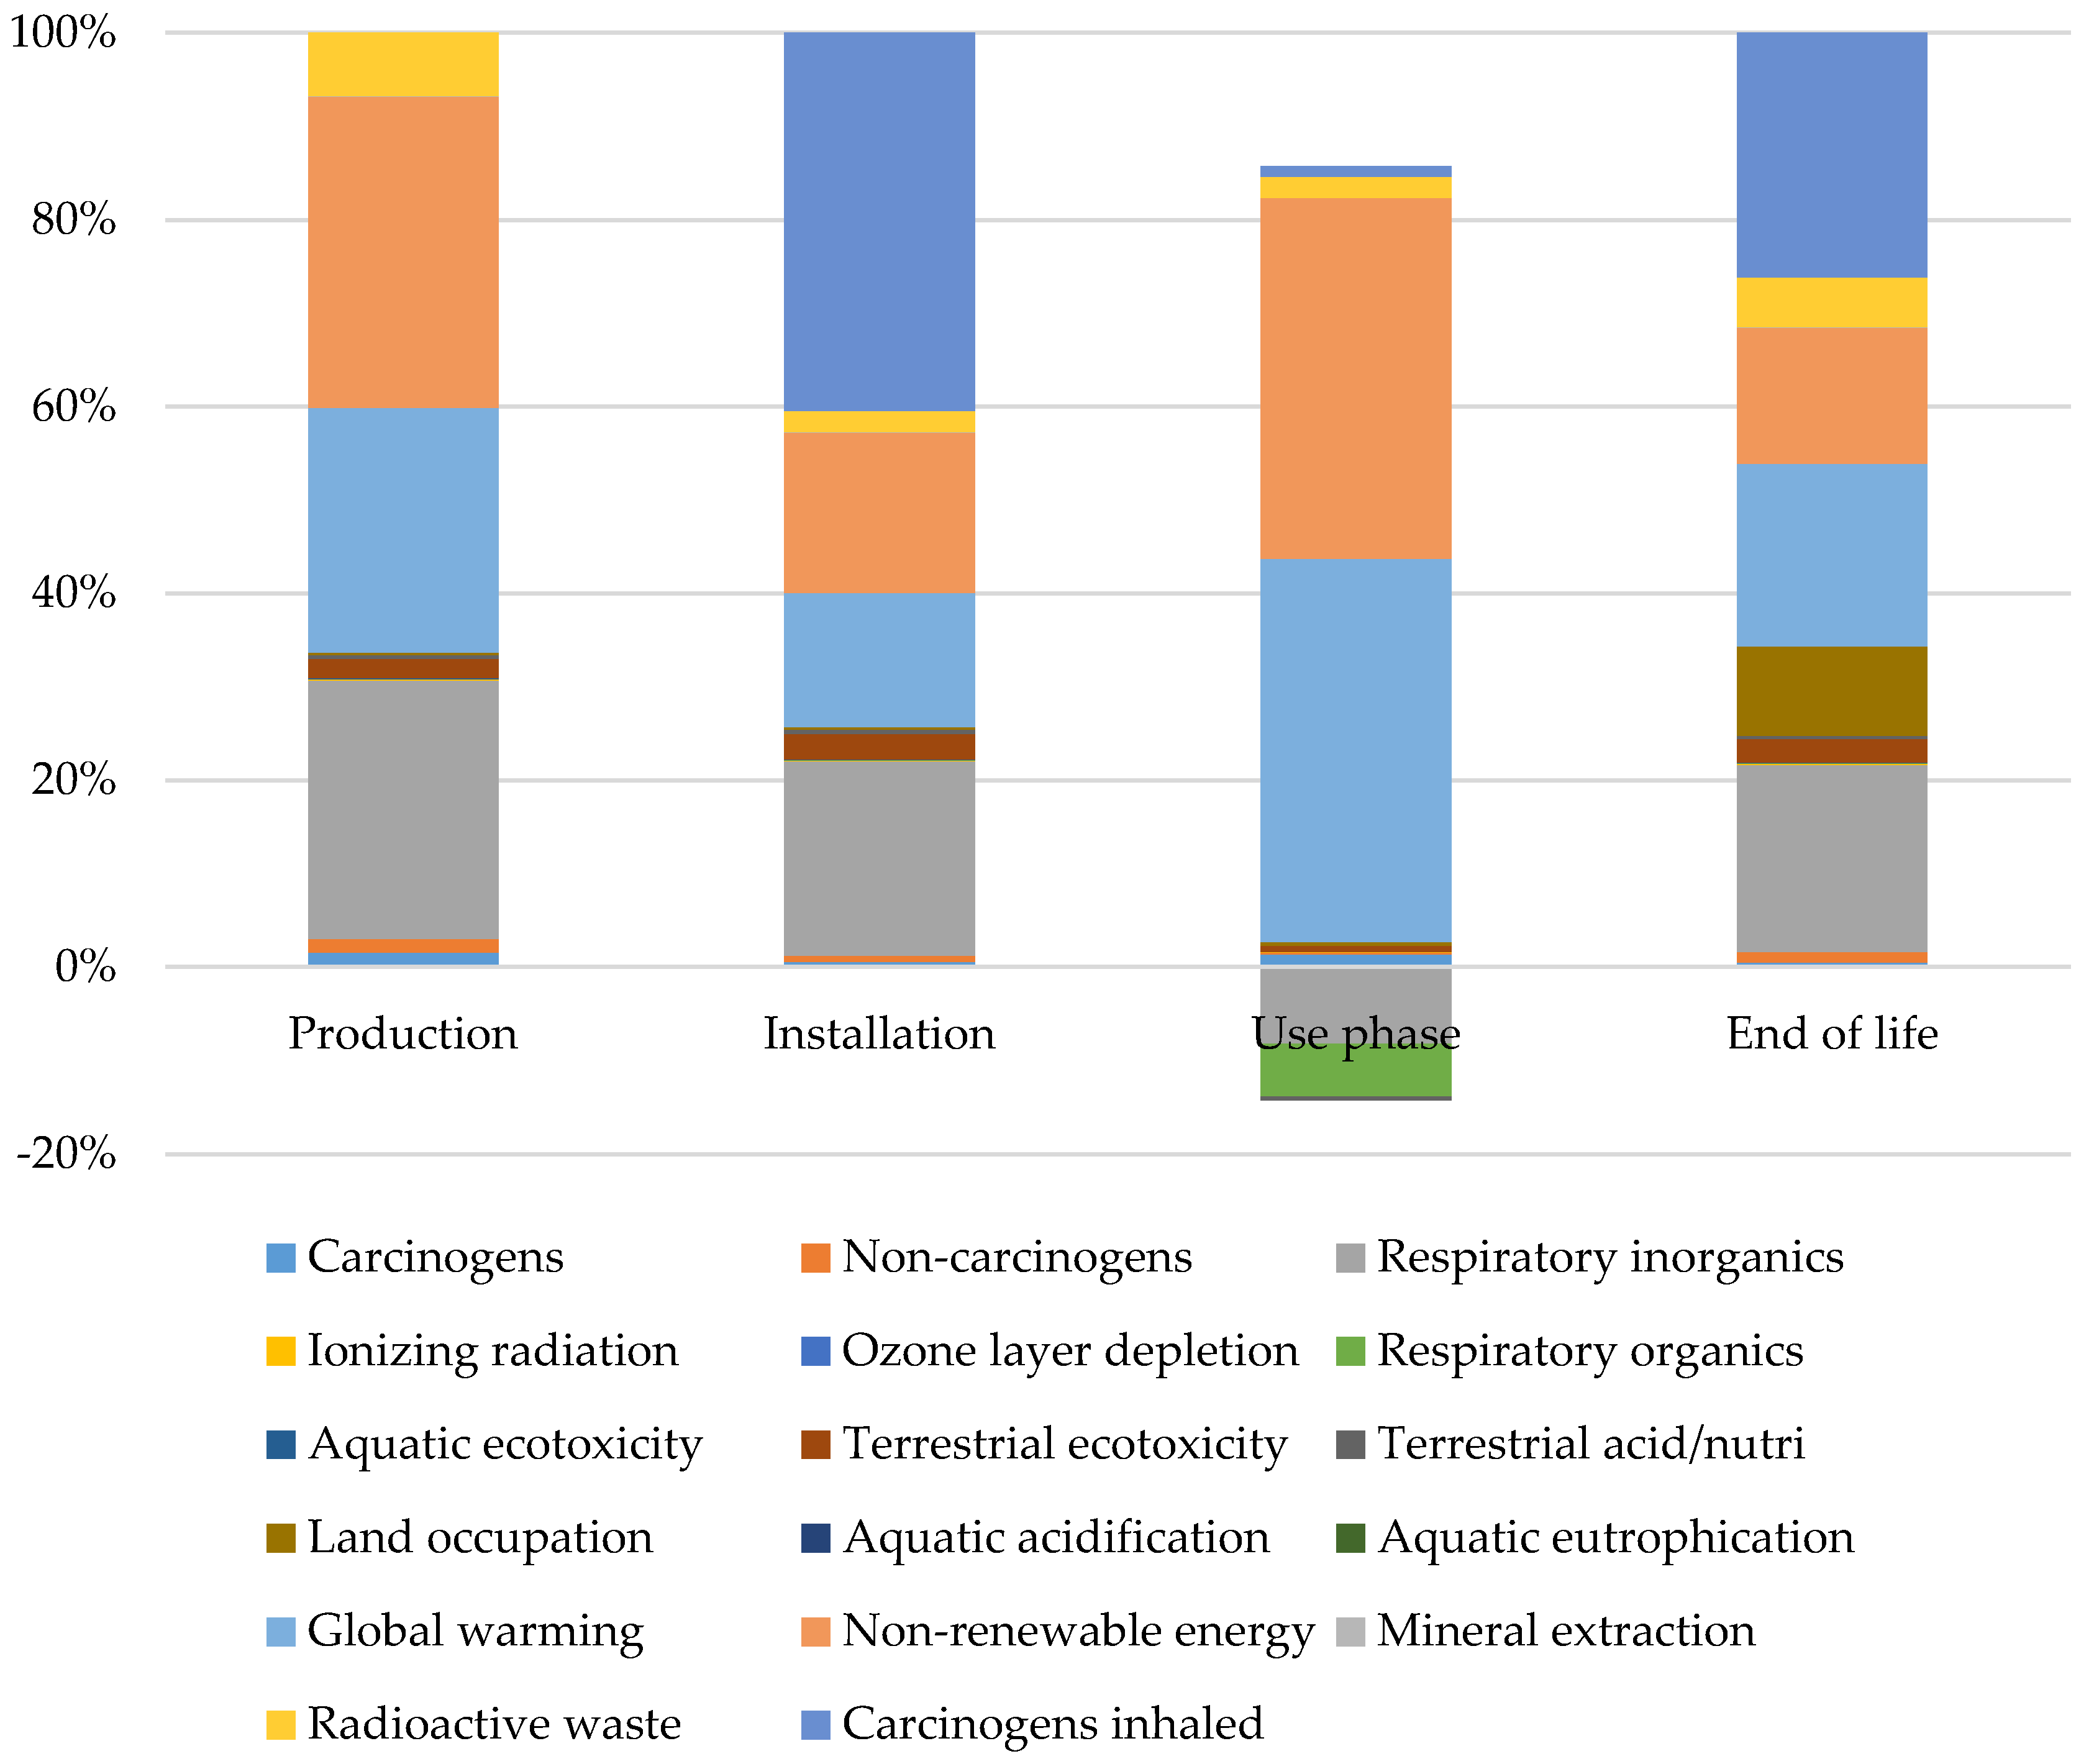
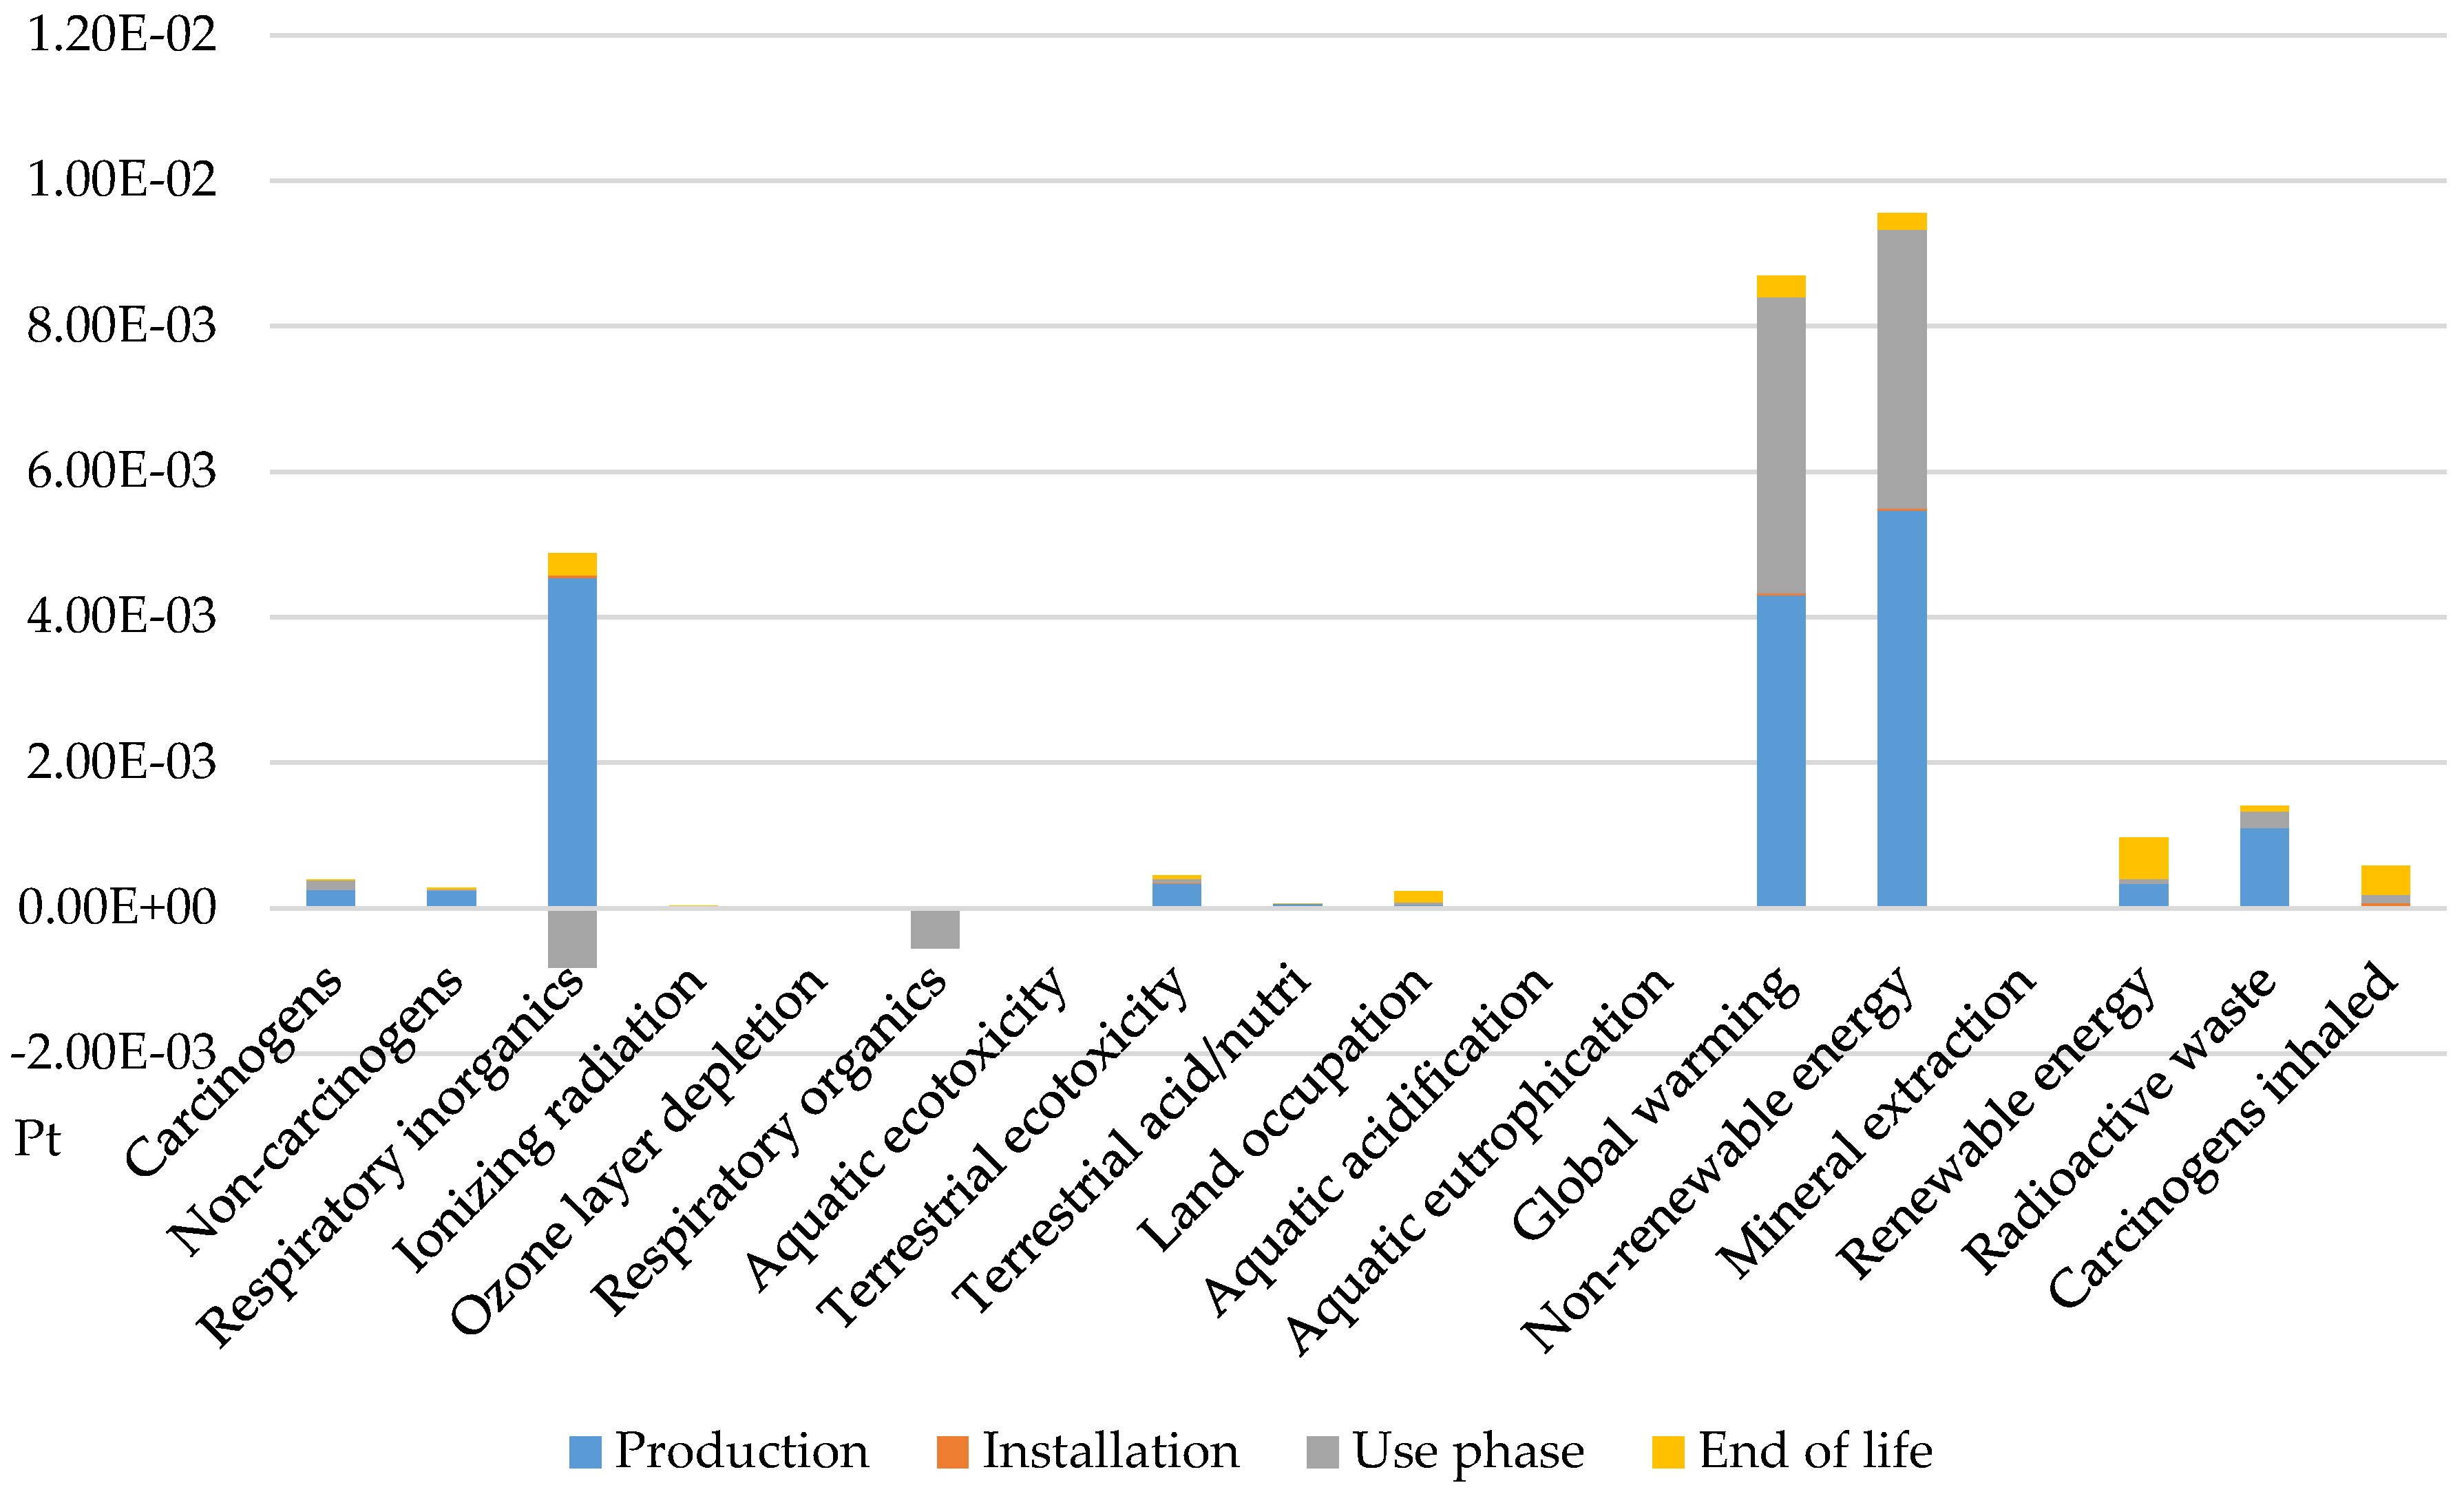
3. Life Cycle Impact Assessment

3.1. The Modified IMPACT 2002+ Method

The environmental analysis of 1 m2 of nanoTiO2 self-cleaning coated float glass was conducted. Single score damage is equal to 25.22 mPt. The results of the analysis at mid-point level reported in Table 2 and Figure 2 show that the phases of the life cycle with the highest environmental burdens are the production (65.08%) and the use (28.16%) stages, followed by end of life (6.08%) and installation (0.67%).
Figure 3 highlights that the most significant contribution to the total damage is due to the Non-renewable energy impact category (37.89%), which is primarily affected by natural, in-ground gas (63.35%) due to the production phase (41.7%), in particular for electric energy consumption. Subsequently, the second major contribution to the total damage is generated by the Global warming impact category (34.49%), mainly due to fossil carbon dioxide (96.73%), which is caused by the production process (49.6%) and the use phase (46.68%), especially for glass manufacture and energy spent on air conditioning in the summer.
The human toxicity effects generated by releases of nanoTiO2 afflict the Carcinogens (outdoor environment) and Carcinogens inhaled (nanoparticles inhaled by worker) impact categories. In Carcinogens inhaled (2.32%), the damage is entirely due to the releases of 7.45E−07 kg of particulates, <100 nm inhaled (anatase TiO2 nanoparticles) by human, especially during end-of-life (68.76%) and use (19.45%) stages. Carcinogens impact category (1.56%) is affected by of 7.25E−4 kg of particulates <100 nm in the air during the use phase.
Finally, the benefits derived from nanoTiO2 application (toluene and NOx emission reductions) involve the Respiratory inorganics and Respiratory organics impact categories. Respiratory inorganics (16.12%) is mainly influenced by 37.33% of particulates, <2.5 μm, and 32.02% of sulfur dioxide, and the production process determines the main environmental burden (86.56% and 86.13% respectively), especially in regards to the lapping process and glass manufacture. This category is also affected by nitrogen oxides in the air (8.69%), and the production process determines the main environmental burden (385.35%) balance by use phase benefit (−331%).
In Respiratory organics (−2.18%), the reduction of −2.92 kg of toluene (VOC) emission to air (−100%) is derived from the benefit of nanoTiO2 application in the use phase.
The impact of nanoTiO2 release and inhaled by worker expressed in eco-point (Pt) is equal to 0.584 mPt. Conversely, the environmental benefit generated by toluene and NOx abatement is equal to 1.77 mPt. The benefit derived from organic and inorganic emissions reduction counterbalances the negative impact of nanoTiO2 releases; they differ in one order magnitude. However, the limited negative effect of nanoTiO2 emissions depends on the safe choice defined in keeping with the ecodesign approach.
The endpoint analysis highlights (Table 3) that the total damage is affected by 16.74% to Human health (4.22E−3 Pt), 37.97% to Resources (9.57E−3 Pt), 34.49% to Climate change (8.69E−3 Pt), 2.89% to Ecosystem quality (7.29E−4 Pt), 5.59% to Radioactive waste (1.41E−3 Pt) and 2.31% to Carcinogens inhaled (5.84E−4 Pt).

Effects of Different Electricity Sources

The LCIA results highlight that the electric energy consumptions produce the main environmental loads. Therefore, a sensitivity analysis was conducted in order to assess the environmental improvement adopting renewable electricity, here represented by photovoltaic electricity mix, instead of the one derived from fossil fuel as required by the electric energy mix.
Table 4 and Figure 4 show the environmental performance enhancements of 41.51% (−1.047 mPt) when renewable energy is used instead of the electric energy mix generated mainly by fossil fuels. The world’s trend is to increase renewable energy use. Therefore, the comparison between these two scenarios allows evaluating the environmental performance of an ideal situation, where the total electric energy mix is completely replaced by renewable sources, such as a photovoltaic mix. Nevertheless, today, the share of fossil fuels in the global mix is around 82% (the same as it was 25 years ago) and the contribution of renewable energy only reduces this to around 75% in 2035 [50]. This means the “nanoTiO2 self-cleaning coated using electric energy mix” currently represents the real energy context. Finally, the LCIA results highlight that the benefit derived from nanoTiO2 application (1.77 mPt) has the same order of magnitude of the environmental improvement obtained by the use of renewable electricity (1.047 mPt).

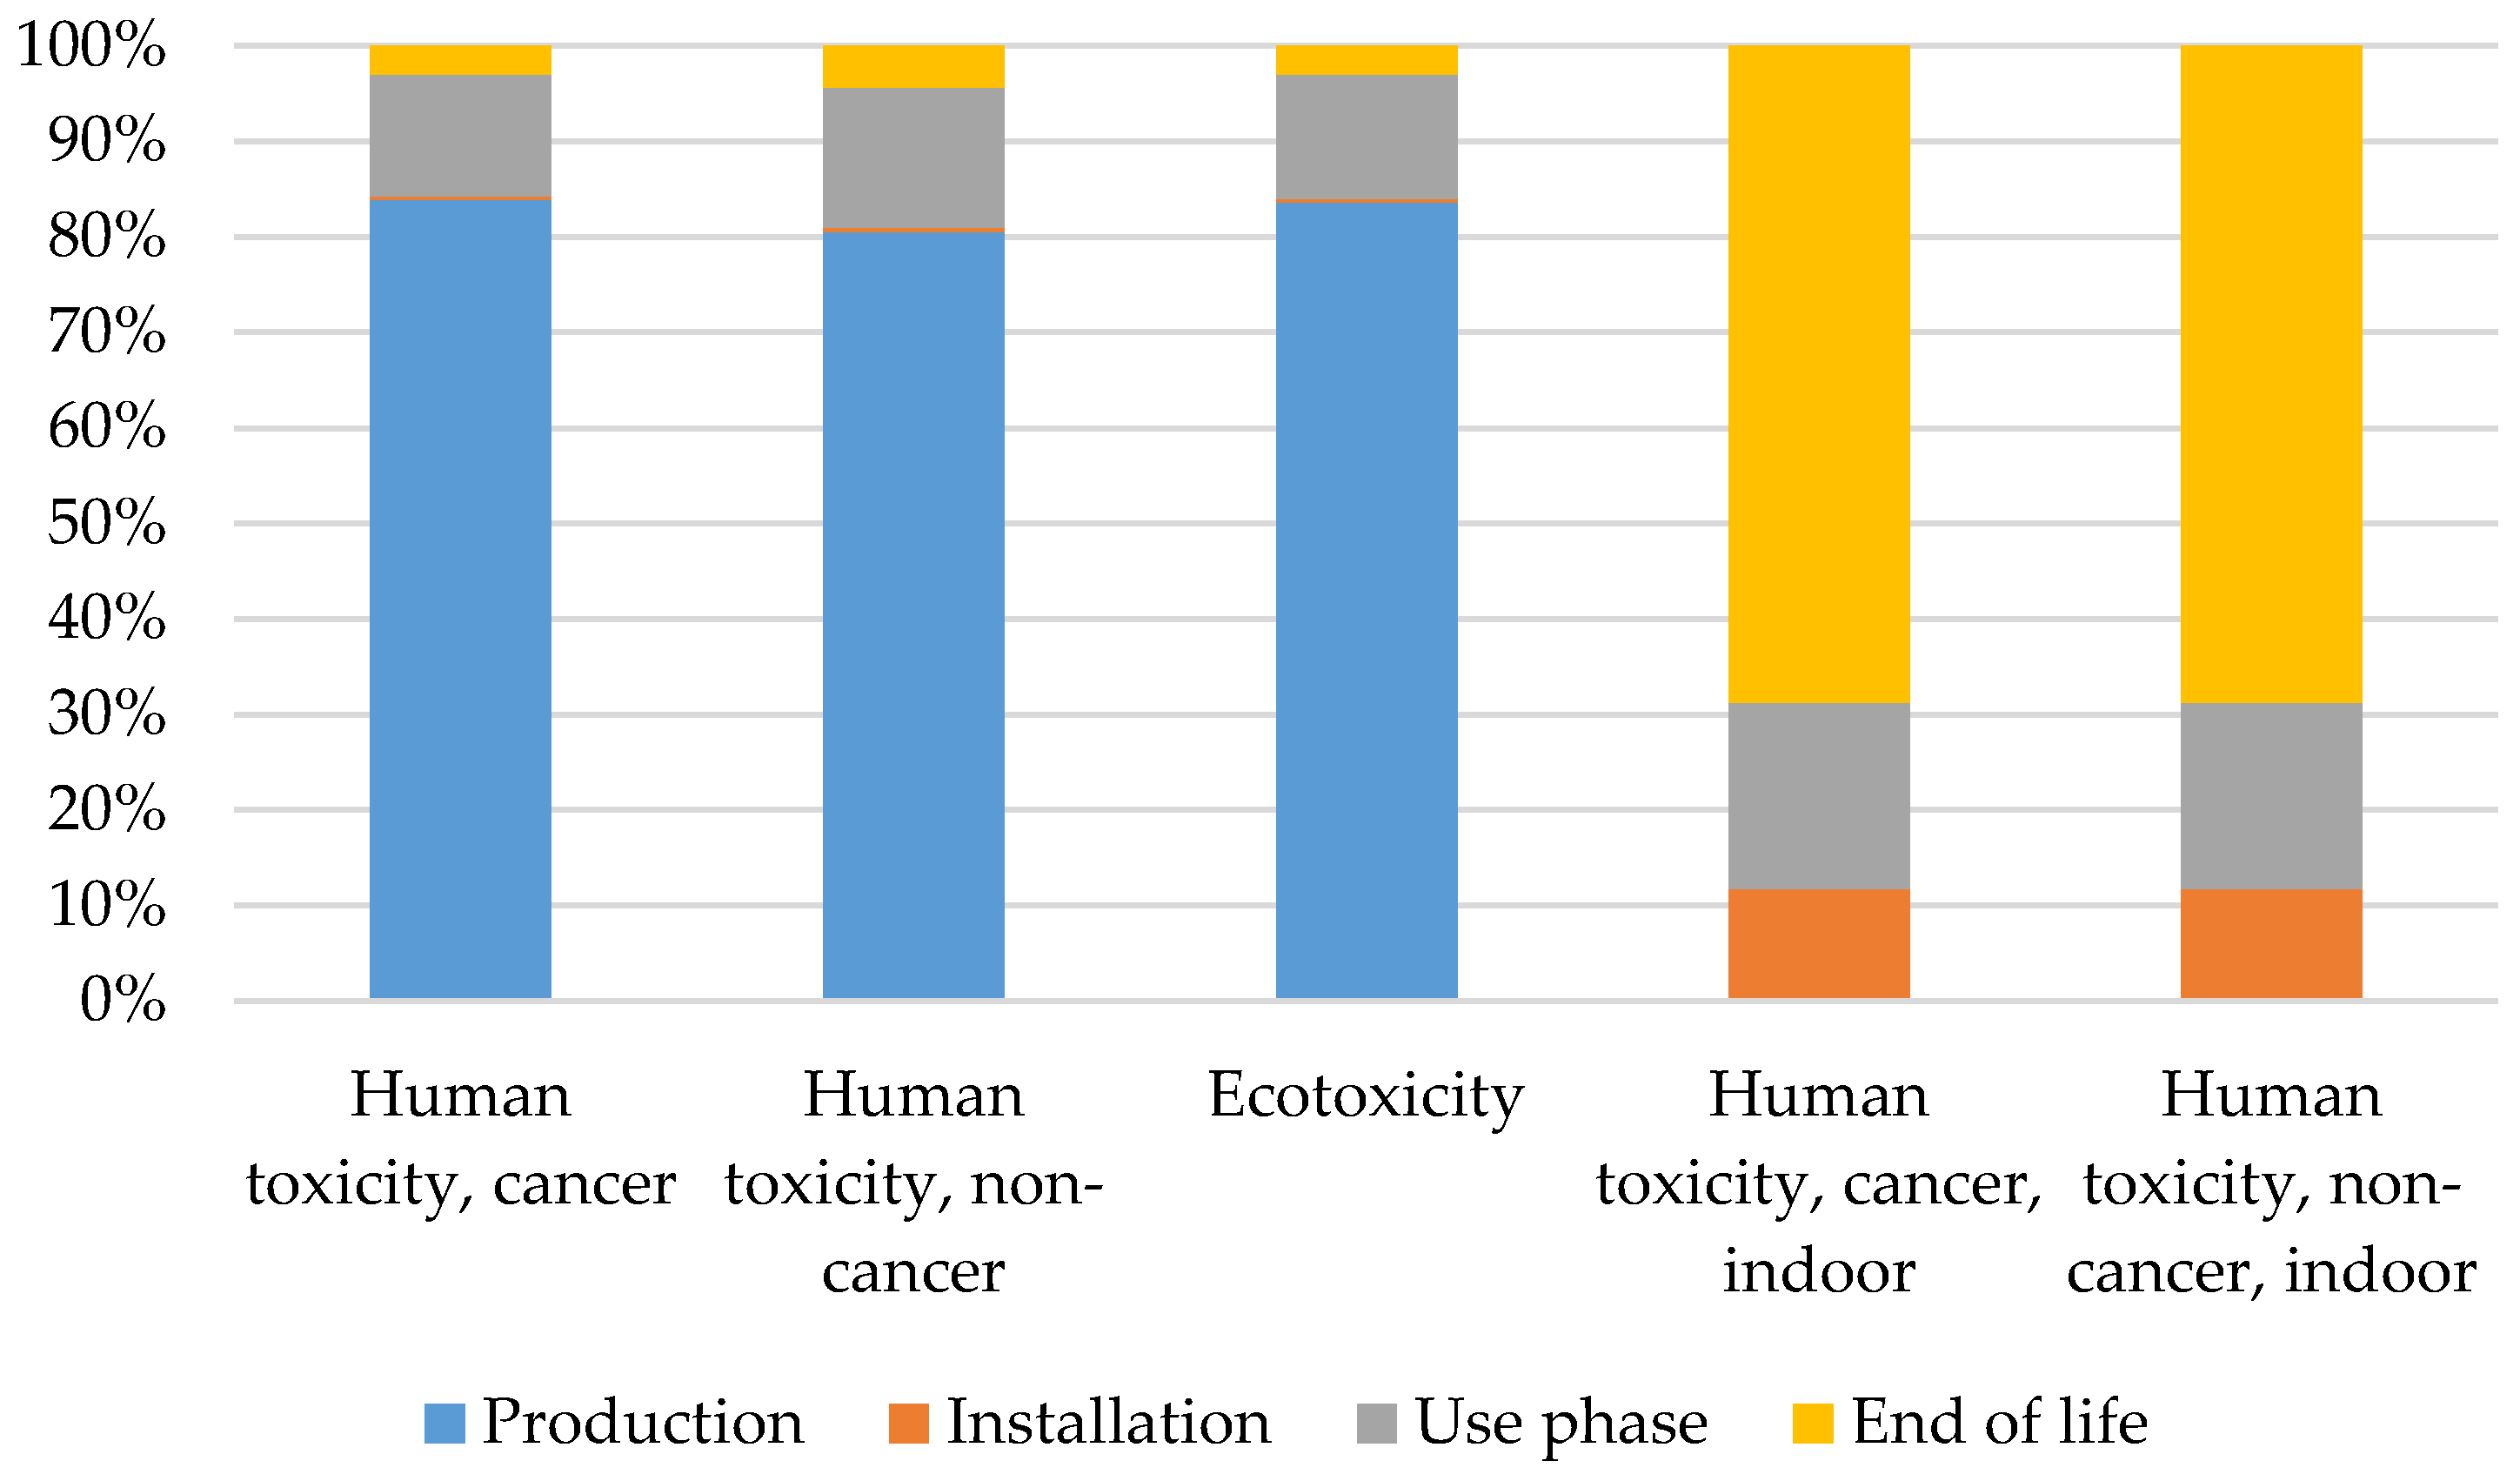
3.2. The Modified USEtox™ Method

The results of the analysis at mid-point level reported in Figure 5 and Table 5 show that the life cycle phases with the highest environmental loads are the production stage, in particular due to the Human toxicity, cancer (85.5%), Human toxicity, non-cancer (80.6%) and Ecotoxicity (83.6%) impact categories and the end-of-life stage, specifically Human toxicity, cancer, indoor (68.8%) and Human toxicity, non-cancer, indoor (68.8%).
The total damage of Human toxicity, cancer and Ecotoxicity impact categories is mainly due to chromium VI in water (95.23% and 89.8%, respectively), which is caused by the production stage (86%), particularly the steel manufacture used to produce the air filter. Moreover, in Human toxicity, non-cancer, barium in water generates major environmental load (42%), specifically affected by the production stage (77.6%) producing the heavy fuel oil necessary for flat glass production. In Human toxicity, cancer, indoor and Human toxicity, non-cancer, indoor impact categories, the damage is completely caused by the releases of 7.45E−07 kg of particulates, <100 nm inhaled (anatase TiO2 nanoparticles inhaled by people that are in the room) in indoor environment and is mainly due to end-of-life phase (68.76% for both impact categories). Releases of 2.6E−6 kg of particulates, <100 nm in the air affect Human toxicity, cancer by 0.261% and Human toxicity, non-cancer by 8.53E−2% and chiefly results from the installation and use phase (98.62% for both impact categories).

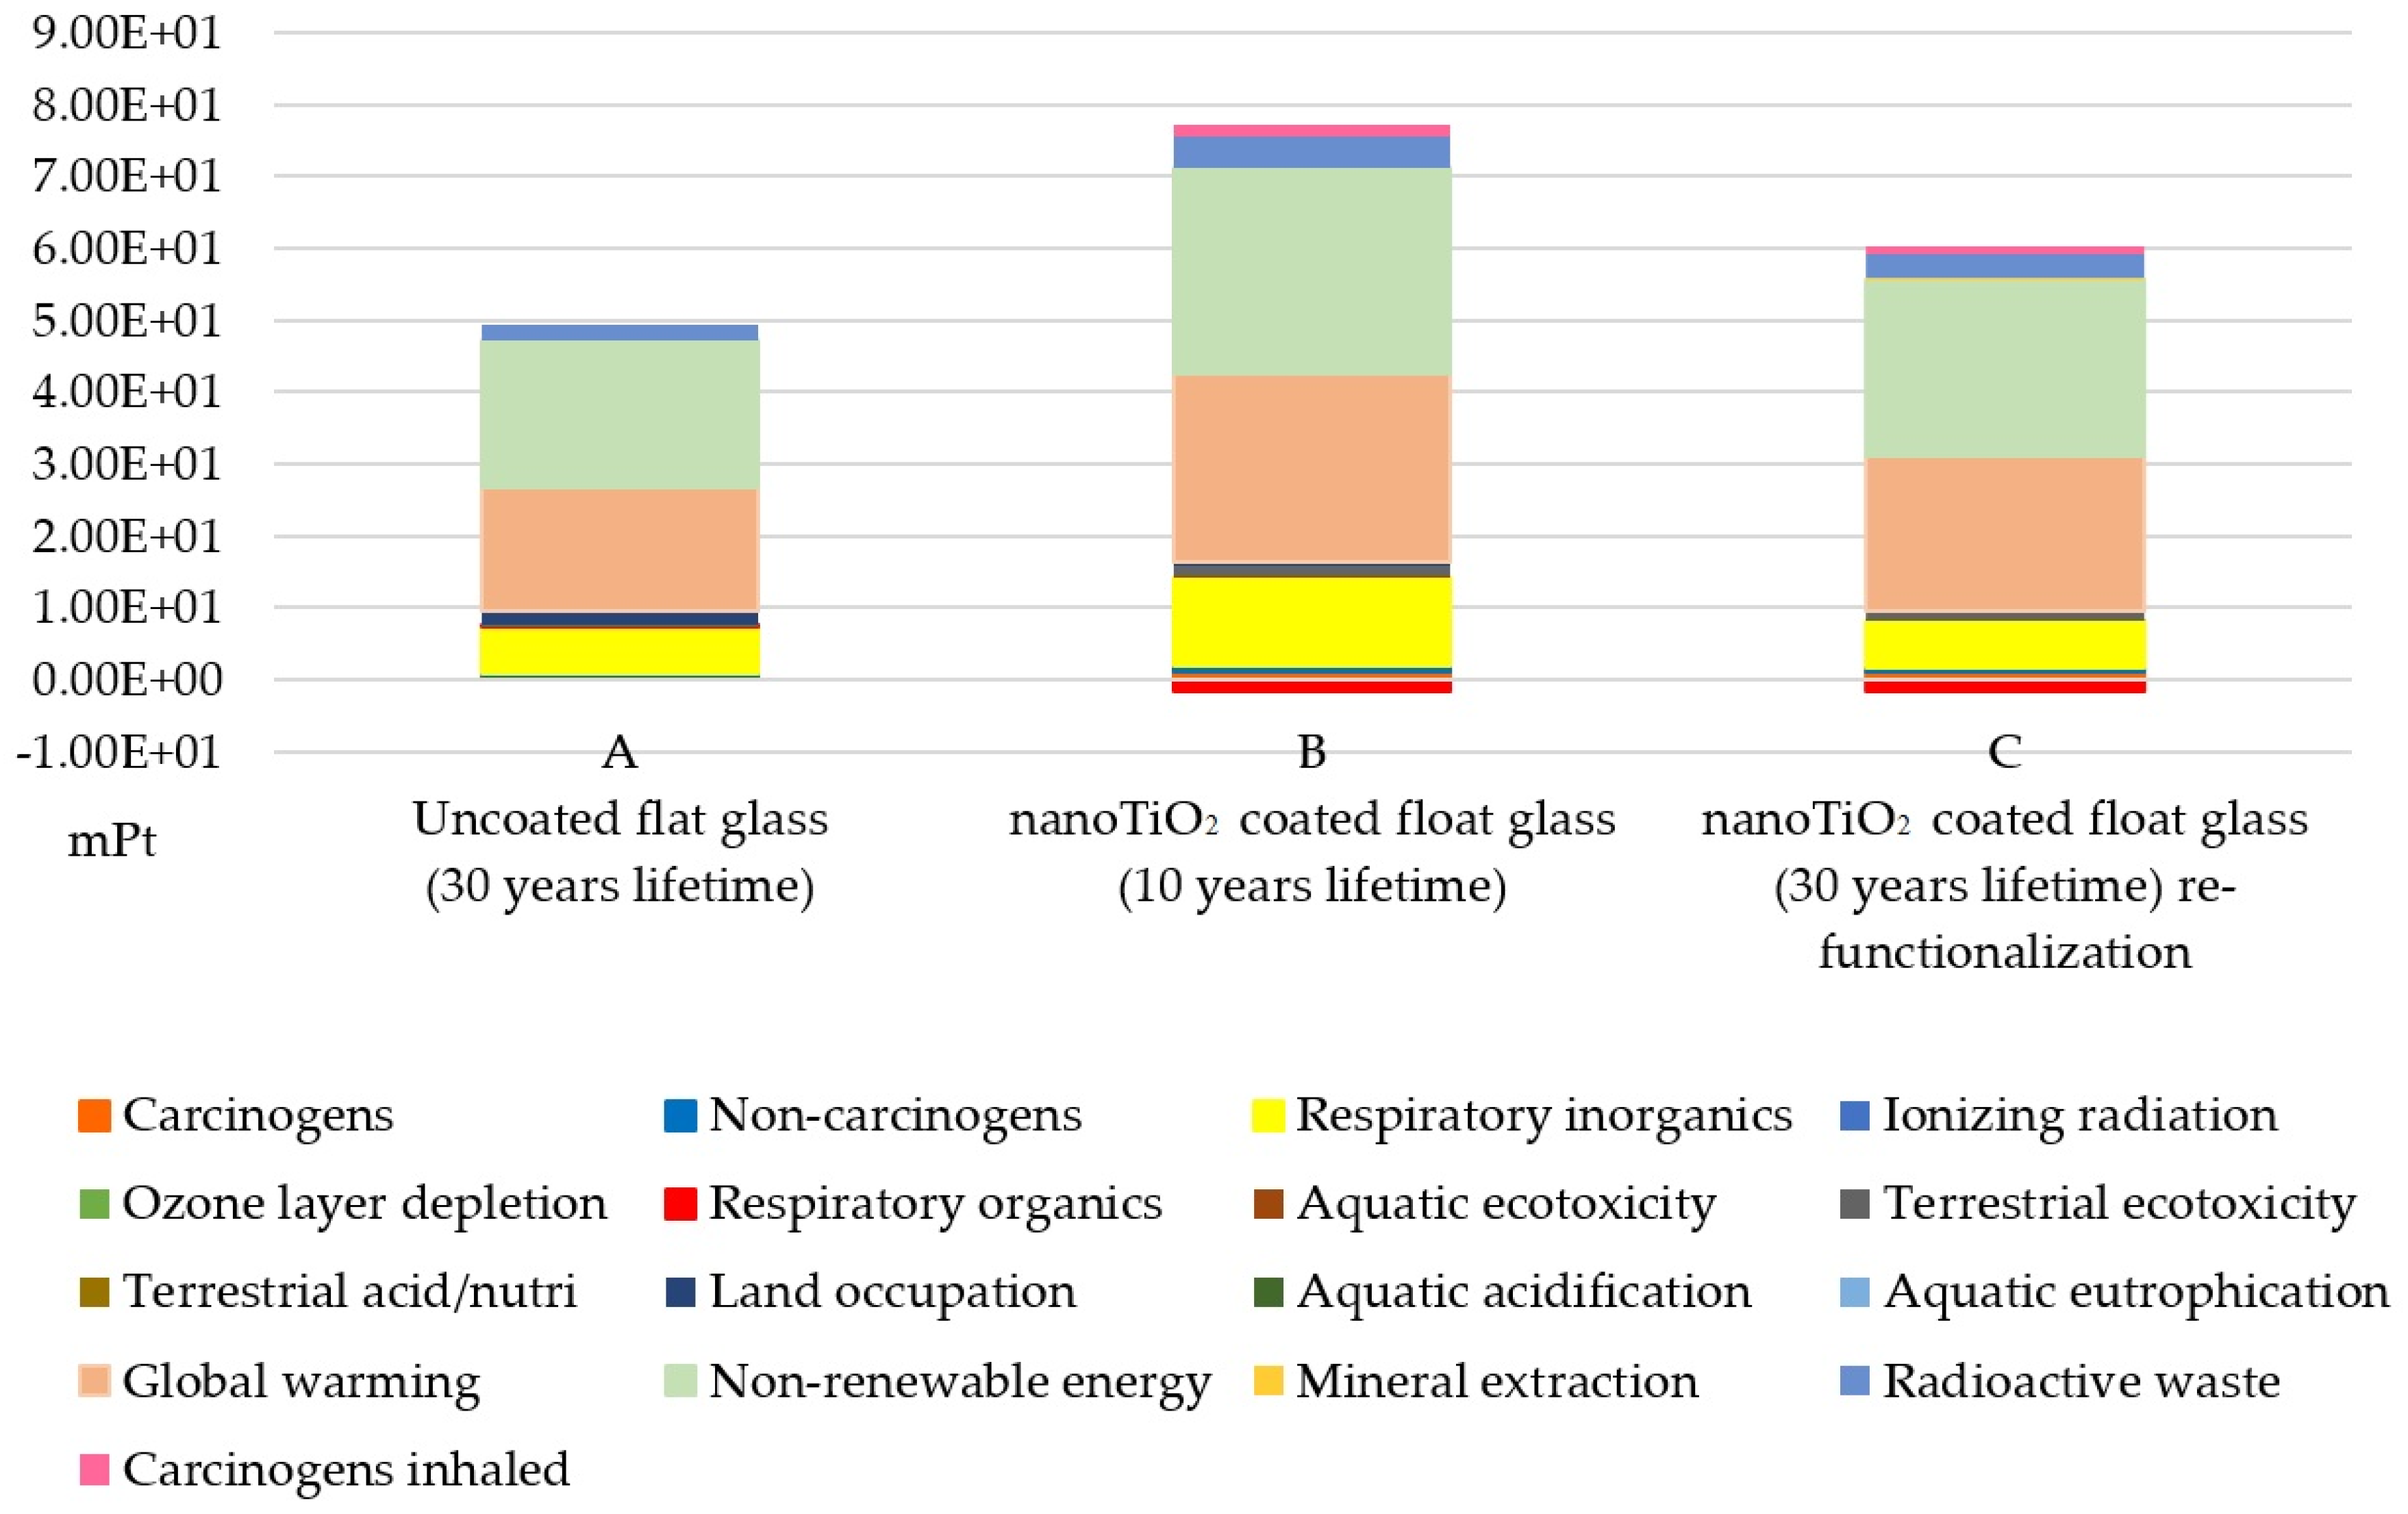
3.3. Comparison between the Environmental Performance NanoTiO2 Functionalized Float Glass and the Conventional Ones

Finally, the study analyzes the different environmental performances determined by the nanoTiO2 functionalized float glass (innovative building material) and a single float uncoated glass (conventional building material). For the latter building material, two different lifetime scenarios were considered. The first one considers that the float glass and the nanoTiO2 coating have the same lifetime (10 years) (it is assumed that after 10 years the nanocoating no longer produces benefits). The second one considers that the float glass lifetime is equal to 30 years and the nanoTiO2 coating lifetime equal to 10 years. Therefore, another two refunctionalization processes, after every 10 years, was needed in a period of 30 years. For both scenarios, the inertization process with concrete was taken into account as end-of-life treatment. The criteria followed to model the uncoated float glass are reported in the supplementary material (SM).
Figure 6 reports the LCIA results of the comparison, considering a lifespan of 30 years, among 1 m2 of uncoated flat glass (conventional material), 3 m2 of nanoTiO2 coated float glass (10 years lifetime) and 1 m2 of nanoTiO2 coated float glasses (30 years lifetime) to be refunctionalized twice (innovative materials). LCIA was here performed by the modified IMPACT 2002+ method. The detailed environmental comparison results and the single LCIA results per glass are reported in the SM.
NanoTiO2 functionalized float glass (scenario B) is the case study that produced the highest environmental damage (75.65 mPt), followed by scenario C (58.54 mPt) and finally scenario A (49.39 mPt). The impact categories that mainly determine the environmental loads on all analyzed case studies are Non-renewable energy, Global warming and Respiratory inorganics:
  • In the Non-renewable energy impact category, case B determines the higher impact (28.7 mPt on the total damage) mainly due to gas, natural, in-ground emission generated by electric energy manufacture in the production process of nanoTiO2 self-cleaning coated float glass;
  • In Global warming, case B determines the higher impact (26.09 mPt on the total damage) mainly due to carbon dioxide, fossil emission generated by natural gas production used in the use phase for air conditioning.
  • In Respiratory inorganics impact category, case B determines the higher impact (12.2 mPt on the total damage) mainly due to particulates <2.5 μm emission generated by the lapping process in the production stage. For innovative nanomaterials (case studies B and C), nitrogen oxide emissions in the air reduced by the photocatalytic activity of nanoTiO2 coating generated a reduction of environmental load in this category.
Finally, Figure 6 shows that the Respiratory organics impact category determines an environmental benefit of 1.65 mPt for both B and C scenarios, specifically the reduction of toluene (VOC) emissions into the air.

4. Conclusions

Although the total market for photocatalytic products is estimated to be at $3 billion by 2020, and the most used photocatalyst is nanoparticled TiO2, its ecological and human health risks are still under analysis. Therefore, in this work, the environmental sustainability of nanoTiO2 functionalized coated float glass was performed with the life cycle assessment methodology. An ecodesign approach was followed in order to make the most appropriate choices for minimizing environmental loads and protecting human health. In this context, an industrial scale-up of the coating production and its successive application on the float glass were studied.
The analysis of results illustrates the same trend for both modified IMPACT 2002+ and USEtox™ methods.
The highest environmental burden is found to be the production phase of the life cycle of nanoTiO2-functionalized coated float glass. IMPACT 2002+ determined that the main environmental load at this stage is due to the float glass manufacturing and acetic acid soaking processes. Furthermore, USEtox™ shows that the main environmental impact at the production stage is due to the steel used to produce the air filter.
An analysis of the benefits derived by nanoTiO2 application by the modified IMPACT 2002+ method reveal a moderate gain in reducing airborne pollutants during the use phase, i.e., toluene (−2.92 kg) and NOx (−9.3E−2 kg) emissions for the Respiratory organics and Respiratory inorganics impact categories, respectively. However, it is necessary to point out that the data related to the nanoparticle emissions in all life cycle stages are not up to date and are still unknown. Therefore, scientific effort must be made to obtain adequate life cycle inventory (LCI) data on these new materials in order to ascertain the real sustainability of nanoparticle coatings for outdoor application [24].
In particular, precautions such as installation of high efficiency particulate air filters, closed systems for the production stage, protective equipment, and special end-of-life treatment in addition to guideline recommendations on how to treat nanoproducts throughout their entire life cycle will limit nanoparticle emissions into the air and/or inhaled by humans. In fact, the TiO2 nanoparticles directly inhaled by humans is equal to 7.45E−07 kg and affects Carcinogens inhaled (modified IMPACT 2002+ method), Human toxicity, cancer and Human toxicity, non-cancer impact categories (modified USEtox™ method) especially during end-of-life treatment (68.76%). In regards to TiO2 nanoparticles released into the air, the quantity totals 7.26E−4 kg and influences Carcinogens (modified IMPACT 2002+ method), Human toxicity, cancer, indoor and Human toxicity, non-cancer, indoor impact categories (modified USEtox™ method), especially during the use phase, by 98.62%.
The LCIA performed by the IMPACT 2002+ method highlighted that the benefit derived from organic and inorganic emissions reduction counterbalances the negative impact of nanoTiO2 releases, differing by one order of magnitude. However, the limited negative effect of nanoTiO2 emissions depends on the safe choice defined following the ecodesign approach. Therefore, if these choices change, the results could also vary.
The present work implements two preliminary LCIA frameworks (ecoinvent 99 and USEtox™) determined to quantify the potential human toxicity of an engineered nanoparticle (nanoTiO2) using the LCA methodology [23,24].
The authors already discussed in Pini et al. [28,30] the limitations of applied LCIA frameworks. The fate module requires improvement by, for example, considering rate coefficients as descriptors for environmental fate processes. Moreover, as several gaps still exist in the toxicity assessment of nanomaterials, a database comprising the results of all the toxicological tests carried out thus far on these new materials is urgently required. As long as this data is unavailable, the effect analysis of these LCIA frameworks will suffer from lack of robustness. Therefore, the hereby presented environmental results must be updated as soon the weaknesses of the LCIA frameworks have been addressed. A future research step, then, might be the application of the preliminary human toxicity factors for nanoTiO2 to already-existing LCA case studies that include nanoTiO2 and that have not yet been investigated (i.e., functionalized building materials, synthesis processes, nanoparticle application, nanotechnologies production, etc.). The final aim is the validation of the preliminary LCIA frameworks for the assessment of human toxicity factors for nanoTiO2 through their application to concrete LCA case studies. This allows a comparison of the obtained environmental results and their subsequent optimization. Future steps would be to include more elaborate up-scaling schemes.
In conclusion, the comparison analysis between nanoTiO2 functionalized float glass and uncoated float glass showed that the latter building material causes higher environmental damage, mainly as a result of the higher solar factor value of uncoated glass compared to that of nanocoated glass.

Supplementary Materials

Supplementary materials are available online at https://www.mdpi.com/2079-6412/7/1/8/s1.

Acknowledgments

Authors thank the financial support of the “ARACNE e Laboratorio Integrato Sviluppo Tecnologie Avanzate Materiali Innovativi per Costruzioni Ecosostenibili” through the Italian regional program, “Dai distretti produttivi ai distretti tecnologici”.

Author Contributions

Martina Pini collected the data to carry out the life cycle inventory, performed the LCA study, implemented new toxicity factors for nanoTiO2 in the life cycle impact assessment, interpreted the environmental results and wrote the manuscript. Anna Maria Ferrari contributed to the analysis of outcomes and drafted the final discussion. Cristina Siligardi and Erika Iveth Cedillo-González designed the laboratory experimental methodology and contributed to the discussion of the results and the writing of the paper. Erika Iveth Cedillo-González prepared the nanoTiO2 functionalized float glass and performed the experiments, including the modified procedure for increasing the adhesion and the related tests.

Conflicts of Interest

The authors declare no conflict of interest and the founding sponsors had no role in the design of the study; in the collection, analyses, or interpretation of data; in the writing of the manuscript, and in the decision to publish the results.

References

  1. Fujishima, A.; Honda, K. Electrochemical photolysis of water at a semiconductor electrode. Nature 1972, 238, 37–38. [Google Scholar] [CrossRef] [PubMed]
  2. Ni, M.; Leung, M.K.H.; Leung, D.Y.C.; Sumathy, K. A review and recent developments in photocatalytic water-splitting using for hydrogen production. Renew. Sust. Energ. Rev. 2007, 11, 401–425. [Google Scholar] [CrossRef]
  3. Akhavan, O.; Ghaderi, E. Self-accumulated Ag nanoparticles on mesoporous TiO2 thin film with high bactericidal activities. Surf. Coat. Technol. 2010, 204, 3676–3683. [Google Scholar] [CrossRef]
  4. Chen, J.; Poon, C. Photocatalytic construction and building materials: From fundamentals to applications. Build. Environ. 2009, 44, 1899–1906. [Google Scholar] [CrossRef]
  5. Pichat, P. Self-cleaning materials based on solar photocatalysis. In New and Future Developments in Catalysis: Solar Photocatalysis; Suib, S.L., Ed.; Elsevier: Amsterdam, The Netherlands, 2013; pp. 167–190. [Google Scholar]
  6. Raibeck, L.; Reap, J.; Bras, B. Investigating environmental burdens and benefits of biologically inspired self-cleaning surfaces. CIRP J. Manuf. Sci. Technol. 2009, 1, 230–236. [Google Scholar] [CrossRef]
  7. Photocatalysts: Technologies and Global Markets; BCC Research Advanced Materials Report AVM069B. Available online: http://www.bccresearch.com/market-research/advanced-materials/photocatalysts-technologies-markets-report-avm069b.html (accessed on 3 September 2016).
  8. Som, C.; Berges, M.; Chaudhry, Q.; Dusinska, M.; Fernandes, T.F.; Olsen, S.I.; Nowack, B. The importance of life cycle concepts for the development of safe nanoproducts. Toxicology 2010, 269, 160–169. [Google Scholar] [CrossRef] [PubMed]
  9. Hsu, L.-Y.; Chein, H.-M. Evaluation of nanoparticle emission for TiO2 nanopowder coating materials. In Nanotechnology and Occupational Health; Springer: Berlin, Germany, 2007; pp. 157–163. [Google Scholar]
  10. United Nations Environment Programme (UNEP). Global Guidance Principles for Life Cycle Assessment Databases. A Basis for Greener Processes and Products; United Nations: Geneva, Switzerland, 2011. [Google Scholar]
  11. Hischier, R. Framework for LCI modelling of nanoparticle releases along the life cycle. Int. J. LCA 2014, 19, 838–849. [Google Scholar] [CrossRef]
  12. Hischier, R.; Salieri, B.; Pini, M. Most important factors of variability and uncertainty in an LCA study of nanomaterials – findings from a case study with nano titanium dioxide. IMPACT 2017. Submitted. [Google Scholar]
  13. Hischier, R.; Walser, T. Life cycle assessment of engineered nanomaterials: State of the art and strategies to overcome existing gap. Sci. Total Environ. 2012, 425, 271–282. [Google Scholar] [CrossRef] [PubMed]
  14. Gavankar, S.; Suh, S.; Keller, A.F. Life cycle assessment at nanoscale: Review and recommendations. Int. J. LCA 2012, 17, 295–303. [Google Scholar] [CrossRef]
  15. Gavankar, S.; Suh, S.; Keller, A.A. Life Cycle Assessment of Engineered Nanomaterials; Woodhead Publishing: Cambridge, UK, 2014. [Google Scholar]
  16. Upadhyayula, V.K.K.; Meyer, D.E.; Curran, M.A.; Gonzalez, M.A. Life cycle assessment as a tool to enhance the environmental performance of carbon nanotube products: A review. J. Clean Prod. 2012, 26, 37–47. [Google Scholar] [CrossRef]
  17. Kim, H.C.; Fthenakis, V. Life cycle energy and climate change implications of nanotechnologies. A critical review. J. Ind. Ecol. 2013, 17, 528–541. [Google Scholar] [CrossRef]
  18. Lazarevic, D.; Finnveden, G. Life cycle aspects of nanomaterials. In Environmental Strategies Research KTH; Royal Institute of Technology: Stockholm, Sweden, 2013. [Google Scholar]
  19. Miseljic, M.; Olsen, S.I. Life-cycle assessment of engineered nanomaterials: A literature review of assessment status. J. Nanopart. Res. 2014, 16, 1–33. [Google Scholar] [CrossRef]
  20. Eckelman, M.J.; Mauter, M.S.; Isaacs, J.A.; Elimelech, M. New perspectives on nanomaterial aquatic ecotoxicity: Production impacts exceed direct exposure impacts for carbon nanotoubes. Environ. Sci. Technol. 2012, 46, 2902–2910. [Google Scholar] [CrossRef] [PubMed]
  21. Deng, Y.; Li, J.; Qiu, M.; Yang, F.; Zhang, J.; Yuan, C. Deriving characterization factors on freshwater ecotoxicity of graphene oxide nanomaterial for life cycle impact assessment. Int. J. LCA 2016. [Google Scholar] [CrossRef]
  22. Salieri, B.; Righi, S.; Pasteris, A.; Olsen, S.I. Freshwater ecotoxicity characterisation factor for metal oxide nanoparticles: A case study on titanium dioxide nanoparticle. Sci. Total Environ. 2015, 505, 494–502. [Google Scholar] [CrossRef] [PubMed] [Green Version]
  23. Pini, M.; Salieri, B.; Ferrari, A.M.; Nowack, B.; Hischier, R. Human health characterization factors of nano-TiO2 for indoor and outdoor environments. Int. J. LCA 2016, 21, 1452–1462. [Google Scholar] [CrossRef]
  24. Pini, M. Life Cycle Assessment of Nano-TiO2 Functionalized Building Materials Extended to Historical Buildings. Ph.D. Thesis, University of Modena and Reggio Emilia, Modena, Italy, 2015. [Google Scholar]
  25. Bando “Dai Distretti Produttivi ai Distretti Tecnologici”—DGR n. 1631/2009. Available online: http://www.innovazionefinanza.it/2009/emilia-romagna-distretti-tecnologici/ (accessed on 9 January 2017).
  26. Ferrari, A.M.; Pini, M.; Neri, P.; Bondioli, F. Nano-TiO2 coatings for limestone: Which sustainability for cultural heritage? Coatings 2015, 5, 232–245. [Google Scholar] [CrossRef] [Green Version]
  27. Pini, M.; Gamberini, R.; Neri, P.; Rimini, B.; Ferrari, A.M. Life Cycle Assessment of a Self-Cleaning Coating Based on NanoTiO2-Polyurea Resin Applied on an Aluminum Panel. Available online: http://digidownload.libero.it/giabon/tesi/pini/pres_pini_LCAResinaPoliurea_con_nanoTiO2.pdf (accessed on 9 January 2017).
  28. Pini, M.; Bondioli, F.; Neri, P.; Montecchi, R.; Ferrari, A.M. Environmental and human health assessment of life cycle of nanoTiO2 functionalized porcelain stoneware tile. Sci. Total Environ. 2017, 577, 113–121. [Google Scholar] [CrossRef] [PubMed]
  29. Pini, M.; Rosa, R.; Neri, P.; Bondioli, F.; Ferrari, A.M. Environmental assessment of a bottom-up hydrolytic synthesis of TiO2 nanoparticles. Green Chem. 2015, 17, 518–531. [Google Scholar] [CrossRef]
  30. Pini, M.; Marinelli, S.; Gamberini, R.; Neri, P.; Rimini, B.; Ferrari, A.M. Life cycle assessment of a nano-TiO2 functionalized enamel applied on a steel panel. IJOQM 2016, 12, 478–485. [Google Scholar]
  31. Walser, T.; Demou, E.; Lang, D.J.; Hellweg, S. Prospective environmental life cycle assessment of nanosilver T-shirts. Environ. Sci. Technol. 2011, 45, 4570–4578. [Google Scholar] [CrossRef] [PubMed]
  32. Hischier, R. Life cycle assessment study of a field emission display television device. Int. J. LCA 2015, 20, 61–73. [Google Scholar] [CrossRef]
  33. Roes, A.L.; Tabak, L.B.; Shen, L.; Nieuwlaar, E.; Patel, M.K. Influence of using nanoobjects as filler on funtionality-based energy use of nanocomposites. J. Nanopart. Res. 2010, 12, 2011–2028. [Google Scholar] [CrossRef]
  34. Cedillo-González, E.I.; Montorsi, M.; Mugoni, C.; Montorsi, M.; Siligardi, C. Improvement of the adhesion between TiO2 nanofilm and glass substrate by roughness modifications. Phys. Procedia 2013, 40, 19–29. [Google Scholar] [CrossRef]
  35. Shibasaki, M.; Warburg, N.; Eyerer, P. Upscaling effect and life cycle assessment. In Proceedings of the 13th CIRP International Conference on Life Cycle Engineering, Leuven, Belgium, 31 May–2 June 2006.
  36. Gavankar, S.; Suh, S.; Keller, A.A. The role of scale and technology maturity in life cycle assessment of emerging technologies—A case study on carbon nanotubes. J. Ind. Ecol. 2015, 19, 51–60. [Google Scholar] [CrossRef]
  37. Caduff, M.; Huijbregts, M.A.J.; Althaus, H.-J.; Koehler, A.; Hellweg, S. Wind power electricity: The bigger the turbine, the greener the electricity? Environ. Sci. Technol. 2012, 46, 4725–4733. [Google Scholar] [CrossRef] [PubMed]
  38. Arvidsson, R.; Kushnir, D.; Molander, S.; Sandén, B.A. Energy and resource use assessment of graphene as a substitute for indium tin oxide in transparent electrodes. J. Clean. Prod. 2016, 132, 289–297. [Google Scholar] [CrossRef]
  39. Li, Q.; McGinnis, S.; Sydnor, C.; Wong, A.; Renneckar, S. Nanocellulose life cycle assessment. ACS Sustain. Chem. Eng. 2013, 1, 919–928. [Google Scholar] [CrossRef]
  40. Product Ecology Consultants (PRè). SimaPro database manual—Methods library. Available online: http://discounthardware.us/read-online/download-now/simapro-database-manual-methods-library.pdf (accessed on 4 January 2017).
  41. Life Cycle Inventories, Ecoinvent Database v. 2.0. Available online: http://www.ecoinvent.ch (accessed on 12 December 2010).
  42. Demeestere, K.; Dewulf, J.; De Witte, B.; Beeldens, A.; Van Langenhove, H. Heterogeneous photocatalytic removal of toluene from air on building materials enriched with TiO2. Build. Environ. 2008, 43, 406–414. [Google Scholar] [CrossRef]
  43. Klöpffer, W.; Curran, M.A.; Frankl, P.; Heijungs, R.; Köhler, A.; Olsen, S.I. Nanotechnology and Life Cycle Assessment. A Systems Approach to Nanotechnology and the Environment. In Proceedings of the Nanotechnology and Life Cycle Assessment Workshop, Washington, DC, USA, 2–3 October 2006.
  44. BS EN 149:2001+A1:2009 Respiratory Protective Devices. Filtering Half Masks to Protect against Particles. Requirements, Testing, Marking; British Standards Institution (BSI): London, UK, 2011.
  45. General Programme Instructions for Environmental Product Declarations EPD, the International EPD Cooperation, version 1.0. Available online: http://www.environdec.com/en/The-International-EPD-System/General-Programme-Instructions/ (accessed on 9 January 2017).
  46. Jolliet, O.; Margni, M.; Charles, R.; Humbert, S.; Payet, J.; Rebitzer, G.; Rosenbaum, R. IMPACT2002+: A new life cycle impact assessment methodology. Int. J. LCA 2003, 8, 324–330. [Google Scholar] [CrossRef]
  47. USEtox™ (2016), User Manual. Available online: http://www.usetox.org/support/tutorials-manuals (accessed on 23 March 2016).
  48. Baldi, G.; Bitossi, M.; Barzanti, A. Method for the Preparation of Aqueous Dispersions of TiO2 in the Form of Nanoparticles, and Dispersions Obtainable with This Method. U.S. Patent 20080317959A1, 25 December 2008. [Google Scholar]
  49. Fujishima, A.; Rao, T.N.; Tryk, D.A. Titanium dioxide photocatalysis. J. Photoch. Photobio. C 2000, 1, 1–21. [Google Scholar] [CrossRef]
  50. IGEL (Initiative for Global Environmental Leadership), Making the Transition to a Low-Carbon Economy. Available online: http://knowledge.wharton.upenn.edu/special-report/making-the-transition-to-a-low-carbon-economy/ (accessed on 20 December 2016).
Figure 1. Flow chart of nanoTiO2 (titanium dioxide) self-cleaning coated float glass.
Coatings 07 00008 g001
Figure 2. Evaluation by single score of 1 m2 of nanoTiO2 self-cleaning coated float glass.
Coatings 07 00008 g002
Figure 3. Weighted results by impact categories of 1 m2 of nanoTiO2 self-cleaning coated float glass.
Coatings 07 00008 g003
Figure 4. Environmental comparison between 1 m2 of nanoTiO2 self-cleaning coated glass using electric energy mix and 1 m2 of nanoTiO2 self-cleaning coated glass using renewable energy source.
Coatings 07 00008 g004
Figure 5. Environmental profile of 1 m2 of nanoTiO2 self-cleaning coated float glass (characterization results).
Coatings 07 00008 g005
Figure 6. LCIA comparison by single score of 1 m2 of conventional uncoated flat glass (conventional material) and 1 m2 of nano-TiO2 functionalized coated float glasses (innovative materials).
Coatings 07 00008 g006
Table 1. Inventory data of 1 m2 of nanoTiO2 self-cleaning coated float.
CategoryComponentsQuantityUnitSource
Energy inputElectricity consumption244.4kWhEnergetic process I/O data derived from ecoinvent database. Energy consumptions were supplied by the chemical lab and scaled up with linear rate
Materials I/OFloat glass uncoated9.91kgData supplied by the chemical lab and scaled up with linear rate and Colorobbia Italia SpA. for nanoTiO2 suspension
Tap water52.77L
Acetone263.33kg
Acetic acid4.37kg
Water deionized2.39kg
Compressed air423.33L
nanoTiO2 suspension5.84E−03kg
Protection film (LDPE)1.92E−02kgData was supplied by one of the company leaders in glass production
Viscose fiber cloth0.13kg
Concrete0.24m3
Heat gain in summer season due to nanocoating825.2kWData supplied by the chemical lab and scaled up with linear rate
Heat lost in winter season due to nanocoating754.13333kW
Emissions to airParticulates <2.5 µm1.43E−02kgData supplied by the chemical lab and scaled up with linear rate
Particulates >10 µm2.61E−02kg
Particulates >2.5 µm and <10 µm6.53kg
Acetic acid7.20E−02kg
Water1.29E−02kg
Acetone3.31E−06kg
Particulates <100 nm in air6.67E−03kg
Particulates <100 nm inhaled0.75kg
NOx1.17E−01kg
Nitric acid2.40E−04kg
Toluene92E−03kg
CO23.92E−02kg
TransportsRoad85.49tkm
Waste to treatmentDisposal to residual landfill of nanoTiO2 particulates captured by filter4.01E−04gWaste quantities were given from the chemical lab while waste treatment statistics were derived from the ecoinvent process
Acetone wastes captured by filter to residual landfill5.05E−03cm3
Acetic acid wastes captured by filter to residual landfill4.33kg
Wastewater treatment (water used during the maintenance operations of equipment)52.77L
Disposal of particulates <2.5 µm and >10 µm dust captured by filter to residual landfill1248.21g
Disposal waste glass (inertization)8.04kgEnd of life of functionalized glass was built ad hoc according to ecodesign approach. Data were appropriately assumed
Table 2. Characterized LCIA results of 1 m2 of nanoTiO2 self-cleaning coated (IMPACT 2002+ Method).
Impact CategoryUnitTotalProductionInstallationUse PhaseEnd of Life
Carcinogenskg C2H3Cl eq6.35E−012.33E−033.37E−011.99E−026.35E−01
Non-carcinogenskg C2H3Cl eq6.14E−013.02E−035.15E−024.30E−026.14E−01
Respiratory inorganicskg PM2.5 eq4.60E−023.58E−04−8.27E−033.11E−034.60E−02
Ionizing radiationBq C-14 eq8.20E+024.17E+001.88E+026.35E+018.20E+02
Ozone layer depletionkg CFC-11 eq7.75E−061.01E−076.14E−063.51E−077.75E−06
Respiratory organicskg C2H4 eq2.13E−022.78E−04−1.86E+002.69E−032.13E−02
Aquatic ecotoxicitykg TEG water5.46E+033.58E+019.13E+022.31E+025.46E+03
Terrestrial ecotoxicitykg TEG soil5.88E+028.05E+001.10E+026.83E+015.88E+02
Terrestrial acid/nutrikg SO2 eq7.76E−019.62E−03−4.79E−016.78E−027.76E−01
Land occupationm2org.arable5.31E−015.64E−035.08E−011.84E+005.31E−01
Aquatic acidificationkg SO2 eq2.29E−011.62E−038.40E−021.24E−022.29E−01
Aquatic eutrophicationkg PO4 P-lim7.15E−032.69E−051.58E−033.43E−047.15E−03
Global warmingkg CO2 eq4.26E+012.43E−014.03E+012.97E+004.26E+01
Non-renewable energyMJ primary8.31E+024.44E+005.83E+023.39E+018.31E+02
Mineral extractionMJ surplus2.87E+005.98E−031.89E−018.30E−022.87E+00
Radioactive wastekg3.76E+011.73E−017.59E+006.47E+013.76E+01
Carcinogens inhaledkg1.10E−033.82E−062.23E−048.17E−051.10E−03
TotalmPt (milli-point)2.522E+011.641E+011.700E−017.100E+001.534E+00
Table 3. LCIA results at end-point level of 1 m2 of nanoTiO2 self-cleaning coated float glass.
Damage CategoryUnitTotalProductionInstallationUse PhaseEnd of Life
Human healthDALY2.99E−053.59E−052.67E−07−8.61E−062.37E−06
Ecosystem qualityPDF·m2·year9.99E+006.31E+008.17E−029.72E−012.63E+00
Climate changekg CO2 eq8.61E+014.26E+012.43E−014.03E+012.97E+00
ResourcesMJ primary1.46E+038.34E+024.44E+005.83E+023.40E+01
Radioactive wastekg1.10E+023.76E+011.73E−017.59E+006.47E+01
Carcinogens inhaledDALY1.41E−031.10E−033.82E−062.23E−048.17E−05
Table 4. Environmental comparison between 1 m2 of nanoTiO2 self-cleaning coated glass using electric energy mix and 1 m2 of nanoTiO2 self-cleaning coated glass using renewable energy sources.
Impact CategoryUnitNanoTiO2 Self-Cleaning Coated (Electric Energy Mix)NanoTiO2 Self-Cleaning Coated (Renewable Energy Source)
Carcinogenskg C2H3Cl eq9.95E−017.36E−01
Non-carcinogenskg C2H3Cl eq7.11E−018.78E−01
Respiratory inorganicskg PM2.5 eq4.12E−023.04E−02
Ionizing radiationBq C-14 eq1.08E+031.08E+03
Ozone layer depletionkg CFC-11 eq1.43E−058.42E−06
Respiratory organicskg C2H4 eq−1.83E+00−1.84E+00
Aquatic ecotoxicitykg TEG water6.64E+036.37E+03
Terrestrial ecotoxicitykg TEG soil7.75E+027.46E+02
Terrestrial acid/nutrikg SO2 eq3.74E−017.79E−02
Land occupationm2org.arable2.89E+002.69E+00
Aquatic acidificationkg SO2 eq3.27E−012.40E−01
Aquatic eutrophicationkg PO4 P-lim9.11E−031.14E−02
Global warmingkg CO2 eq8.61E+014.45E+01
Non-renewable energyMJ primary1.45E+036.76E+02
Mineral extractionMJ surplus3.15E+003.89E+00
Renewable energyMJ1.10E+026.87E+02
Radioactive wastekg1.41E−031.40E−03
Carcinogens inhaledkg7.45E−077.45E−07
TotalmPt (milli-point)2.522E+011.475E+01
Table 5. Characterized LCIA results of 1 m2 of nanoTiO2 self-cleaning coated float glass.
Impact CategoryUnitTotalProductionInstallationUse PhaseEnd of Life
Human toxicity, cancerCTUh #4.401E−063.692E−061.497E−085.65E−071.297E−07
Human toxicity, non-cancerCTUh #1.565E−071.261E−076.657E−102.297E−086.797E−09
EcotoxicityCTUe §46.23670238.6660710.14889136.04684041.3748995
Human toxicity, cancer, indoorCTUh #1.066E−086.344E−141.256E−092.073E−097.327E−09
Human toxicity, non-cancer, indoorCTUh #4.359E−132.595E−185.139E−148.479E−142.997E−13
# CTUh = cases/kgemitted; § CTUe = PAF·m3·year.

