
Study on the Formation of Reaction Phase to Si Addition in Boron Steel Hot-Dipped in Al–7Ni Alloy

1
Department of Hybrid Materials & Machining Technology, Graduate School of Convergence Science, Pusan National University, Busan 46241, Korea
2
Department of Material Science and Engineering, Pusan National University, Busan 46241, Korea
*
Author to whom correspondence should be addressed.
Coatings 2017, 7(11), 186; https://doi.org/10.3390/coatings7110186
Submission received: 17 October 2017
/
Revised: 30 October 2017
/
Accepted: 2 November 2017
/
Published: 4 November 2017
(This article belongs to the Special Issue Innovative Coatings for Automotive Industry)
Abstract
:In order to reduce the intermetallic compounds formed during the application of an Al–7Ni wt % hot-dip multifunctional coating on boron steel, developed for Tailor Welded Blanks (TWB) and hot stamping, 2–6 wt % Si was added to the coating to change the reaction layer. The coating was run at 690 °C for 120 s. Al9FeNi phases were formed on the steel interface, Fe2Al5 was formed on the steel, FeAl3 was generated between the existing layers, and flake-type Al2Fe3Si3 was formed in the Fe2Al5 phase, depending on the Si content. In addition, as Si was added to the coating, the thickness of the Fe2Al5 phase decreased and the thickness of the Al9FeNi phase and Al2Fe3Si3 increased. The decrease in the thickness of the Fe2Al5 phase was mainly due to the effect of the Si solid solution and the Al2Fe3Si3 formation in the Fe2Al5 phase. The reason for the growth of Al9FeNi is that the higher the Si content in the coating, the more the erosion of the interface of the steel material due to the coating solution. Therefore, the outflow of Fe into the coating liquid increased.
1. Introduction
In recent years, automobile manufacturers have applied Tailor Welded Blanks (TWB) and hot-stamping, which combines Al–Si coated high strength boron steel and low strength steel or thinner thickness boron steel using a laser to achieve more light-weight structures and increased collision stability [1,2,3,4,5]. However, in the TWB and hot-stamping process of Al–Si coated boron steel, problems arise because fracture occurs in the FeAl intermetallic compound (IMC) and the ferrite generated due to dissolution of the Al–Si coating layer near the melting boundary. This causes the tensile strength and the collision characteristics to degrade [6,7,8,9]. To solve this problem, various previous studies have developed the Al–7Ni wt % multifunctional coating [10]. It is based on the Al–Ni coating, which is known to have a higher oxidation resistance at high temperatures compared to Al coating [11], and an appropriate amount of austenite stabilizing element is added to the coating to prevent ferrite and Fe–Al-type IMC formation.
However, in the newly developed Al–7Ni wt % hot-dip coating, the Fe2Al5 (η) phase is produced thickly, and is known to cause poor coating adhesion and cracking. Therefore, in order to commercialize the Al–7Ni wt % hot-dip coating of boron steel, a method of reducing the Fe2Al5 (η) phase produced by a coating application is required.
There are many previous studies on the reduction of the η phase in Al coatings, as discussed below. In the study of Eggeler, G. et al. [12], the researchers tried to reduce the η phase, which is often generated when pure iron is coated on pure Al. In this investigation, the growth of the η phase was lowered by adding Si, up to 2 wt % to the Al melt. However, the results obtained in this study have an η phase of more than 50 μm with a coating layer of several hundred micro-microns, which is well above the 20 µm generally known as the right coating thickness. Therefore, the addition of 2 wt % Si has an effect of η phase reduction, but it is not enough to achieve the appropriate level of performance. In another case, Lemmens, B. et al. [13] studied Al hot-dipping with different amounts of Si. In this study, it was shown that the η phase was steadily reduced from 1 wt % Si to 10 wt % Si. Subsequently, the new τ1, τ5 phases are also generated inside the η phase. It was also found that as the amount of Si addition increases, the τ1 and τ5 phases become thicker, and thus the η phase decreases.
In our previous studies, two main reasons for the reduction of the η phase growth by addition of Si in Al hot-dip coating were discussed. First, the Si addition has a structural effect on the vacancy that exists inside the η phase, which interferes with the diffusion of Al and changes the growth condition of the η phase, thereby delaying the growth [12,13,14,15]. Second, the new τ1, τ5 phases produced by Si addition seems to affect the diffusion of Al [13,14]. However, there is no study on the application of this theory to coatings with Al–Ni–Si ternary composition.
Therefore, in this study, when the Si content added to the Al–7Ni wt % multifunctional coating is changed, phase identification is performed and the phase growth mechanism is studied. The coatings are designed in consideration of the weldability. We also investigate whether the effect of reducing the η phase due to Si addition occurs, and what causes this phenomenon.
2. Materials and Methods
The steel used in this study was 1.2 mm thick boron steel (SABC1470 grade). It has the chemical composition shown in Table 1. It was cut into 40 mm × 120 mm specimens, washed with a solution containing 40 mL of H2SO4 and 200 mL of CH3OH for 300 s, and then washed with ethanol to completely remove the acidic solution.
The alloy composition for coating was prepared by adding 7 wt % of high purity Ni Alloy (99.99 wt %) to high purity Al Alloy (99.99 wt %). In addition, 99.99 wt % of high purity Si was added in the composition range of 1–6 wt % Si to prepare a coating alloy. Then, it was dissolved in a medium frequency inductor and homogenized by stirring. When the temperature of the molten metal was 690 °C, the boron steel was hot-dipped in the molten metal for 120 s to prepare the coating.
Before coating, the specimens were preheated at 150 °C for 15 s to remove the water on the surface and to improve the wettability of the coating. After coating, the specimen was cooled in air.
The coated specimens were cut into pieces measuring 10 mm × 10 mm in the rolling direction, and then the surface was polished using SiC sand paper, 1 µm diamond, and 0.04 µm silica. The specimens for Olympus (Tokyo, Japan) BX51M optical microscope (OM) and field-emission electron microscope observations (FE-SEM, Carl Zeiss, Oberkochen, Germany) were etched with a mixture of 1 mL of HF and 49 mL of distilled water, in accordance with ASTM B487-85 [16] the observations were performed using an Olympus (Tokyo, Japan) BX-51M optical microscope (OM) and a Carl Zeiss (Oberkochen, Germany) SUPRA45 field-emission scanning electron microscope (FE-SEM). The surface analysis of the chemical composition distribution was performed in a non-etching specimen using a JEOL (Tokyo, Japan) JXA-8530F field-emission electron-probe micro analyzer (FE-EPMA) at a voltage of 1 kV and current of 100 nA, with step sizes of 0.1–0.5 µm. The quantitative chemical composition on the coating was measured by EDAX (Mahwah, NJ, USA) energy-dispersive spectroscopy (EDS).
The FEI (Hillsboro, OR, USA) Scios focused ion beam (FIB) was used to prepare specimens for the phase analysis of micro-domains around the coating and the steel interface. The conditions for extracting the specimens were as follows: Pt was coated on the surface, and a specimen was extracted by adjusting the voltage between 2 and 30 kV and the current between 50 pA and 0.3 nA using a gallium source. For the phase analysis of the coating with a large area using a Rigaku (Tokyo, Japan) Ultima IV X-ray diffractometer, analytical conditions of 1°·min−1 were used with a voltage of 40 kV and current of 40 mA. To analyze the phase near the reaction layer of the coating and the base metal, the FIB specimens were examined through the qualitative and quantitative chemical composition and diffraction patterns obtained by an FEI (Hillsboro, OR, USA) TALOS F200X field-emission transmission electron microscope (FE-TEM) and FEI Super EDS at 200 kV, and a camera length of 840 mm for the diffraction patterns. Using the FEI (Hillsboro, OR, USA) TIA image analysis program and the ICDD (Newtown Square, PA, USA) card, the images were identified using the inter-planar distance (d) and the angles between the diffraction patterns were measured. Additional image analysis (e.g., image length) was carried out by the Media Cybernetics (Rockville, MD, USA) Image-plus pro image analysis program.
3. Results
3.1. Classification of Microstructure of Coating Layer and Reaction Layer in Al–7 wt % Ni–xSi Hot Dipping
Figure 1 shows the optical microscopic structure of the specimens coated at 690 °C for 120 s and coated with different contents of 0–6 wt % Si. As shown at the side of Figure 1e, the coating layer has three layers: a pure coating layer “C”, excluding the steel structure; “R1” existing toward the “C” layer from the original surface of the steel; and “R2” existing toward the steel in the opposite direction. This is valid in specimens of all conditions. However, it can be seen that the thickness of each layer varies as the Si is added in the range of 1–6 wt %. In particular, it can be confirmed that the thickness of the R2 layer is greatly reduced according to the amount of Si added. The next finding is that the thickness of the R1 layer gradually increases due to the addition of 2 wt % Si (Figure 1c) until the addition of 6 wt % Si (Figure 1e). In addition, the formation of a small flake phase in the R2 layer can be observed in the 2 wt % Si (Figure 1c) addition specimen, and more flake phases can be observed in Figure 1d,e, where the added amount of Si is larger. In the C layer of the coating, small gray phases start to appear from the 2 wt % Si (Figure 1c) added specimen. Here, the larger the Si content, the larger the size and observation frequency.
Figure 2 shows the FE-SEM microstructure of hot-dipped coated specimens under the same conditions as Figure 1, and Table 2 shows the results of EDS analysis of each point in Figure 2. The C layer at the top of (a) (the specimen without Si) was analyzed first. When analyzing the SEM image together with the EDS results in Table 1, and associating the previous study results [11] together, the following results are obtained. No. 1-1 is the primary Al, which is the solidification structure of the Al–7Ni wt % coating layer; No. 2-1 is the primary Al3Ni; and No. 3-1 is the eutectic structure (αAl + Al3Ni). As the amount of Si was increased to 1–6 wt %, the chemical composition was Nos. 2-2, 2-3, 2-4 with phase similar to the primary Al3Ni (No. 2-1). In addition, Nos. 3-2, 3-3, 3-4 have similar composition to the eutectic structure (αAl + Al3Ni), and the phase (No. 3-1) is gradually increased in size. In Figure 1, the phase found in the “C” layer is shown in the gray color, and is a small phase containing Al and Si as determined by the EDS analysis. This phase is found in the specimen with 2–6 wt % Si. However, according to the Al–Si binary phase diagram [17], Si exists on the Al base as there is no intermediate phase between Al and Si. In Figure 2a, the Si-free specimen, the R1 layer (No. 4-1) existing between the C layer and the steel structure (S) was formed on the surface of the base material as seen in previous research results [10]. It is suggested that the Al9FeNi (T) phase is formed by the reaction. In Figure 2b–d the remaining specimen (with Si added) are shown. The composition of the R1 phase is shown as Nos. 4-2, 4-3, 4-4. These were compared with the T phase. The compositions of Nos. 4-2 and 4-3 are almost identical as those of No. 4-1, which is the composition of the R1 in the Si-free sample. However, the composition of No. 4-4 shows a somewhat larger content of Si than that of No. 4-1. The R2 (No. 5-1) in Figure 2a is the Fe2Al5 (η) intermetallic compound, which is a reaction layer made by diffusion of Al. This layer is a coating composition to the base metal as observed from the previous research results [10], SEM images, and EDS component analyses. This is compared with the chemical compositions of the R2 layer of the Si-added specimens: Nos. 5-3, 5-4, 5-5. They have a composition similar to those of Nos. 5-1 and 5-2, which are R2 compositions of the specimen where no Si was added. However, the content of the Si in these phases tends to increase from 1 at % to 4 at %. On the other hand, the composition of the flakes formed in the R2 layer (shown in Figure 2c) was analyzed for the specimen containing 2 wt % Si. This is shown as Nos. 7-1, 7-2. It can be observed that both phases are composed of Fe, Al, and Si. The OM image analysis shows that Si is observed more often as the amount of Si is increased. In order to know the exact phase identification of these phases, a relatively large coating layer (C) and a very small reaction layers (R1, R2, etc.) were separated and analyzed.
3.2. Identification of Phases on Pure Coating Layers Depending on Various Levels of Si Addition in Coating Compositon
Figure 3 shows the results of XRD analysis of the C layer, which is a pure coating according to the amount of Si added. Al and Al3Ni were detected only in the Al–7 wt % Ni coating layer where no Si was added. However, a peak of Si (Fd3-m) appeared from the addition of 2 wt % Si. When 6 wt % Si is added, the peak of Si (Fd3-m) is slightly increased. This is consistent with the fact that in the preceding Figure 1 and Figure 2, the larger the amount of Si added, the more gray phases that appeared. In summary, these results indicate that the Si phase (gray phase) present on the Al matrix found in the C layer is Si (Fd3-m).
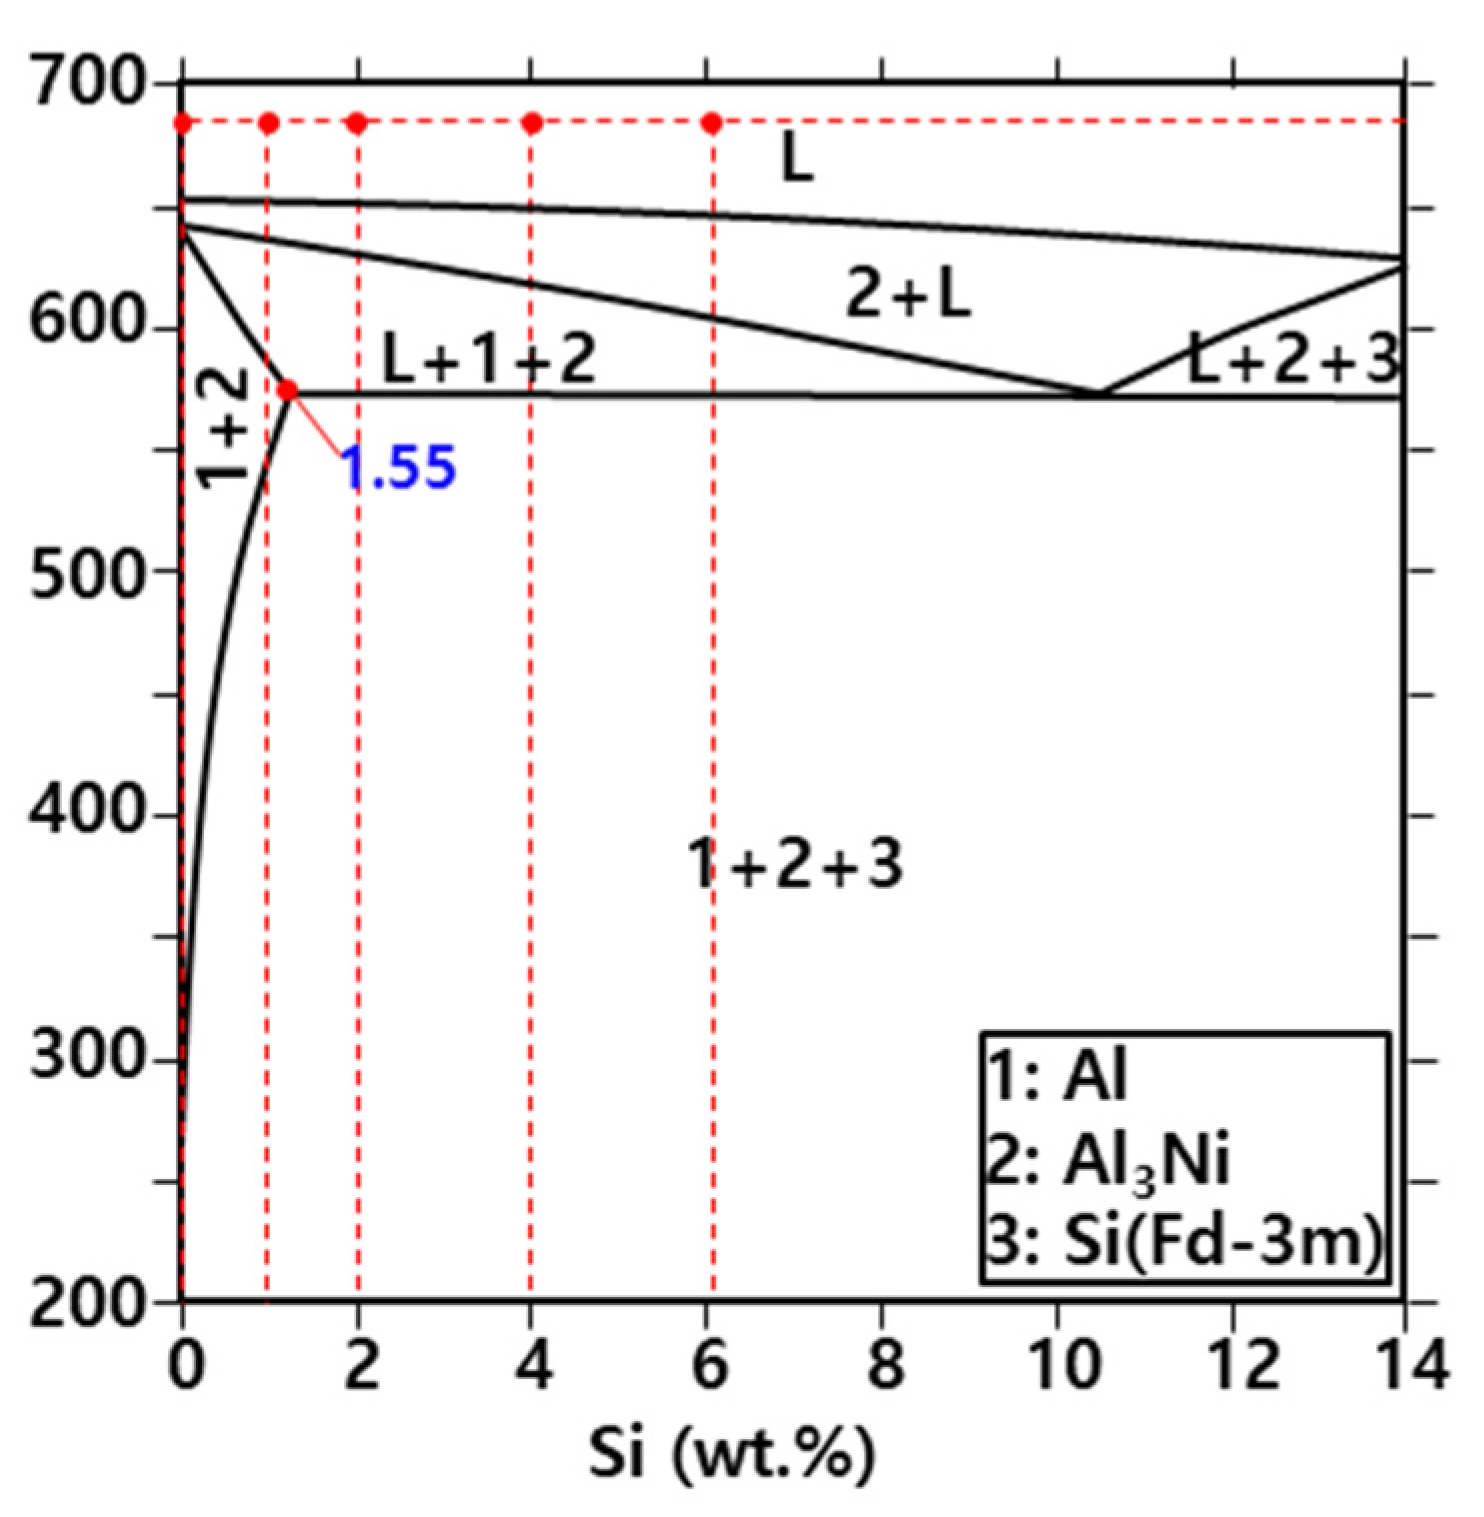
Figure 4 shows the portion of the (Al–7 wt % Ni)–xSi quasi-binary total phase diagram calculated by Thermo-Calc™ (Ver.6). The pure coating layer of Al–7Ni wt % consists of Al + Al3Ni. In the case of the 1 wt % Si added coating, the primary Al3Ni is crystallized in the vicinity of 645 °C in the liquid phase initially during continuous cooling. This is immediately followed by primary Al and eutectic structures (Al + Al3Ni). At around 575 °C, the phase consists of primary Al + primary Al3Ni + eutectic structure (Al + Al3Ni). At this time, the amount of Si that can be employed in the phase structure is 1.55 wt %, which is the same amount of Si that can be maximally soluble at 575 °C in the Al–Si binary phase diagram [17]. Therefore, 1 wt % of added Si is dissolved in the Al matrix, and this appears to be precipitated during the cooling. On the other hand, in the case of Si containing 2 wt % to 6 wt % of Si added to the coating, the primary Al3Ni is crystallized at around 645 °C and grows to some extent. During continuous cooling, the primary Al + eutectic structure (Al + Al3Ni) is crystallized at around 630–610 °C depending on the amount of Si in the coating liquid phase. Subsequently, the Si that has been melted in the liquid phase is crystallized at approximately 573 °C, and finally exists as a combination of phases of the primary Al + primary Al3Ni + eutectic structure (Al + Al3Ni) + Si (Fd3-m). However, as the amount of Si is increased, the area of the phase diagram from the formation of the primary Al3Ni line to the next crystallized phase line is widened. Therefore, as the amount of Si added increases from 1 wt % to 6 wt %, the rod-shaped primary Al3Ni gradually increases and the point-shaped eutectic Al3Ni decreases. The result of this phase diagram is shown in Figure 1 and Figure 2, respectively.
3.3. Identification of Phases on Reaction Layers Depending on Various Levels of Si Addition in Coating Composition
Figure 5a shows the specimen with 2 wt % Si added to the Al–7Ni wt % coating composition. Figure 5g shows the specimen with 6 wt % Si added to the coating composition, the representative microstructure near R1, and the reaction layer of these specimens as the BSE (Back-scattered Electron) image of FE-EPMA. Figure 5b–f,h–l shows the compositional distributions of Al, Ni, Si, Fe, and C, respectively, as a result of the surface analysis on the composition of the FE-EPMA. As to the constituent elements and concentrations of R1 and R2, a comparison was made between the 2 wt % Si addition specimen and the 6 wt % Si addition specimen. Basically, irrespective of the amount of Si in the coating, R1 has a higher Al concentration, lower Fe concentration, and more Ni than R2. Conversely, R2 is practically free of Ni. The FE-EPMA analysis results are the same as those of the previous EDS analysis. It is observed that R1 is a compound of Al–Ni–Fe and R2 is a compound of Al–Fe. On the other hand, when 2 wt % Si is added, there is hardly any Si in the R1 layer. However, it can be seen that there is a trace amount of Si in the R1 layer of the 6 wt % Si added specimen. The concentration of Si in the R2 layer itself is similar to that of the 2 wt % Si specimen and the 6 wt % added specimen. However, the amount of flake phases present in the R2 layer in both specimens is much greater in the 6 wt % Si specimen. The Si concentration in the flake phases is higher than that in the surrounding R2 layer. Therefore, we can see that the Si content in the R1 and flake phases are different. In the case of the C-rich region that exists at the line between the R2 layer and the base material of the steel, Figure 5f clearly shows in the specimen with 2 wt % Si added. However, it is hardly observed in the specimen with 6 wt % Si in Figure 5l.
From the results of the EDS analysis and EPMA analysis obtained so far, we tried to determine whether the two specimens belong to C, R1, and R2 (Figure 5). For this purpose, a focused ion beam (FIB) was used. The specimens were taken in the depth direction in the areas indicated by X1, X2 (R1–R2 interface), and Y1 (R2–Steel interface) in (a) and (g) of Figure 5. The microstructure was analyzed using FE-TEM (FEI, Hillsboro, OR, USA).
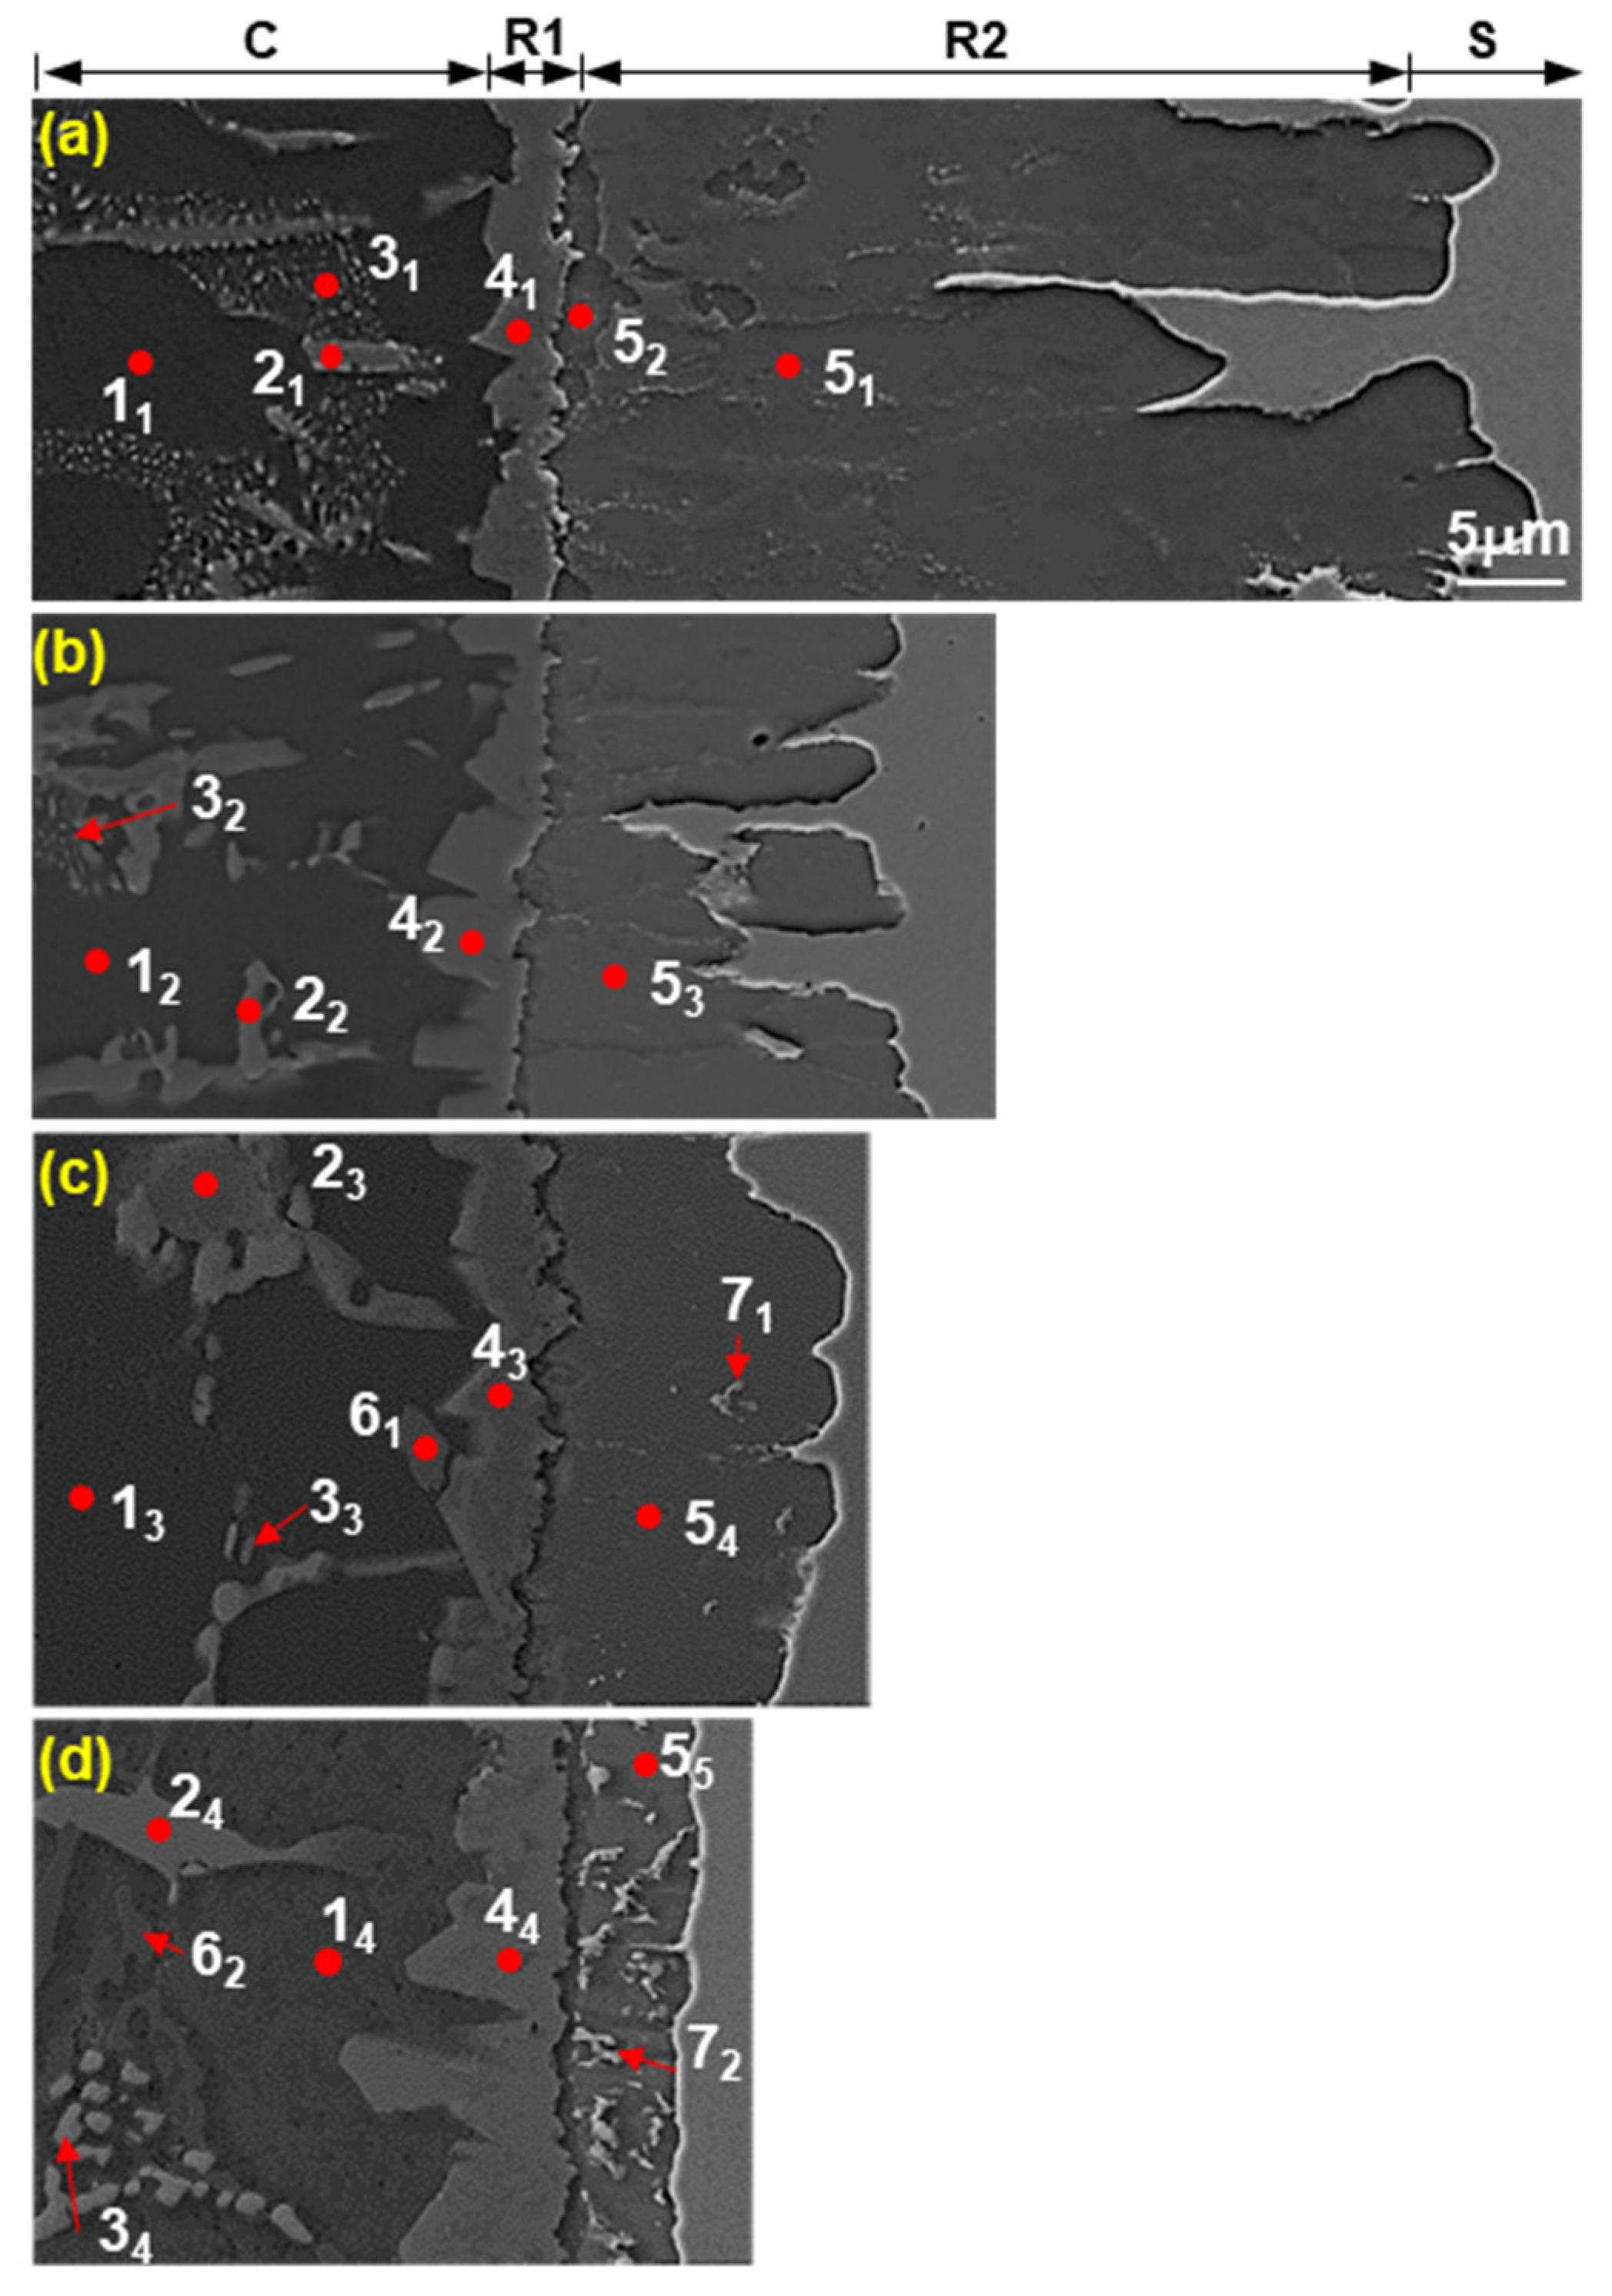
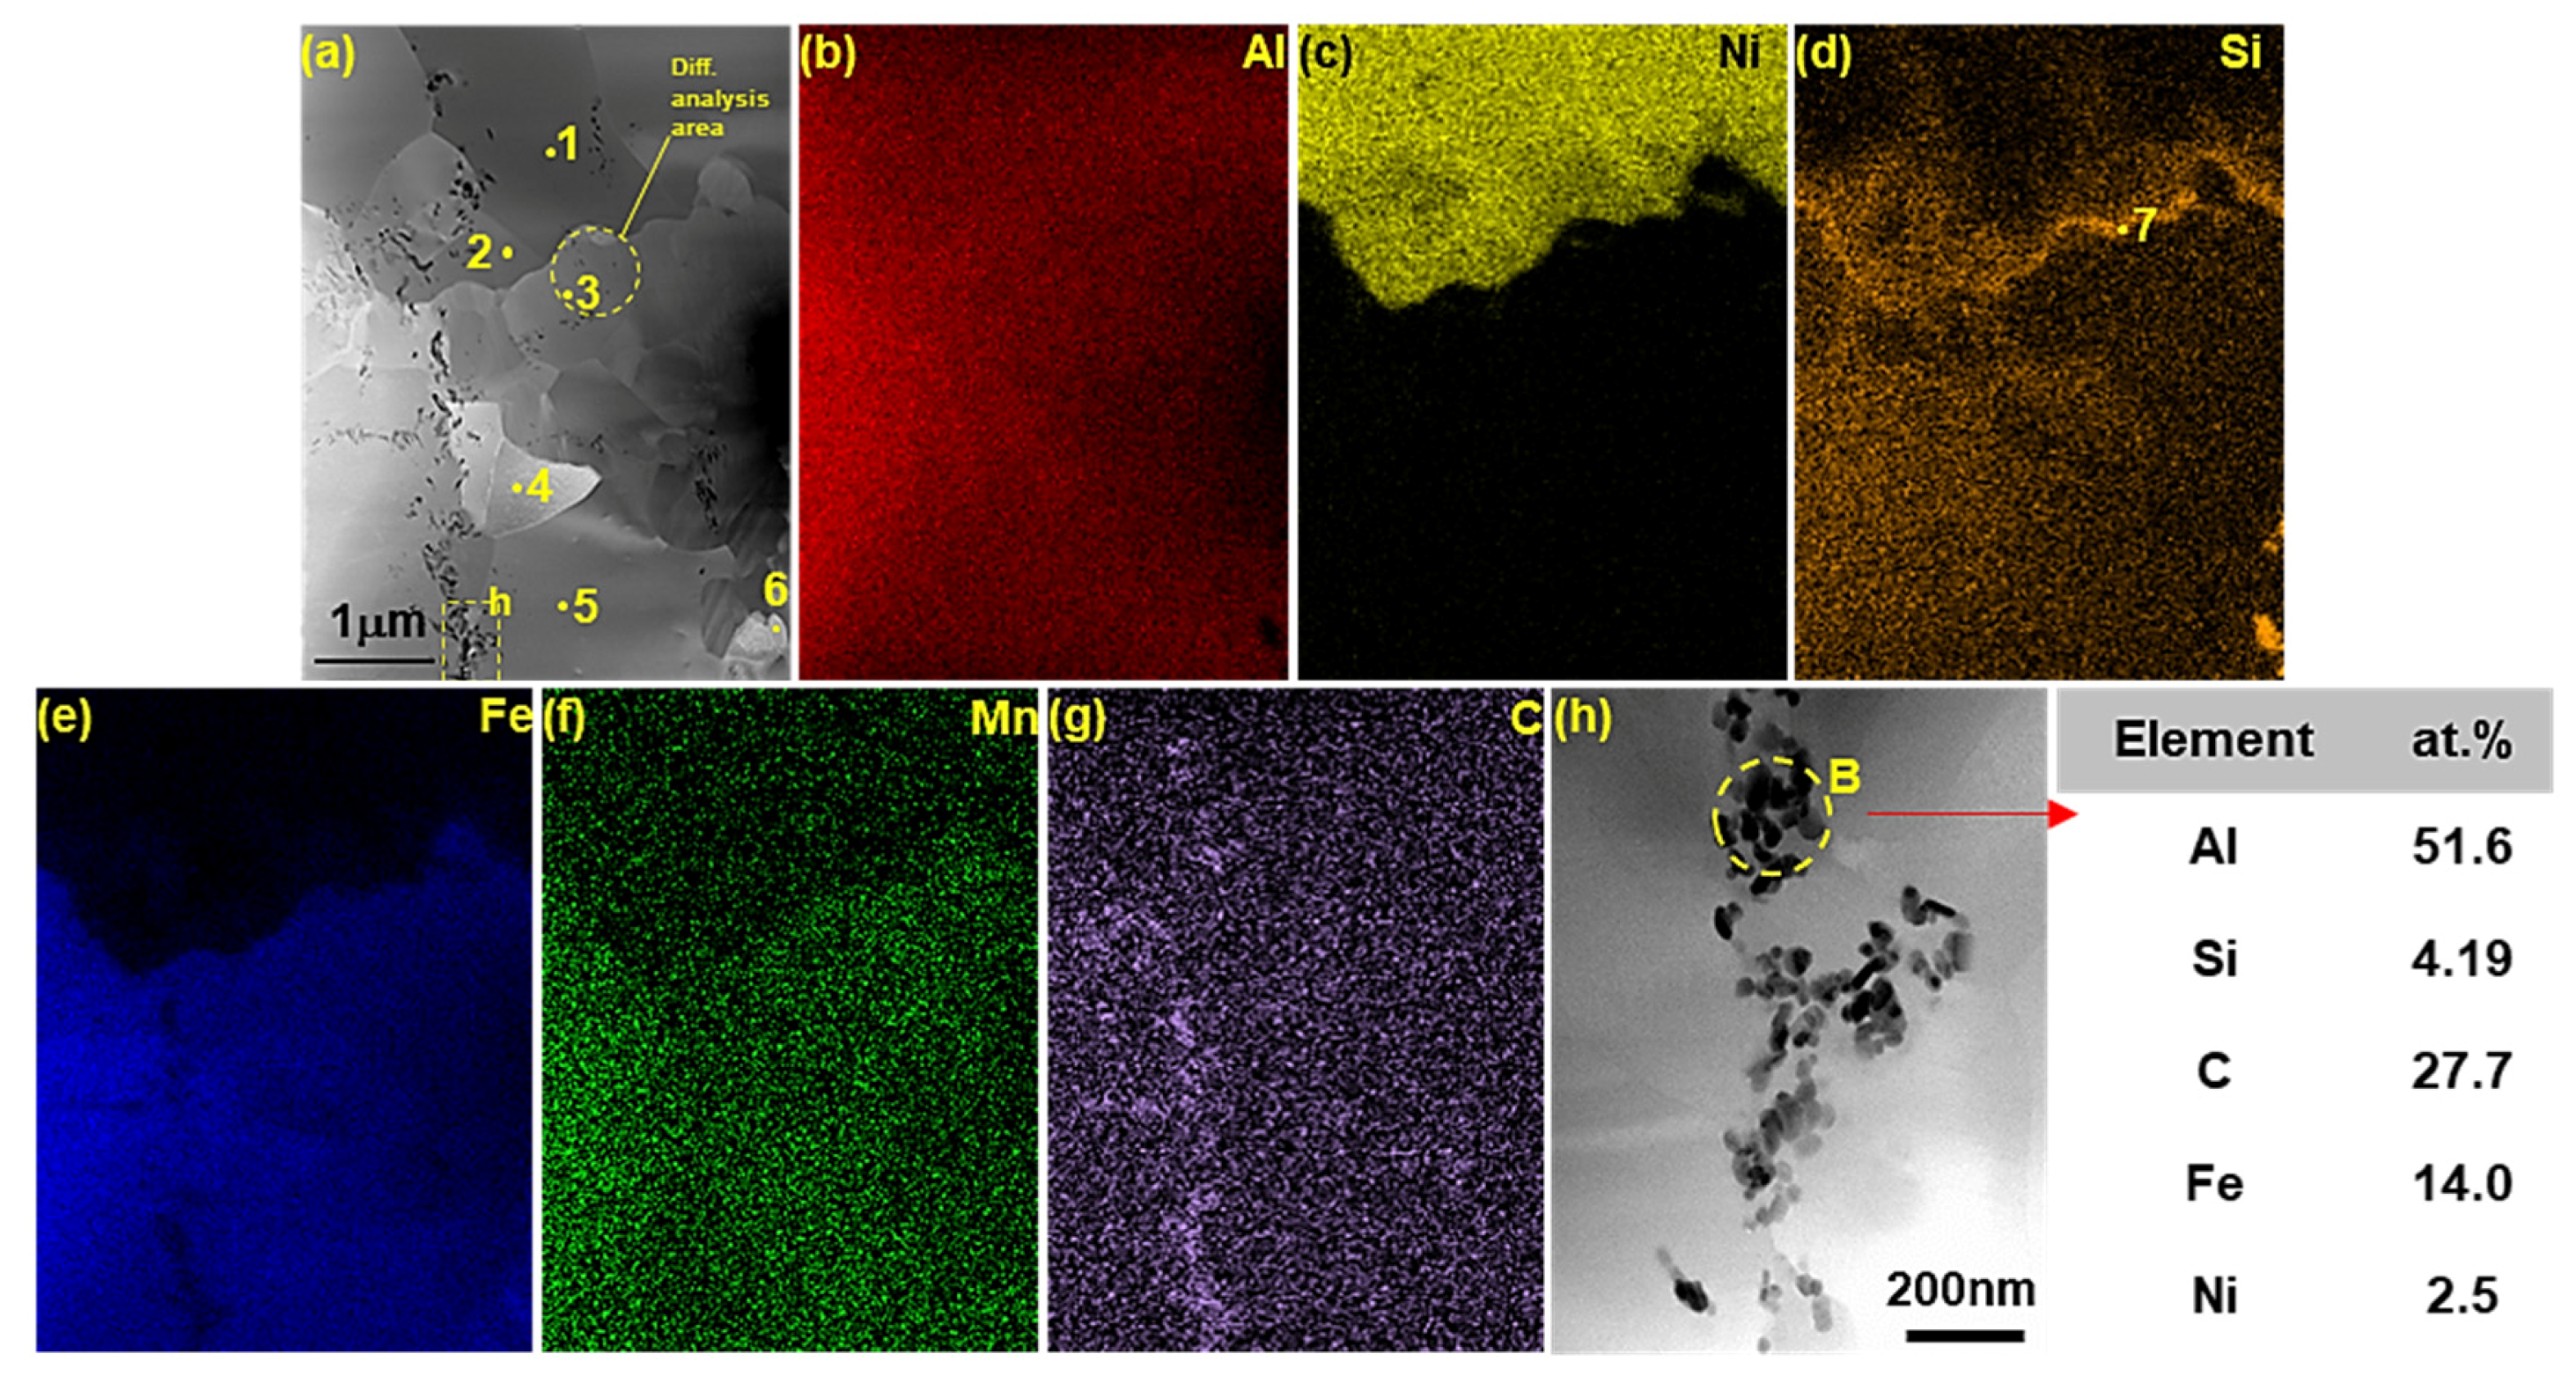
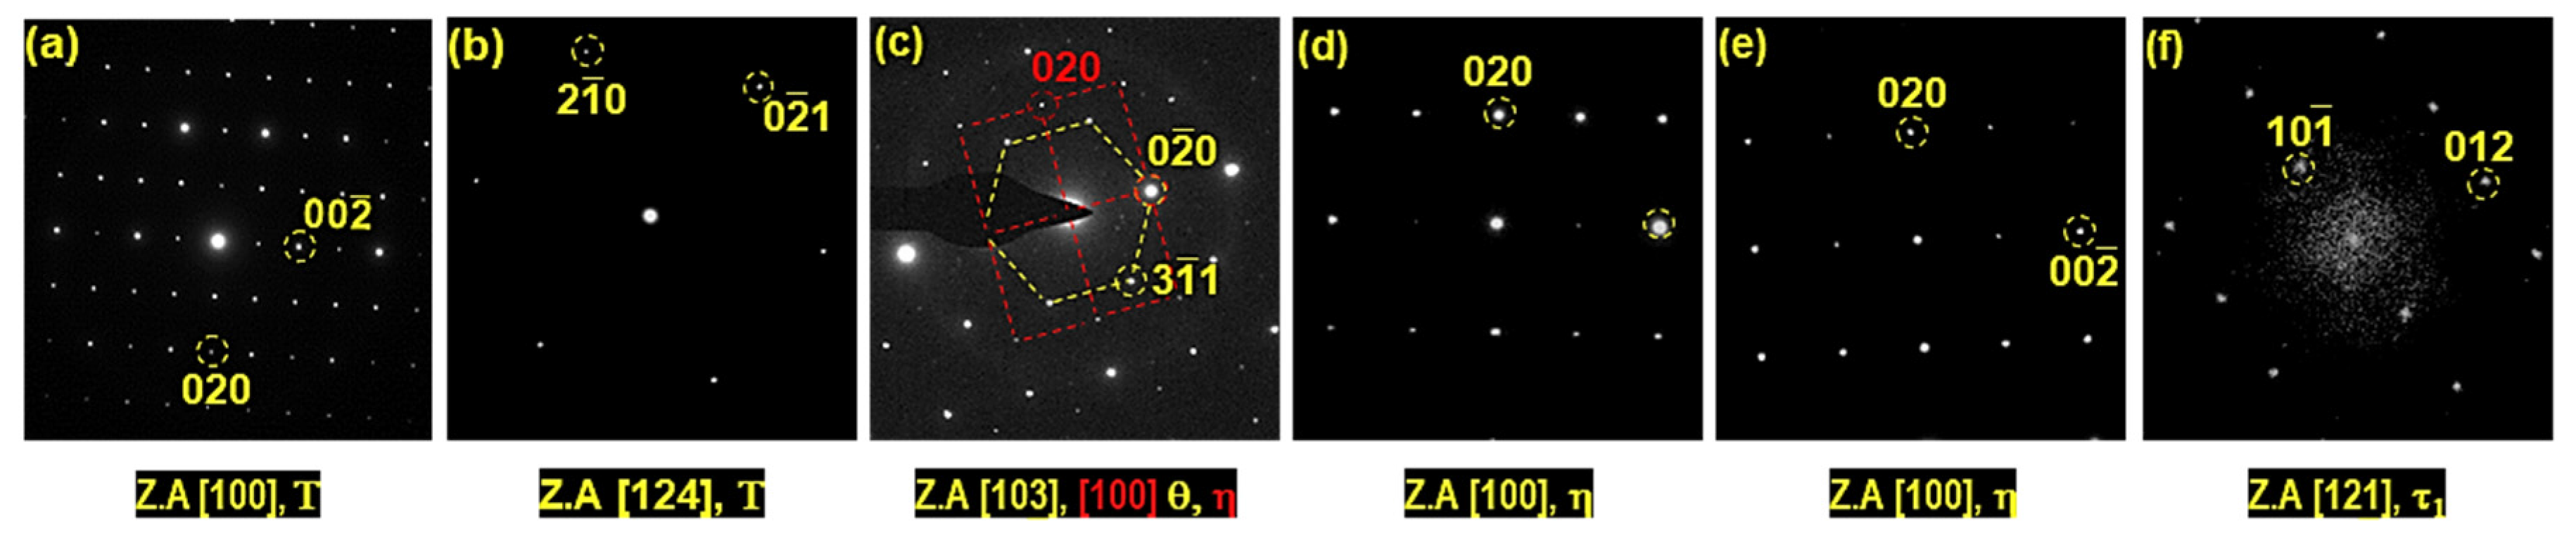
Figure 6a shows the high-angle annular dark-field (HAADF) image of the 2 wt % Si FIB specimen (X1). Figure 6b–g shows the results of super-EDS analysis of the Fe, Mn and C elements of the steel elements and the Al, Ni, Si of the coating elements, respectively. Figure 7 shows the diffraction pattern and the analytical result of each phase indicated by 1–6. Z.A. means the zone axis. Table 3 shows the composition of 1–7 points by EDS analysis. From the results of the EDS composition analysis and diffraction pattern analysis, it was concluded that phase (1) and phase (2) contained Al, Ni, and Fe, and a small amount of Si in a Al9FeNi (T) phase with a monoclinic (space group: P21/c). This is considered beneficial in laser welding. This is the same as the result of the study on the Al–7Ni wt % coating layer that did not contain Si [10]. As shown in Table 3, Nos. 4 and 5 show a slight decrease in Al compared to No. 2 and an increase in Fe, with the phase almost free of Ni and containing a small amount of Si. These results and the diffraction pattern analysis show that the Fe2Al5 (η) phase is Orthorhombic (space group: Cmcm), from Figure 6d,e. No. 6 is present in the flake phases in the R2 (η) layer. This phase contains higher levels of Si, and contains a large amount of Fe and Al. From the EDS and diffraction pattern analysis results, this phase was identified as the Triclinic (space group: P1) Al2Fe3Si3 (τ1) phase. On the other hand, for No. 3, it can be seen that the FeAl3 (θ) phase with a Monoclinic crystal structure (space group: C2/m) and Fe2Al5 (η) phase with Orthorhombic crystal structure (space group: Cmcm) coexist, containing Al and Fe and little Ni. This is due to the fact that the No. 7 Si enrichment, observed in Figure 6d, is too small to analyze using the diffraction pattern alone. This is the result of analyzing the diffraction pattern of the No. 3 region including the No. 7 portion in the analysis aperture region. This means that No. 7 is the FeAl3 (θ) phase. Thus, No. 7 is the FeAl3 (θ) phase and No. 3 is the Fe2Al5 (η) phase. The black spot (B) on the left side of the specimen was too small to analyze using the diffraction pattern. As a result of the EDS analysis, it was considered that Al, Fe, and C were especially enriched, suggesting that it was an Al-based complex carbide. It seems that this is generated by bonding Al and Si diffused from the steel C and coating. In summary, it was found that the reaction layer R1 formed in the boron steel specimens hot-dipped at 690 °C in the composition of Al–7Ni–2Si wt % is the Τ phase, R2 is the η phase, and a θ phase exists at the R1–R2 interface. The flake phases found in R2 were in τ1 phase, and Al-based carbides were formed at the upper and lower edges of the specimens.
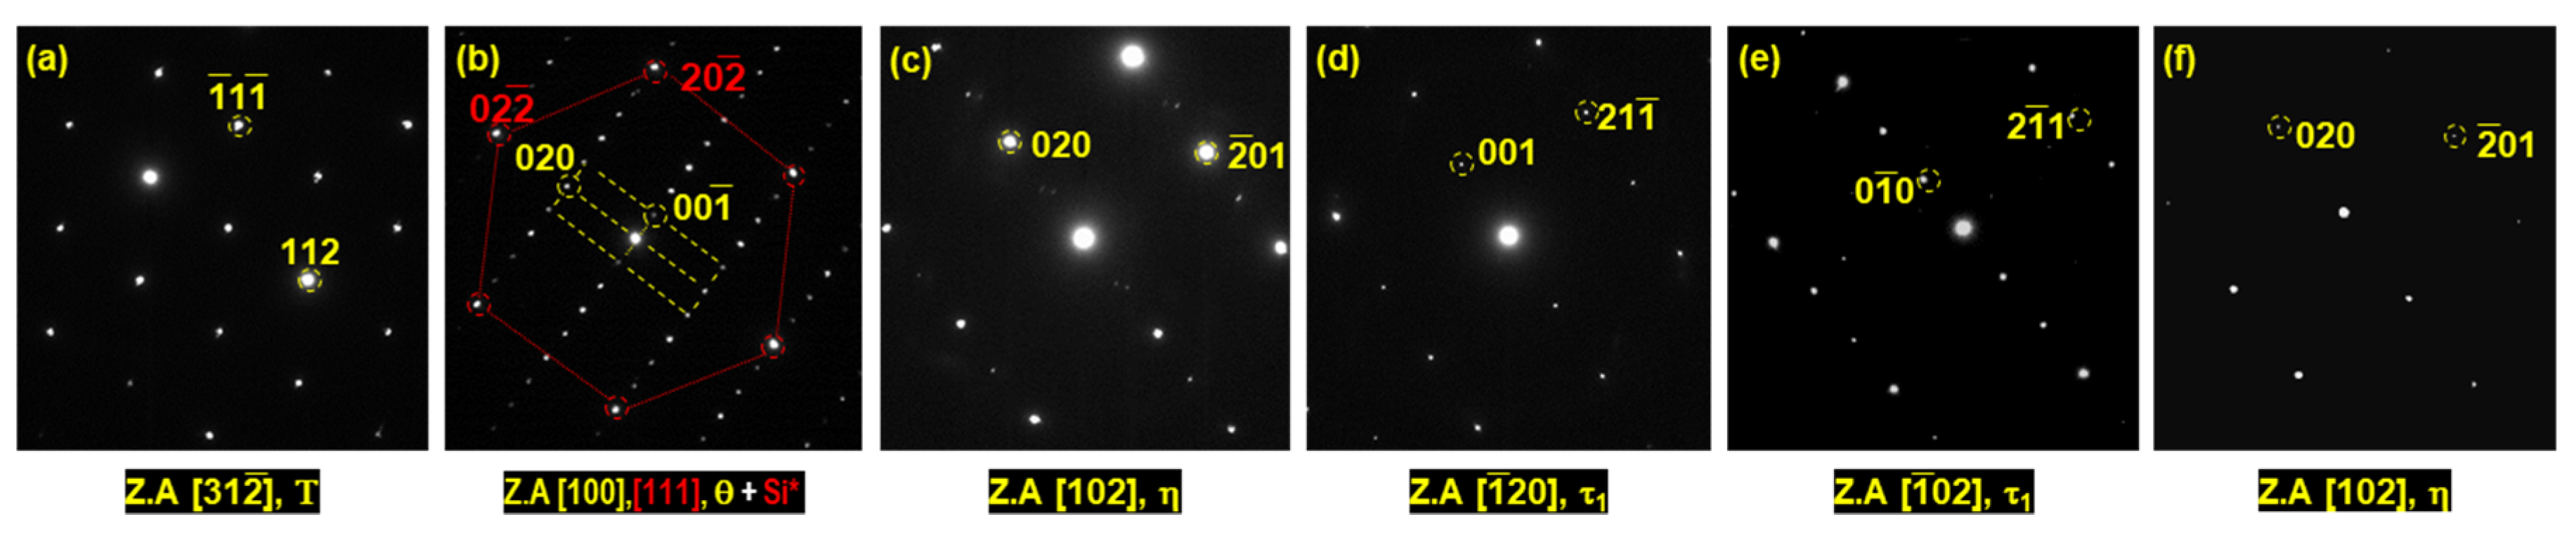
To investigate the phase changes when Si is added to the coating, the analysis results are shown in the next figure. Figure 8a shows the HAADF image of the FIB specimen in the X1 region of Figure 5g, which is a 6 wt % Si added coating specimen. Figure 8b–g shows the results of super-EDS analysis of Fe, Mn, and C elements as steel elements and Al, Ni, and Si as coating elements, respectively. Table 4 shows the results of the EDS composition analysis for the points indicated by 1–6 shown in Figure 8a. Figure 9 shows the diffraction pattern and the analysis results of these points. From the results of the EDS composition analysis and the diffraction pattern analysis, No. 1 contains Al, Ni, and Fe and 2.78 at % Si. This was identified as the T phase. This is the same result as with the 2 wt % Si added specimen. The second region is the analysis of the small phase adjacent to the banded Si enrichment region as in the previous 2 wt % Si added specimen.
As shown in Figure 8c–e, Si and Fe are enriched and Ni is deficient when compared to No. 1. From the results of the EDS composition analysis and the diffraction pattern analysis of this region, the band-shaped No. 2 was identified as a solid solution of Si having a cubic structure (space group: Fd-3m) in the θ phase. In the case of Nos. 3 and 6, the steel contains Fe and Mn (which are the elements of steel), contains Al as a coating element, and a small amount of Si—approximately 1.6, 3.81 at %. It is identified to be in the η phase when analyzed together with the analysis results of the diffraction pattern (Figure 9c,f).
Meanwhile, in Figure 8d, the points of Nos. 4 and 5 indicate large amounts of Fe, Al, and Si. They were identified as the τ1 phase from the results of the EDS and diffraction pattern analysis. In both of the 2 wt % Si and 6 wt % Si specimens, R1 is T phase and R2 is η phase. The R2 (η) inheritance flake phases were τ1 phases. In both specimens, the θ phase—which was not observed in the Al–7Ni wt % coated specimen without Si—was found between the T phase and the η phase, as was the Si-concentrated band. It can be seen that the phases vary in length depending on the amount of Si in the η phase. The phase where the amount varies is the τ1 phase in the η phase.
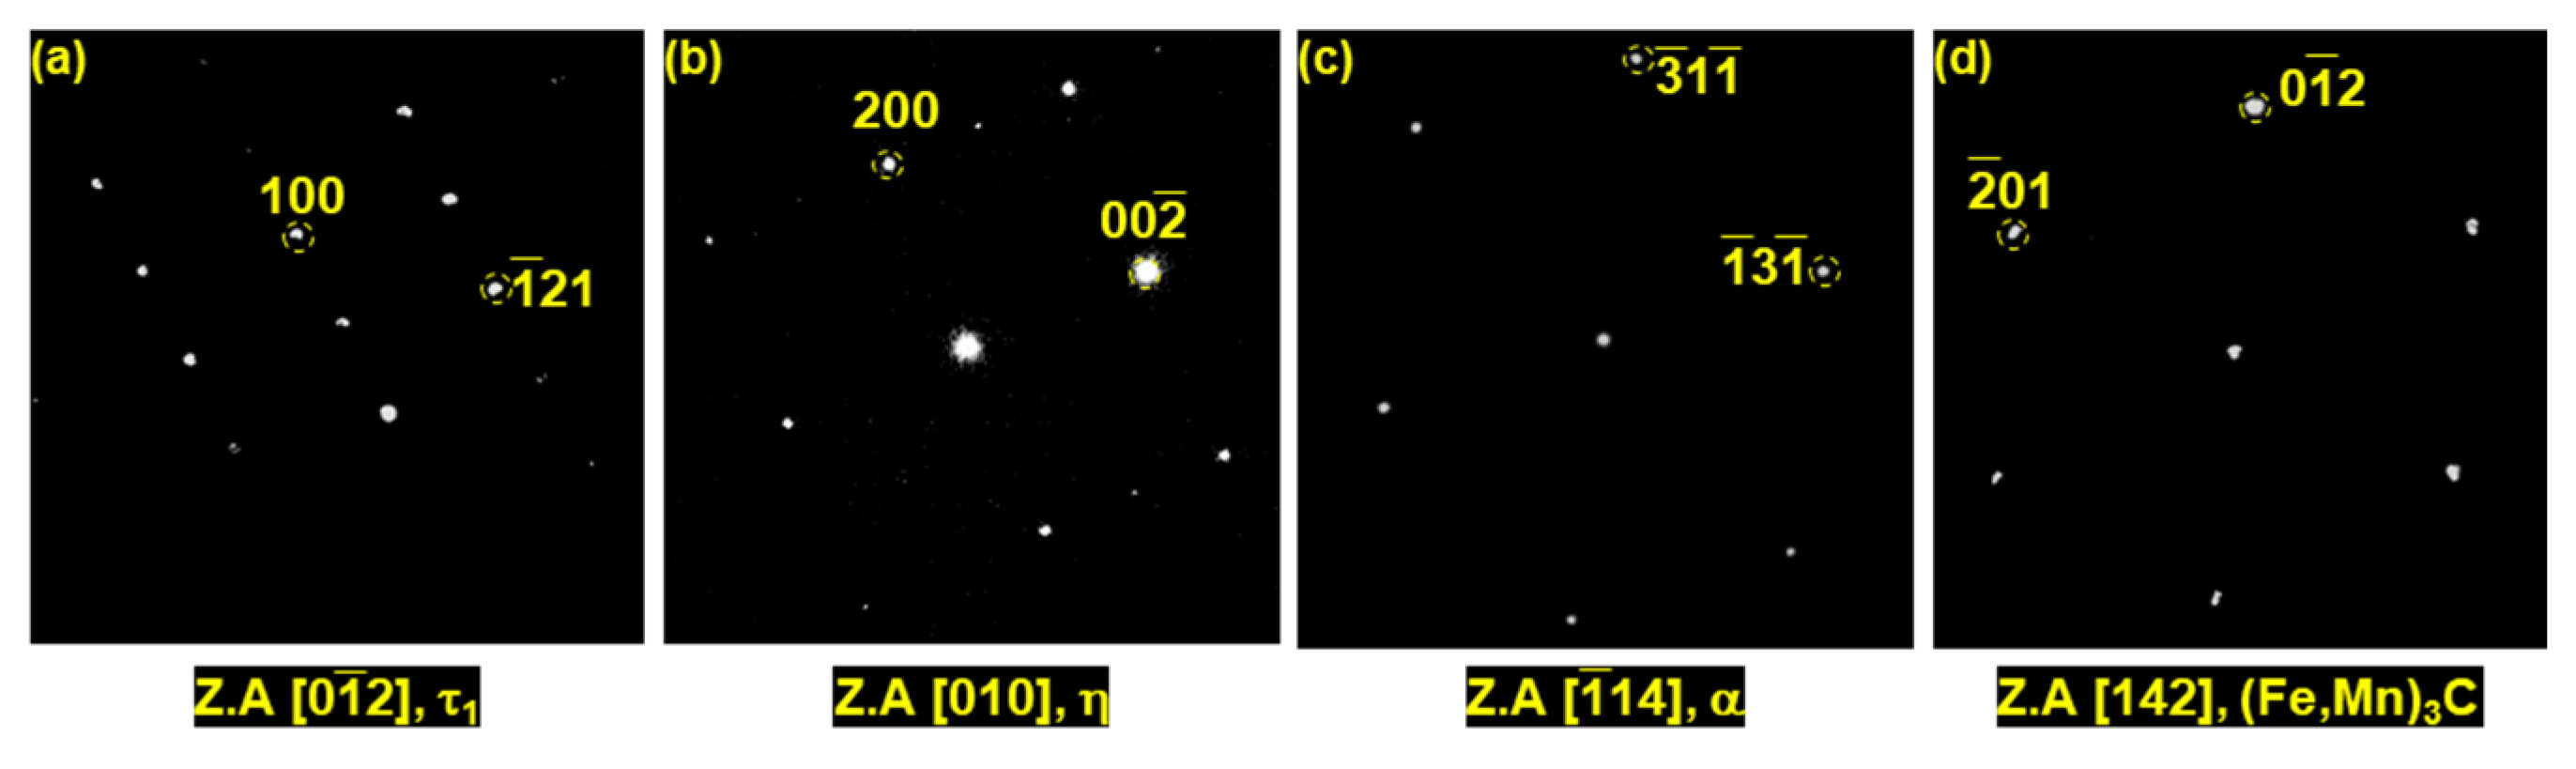
Figure 10 shows the microstructural analysis of the FIB specimen taken in the depth direction in the area indicated by Y1 shown in Figure 5g, which is a 6 wt % Si added specimen, analyzed using STEM. Figure 10a shows the HAADF image, and Figure 10b–g shows the results of super-EDS analysis of Fe, Mn, and C elements as steel elements and Al, Ni, and Si as coating elements, respectively. Figure 11 shows the diffraction patterns and the analytical results of each phase indicated by 1–4 in Figure 10a. Table 5 shows the composition of each point analyzed using EDS. A quantitative analysis of C was inaccurate by the EDS analysis; therefore, it was analyzed only qualitatively. From the results of the component analysis and the diffraction pattern analysis, it can be seen that the flake phase (1) is in the τ1 phase and the reaction layer (2) is in the η phase. The phase (3) present on the opposite side of the reaction layer was confirmed to be α-ferrite as the base material of the steel. There are spherical and flaked phases in various sizes inside the steel. It is confirmed that it is (Fe,Mn)3C, which is an Orthorhombic (space group: Pnma) structure. The Fe3AlC (k) phase was not observed in the 6 wt % Si specimen. However, this was found in the Al–7Ni wt % coated specimen, and was discussed in previous research [10].
4. Discussion
Figure 12 shows the change in the thickness of the coating layer at 120 s and at 690 °C by varying the Si content based on the composition of the Al–7Ni wt %. The thicknesses of the phases are calculated by the phase area/original surface length. As the Si content increases, the thickness of the entire coating layer decreases. In particular, the η phase length is 42.2 µm when Si is not added. However, when 1 wt % of Si is added, it is greatly reduced to 21.2 µm. It is steadily decreased until 6 wt % of Si is added and the η phase becomes 5.0 µm.
To explain why the addition of Si suppresses the η phase growth, it is necessary to understand the growth principle of the η phase. In a study authored by Heumann et al. [18], the η phase is an orthorhombic structure with a vacancy of 30% in the c-axis. It has been shown that a continuous growth occurs in the [001] direction due to such a vacancy. In addition, Cheng and Wang conducted a pure Al hot-dip experiment at 700 °C for 180 s [19]. Here, the η phase shows heterogeneous growth in the [001] direction in the a-ferrite, and thus grows like a tongue. This is presented as a growth model of the η phase. In the study of Naoki et al. [20], the reason for this heterogeneous growth in the [001] direction of the η phase was identified as the diffusion creep mechanism (Nabarro–Herring creep). This refers to the phenomenon where dislocations and Al flow in the η phase. This clarified the mechanism of η phase growth. Various previous studies discussing the effects of Si addition on the η phase and the growth mechanism are as follows: Eggeler’s study [12] was carried out with Al–2 wt % Si hot-dipping coating at 780 °C for 900 s on low alloy steel (Fe–0.16C–0.34Si–0.51Mn–0.97Cr–0.45Mo, all wt %). It was reported that the addition of 2 wt % Si changed the internal diffusion conditions of the η phase. Therefore, the η phase growth was inhibited. In a study by Yin et al. [15], when a hot-dip coating of Al–0.5 to 3 wt % Si was applied to pure iron at 700–850 °C, a heterogeneous growth in the [001] direction of the η phase was observed. The addition of Si to the molten metal reduces the vacancy of the η phase, which prevents the diffusion of Fe and Al within the η phase. As a result, it has been proved by the formula that the activation energy of the η phase is decreased, and the activation entropy is increased. Therefore, the η phase growth is suppressed. Both the previous studies and this work indicate that the solid solution of Si in the η phase affects the vacancy—until the addition of 2 wt % Si. Therefore, it is considered that the η phase growth is suppressed by affecting Al diffusion in the η phase.
On the other hand, when more than 2 wt % of Si is added to the Al–7Ni wt % coating, the τ1 phase (Al2Fe3Si3) starts to form in the η phase. This is described by Springer, H. et al. [14]. This work reported that this occurred when the experiments were performed below the liquid temperature of Al. However, there is no mention of the role of the τ1 phase. In a study by Lemmens et al. [13], it was predicted that the production of the bases and other triplets, such as the τ1 phase, could sometimes affect the diffusion or become a barrier to diffusion. In their opinion, it is difficult to identify. Therefore, in this study, we investigated how the formation of the τ1 phase interferes with the growth of the η phase.
Figure 13 shows the η phase when Si was added at 0–6 wt %, and the change of the mass ratio generated in the τ1 phase was calculated by Thermo-Calc™, based on the composition of No. 3 of Figure 8. In the case of 1–3 wt % Si, it can be seen that no phase τ1 is formed, but only the η phase is produced at 690 °C. However, from the addition of 3 wt % Si or more, the η phase ratio produced decreases from 0.83 to 0.71. The τ1 phase ratio increases from 0 to 0.26. As the amount of Si added increases, the total area occupied by the η phase decreases. What this means is that the actual area reduction of the η phase and the actual area increase of the τ1 phase are much larger than the values shown in Figure 13. In addition, the ∆G·mol−1 of two phases was calculated by Thermo-Calc™ when 4.5, 6.0 wt % Si was added and a τ1 phase was generated. The ∆G·mol−1 of the η phase is −6.57 × 10⁻³ J·mol−1, while that of the τ1 phase is −6.94 × 10⁻³ J·mol−1. The ∆G·mol−1 value of the τ1 phase is lower than that of the η phase: this means that the τ1 phase is more stable than the η phase at the coating temperature. From these results, the diffusion of Al from the liquid phase and the Fe in the steel matrix are consumed preferentially over the forming of the η phase in the forming of the τ1 phase. In particular, according to Table 3, Table 4 and Table 5, the amount of Fe required for the formation of the τ1 phase is higher than Fe required for the η phase. Thus, it can be seen that the τ1 phase, which increases the amount of Si as the amount of Si increases, can inhibit the formation of the η phase. On the other hand, during the hot-dipped coating, the Al9FeNi (T) phase is formed on the surface of the steel by the first reaction between the liquid and the steel substrate—regardless of the amount of Si added to the Al–7Ni wt % coating. This is the same as the study of boron steel with an Al–7Ni wt % coating without Si addition [10]. This phase is formed by a reaction with Al and Ni in the liquid phase as Fe, Mn, C, etc., contained in the steel dissolve and diffuse into the liquid phase. It contains Ni, which is an austenite stabilizing element, so that it does not generate ferrite or Al-based IMC even if the coating is melted into the fusion zone during laser welding. Therefore, it is the key phase in this coating. This is same as the study of the boron steel with the Al–7Ni wt % coating without Si addition [10]. The thickness of the T phase is shown in Figure 13. It increases slightly as the Si content in the coating increases, unlike the η phase. In particular, the growth of the T phase is prominent when over 2 wt % Si is added. The reason for this phenomenon is shown in Figure 14, using the optical image of the hot-dip specimen (for 40 s at 690 °C), which is before the complete coating layer was formed on the steel surface.
Figure 14a is a cross-sectional photograph of a hot-dip coated Al–7Ni wt % composition without Si added. The η phase (gray) and the T phase (brown), are formed at the interface of the steel. These are reaction layers: their depth is shallow, and spacing is narrow. On the other hand, Figure 14b,c shows the specimen added with 2 wt % and 6 wt % Si in the Al–7Ni wt % coating, respectively. The reaction at the steel interface appears wider and deeper than the specimen without Si. Especially, in Figure 14c, where 6 wt % Si is added, the portion eroded toward the base material of the steel is very deep compared with the other specimens. In addition, it can be seen that a particularly large amount of T phase (brown) is produced at that portion. This phenomenon can be explained in the study of Al hot-dipping studies of various steels conducted by Komatsu et al. [21]. As the Si content in the molten metal increases, the amount of Fe released from the base metal during the reaction increases. The formation of the T phase is produced by the reaction of Fe released from the steel with the liquid phase in the coating [10]. The amount of Fe flowing out into the liquid phase for T phase growth increases with the addition of Si, so the T phase grows well.
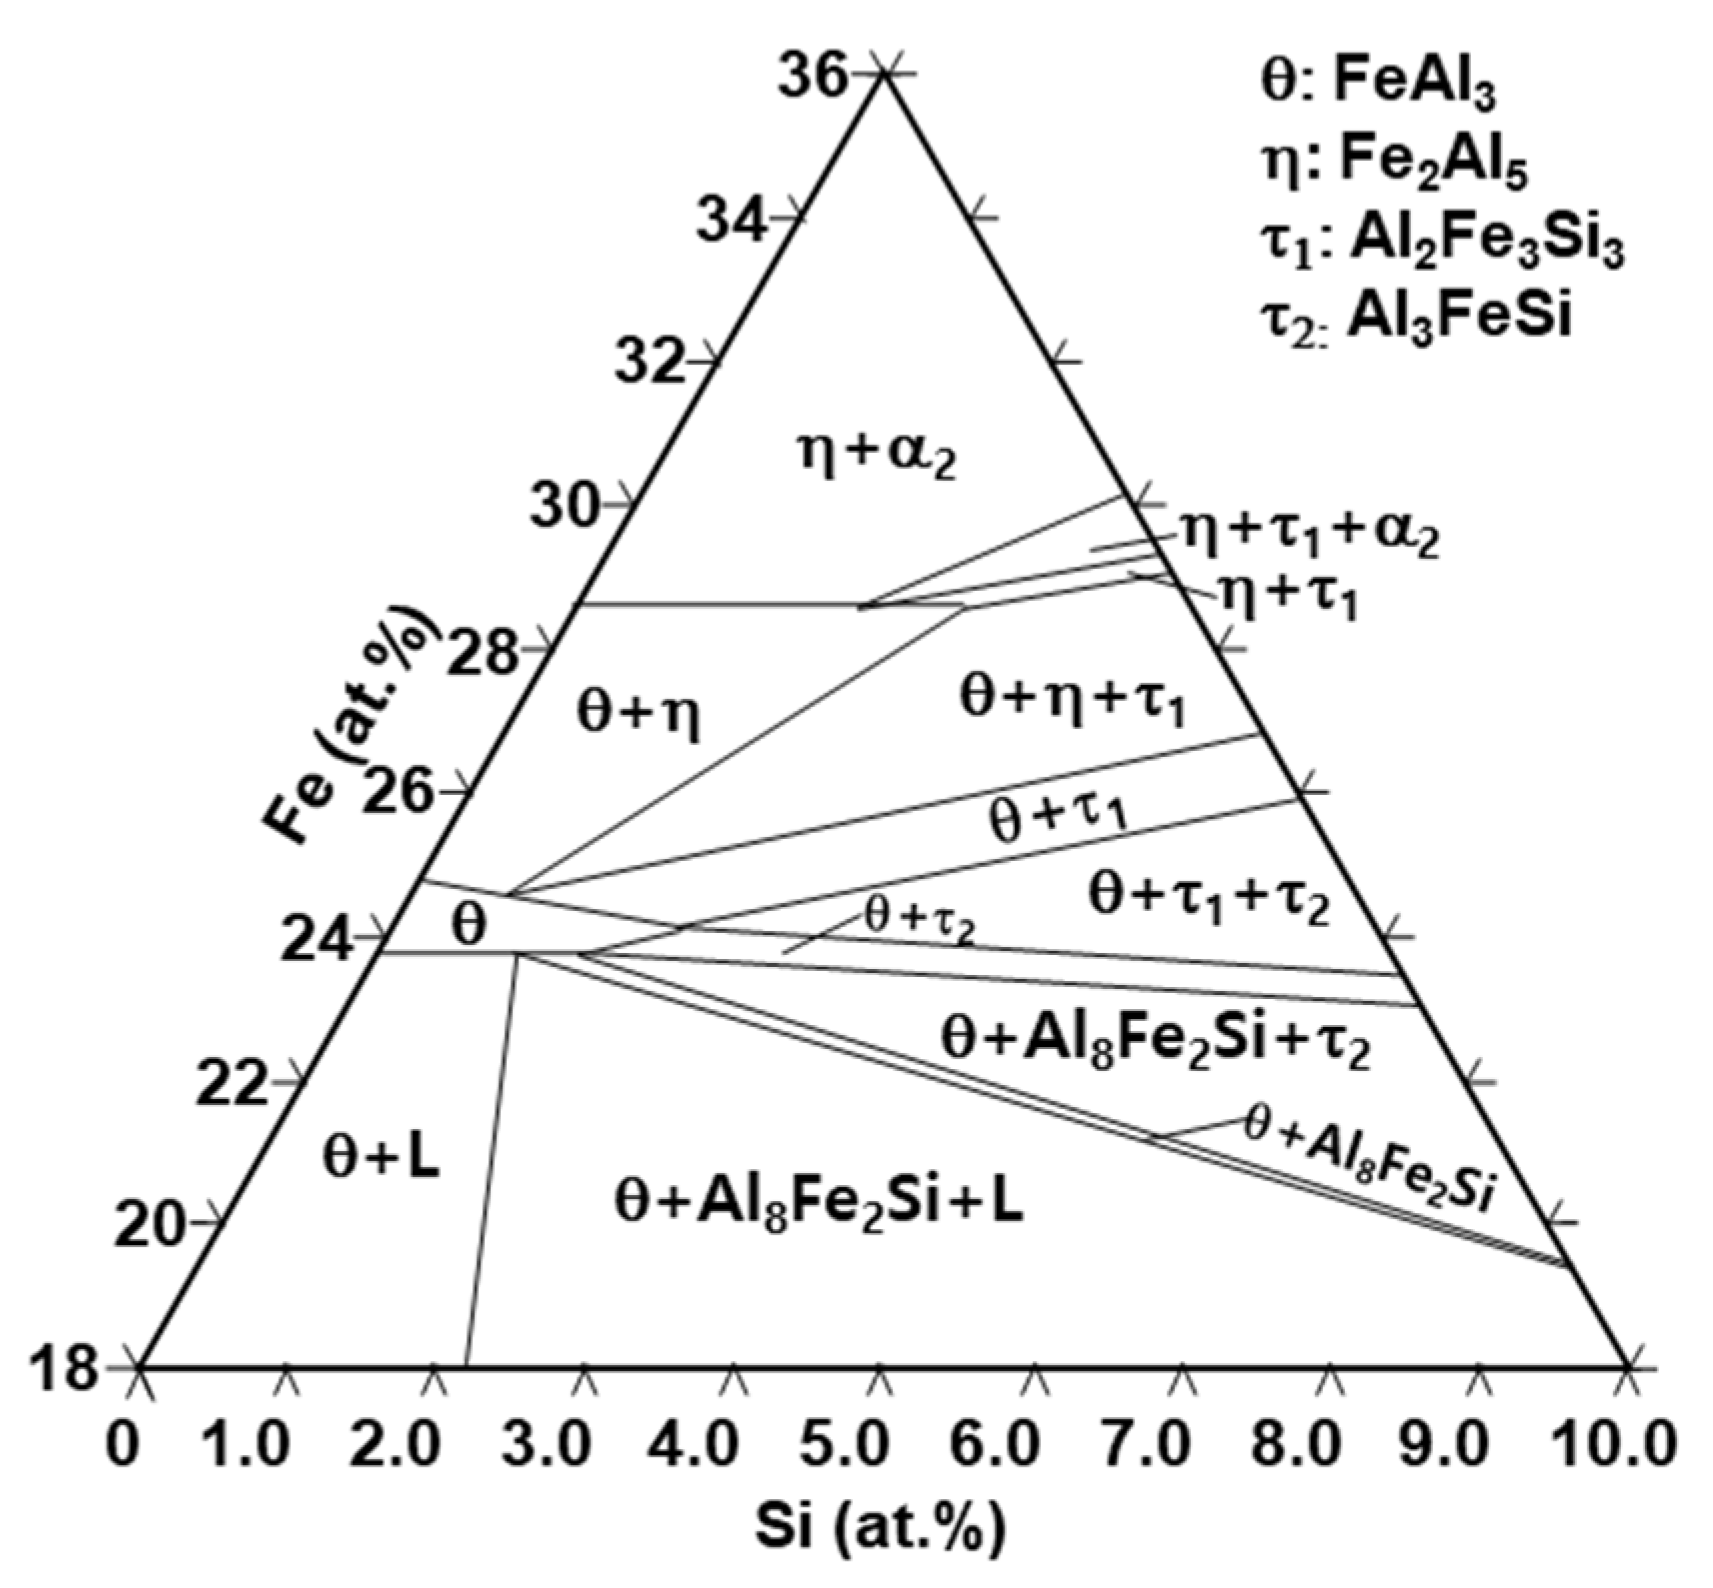
In the Al–7Ni wt % hot-dip coating study of boron steel, the η phase was formed immediately after the T phase [10]. By contrast, when Si is added to the coating, the FeAl3 (θ) phase is formed between the T and η phases. The reason why the θ phase is generated is discussed here. First, when Si is added to the Al–7Ni wt % coating, the T phase with 11–14 at % Fe and the η phase with 30–42 at % Fe content are generated as shown in Table 3, Table 4 and Table 5. Then, the Fe intermediate layer with 19–26 at % Fe is formed between the two phases. The Fe composition of the intermediate concentration layer was assigned to a portion of the Fe–Al–Si ternary phase diagram at 690 °C calculated by Thermo-CalcTM, as shown in Figure 15.
As a result, the phases that can be formed in Fe 19–26 at % composition are L + θ, θ, or θ + η phases. Therefore, the θ phase can be generated. On the other hand, in the case of the θ + η phase two-phase region when Fe is 26 at %, the η phase disappears and the θ phase is stabilized as the Fe–Al binary system composition increases to approximately 10 at % Si. In this study, the region where the θ phase is actually formed is a region where Si is present in a band shape of approximately 10 at %. Thus, a θ phase that is more stable than the η phase was generated. Awan et al. conducted a similar study with hot-dip-aluminized carbon steel [22]. As the amount of silicon in the coating liquid increases, the thickness of the θ phase becomes much larger than that of the η phase. For this reason, it was suggested that in the case of the θ phase, the Al atoms inside the θ phase were replaced with Si atoms. Therefore, the Si could be a solid solution. However, in the case of the η phase, the Si inhibited the diffusion of Al to the vacancy and also inhibited the growth of the η phase. Therefore, the θ phase was more stable than the η phase. Both the results of the previous research and this study show that the reaction θ phase was produced in the Al–7Ni–2, 6 wt % Si hot-dip coating. Like the Si-free Al–7Ni wt % hot-dip coating, the η phase did not form immediately after the T phase, but the θ phase was generated. This is because the Fe intermediate layer is formed between the two phases and it has a high concentration of Si. In this region, the θ phase is more stable than the η phase.
5. Conclusions
This work studied the amount of Si added (from 1–6 wt %) to an Al–7Ni wt % bath, and the corresponding change in the reaction layer formed in the hot-dipped boron steel at 690 °C for 120 s was analyzed using XRD, EPMA, and FIB/TEM.
- According to the amount of Si, the phases of the pure coating layer (C) are composed of an Al–7Ni wt % coating layer and a primary Al + primary Al3Ni + eutectic structure (Al + Al3Ni). However, as the amount of Si added to the coating layer increases from 1 to 6 wt %, the size and amount of the primary Al3Ni phase increases. In addition, the crystallization of Si (Fd-3m) in the pure coating layer also increases.
- The phase (R1) of the original surface of all wt % Si added specimens is an Al9FeNi (T) phase (space group: P21/c), which is the same as for the specimen without Si. This phase increases linearly from 3.8 µm for Si-free specimens to 9.7 µm for 6 wt % Si additions. Both the previous research and the present study show that, as the Si content in the coating increases, the Fe flux from the steel interface to the liquid phase increases. The reason for the change is the amount of Τ phase formation described below.
- The reaction phase (R2) formed in the reactor is an Fe2Al5 (η) phase (space group: Cmcm). The thickness variation of this phase decreases drastically because of the addition of 1 wt % Si and steadily decreases until the addition of 6 wt % Si. This is because approximately 1–2 wt % of Si solid solution in the η phase affects the vacancy inside the phase, thereby interfering with the diffusion of Al and inhibiting its phase growth.
- The Al2Fe3Si3 (τ1) phase (space group: P-1) is generated when the amount of Si addition is more than 2 wt % in the Al–7Ni wt % coating. The amount of this phase is proportional to the amount of Si added to the coating bath. In addition, the ∆G·mol−1 value obtained by Thermo-calc™ was lower than that of the η phase. Therefore, when the τ1 phase is generated, it consumes Fe of the steel material used for the η phase generation, and Al diffused from the liquid phase; therefore, the η phase growth is inhibited.
- Since the intermediate concentration layer of 19–28 at % Fe concentration between the Τ phase and the η phase is generated only in the Si-added coating, approximately 10 at % Si exists in this layer. Therefore, the θ phase is more stable than the η phase in this layer.
Acknowledgments
This work was supported by a National Research Foundation of Korea (NRF) grant funded by the Korean government (MSIP) (No. 2012R1A5A1048294).
Author Contributions
Jung-Gil Yun and Chung-Yun Kang conceived and designed the experiments; Jung-Gil Yun, Jae-Hyeong Lee, and Sung-Yun Kwak performed the experiments; Jung-Gil Yun and Chung-Yun Kang analyzed the data; Jung-Gil Yun wrote this paper.
Conflicts of Interest
The authors declare no conflict of interest. The founding sponsors had no role in the design of the study; in the collection, analyses, or interpretation of data; in the writing of the manuscript, and in the decision to publish the results.
References
- Aranda, L.G.; Ravier, P.; Chastel, Y. Hot stamping of quenchable steels: Material data and process simulations. In Proceedings of the IDDRG, Bled, Slovenia, 11–15 May 2003; pp. 164–166. [Google Scholar]
- Kolleck, R.; Veit, R.; Merklein, M.; Lechler, J.; Geiger, M. Investigation on induction heating for hot stamping of boron alloyed steels. CIRP Ann. Manuf. Technol. 2009, 58, 275–278. [Google Scholar] [CrossRef]
- Liu, H.S.; Xing, Z.W.; Bao, J.; Song, B.Y. Investigation of the hot-stamping process for advanced high-strength steel sheet by numerical simulation. J. Mater. Eng. Perform. 2010, 19, 325–334. [Google Scholar] [CrossRef]
- Geiger, M.; Merklein, M.; Hoff, C. Basic investigations on the hot stamping steel 22MnB5. Adv. Mater. Res. 2005, 6–8, 795–804. [Google Scholar] [CrossRef]
- Neugebauer, R.; Altan, T.; Geiger, M.; Kleiner, M.; Sterzing, A. Sheet metal forming at elevated temperatures. CIRP Ann. Manuf. Technol. 2006, 55, 793–816. [Google Scholar] [CrossRef]
- Cretteur, L.; Vierstraete, R.; Yin, Q.; Ehling, W.; Pic, A. Development of a laser decoating process for fully functional Al–Si coated press hardened steel laser welded blank solutions. In Proceedings of the 5th International WLT-Conference: Lasers in Manufacturing, Munich, Germany, 15–18 June 2009; pp. 409–413. [Google Scholar]
- Jung, B.H.; Kong, J.P.; Kang, C.Y. Effect of hot-stamping heat treatment on the microstructure of Al-segregated zone in TWB laser joints of Al-Si-coated boron steel and Zn-coated DP steel. Korean J. Met. Mater. 2012, 50, 455–462. [Google Scholar]
- Oh, M.-H.; Kong, J.-P.; Kwon, M.-S.; Kang, C.-Y. Effect of hot-stamping on microstructures and tensile properties of Al-Si coated boron steel welds with laser source. J. Weld. Join. 2013, 31, 96–106. [Google Scholar] [CrossRef]
- Yoon, T.-J.; Oh, M.-H.; Shin, H.-J.; Kang, C.-Y. Comparison of microstructure and phase transformation of laser-welded joints in Al-10 wt % Si-coated boron steel before and after hot stamping. Mater. Charact. 2017, 128, 195–202. [Google Scholar] [CrossRef]
- Yun, J.-G.; Lee, J.-H.; Kwak, S.-Y.; Kang, C.-Y. Microstructural evolution of intermetallic compound formed in boron steel hot-dipped in Al–7%Ni alloy. Metals 2017, 7, 393. [Google Scholar] [CrossRef]
- Li, Y.S.; Spiegel, M. Models describing the degradation of FeAl and NiAl alloys induced by ZnCl2–KCl melt at 400–450 °C. Corros. Sci. 2004, 46, 2009–2023. [Google Scholar] [CrossRef]
- Eggeler, G.; Auer, W.; Kaesche, H. On the influence of silicon on the growth of the alloy layer during hot dip aluminizing. J. Mater. Sci. 1986, 21, 3348–3350. [Google Scholar] [CrossRef]
- Lemmens, B.; Springer, H.; De Graeve, I.; De Strycker, J.; Raabe, D.; Verbeken, K. Effect of silicon on the microstructure and growth kinetics of intermetallic phases formed during hot-dip aluminizing of ferritic steel. Surf. Coat. Technol. 2017, 319, 104–109. [Google Scholar] [CrossRef]
- Springer, H.; Kostka, A.; Payton, E.J.; Raabe, D.; Kaysser-Pyzalla, A.; Eggeler, G. On the formation and growth of intermetallic phases during interdiffusion between low-carbon steel and aluminum alloys. Acta Mater. 2011, 59, 1586–1600. [Google Scholar] [CrossRef]
- Yin, F.; Zhao, M.; Liu, Y.; Han, W.; Li, Z. Effect of Si on growth kinetics of intermetallic compounds during reaction between solid iron and molten aluminum. Trans. Nonferr. Met. Soc. China 2013, 23, 556–561. [Google Scholar] [CrossRef]
- ASTM B487-85 Test Method for Measurement of Metal and Oxide Coating Thicknesses by Microscopical Examination of a Cross Section; ASTM: West Conshohocken, PA, USA, 2013.
- Murray, J.L.; Mcalister, A.J. The Al-Si (aluminum-silicon) system. J. Phase Equilib. 1984, 5, 74–84. [Google Scholar] [CrossRef]
- Heumann, T.; Dittrich, N. Structure character of the Fe2Al5 intermetallics compound in hot dip aluminizing process. Z. Met. 1959, 50, 617–623. [Google Scholar]
- Cheng, W.-J.; Wang, C.-J. Growth of intermetallic layer in the aluminide mild steel during hot-dipping. Surf. Coat. Technol. 2009, 204, 824–828. [Google Scholar] [CrossRef]
- Takata, N.; Nishimoto, M.; Kobayashi, S.; Takeyama, M. Crystallography of Fe2Al5 phase at the interface between solid Fe and liquid Al. Intermetallics 2015, 67, 1–11. [Google Scholar] [CrossRef]
- Komatsu, N.; Nakamura, M.; Fujita, H. Reactions of iron with liquid aluminum. J. Jpn. Inst. Light Met. 1968, 18, 467–473. [Google Scholar] [CrossRef]
- Awan, G.H.; Faiz, U.H. The morphology of coating/substrate interface in hot-dip-aluminized steels. Mater. Sci. Eng. A 2008, 472, 157–165. [Google Scholar] [CrossRef]
Figure 1.
Cross-sectional optical micrographs of specimens hot dipped at 690 °C for 120 s. The amount of Si added in the Al–7Ni wt % coating is varied as: (a) 0 wt % Si; (b) 1 wt % Si; (c) 2 wt % Si; (d) 4 wt % Si; (e) 6 wt % Si.
Figure 1.
Cross-sectional optical micrographs of specimens hot dipped at 690 °C for 120 s. The amount of Si added in the Al–7Ni wt % coating is varied as: (a) 0 wt % Si; (b) 1 wt % Si; (c) 2 wt % Si; (d) 4 wt % Si; (e) 6 wt % Si.

Figure 2.
SEM micrographs of specimens hot dipped at 690 °C for 120 s for varying amount of Si added based on the Al–7Ni wt % coating: (a) 0 wt % Si; (b) 1 wt % Si; (c) 2 wt % Si; (d) 6 wt % Si.
Figure 2.
SEM micrographs of specimens hot dipped at 690 °C for 120 s for varying amount of Si added based on the Al–7Ni wt % coating: (a) 0 wt % Si; (b) 1 wt % Si; (c) 2 wt % Si; (d) 6 wt % Si.

Figure 3.
XRD analysis result of coating that was hot-dipped at 690 °C for 120 s, depending on amount of Si added based on Al–7Ni wt % composition. Si*: Si(Fd-3m).
Figure 3.
XRD analysis result of coating that was hot-dipped at 690 °C for 120 s, depending on amount of Si added based on Al–7Ni wt % composition. Si*: Si(Fd-3m).
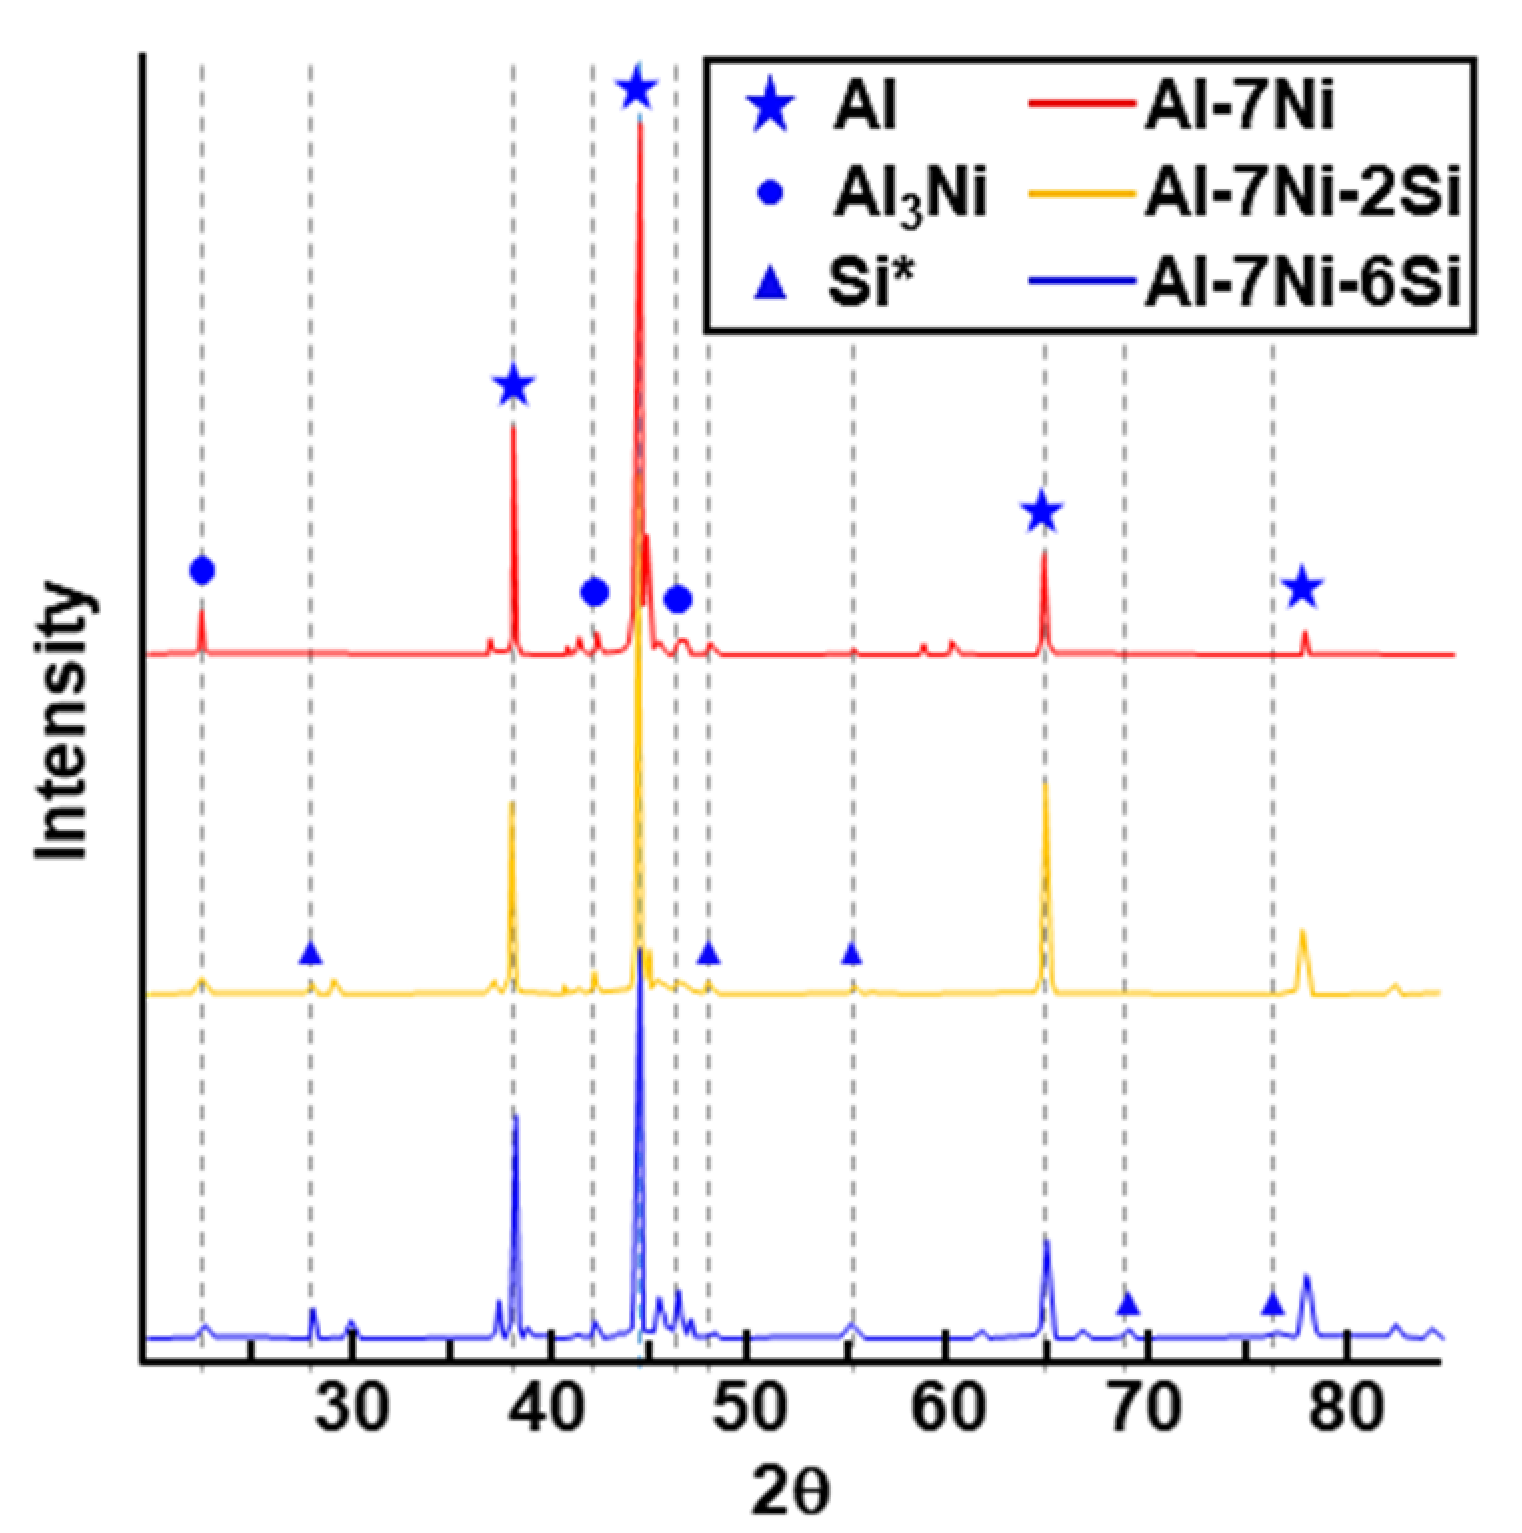
Figure 4.
Portion of (Al–7Ni)–xSi quasi-binary phase diagram calculated using Thermo-Calc™.

Figure 5.
EPMA analysis results of reaction layers near the original steel interface in the specimens that were hot-dipped at 690 °C for 120 s for Al–7Ni–x wt % Si: (a–f) Al–7Ni–2 wt % Si; (g–l) Al–7Ni–6 wt % Si; (a,g) BSE Image; (b,h) Al; (c,i) Ni; (d,j) Si; (e,k) Fe; (f,l) C.
Figure 5.
EPMA analysis results of reaction layers near the original steel interface in the specimens that were hot-dipped at 690 °C for 120 s for Al–7Ni–x wt % Si: (a–f) Al–7Ni–2 wt % Si; (g–l) Al–7Ni–6 wt % Si; (a,g) BSE Image; (b,h) Al; (c,i) Ni; (d,j) Si; (e,k) Fe; (f,l) C.
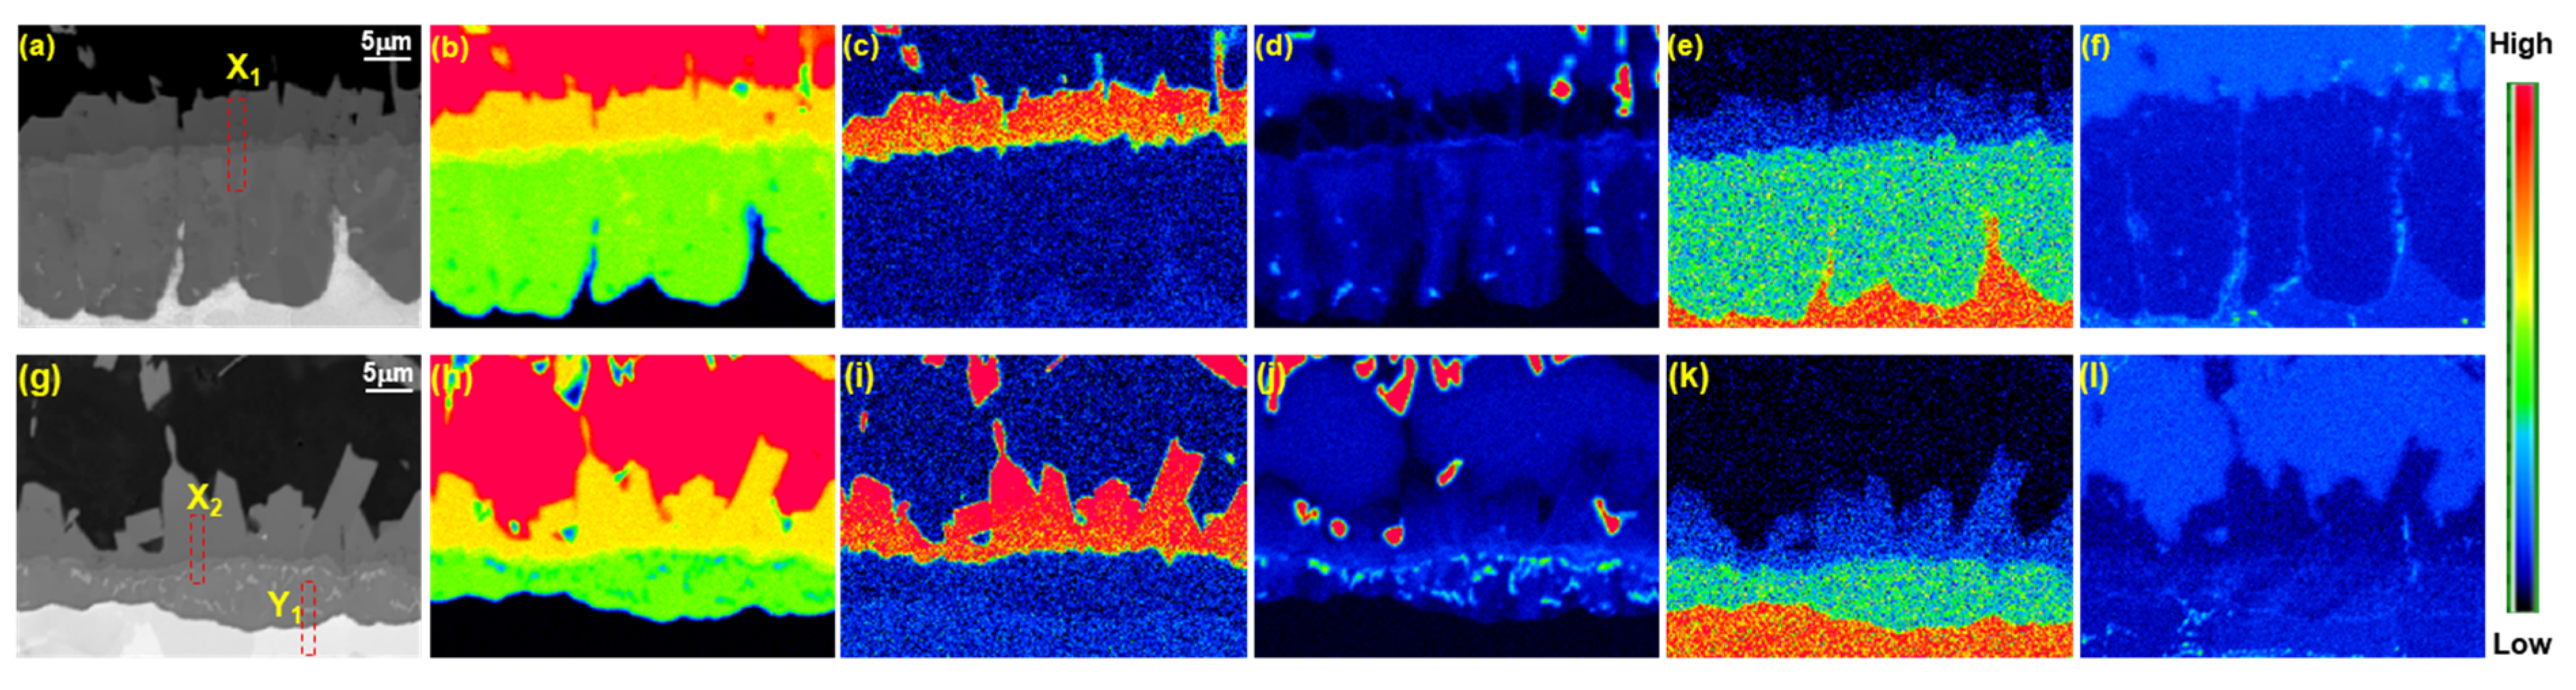
Figure 6.
STEM results showing the focused ion beam (FIB) specimen extracted from the area denoted by X1 in Figure 5: (a) high-angle annular dark-field (HAADF) image; (b–g) results of EDS: (b) Al, (c) Ni, (d) Si, (e) Fe, (f) Mn, (g) C; (h) black dot in h.
Figure 6.
STEM results showing the focused ion beam (FIB) specimen extracted from the area denoted by X1 in Figure 5: (a) high-angle annular dark-field (HAADF) image; (b–g) results of EDS: (b) Al, (c) Ni, (d) Si, (e) Fe, (f) Mn, (g) C; (h) black dot in h.

Figure 7.
Diffraction patterns obtained from areas denoted by 1–6 in Figure 6. (T: Al9FeNi; θ: FeAl3; τ1: Al2Fe3Si3; η: Fe2Al5.)
Figure 7.
Diffraction patterns obtained from areas denoted by 1–6 in Figure 6. (T: Al9FeNi; θ: FeAl3; τ1: Al2Fe3Si3; η: Fe2Al5.)

Figure 8.
STEM results showing the FIB specimen extracted from the area denoted by X2 in Figure 5. (a) HAADF Image; (b–g) Results of EDS (b) Al, (c) Ni, (d) b Si, (e) Fe, (f) Mn, (g) C; and (h) high magnification images of No. 2.
Figure 8.
STEM results showing the FIB specimen extracted from the area denoted by X2 in Figure 5. (a) HAADF Image; (b–g) Results of EDS (b) Al, (c) Ni, (d) b Si, (e) Fe, (f) Mn, (g) C; and (h) high magnification images of No. 2.
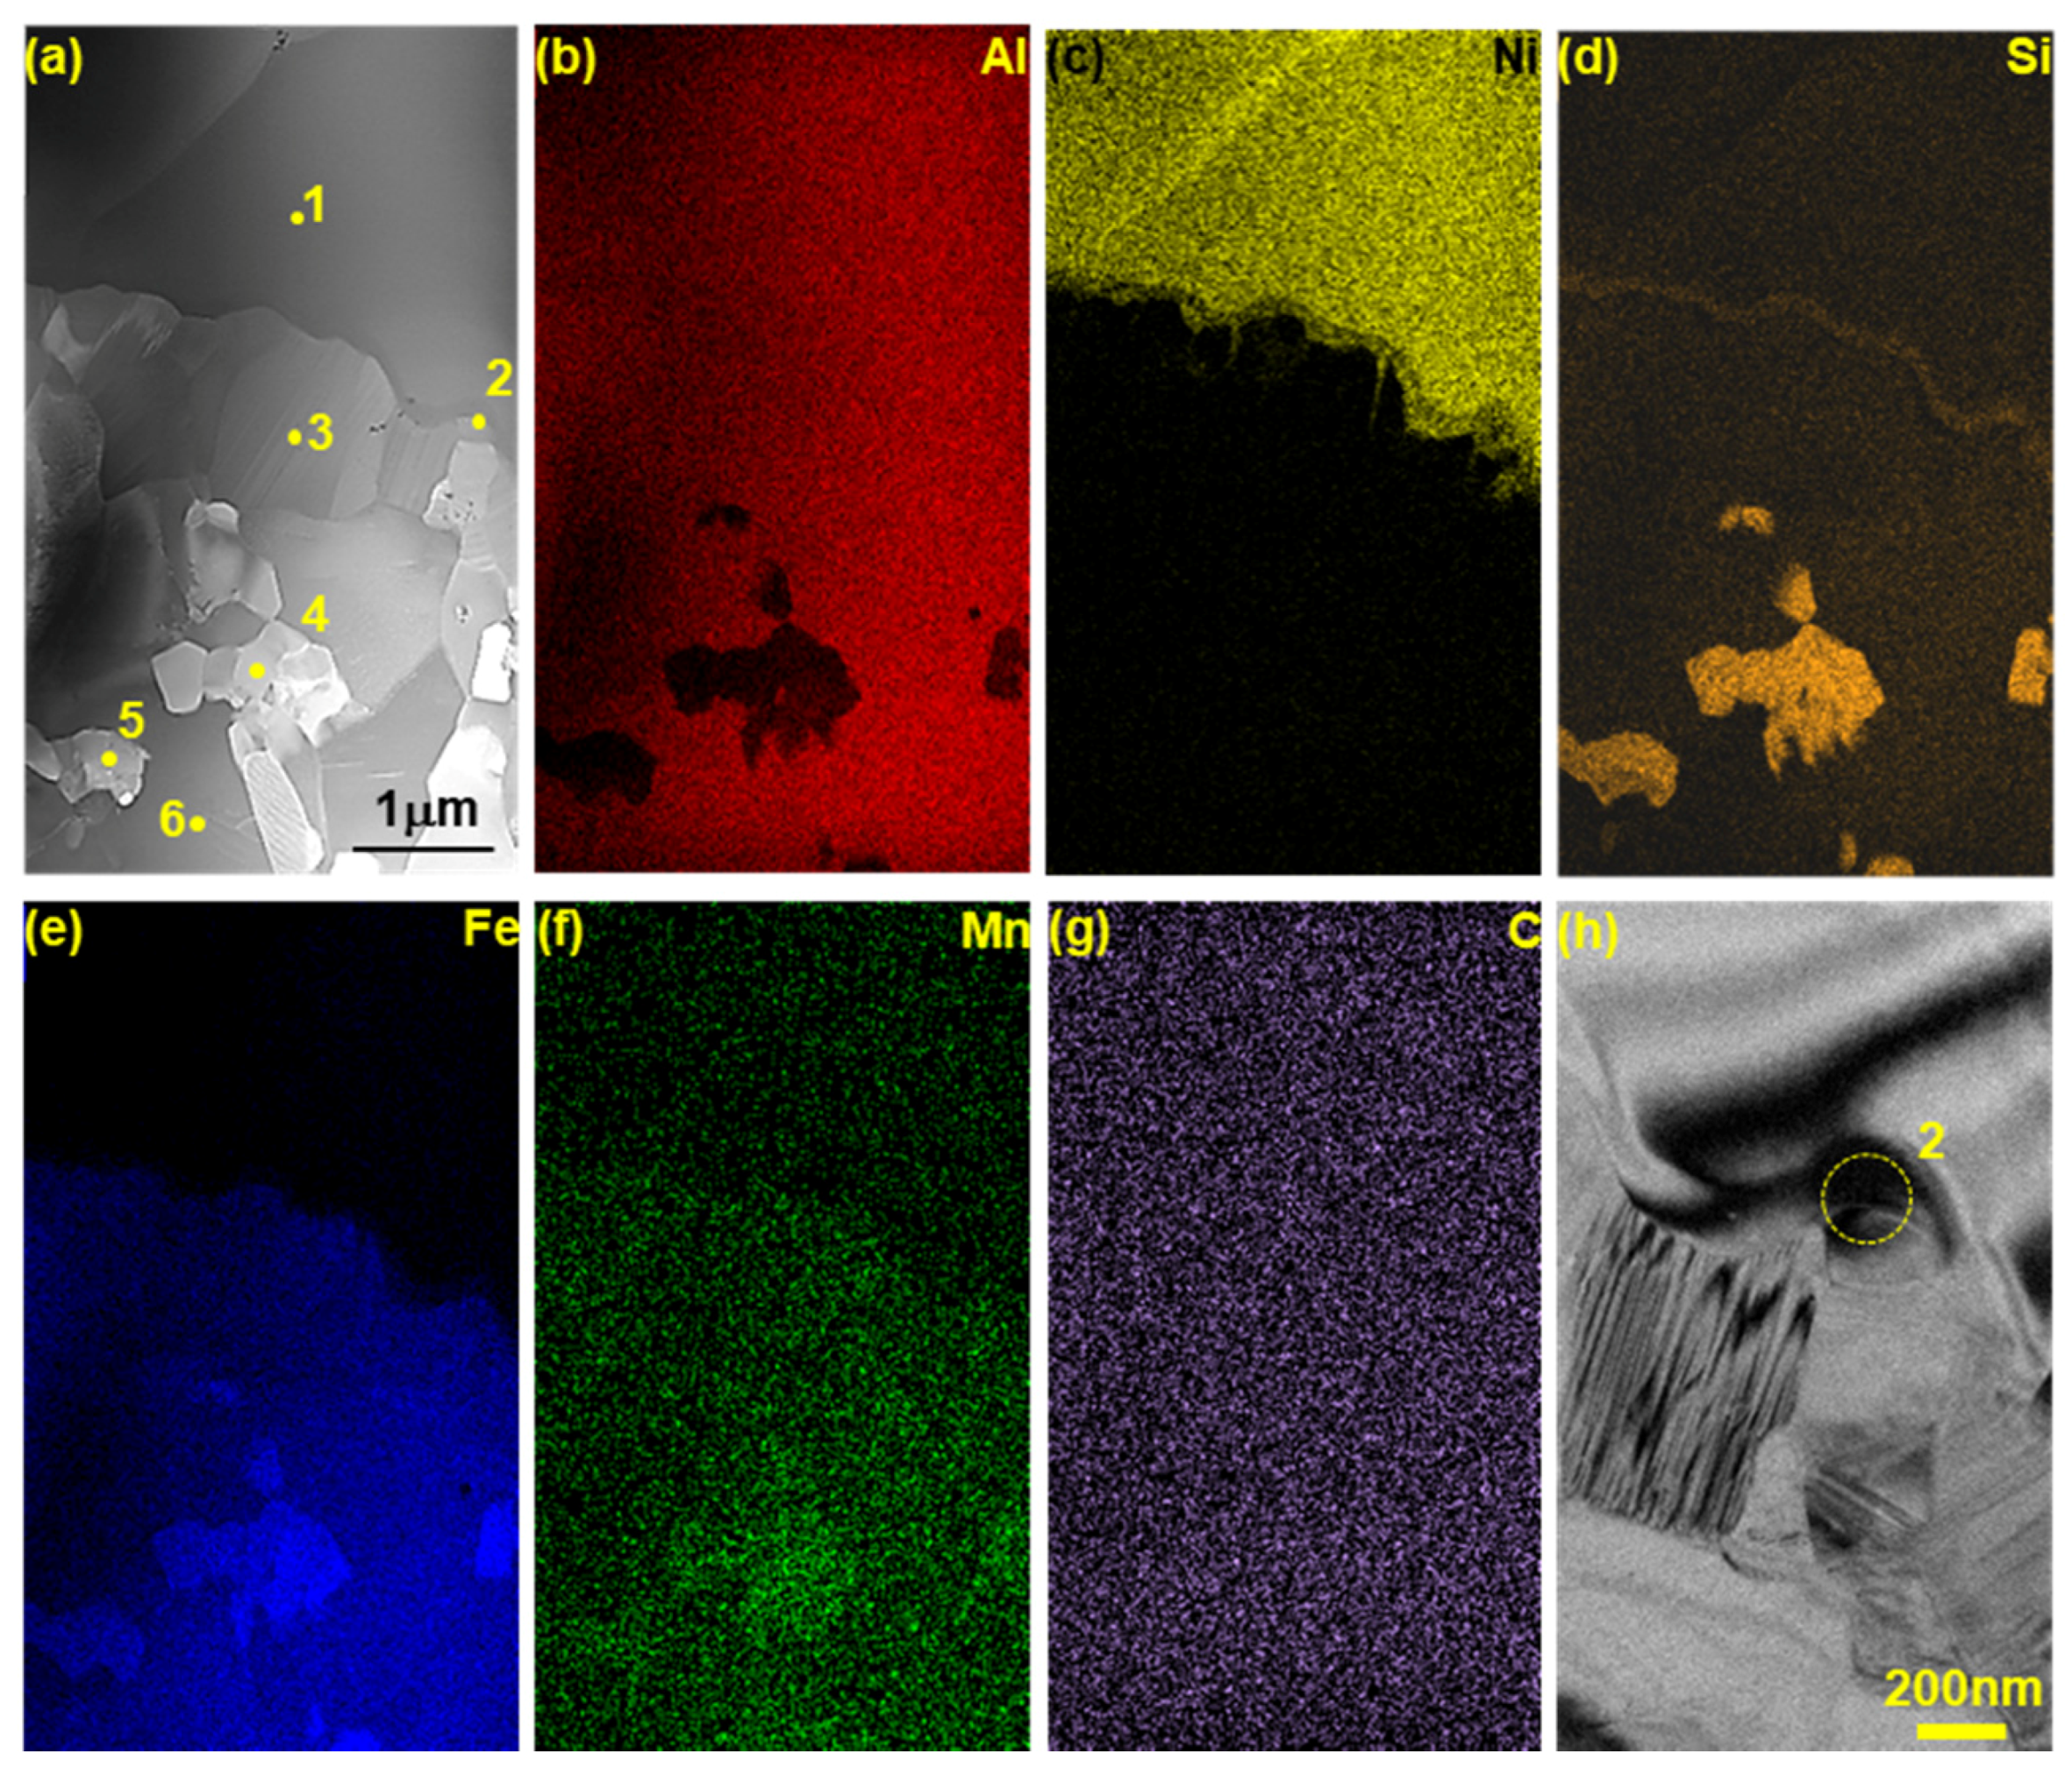
Figure 9.
Diffraction patterns obtained from areas denoted by 1–6 in Figure 8. (T: Al9FeNi; θ: FeAl3; Si*: Si (Fd-3m); τ1: Al2Fe3Si3; η: Fe2Al5).
Figure 9.
Diffraction patterns obtained from areas denoted by 1–6 in Figure 8. (T: Al9FeNi; θ: FeAl3; Si*: Si (Fd-3m); τ1: Al2Fe3Si3; η: Fe2Al5).

Figure 10.
STEM results showing the of FIB specimen extracted from the area denoted by Y1 in Figure 5. (a) HAADF Image; (b–g) results of EDS: (b) Al, (c) Ni, (d) Si (e) Fe, (f) Mn, and (g) C.
Figure 10.
STEM results showing the of FIB specimen extracted from the area denoted by Y1 in Figure 5. (a) HAADF Image; (b–g) results of EDS: (b) Al, (c) Ni, (d) Si (e) Fe, (f) Mn, and (g) C.

Figure 11.
Diffraction patterns obtained from areas denoted by 1–4 in Figure 10. (τ1: Al2Fe3Si3; η: Fe2Al5; α: Ferrite).
Figure 11.
Diffraction patterns obtained from areas denoted by 1–4 in Figure 10. (τ1: Al2Fe3Si3; η: Fe2Al5; α: Ferrite).

Figure 12.
Change in thickness of intermetallic compound depending on the amount of Si added based on the Al–7Ni wt % coating.
Figure 12.
Change in thickness of intermetallic compound depending on the amount of Si added based on the Al–7Ni wt % coating.
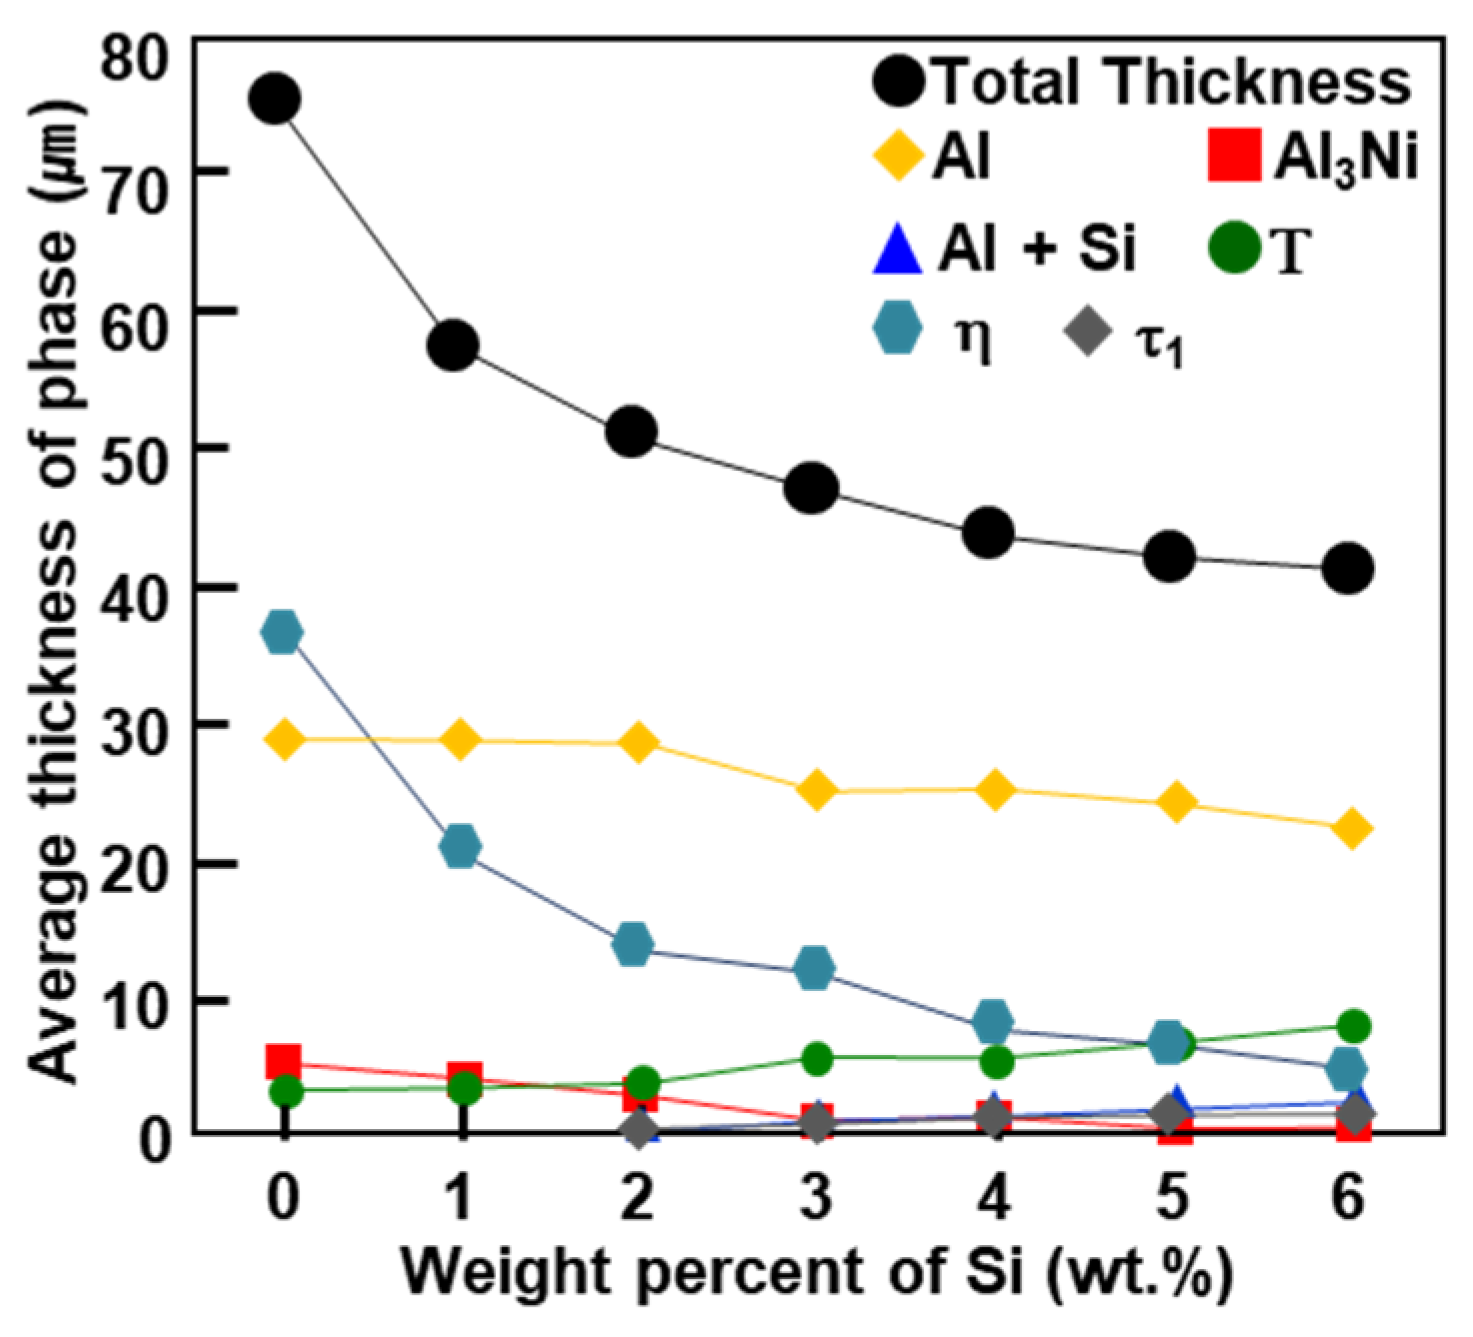
Figure 13.
Change of amount of phase depending on Si content in Fe2Al5 (η) phase composition.
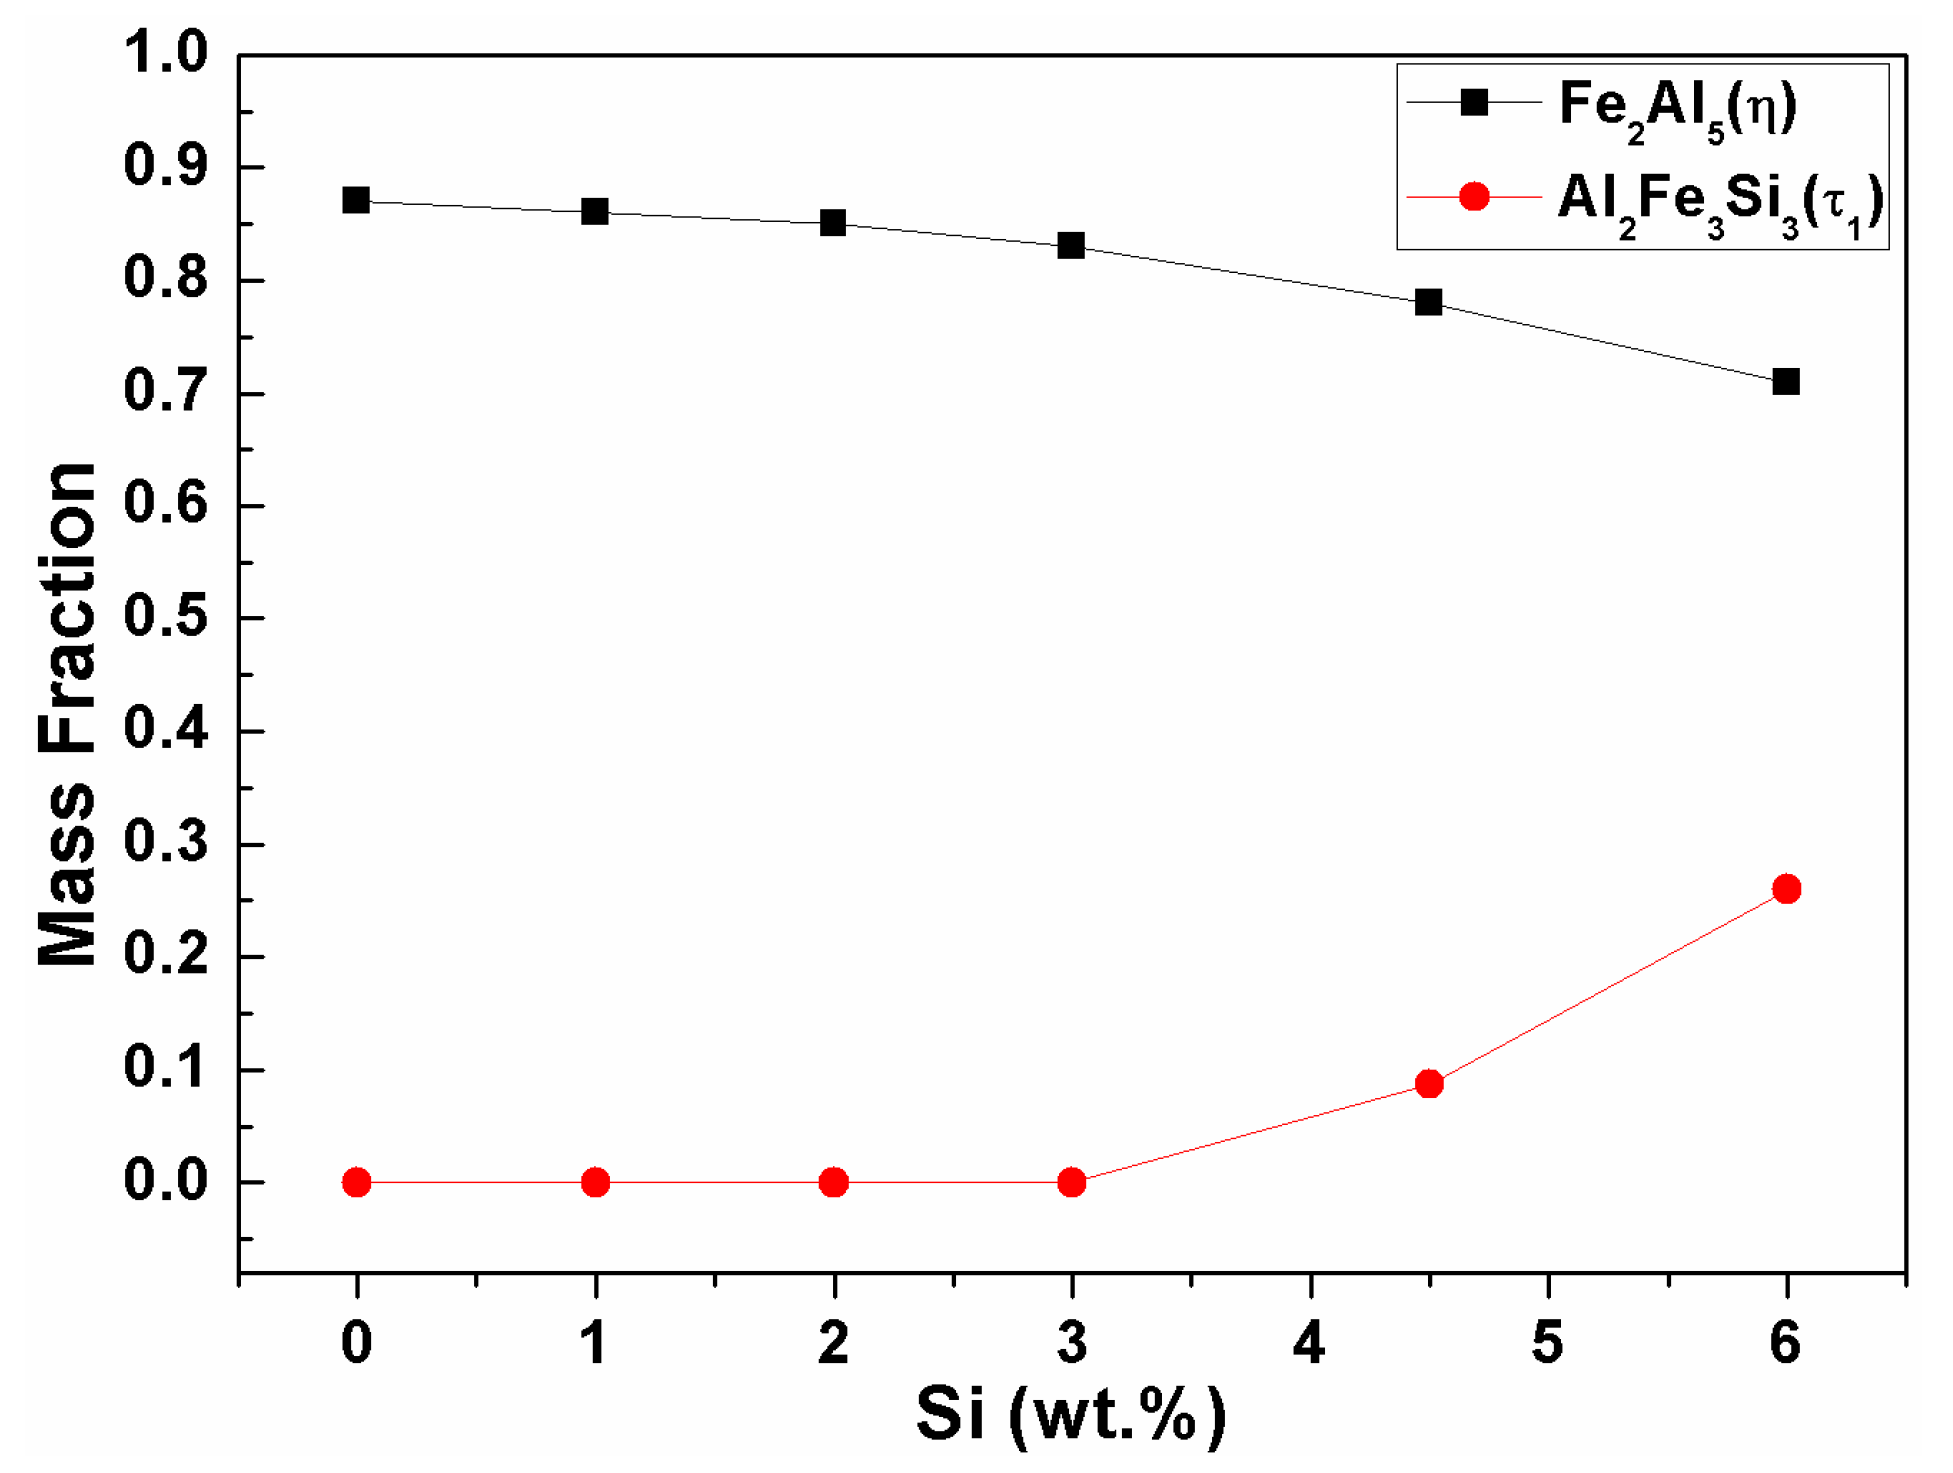
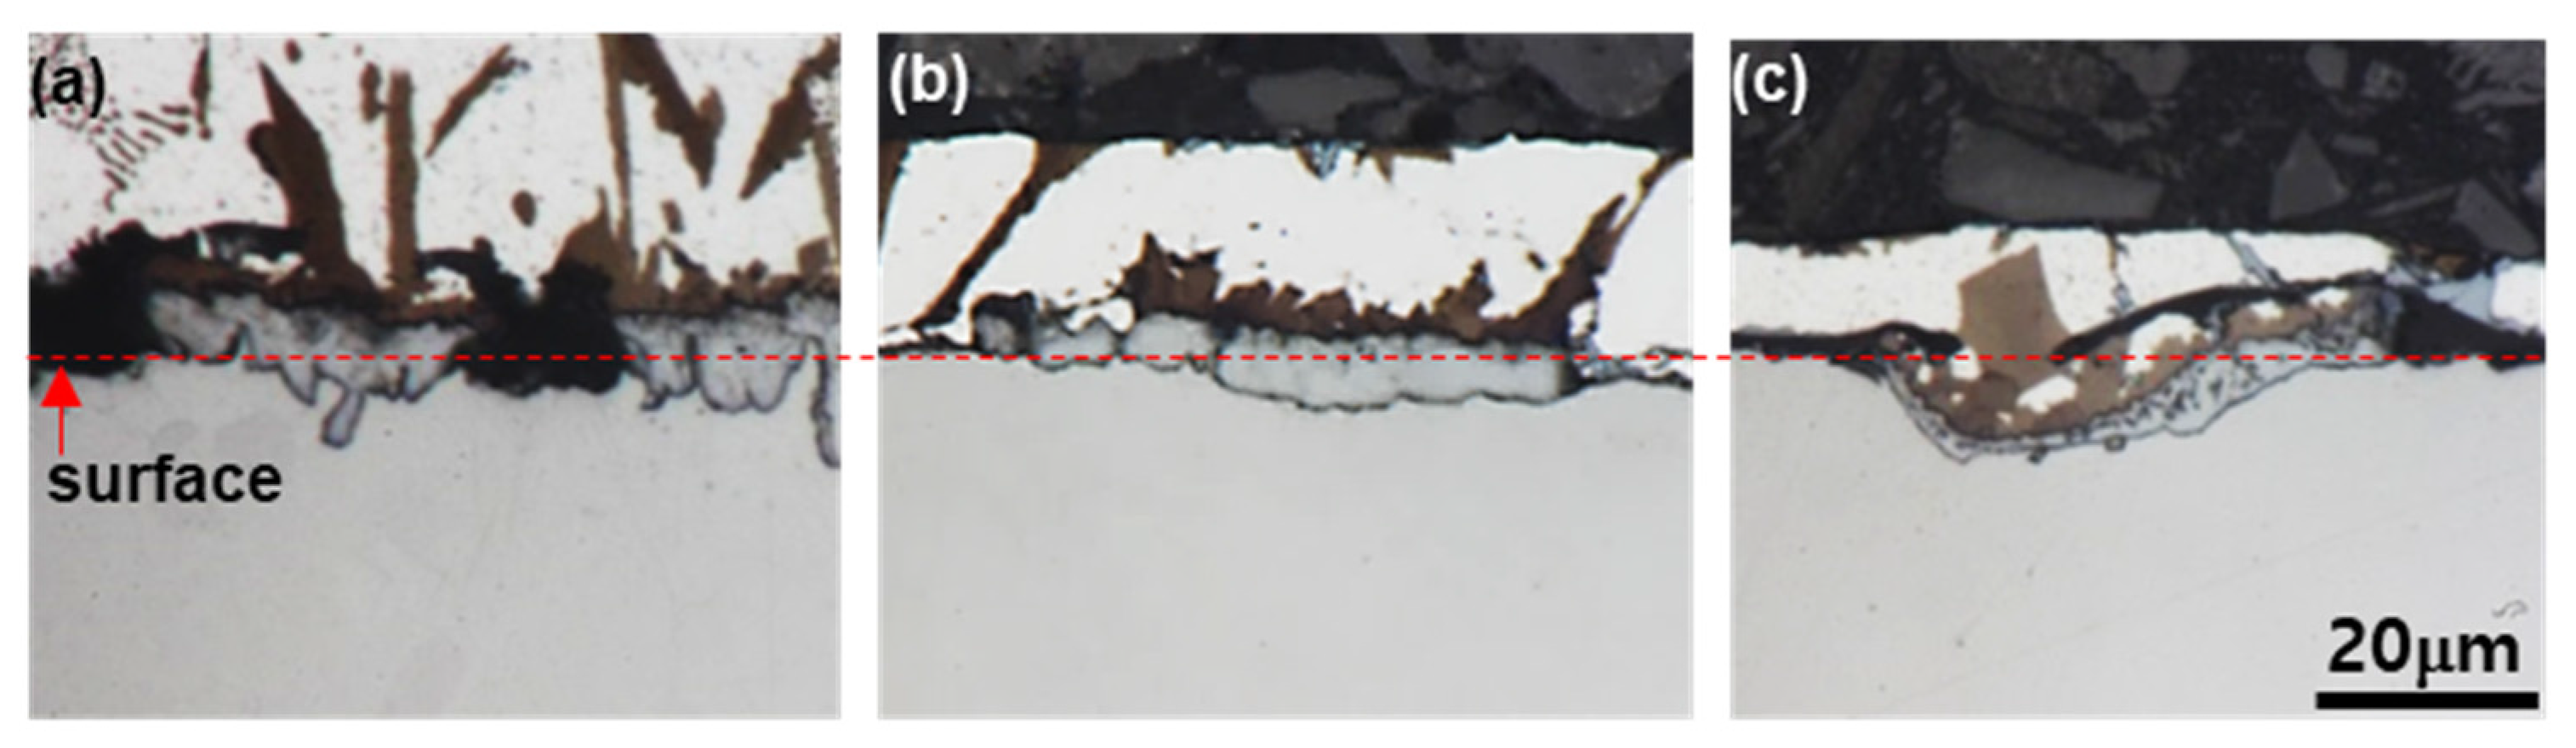
Figure 14.
Cross-sectional optical micrographs of specimens hot dipped at 690 °C for 40 s for depending on the amount of Si added based on Al–7Ni wt % coating: (a) 0 wt % Si; (b) 2 wt % Si; and (c) 6 wt % Si.
Figure 14.
Cross-sectional optical micrographs of specimens hot dipped at 690 °C for 40 s for depending on the amount of Si added based on Al–7Ni wt % coating: (a) 0 wt % Si; (b) 2 wt % Si; and (c) 6 wt % Si.

Figure 15.
Portion of Fe–Al–Si Phase diagram calculated by Thermo-Calc™.

Table 1.
Chemical composition (wt %) of Boron steel.
| C | Si | Mn | Cr | Nb | Ti | B | P | S | Fe |
|---|---|---|---|---|---|---|---|---|---|
| 0.229 | 0.238 | 1.189 | 0.183 | 0.004 | 0.036 | 0.002 | 0.002 | 0.002 | Bal. |
Table 2.
EDS analysis results and expected phases in the area indicated by 1–7 in Figure 2.
Table 2.
EDS analysis results and expected phases in the area indicated by 1–7 in Figure 2.
| No. | Chemical Composition (at %) | Expected Phase | |||||
|---|---|---|---|---|---|---|---|
| Al | Ni | Si | Fe | Mn | |||
| 1 | 1 | 98.33 | 0.69 | 0.60 | 0.38 | 0.49 | Al |
| 2 | 97.59 | 0.55 | 1.31 | 0.55 | 0.30 | ||
| 3 | 97.47 | 0.64 | 1.21 | 0.68 | 0.45 | ||
| 4 | 97.43 | 0.42 | 1.57 | 0.58 | 0.36 | ||
| 2 | 1 | 83.36 | 14.50 | 0.80 | 0.86 | 0.48 | Al3Ni |
| 2 | 76.51 | 22.32 | 0.27 | 0.59 | 0.32 | ||
| 3 | 74.94 | 23.23 | 0.96 | 0.58 | 0.29 | ||
| 4 | 84.43 | 13.20 | 1.06 | 0.82 | 0.49 | ||
| 3 | 1 | 86.83 | 11.27 | 0.72 | 0.81 | 0.37 | Al3Ni |
| 2 | 78.55 | 19.02 | 1.28 | 1.00 | 0.25 | ||
| 3 | 80.42 | 18.38 | 0.74 | 0.38 | 0.08 | ||
| 4 | 82.39 | 15.77 | 0.87 | 0.79 | 0.18 | ||
| 4 | 1 | 78.33 | 12.18 | 0.78 | 7.96 | 0.76 | Al9FeNi |
| 2 | 80.63 | 12.26 | 0.57 | 5.86 | 0.68 | ||
| 3 | 81.14 | 12.21 | 0.92 | 5.14 | 0.59 | ||
| 4 | 79.69 | 11.71 | 1.57 | 6.32 | 0.71 | ||
| 5 | 1 | 71.41 | 0.88 | 1.08 | 25.44 | 1.19 | Fe2Al5 |
| 2 | 75.00 | 1.08 | 0.90 | 22.09 | 0.93 | ||
| 3 | 75.44 | 0.00 | 1.45 | 22.92 | 0.20 | ||
| 4 | 71.01 | 0.36 | 2.92 | 25.45 | 0.16 | ||
| 5 | 69.90 | 0.50 | 3.65 | 25.77 | 0.18 | ||
| 6 | 1 | 74.48 | 0.59 | 24.42 | 0.5 | 0.01 | (Al,Si) |
| 2 | 50.42 | 0.56 | 48.46 | 0.54 | 0.02 | ||
| 7 | 1 | 53.69 | 0.35 | 16.98 | 28.75 | 0.23 | FeAlSi |
| 2 | 51.44 | 0.54 | 16.69 | 31.08 | 0.25 | ||
Table 3.
EDS results and suggested phases in the area denoted as 1–7 in Figure 6a.
Table 3.
EDS results and suggested phases in the area denoted as 1–7 in Figure 6a.
| at % | Al | Fe | Ni | Si | Mn | C | Expected Phase |
|---|---|---|---|---|---|---|---|
| 1 | 69.40 | 11.68 | 14.76 | 2.95 | 0.03 | 1.18 | Al9FeNi |
| 2 | 69.11 | 14.30 | 11.38 | 4.67 | 0.03 | 0.51 | Al9FeNi |
| 3 | 66.91 | 29.96 | 0.04 | 1.66 | 0.25 | 1.18 | Fe2Al5 |
| 4 | 61.08 | 34.42 | 0.03 | 2.98 | 0.40 | 1.09 | Fe2Al5 |
| 5 | 61.86 | 33.88 | 0.04 | 2.08 | 0.59 | 1.55 | Fe2Al5 |
| 6 | 34.52 | 41.21 | 0.15 | 19.72 | 0.73 | 3.67 | Al2Fe3Si3 |
| 7 | 62.77 | 25.27 | 0.70 | 10.11 | 0.65 | 0.50 | FeAl3 |
Table 4.
EDS results and suggested phases in the areas denoted as 1–6 in Figure 8a.
Table 4.
EDS results and suggested phases in the areas denoted as 1–6 in Figure 8a.
| at % | Al | Fe | Ni | Si | Mn | C | Expected Phase |
|---|---|---|---|---|---|---|---|
| 1 | 70.86 | 13.05 | 13.15 | 2.78 | – | 0.16 | Al9FeNi |
| 2 | 64.76 | 19.22 | 4.69 | 11.17 | – | 0.16 | FeAl3 |
| 3 | 63.80 | 30.01 | 0.07 | 3.81 | 0.41 | 1.90 | Fe2Al5 |
| 4 | 28.12 | 42.92 | 0.08 | 26.41 | 0.26 | 2.21 | Al2Fe3Si3 |
| 5 | 27.98 | 42.97 | – | 27.27 | 0.39 | 1.39 | Al2Fe3Si3 |
| 6 | 59.97 | 37.30 | 0.06 | 1.64 | 0.34 | 0.69 | Fe2Al5 |
Table 5.
EDS results and suggested phases in the area denoted as 1–4 in Figure 10a.
Table 5.
EDS results and suggested phases in the area denoted as 1–4 in Figure 10a.
| at % | Al | Fe | Ni | Si | Mn | C | Suggested Phase |
|---|---|---|---|---|---|---|---|
| 1 | 32.21 | 46.85 | 0.08 | 19.63 | 0.30 | 0.92 | Al2Fe3Si3 |
| 2 | 63.22 | 30.70 | – | 0.88 | 0.17 | 5.12 | Fe2Al5 |
| 3 | 0.09 | 97.74 | – | 0.68 | 1.09 | 0.40 | αFe |
| 4 | 0.05 | 77.12 | – | 0.14 | 5.38 | 17.32 | (Fe,Mn)3C |
© 2017 by the authors. Licensee MDPI, Basel, Switzerland. This article is an open access article distributed under the terms and conditions of the Creative Commons Attribution (CC BY) license (http://creativecommons.org/licenses/by/4.0/).
Share and Cite
MDPI and ACS Style
Yun, J.-G.; Lee, J.-H.; Kwak, S.-Y.; Kang, C.-Y. Study on the Formation of Reaction Phase to Si Addition in Boron Steel Hot-Dipped in Al–7Ni Alloy. Coatings 2017, 7, 186. https://doi.org/10.3390/coatings7110186
AMA Style
Yun J-G, Lee J-H, Kwak S-Y, Kang C-Y. Study on the Formation of Reaction Phase to Si Addition in Boron Steel Hot-Dipped in Al–7Ni Alloy. Coatings. 2017; 7(11):186. https://doi.org/10.3390/coatings7110186
Chicago/Turabian StyleYun, Jung-Gil, Jae-Hyeong Lee, Sung-Yun Kwak, and Chung-Yun Kang. 2017. "Study on the Formation of Reaction Phase to Si Addition in Boron Steel Hot-Dipped in Al–7Ni Alloy" Coatings 7, no. 11: 186. https://doi.org/10.3390/coatings7110186
Note that from the first issue of 2016, this journal uses article numbers instead of page numbers. See further details here.