
Nucleation and Growth of Intermetallic Compounds Formed in Boron Steel Hot-Dipped in Al–Ni alloy

1
Department of Material Science and Engineering, Pusan National University, Busan 46241, Korea
2
Department of Hybrid Materials and Machining technology, Graduate School of Convergence Science, Pusan National University, Busan 46241, Korea
*
Author to whom correspondence should be addressed.
Coatings 2017, 7(11), 195; https://doi.org/10.3390/coatings7110195
Submission received: 17 October 2017
/
Revised: 9 November 2017
/
Accepted: 10 November 2017
/
Published: 10 November 2017
(This article belongs to the Special Issue Innovative Coatings for Automotive Industry)
Abstract
:The formation mechanism of intermetallic compounds formed in boron steel hot-dipped in Al–7Ni (wt %) at 690 °С for 10–120 s was studied by identifying the intermetallic phases and investigating the growth process. Initially, a Fe3O4 oxide layer formed on the steel. The oxide layer separated into multiple layers sporadically; following this, the Al–Ni molten alloy permeated into the region of the oxide layer breakdown and formed the Al9FeNi (T, monoclinic, space group: P21/c) phase on the steel surfaces. The Al9FeNi (T) phase formed from the reaction between the Al–Ni molten alloy and Fe eluted from the steel; this phase not only acts as an Al interdiffusion channel, but also as a barrier for Fe; and facilitates only grain growth without a significant change in thickness. Inside the steel, the Fe2Al5 (η, orthorhombic, space group: Cmcm) phase grows along the c-axis in the [001] direction; and has a long columnar structure. The Fe3AlC (κ, Cubic, space group: Pm3m) phase is formed owing to a reduction in the Al concentration and the simultaneous diffusion and discharge of C toward the steel interface, as C cannot dissolve in the Fe2Al5 (η) phase.
1. Introduction
The application of advanced high-strength steels to vehicle bodies for improving the fuel efficiency in automobiles has recently gained momentum. Al–Si hot-dipped boron steel exhibits an aluminum segregation region along the bond line of the fusion zone when it is hot-stamped after laser welding; this region transforms into a ferrite with low hardness during the hot-stamping process. This newly formed ferrite acts as a notch in the tensile test, and is known to cause a decrease in the tensile strength and collision stability [1,2]. The conventional method to solve this problem is to remove the coating layer of the welded portion by using a laser ablation process, and then carry out the processes of welding and hot-stamping. In this study, apart from Si in the conventional Al–Si coating, Ni, which is an austenite-forming element, is also added to prevent the formation of ferrite in the fusion zone without the use of a laser ablation process.
The reaction between Fe and Al is known to form the Fe2Al5 (η) and FeAl3 (θ) phases [3,4,5,6]. Many studies focus on the intermetallic phase, as it determines the adhesiveness of the coating layer where crack propagation occurs [7,8]. Wei-Jen Cheng [9] compared the growth of the intermetallic phases formed in an aluminide/nickel duplex coating and pure Al coating. The η and θ phases were formed during pure Al dipping, while the aluminide/nickel duplex coating exhibited the η, θ, Ni2Al3, NiAl3, and (Fe,Ni)2Al9 phases. The growth rates of the η and θ phases formed in both cases did not differ significantly. Therefore, studies infer that Ni-intermetallic phases (Ni2Al3, NiAl3, and (Fe,Ni)2Al9) do not significantly affect the growth of η and θ phases. However, there is a limitation to the analysis of intermetallic phases formed during the Al–Ni alloy hot-dipping process, as no studies explain the nucleation and formation mechanism of the initial intermetallic phases.
In this study, boron steel was hot-dipped in Al–7Ni (wt %), with Ni as the austenite-forming element for 10–120 s at 690 °С; this was followed by phase identification and a detailed study of the nucleation and formation mechanisms of the intermetallic phases. This study is the basis for designing a coating layer that reduces the Al phase and increases the Ni phase, to improve the tensile strength in the fusion zone after welding and hot-stamping.
2. Materials and Methods
In this experiment, 1.2 mm boron steel with a chemical composition of Fe–0.23C–0.24Si–1.19Mn–0.002B (wt %) was used. Boron steel was pre-treated in the order of HCl + CH4OH, H2SO4 + distilled water, and CH4OH. The pre-treated specimens were heated at 150 °С, and then hot dipped into an Al–7Ni (wt %) molten alloy for 10–120 s. The hot-dipping was carried out at 690 °С, which does not exceed the A1 (703 °С) temperature of the steel. The coated specimens were polished along the normal direction using SiC sand paper and a mix of 1 µm diamond with 0.04 µm silica and etched in a HCl + distilled water solution. The Fe oxide layer formed on the steel was analyzed by X-ray diffraction (XRD, Ultima IV, Rigaku, Tokyo, Japan) at 20 kV. Optical microscopy (OM, BX-51M, Olympus, Tokyo, Japan) and scanning electron microscopy (SEM, SUPRA45, Carl Zeiss, Oberkochen, Germany) were used to observe the microstructures of the intermetallic compounds. The distribution of the elements in the intermetallic compounds was analyzed by electron probe micro-analysis (EPMA, JXA-8530F, JEOL, Tokyo, Japan) at 10 kV. Electron backscatter diffraction (EBSD, Hikari, EDAX, Mahwah, NJ, USA) was used to observe the phase distribution and crystal orientation of the intermetallic compounds. For the phase analysis of the nucleated intermetallic compounds, a thin sample was prepared by using the focused ion beam (FIB, FEI Scios, Thermo Fisher Scientific, Hillsboro, OR, USA) technique. Transmission electron microscopy (TEM, FEI TALOS F200X, Thermo Fisher Scientific, Hillsboro, Oregon, OR, USA) was performed using a 200 kV field emission transmission electron microscope for scanning transmission electron microscopy (STEM) imaging, selected area electron diffraction (SAED) and X-ray microanalysis electron dispersive spectrometer (EDS). The nucleation and growth of the intermetallic compounds were investigated by analyzing the phase diagrams obtained from the Thermo-Calc. software (Ver. 6.0).
3. Results
3.1. Nucleation of the Intermetallic Compounds
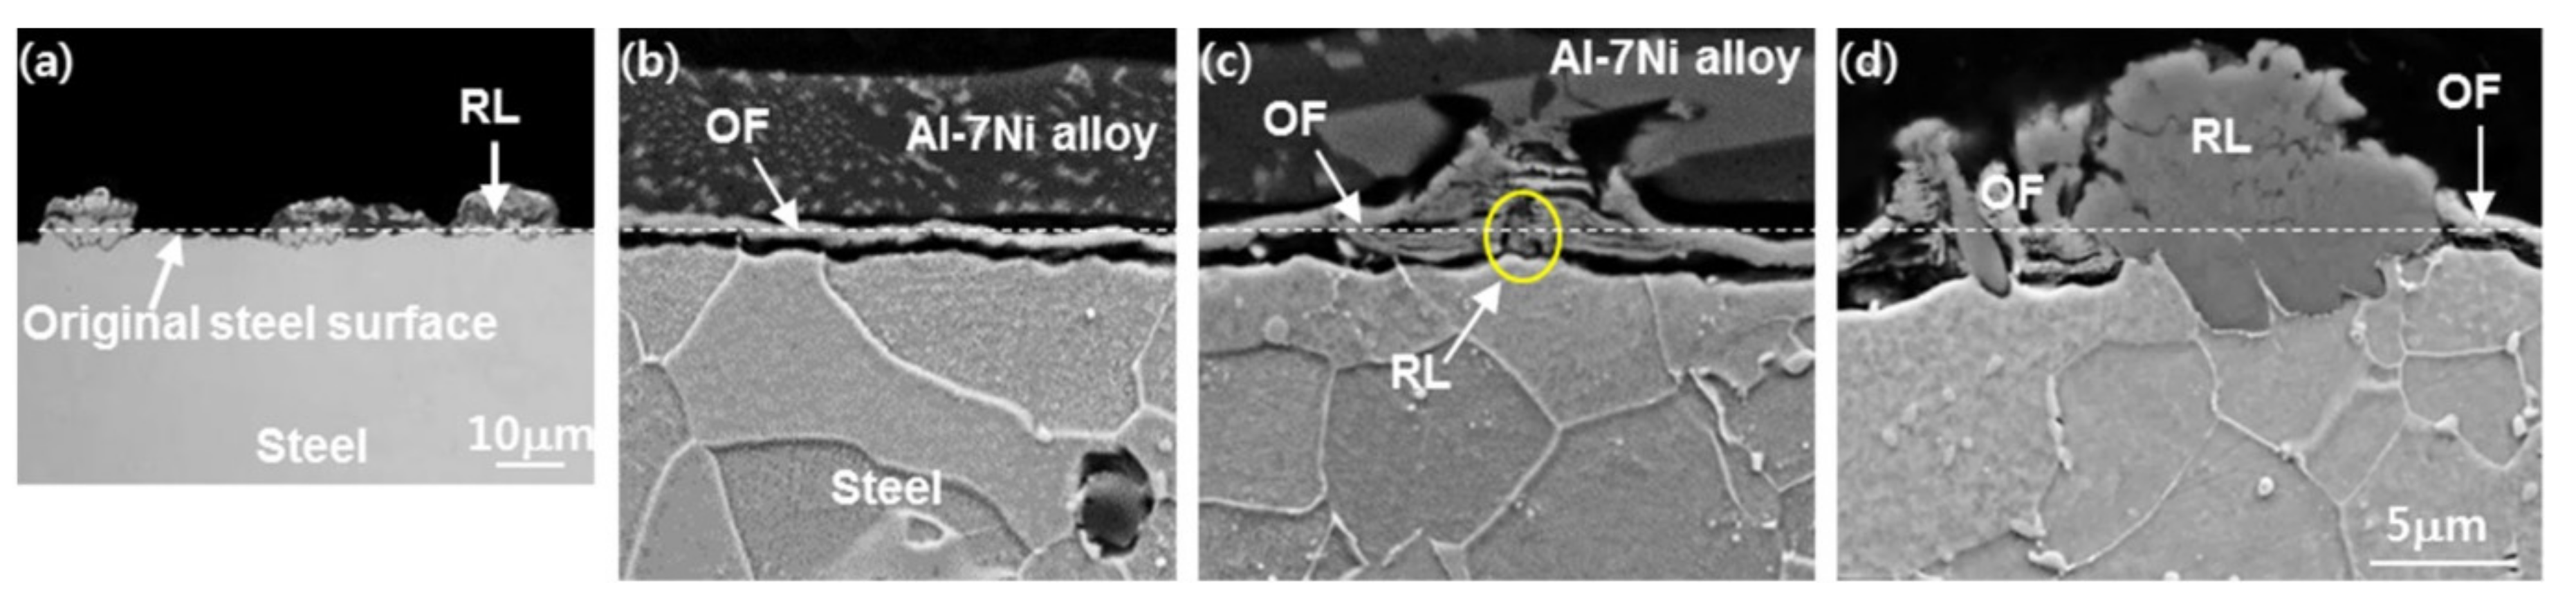
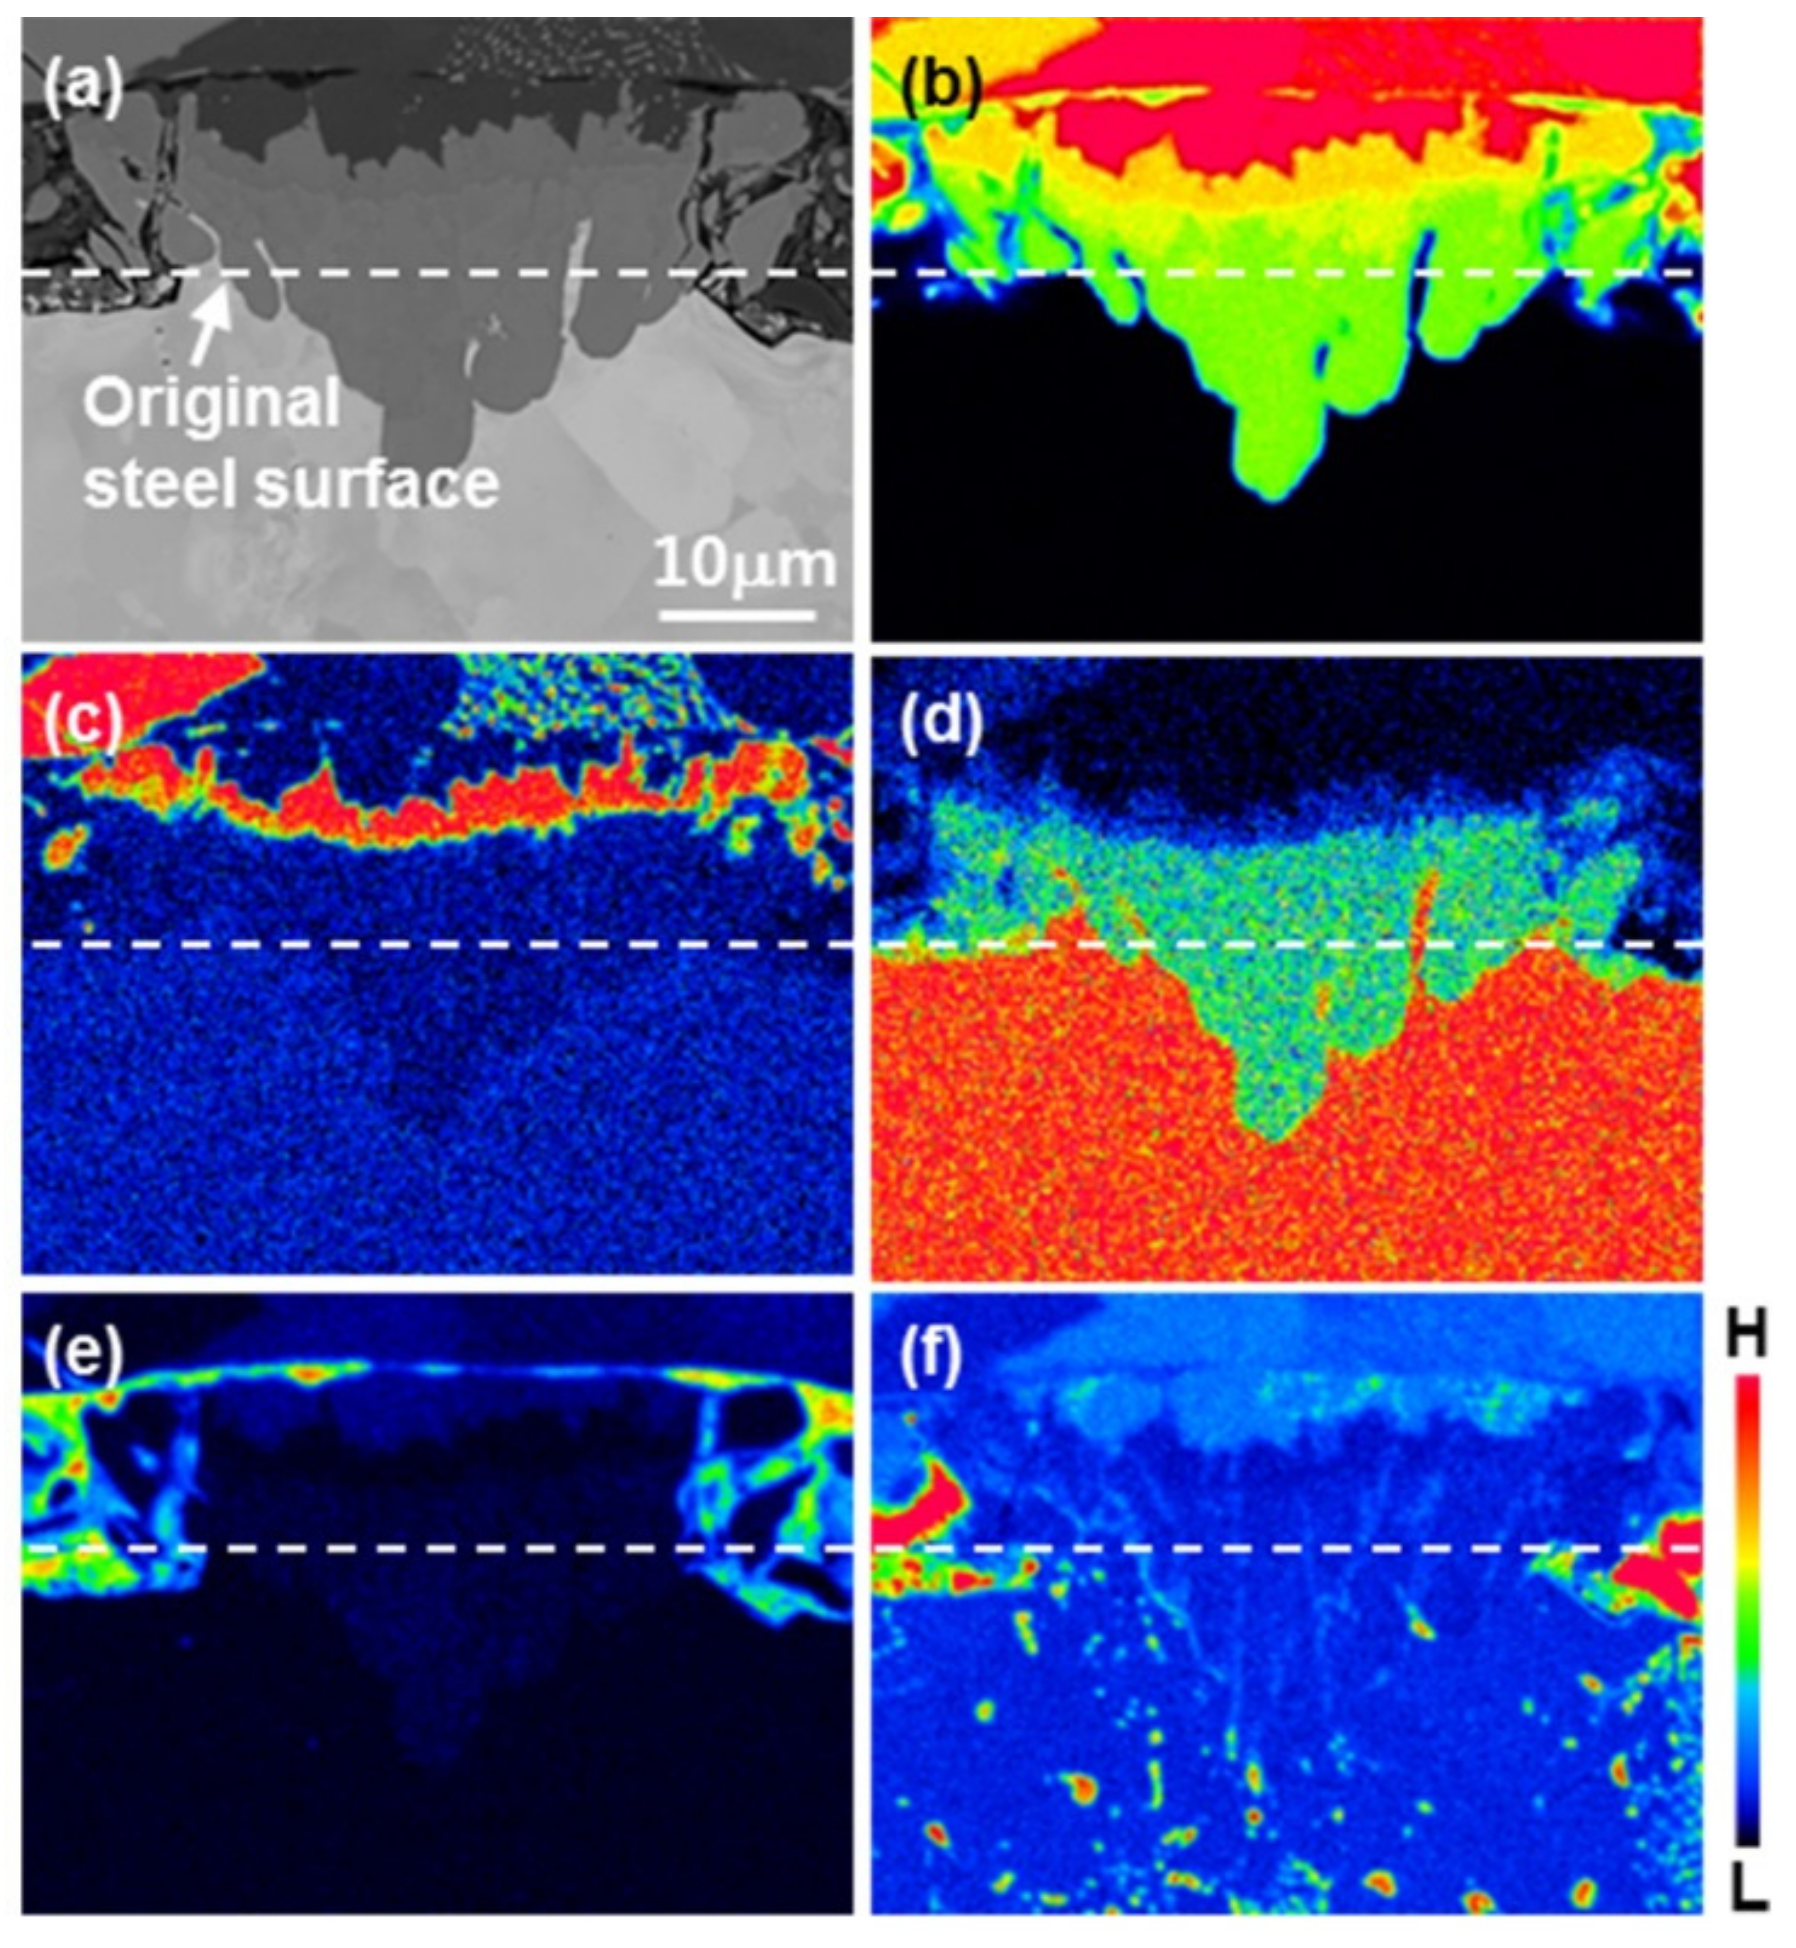
Figure 1a is a light microscope microstructure of the 10 s hot-dipped specimen, where the white line represents the original steel surface. Figure 1b–d are the SEM images taken at high magnifications to observe the various phases formed on the steel surface in an light microscope; Figure 1b is the SEM micrograph of the non-reacted area, and Figure 1c,d show the microstructures of the intermetallic compounds formed on the surface of the steel.
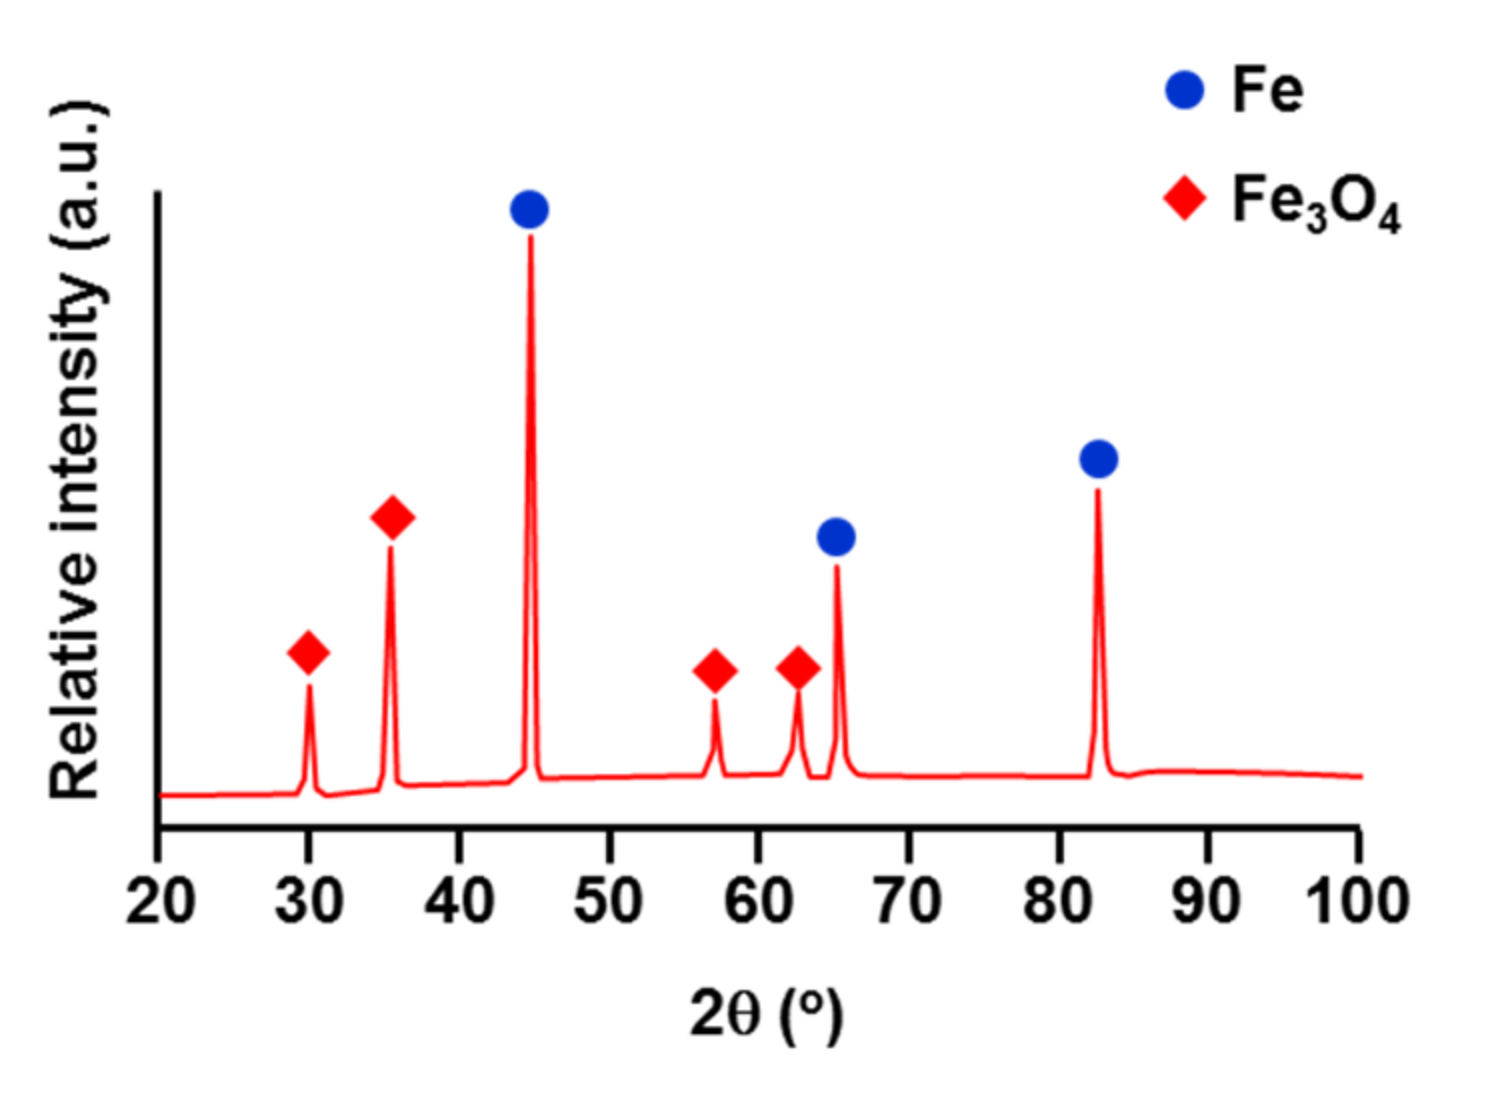
The oxide film band structure seen in Figure 1b was analyzed by EDS, the results for which are presented in Table 1. This layer is considered to be a Fe-based oxide layer, since the concentration of Fe and O are very high. XRD analysis of the steel surface without any intermetallic compounds revealed the presence of a Fe3O4 oxide layer (Figure 2). It is assumed that Fe3O4 formed by a reaction of the steel surface with the oxygen in the molten alloy.
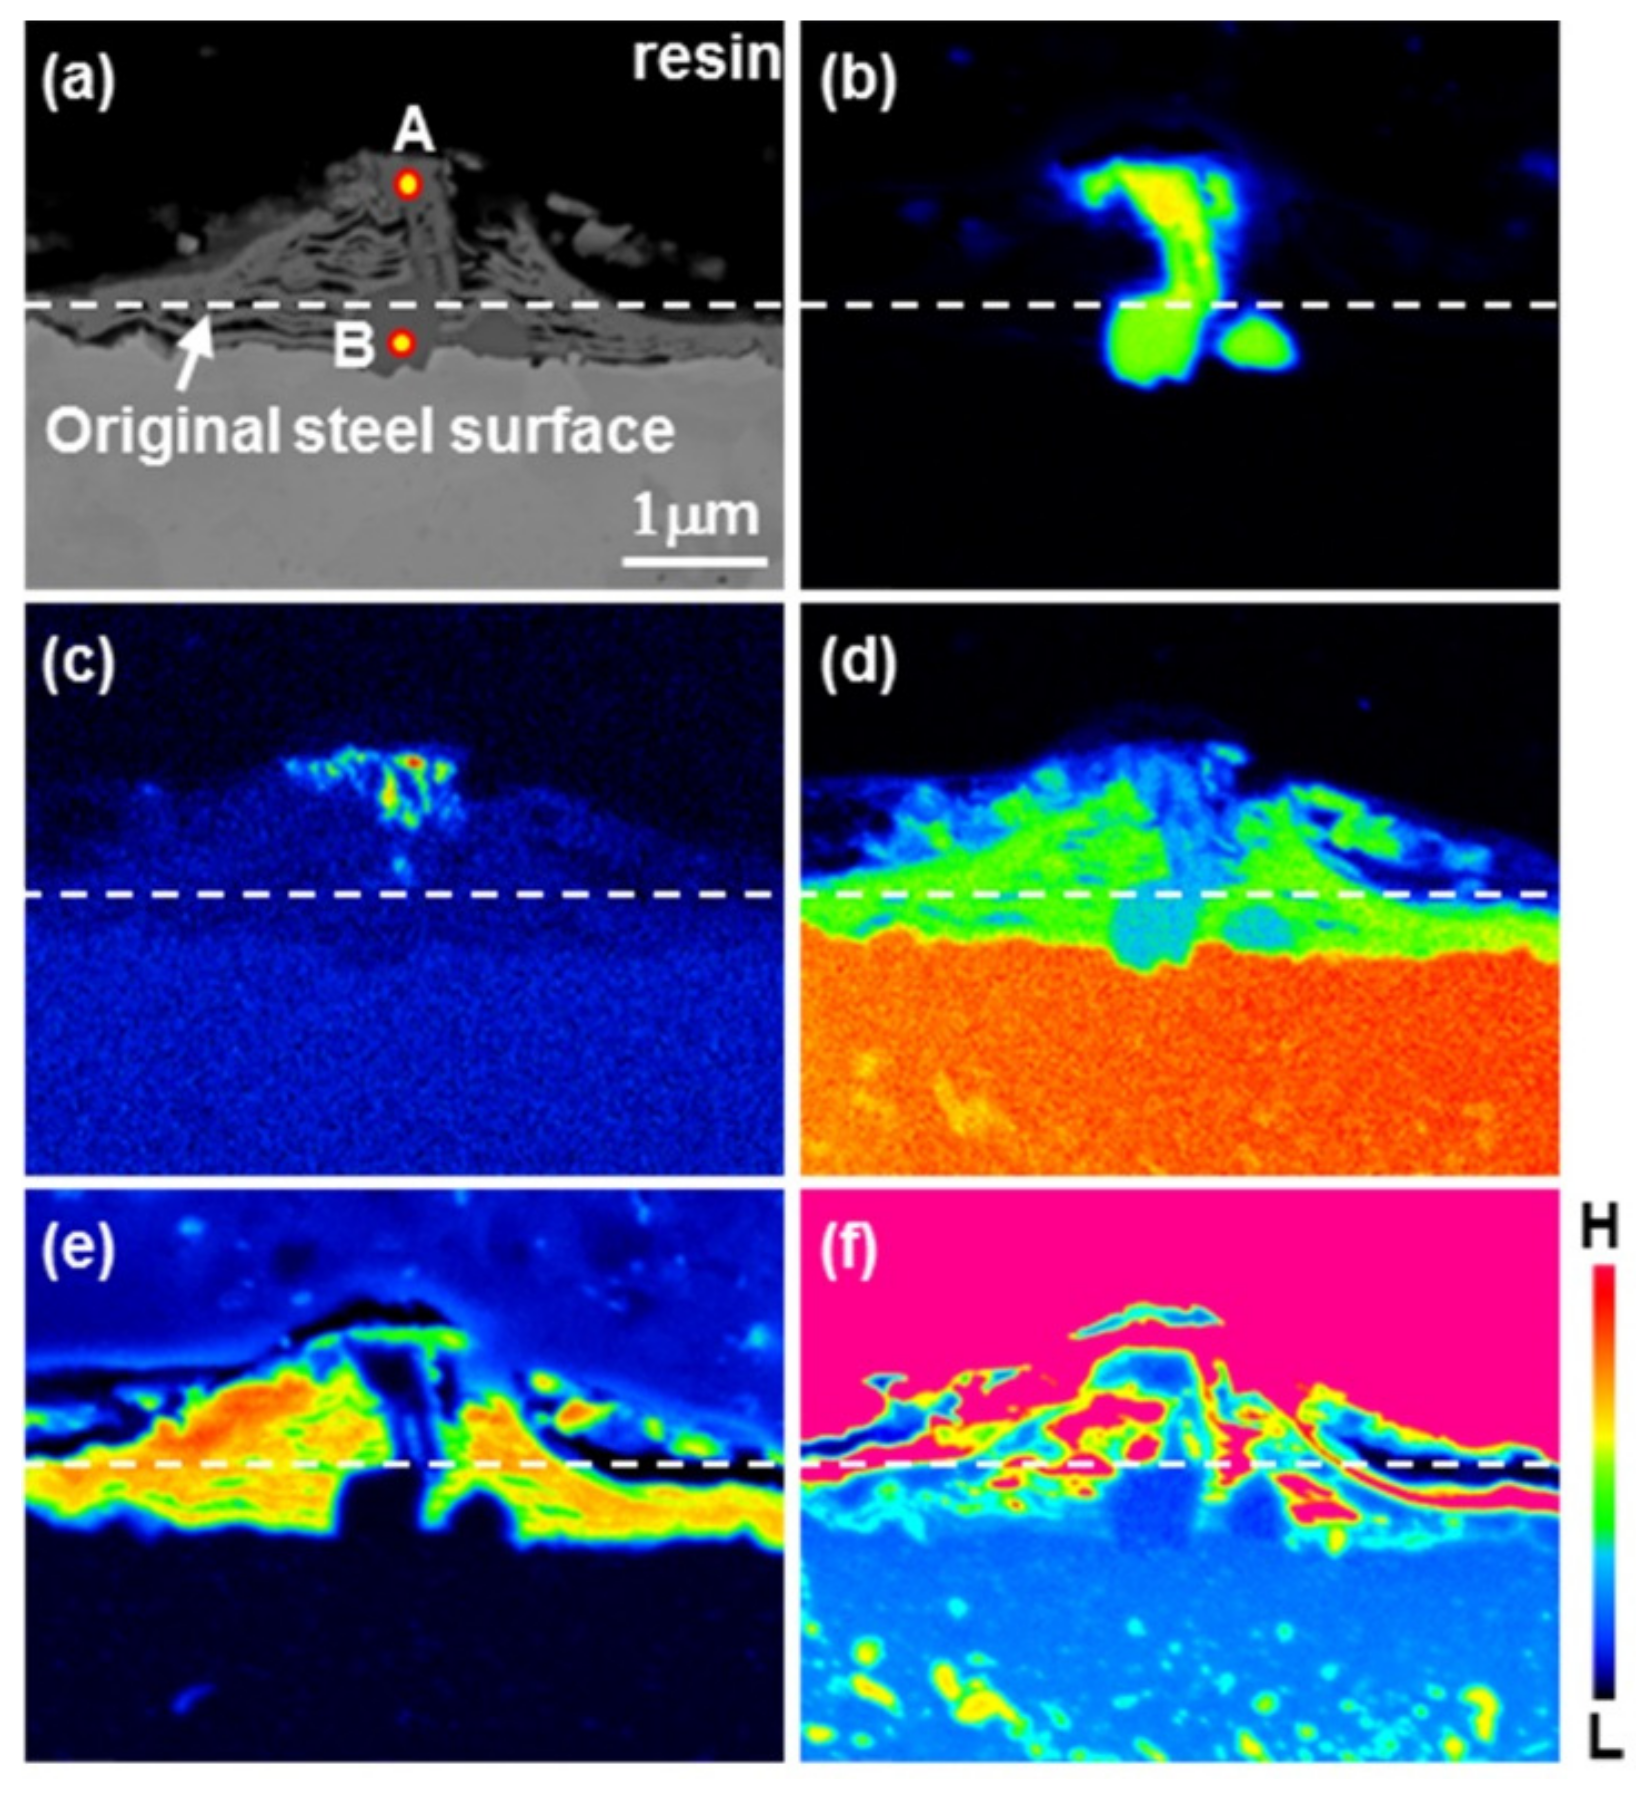
The EPMA analysis of the intermetallic compounds in Figure 1c shows the distribution of the steel components (Fe, C), the coating layer components (Al, Ni) and O (Figure 3). The oxide film, composed of Fe and O, separates into multiple layers and disintegrates. In addition, the liquid phase permeates into the region of the oxide film breakdown; this is verified because Al and Ni, the components of the coating alloy, are detected. Moreover, from the presence of Fe in the reacted phase, it can be confirmed that the intermetallic compounds are formed by a reaction between Fe eluted from the steel surfaces and the Al–Ni molten alloy. From the Al, Ni, and Fe concentration distributions, the intermetallic compounds appear to be divided into two regions. The intermetallic compounds near the liquid phase contain Al, Ni and Fe elements, while the phases of the intermetallic compounds near the surface of the steel are thought to be Ni-deficient and consist mainly of Al and Fe. Table 2 shows the results of the EDS microanalysis of the phases denoted as A and B in Figure 3a.
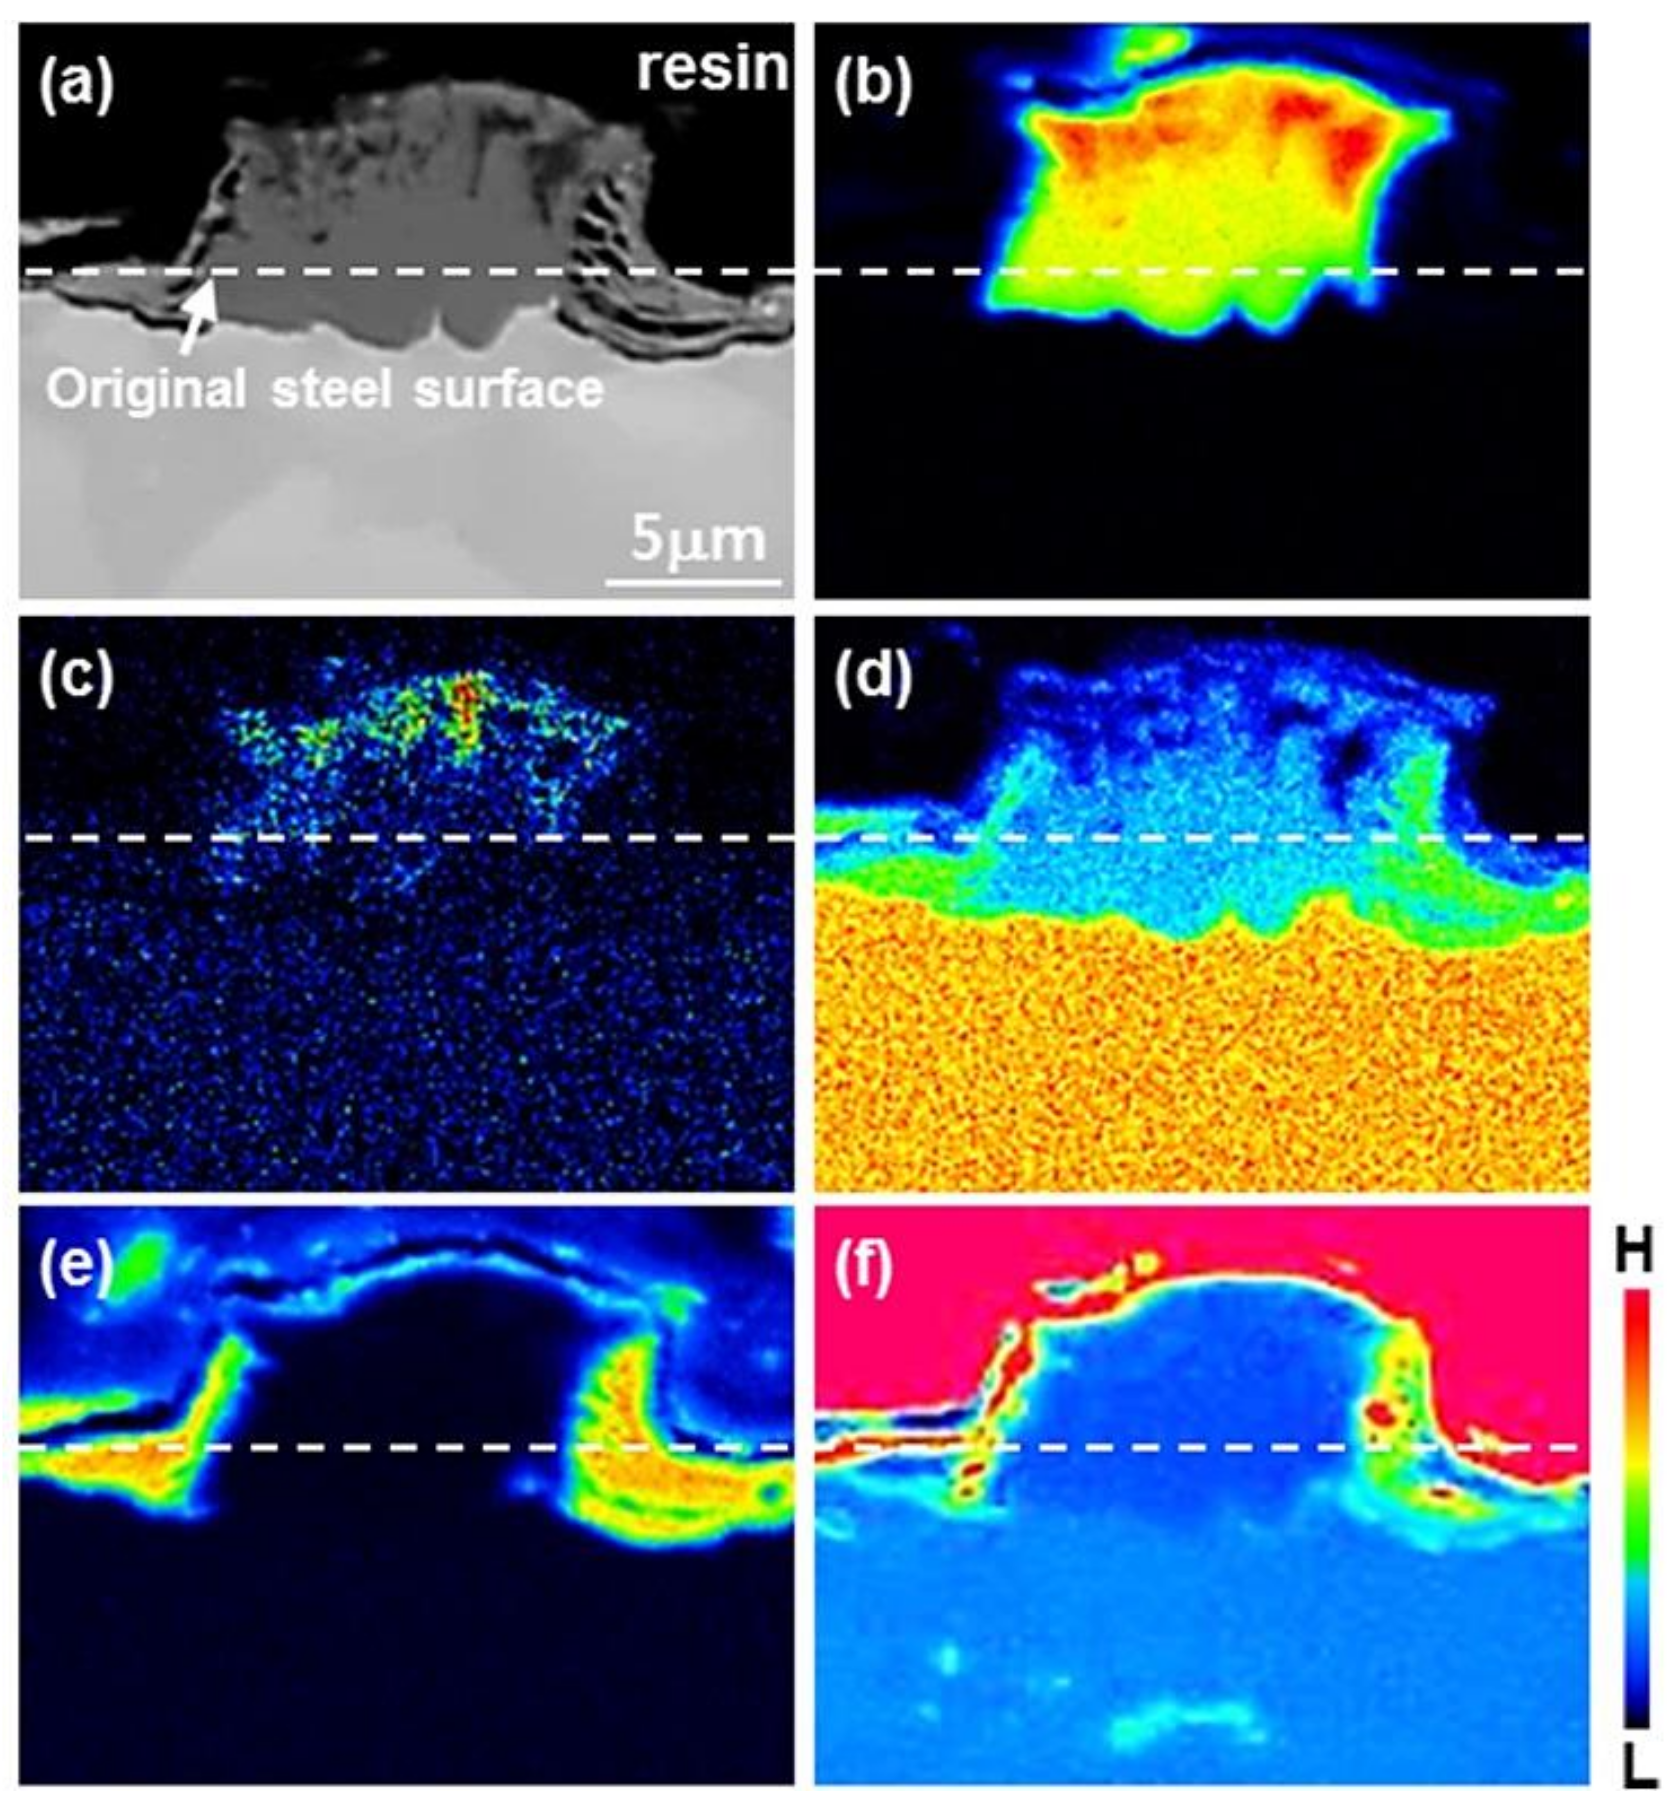
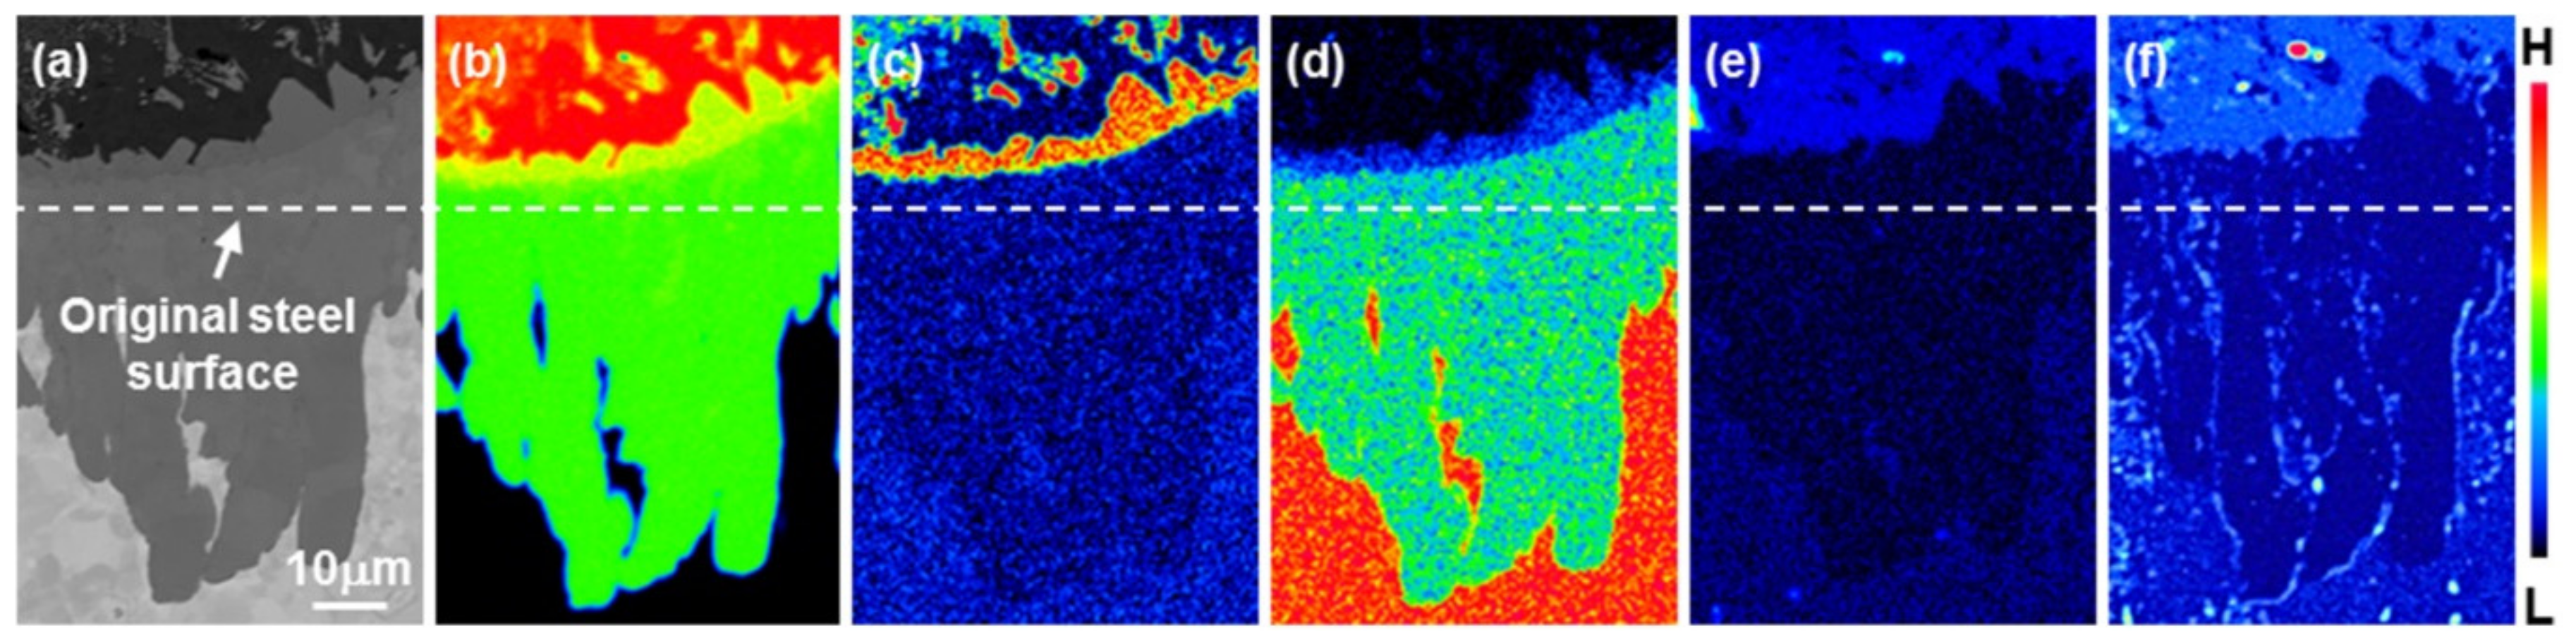
Figure 4 shows the results of the EPMA analysis by selecting a reaction similar layer to (d) of Figure 1. Since the concentration of O was high on the surface of the steel (except where the intermetallic compounds were formed) and no element other than Fe was present, the reaction did not take place, as Fe3O4 had not yet decomposed. The complete decomposition of Fe3O4 implies that a reaction between the liquid phase and the steel occurs, resulting in the growth of intermetallic compounds. The intermetallic compounds mainly grow toward the liquid phase from the surface of the steel, while there is a very minor growth into the steel. On one hand, the intermetallic compounds on the liquid phase have a high concentration of Al and Ni, but have a low Fe concentration, while on the other hand, the lower intermetallic compounds have a high concentration of Al and Fe, but contain little Ni. Also, a band-shaped phase consisting of Al and Fe is observed at the interface between the steel and the intermetallic compounds.
In order to identify the phases of the intermetallic compounds in Figure 4, the specimens were sampled in the X1 region shown in Figure 5a using a FIB and observed with TEM. However, the nucleated intermetallic compounds shown in Figure 3 were too small, and the presence of an oxide layer around it made it impossible to obtain the image of the TEM specimen. Figure 5b shows the TEM image of the specimen taken along the depth direction in Figure 5a, Figure 5c shows the specimen cut in order to observe the liquid region (area 1) and steel region (area 2). The STEM microstructure images shown in Figure 5d–e represent areas 1 and 2, respectively.
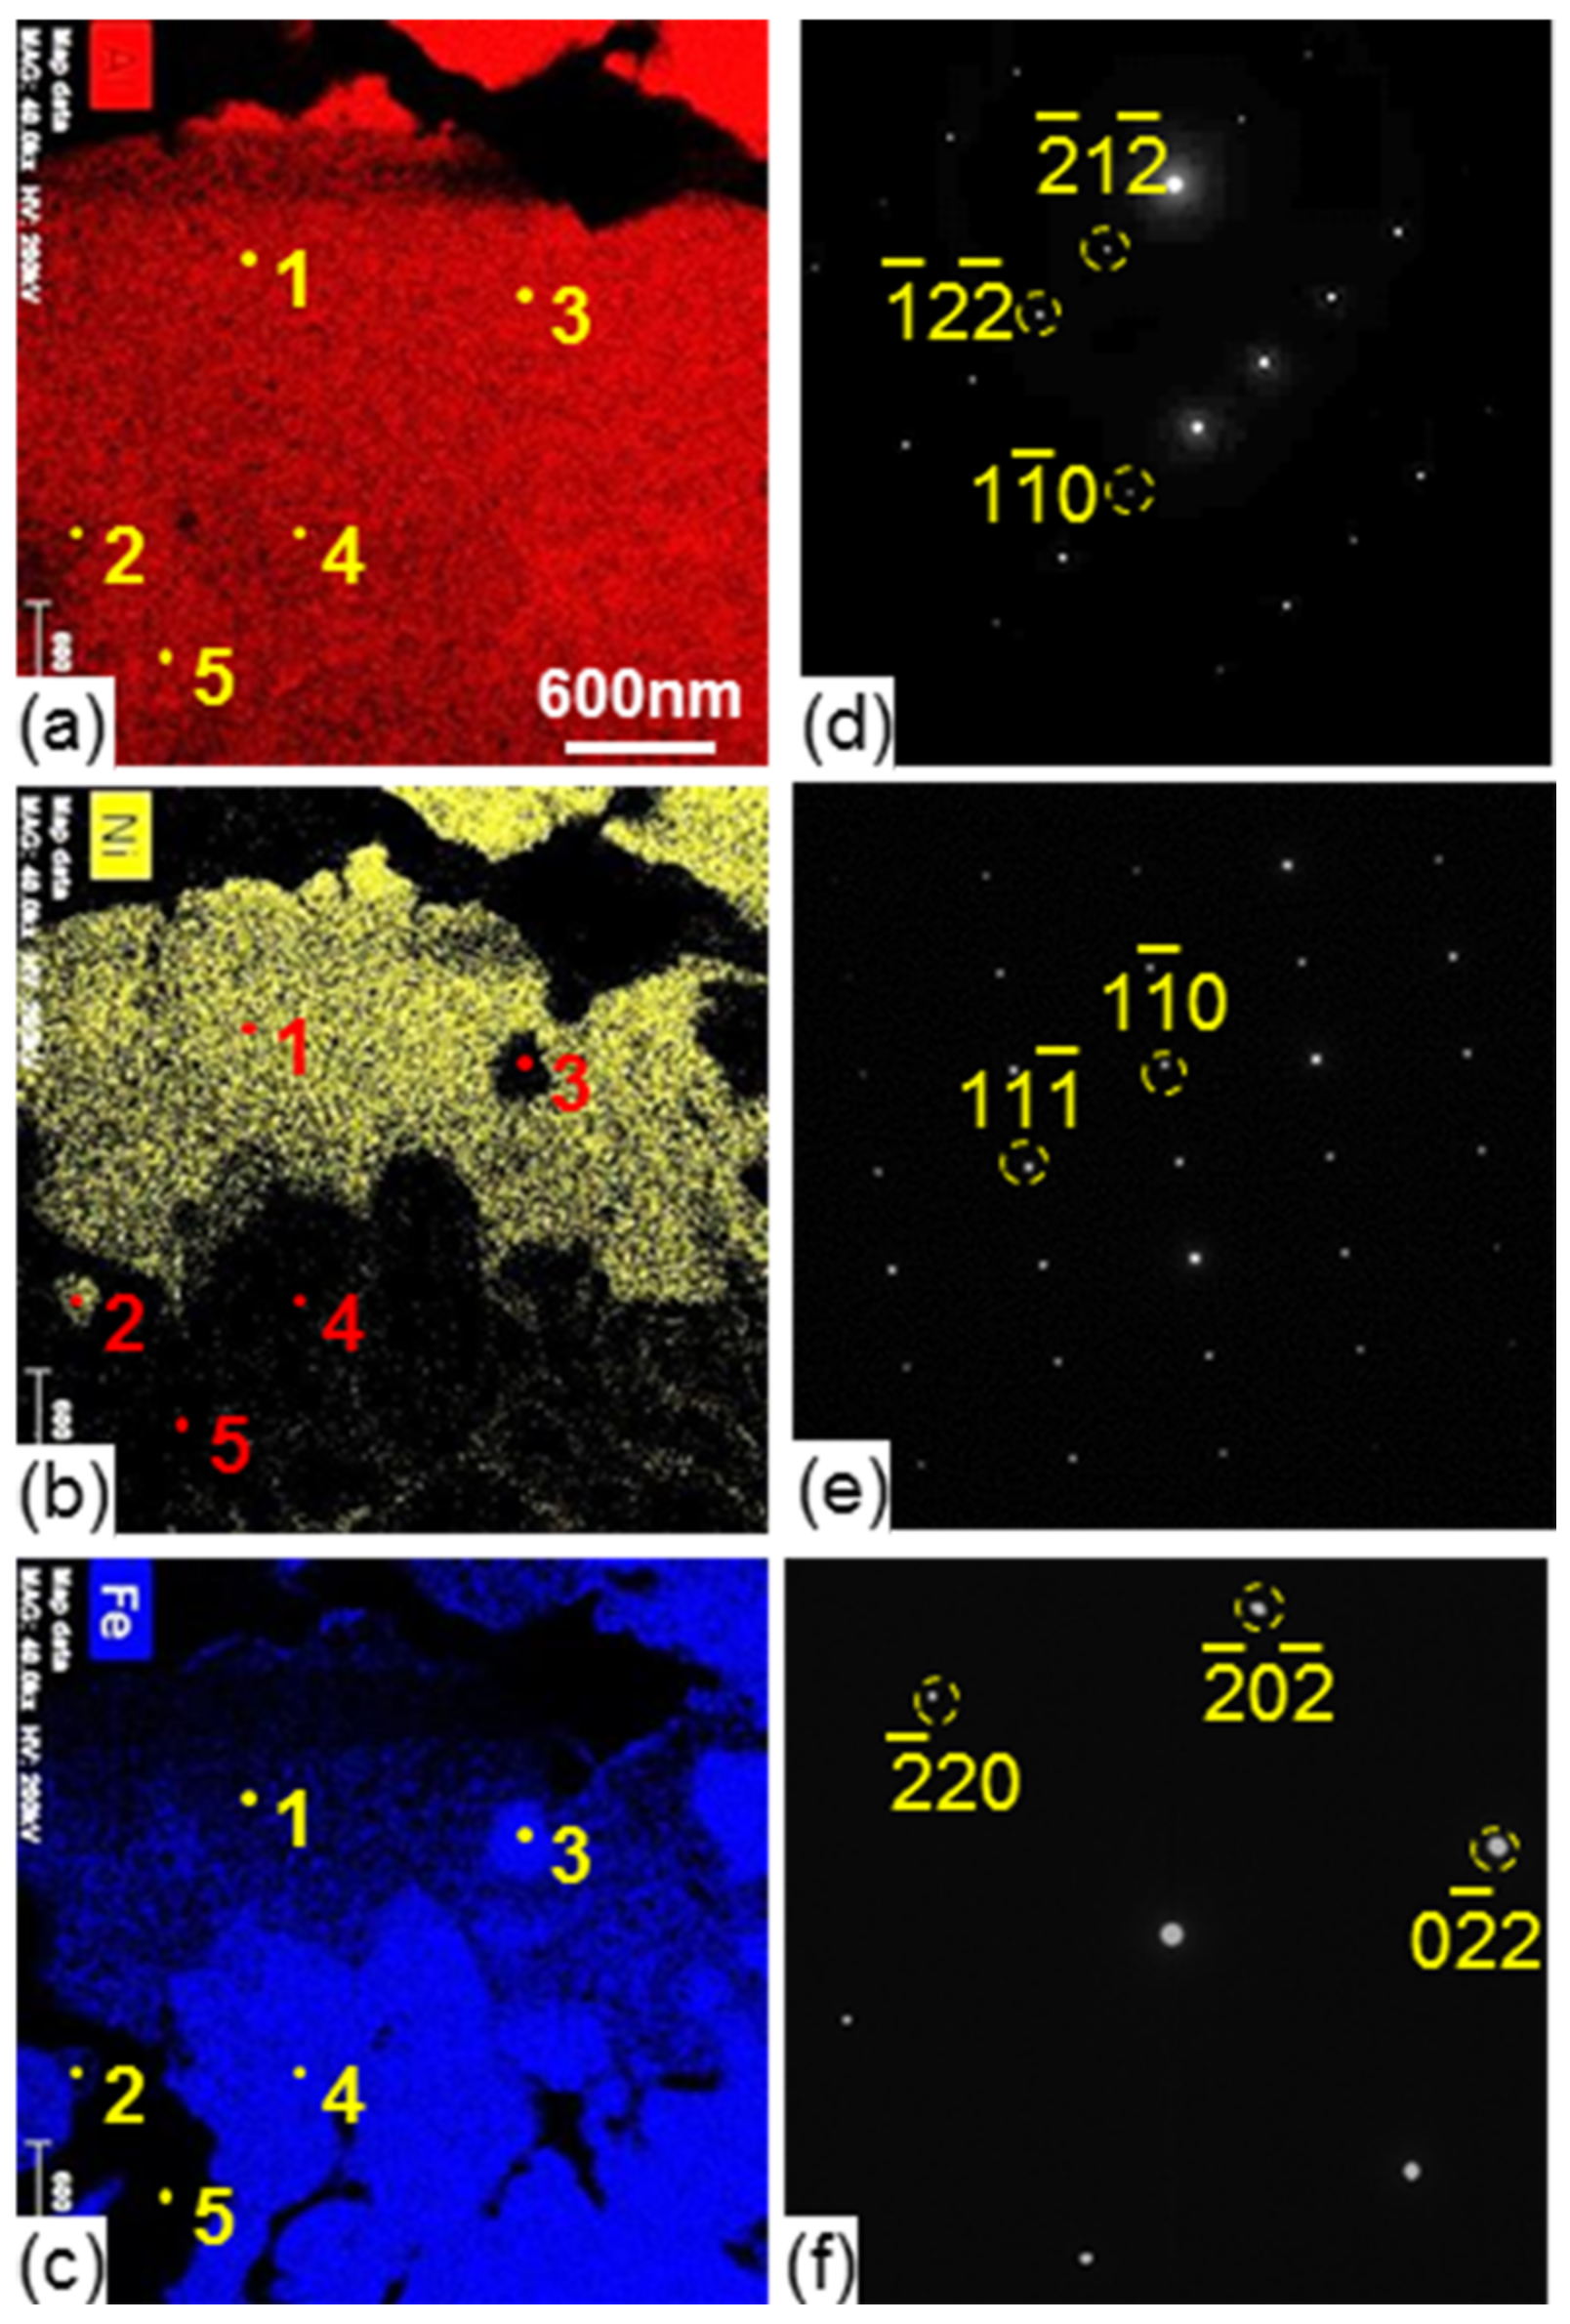
Figure 6a–c shows the results of the EDS microanalysis of the microstructures in Figure 5d with respect to Al, Ni, and Fe. Figure 6d–f shows the SAED patterns of each phase labeled as 1–5 and the results of the analysis. Table 3 shows the composition of each phase analyzed by EDS. The SAED patterns of the phases (1) and (2) containing Al, Ni, and Fe in the upper part of the intermetallic compounds confirmed the presence of the Al9FeNi (T) phase. Phases (3) and (4), composed of Al and Fe, were determined to be the Fe2Al5 (η) phase. The phase of (5) was found to be pure Al. The above results verify that most of the upper part of the intermetallic compounds was the Al9FeNi (T) phase (1, 2), mixed with some fine Fe2Al5 (η) phases (3, 4) and pure Al (5).
Figure 5e is a microstructure image of area 2 that shows the intermetallic compounds and the steel. Figure 4 shows a band-like phase, which indicates that the concentration of Al is lower than that of the Fe2Al5 (η) phase at the interface of the steel/intermetallic compound (η-phase), with a lower Fe concentration than the steel. To identify this phase, the area marked as X2 in Figure 5e was magnified to analyze the image.
Figure 7a is the microstructure, Figure 7b–f are the results of the EDS analysis, and Figure 7g–i are the results of the analysis of the SAED patterns of the phases (numbered from 9 to 12). Table 4 shows the compositions of the phases in Figure 5e and Figure 7a, as analyzed by EDS. In Table 4, phases 6–10 present in the intermetallic compounds consist of Al and Fe with a composition of 69–74 at % Al and 30–25 at % Fe. The results of the analysis of the SAED patterns numbered 9 and 10 in Figure 7 indicate the presence of the Fe2Al5 (η) phase. At the interface between the steel (11) and the Fe2Al5 (η) phase (9, 10), as shown in Figure 7a, a very thin intermetallic compound with a thickness of several nm is formed. This phase revealed that the Al content in it was lower than that in the Fe2Al5 (η) phase, the Fe content was lower than that in the steel, and C was higher in concentration than that in the steel (Table 4). From the SAED pattern and its interpretation (i), this phase was found to be the Fe3AlC (κ) phase.
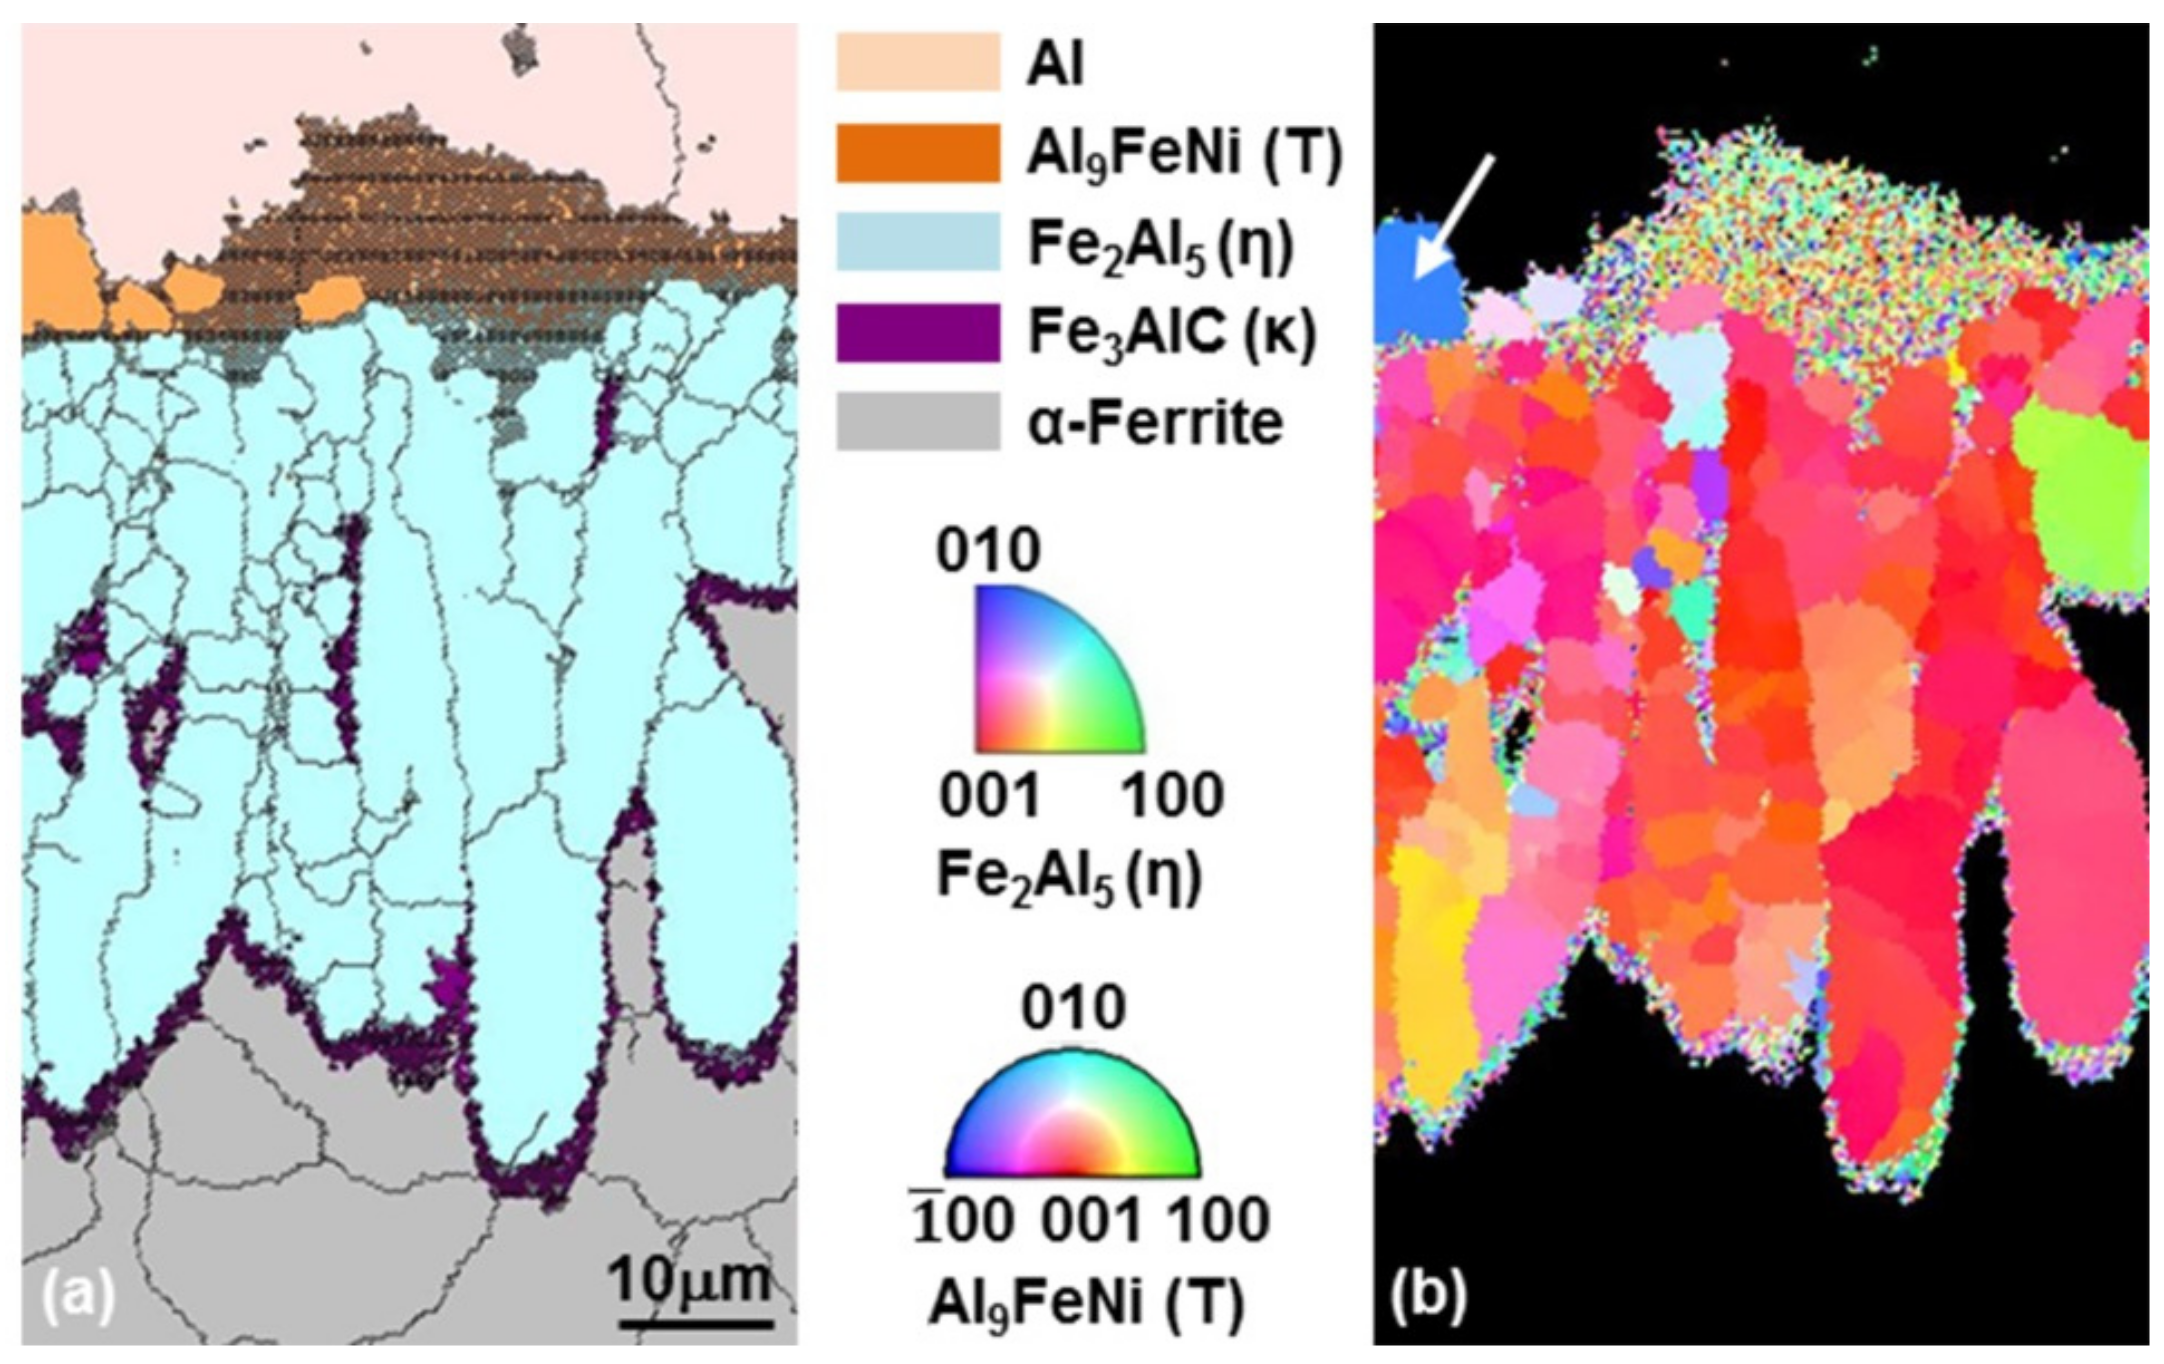
Figure 8 shows the phase identification of the reacted layer of Figure 4. Figure 8a is the phase map and Figure 8b is the inverse pole figure (IPF) representation. A very fine Al9FeNi (T) phase was distributed in the upper part, while a fine Fe2Al5 (η) phase was distributed in the lower part, and a Fe3AlC (κ) phase was present at the boundary between the Fe and the Fe2Al5 (η) phase. As the EBSD results, observed at a magnification of about 3000×, was appeared to be divided into only three phases (Fe2Al5 (η), Fe2Al5 (η) and Fe3AlC (κ)). However, TEM observations at a high magnification (10,000×) shown in Figure 5 revealed that the upper part (area 1) contained three phases of Al9FeNi (T), Fe2Al5 (η), and pure Al. These results are summarized in Figure 8c, which is an illustration of the nucleated intermetallic compounds during the 10 s hot-dipping of the specimen.
3.2. Growth of the Intermetallic Compounds
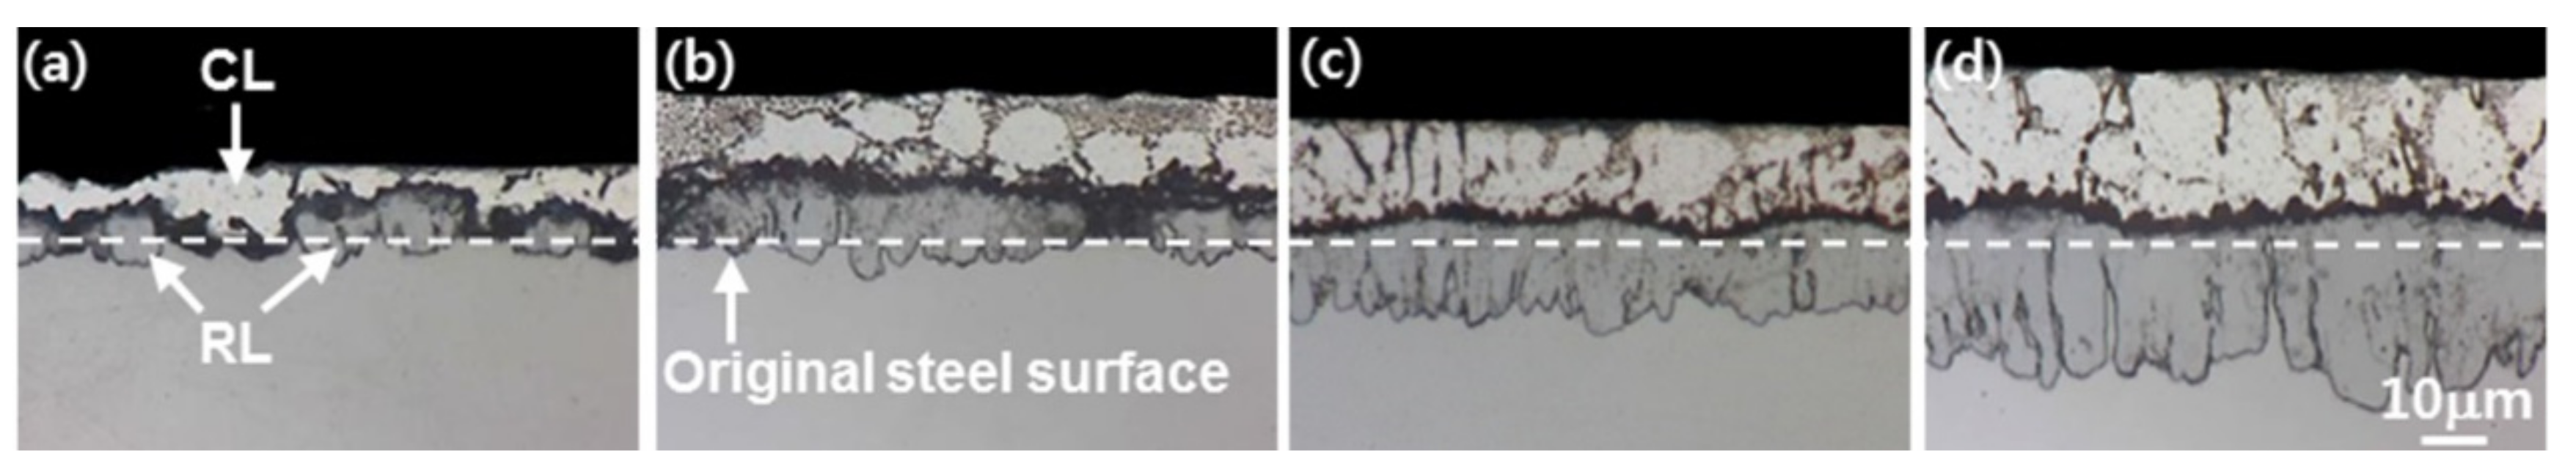
The light microscope microstructures of the specimens hot-dipped at 690 °С for various durations are shown in Figure 9, where the white line represents the original steel surface. For a dipping time of 20 s, nucleation occurs sporadically and intermetallic compounds are formed. As the dipping time increases, the Al9FeNi (T), Fe2Al5 (η) and Fe3AlC (κ) phase combine and the Fe2Al5 (η) phase grows toward the steel. For a dipping time of 60 s, the intermetallic compounds are formed on the entire surface of the steel, and grows further toward the steel.
Figure 10 shows the results of the EPMA analysis of the specimen hot-dipped for 20 s. Figure 11 shows the results of the EBSD analysis for this specimen. Figure 11a is the phase map with the grain boundary (misorientation angle of 15°) and Figure 11b is the IPF. From the results of the EPMA analysis, the distribution of O corresponds to Fe on the steel surface and Al in the line form inside the coating layer. This means that the Fe3O4 oxide film initially formed on the steel surface gradually reduces to Al2O3 and moves into the molten Al–Ni alloy. The reduction reaction for the oxides occurs naturally, because the free energy of Al2O3 at the dipping temperature is lower than that of Fe3O4. The Al9FeNi (T) phase in contact with liquid phase grows more than for the 10 s hot-dipped specimen. The Fe2Al5 (η) phase (Figure 8) formed on the steel surface in the specimen hot-dipped for 10 s is very fine and has various crystal orientations; however, the Fe2Al5 (η) phase in the specimen hot-dipped for 20 s grows mainly with a [001] crystal orientation with a columnar shape inside the steel. A fine Fe3AlC (κ) phase was formed at the interface between the steel and the Fe2Al5 (η) phase.
Figure 12 shows the results of the EPMA analysis of the specimens hot-dipped for 120 s. Figure 13 shows the results of the EBSD analysis for this specimen. Figure 13a is the phase map and Figure 13b is the IPF. In the case of the Al9FeNi (T) phase, fine grains of 1 μm or less are primarily observed, while grains of a few microns (marked as ↙ in Figure 13b) are occasionally observed. A characteristic feature of the Fe2Al5 (η) phase composition in Figure 12 is that the concentration of Ni and C is lower than that in the steel, and C is concentrated at the interface of the Fe2Al5 (η) phase/Fe2Al5 (η) phase and the Fe2Al5 (η) phase/steel. As seen in Figure 13b, the Fe2Al5 (η) phase mainly grows along the [001] direction, but occasionally the fine polygonal Fe2Al5 (η) phase grains have different crystal orientations.
3.3. Nucleation and Growth of the Intermetallic Compounds
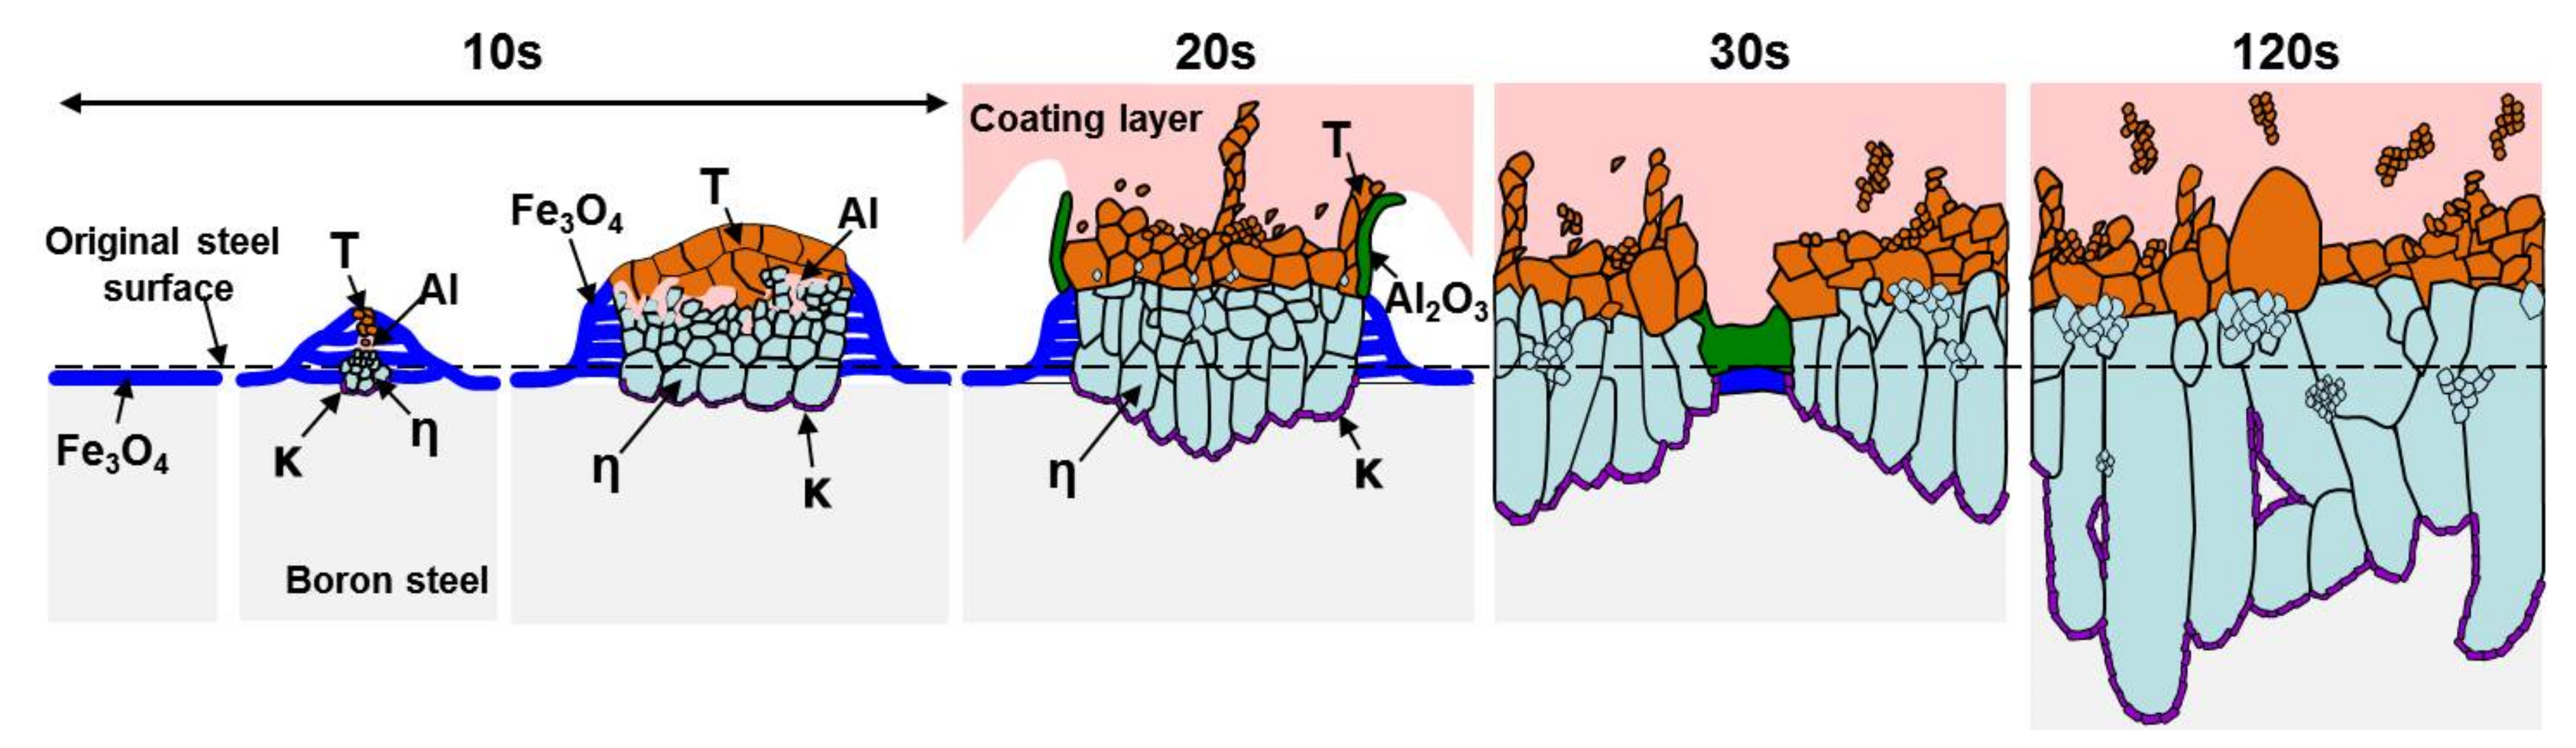
A schematic diagram on the formation of the intermetallic compounds based on the EPMA, TEM, and EBSD results of the intermetallic compounds formed at 690 °С with the increase in the dipping time is shown in Figure 14. From this schematic diagram, the mechanism of formation of the intermetallic compounds can be described as follows: A Fe3O4 oxide film is formed on the steel surface when the steel is hot-dipped into the molten Al–Ni alloy. The molten Al–Ni alloy flows into the place where the oxide layer decomposed, and reacts with the solid steel to form the intermetallic compounds. The intermetallic compounds are mainly formed toward the liquid phase, and only a thin layer is formed inside the steel. Where the oxide film breaks further, a larger amount of the liquid phase flows in, and the intermetallic compounds grow. Although a dipping time of 10 s is very short, Fe eluted from the steel is present on the upper intermetallic compounds (Figure 3d). There are two methods for supplying Fe into the liquid phase: Fe is either supplied by the elution-diffusion phenomenon from the surface of the steel, or the reduction reaction from the Fe3O4 phase to the Al2O3 phase.
4. Discussion
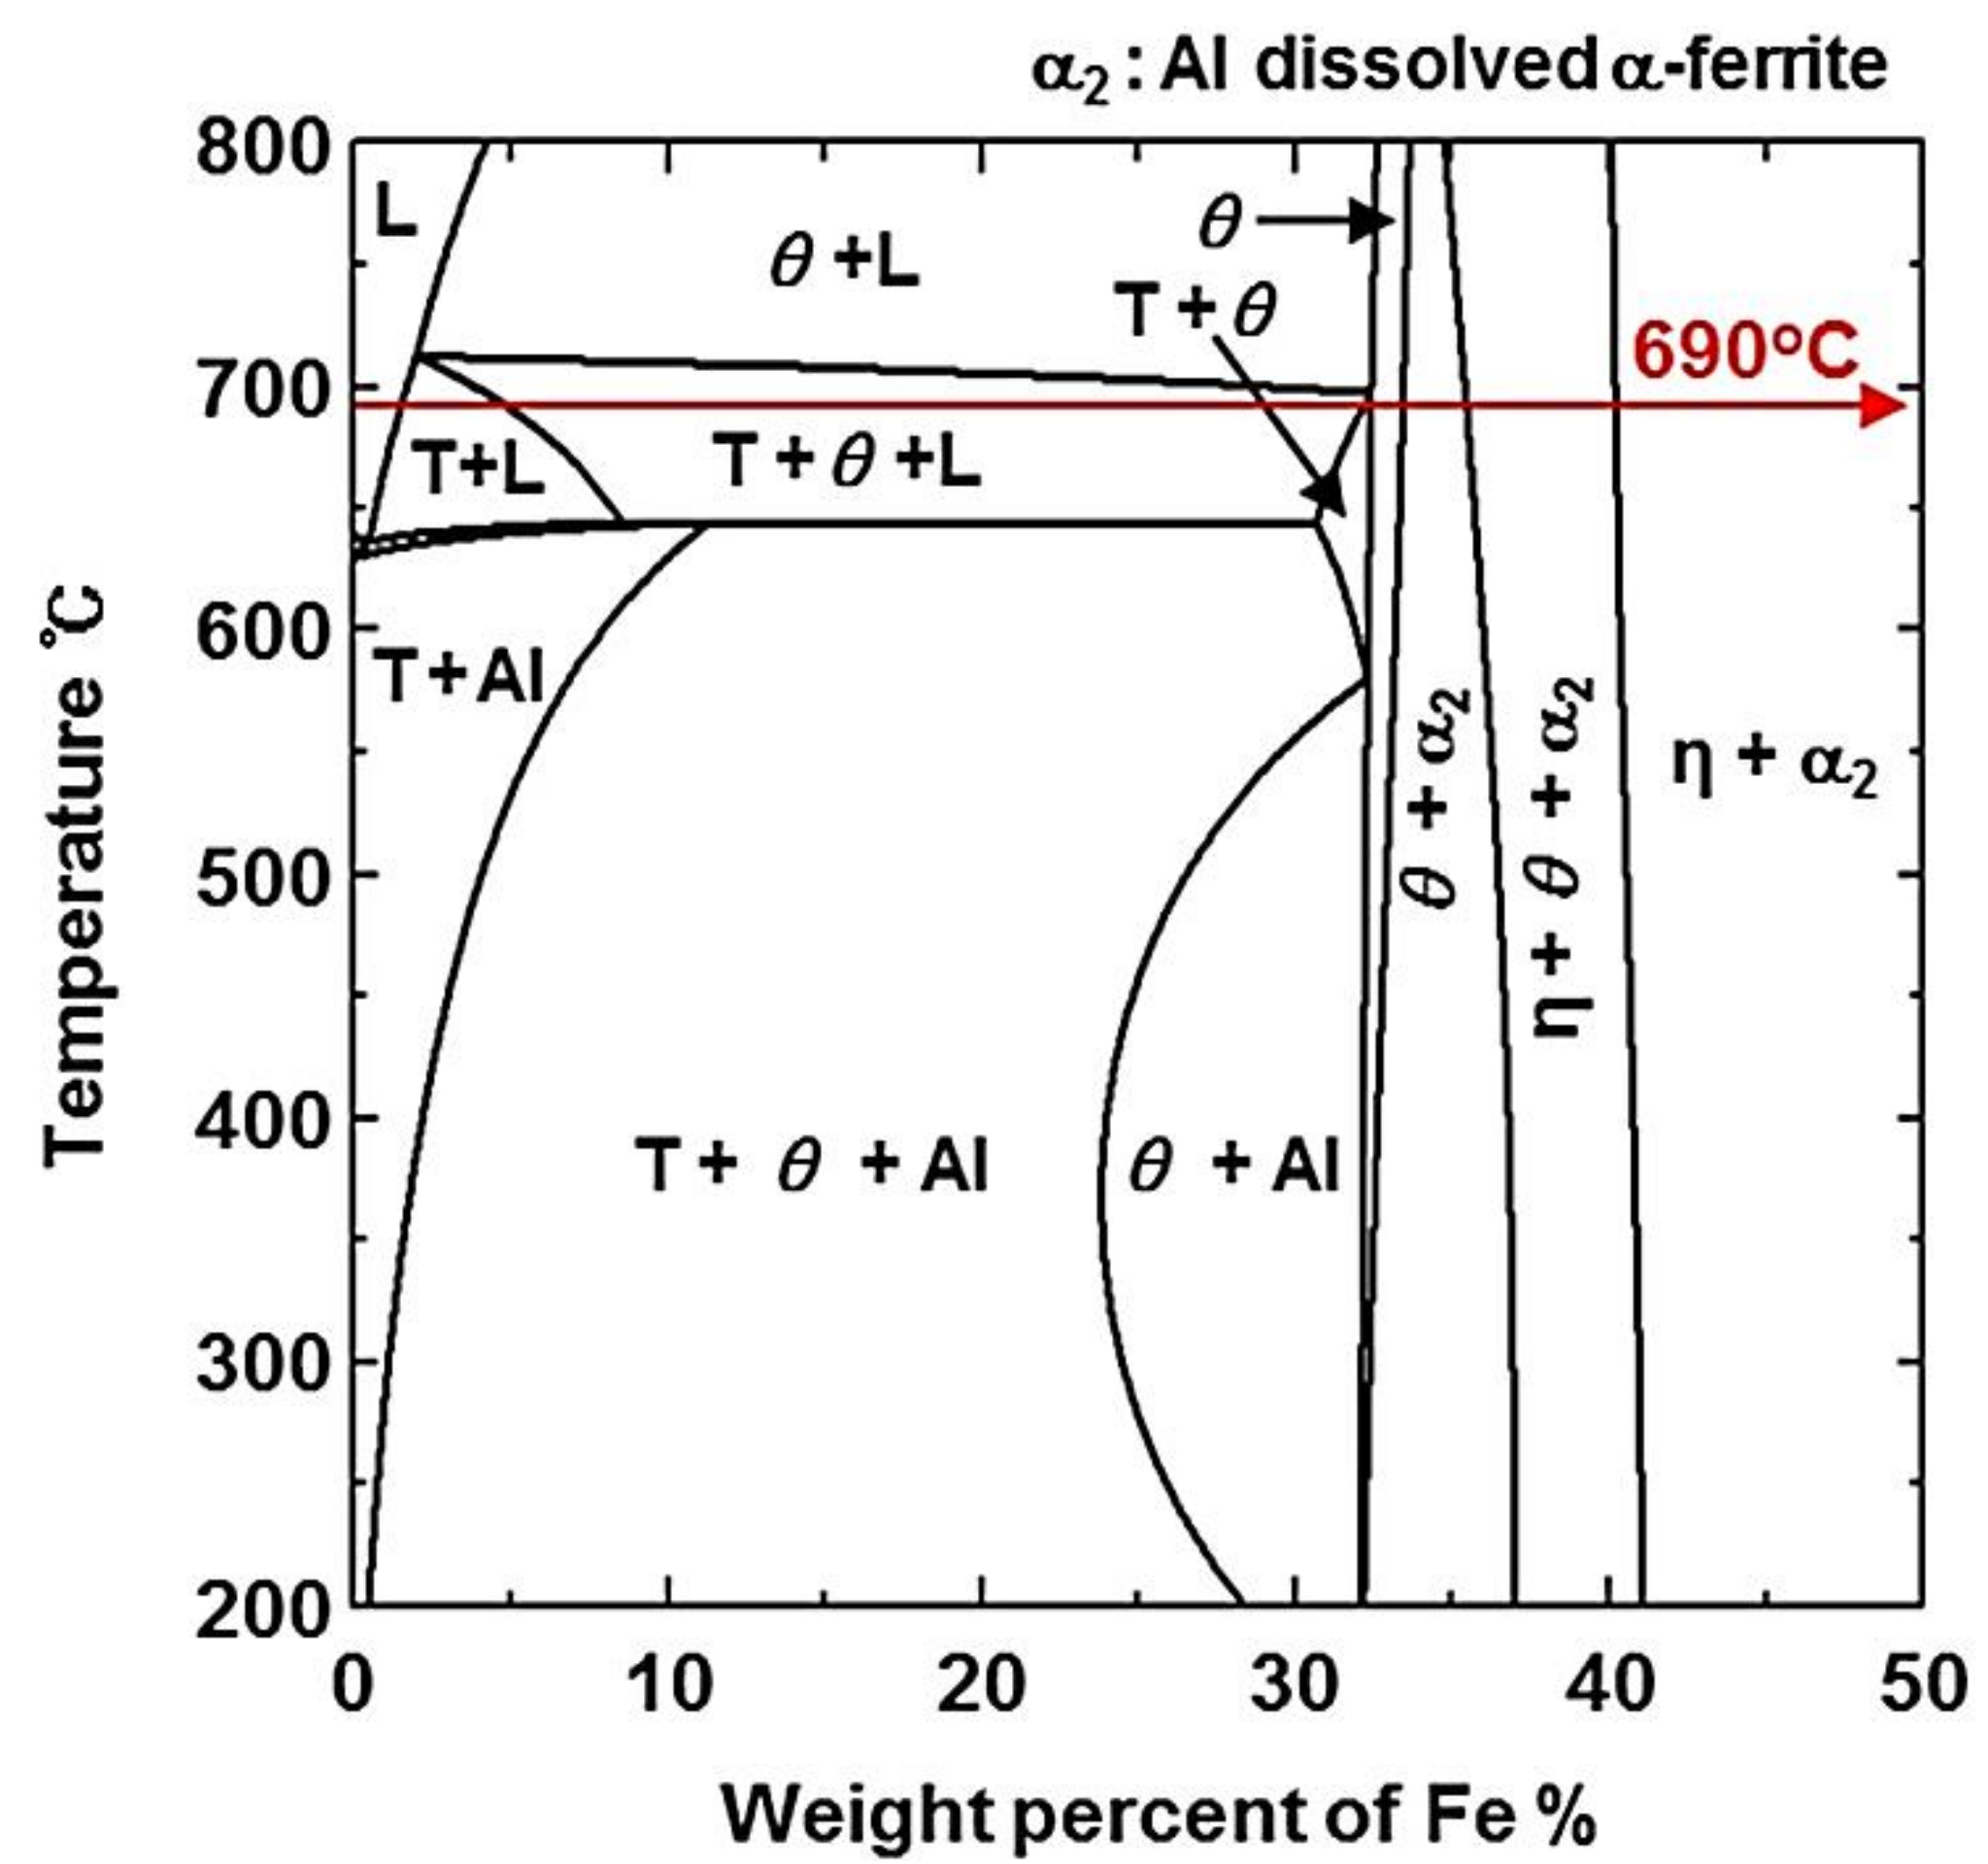
In order to understand the phenomenon of the phase transformation that occurs during the hot-dipping process when Fe is added to the Al–Ni alloy liquid phase, an (Al–7Ni)–Fe (wt %) quasi binary phase diagram calculated with the Thermo-Calc. software was used (Figure 15). As shown in Figure 15, a solid Al9FeNi (T) phase is formed when over 1.5 wt % Fe is added to the Al–7Ni (wt %) liquid at 690 °С, while the T and θ phases are formed when over 5.0 wt % Fe is added. When Fe dissolves into the liquid phase and the composition in the vicinity of the steel surface is within the range of the two-phase region of T + L at 690 °С, the Al9FeNi (T) phase is naturally generated, as shown in the quasi-binary phase diagram. In addition, the liquid phase in the two-phase region of T + L is transformed into the Al9FeNi (T) phase and Al phase during cooling. Thus, the Al9FeNi (T) phase and Al phase were formed on the liquid phase.
Figure 16 shows the formation mechanism of the intermetallic compounds formed by the dissolution and interdiffusion reactions between the liquid phase and the steel during the hot-dipping process. In the early stage (a) where the dipping time is short, the Al9FeNi (T) phase is formed on the liquid phase, and the Fe2Al5 (η) phase, which is below the Al9FeNi (T) phase, is sporadically formed on the steel as Fe dissolves into the liquid phase. In contrast, when the Al9FeNi (T) phase is formed between the liquid and the Fe2Al5 (η) phase, as shown in Figure 16b, Al does not diffuse directly from the liquid phase into the steel, but diffuses according to the sequence of Al9FeNi (T) phase → Fe2Al5 (η) phase → steel. However, Fe diffuses in the reverse order. Figure 12 shows that the concentration of Al decreases, while that of Fe increases along the depth direction. The growth of the Al9FeNi (T) phase is influenced by the concentration of Al and Fe, which are common elements in the Fe2Al5 (η) phase and Al9FeNi (T) phase. Al diffused from the original steel surface toward the depth direction. However, Fe diffused to a short distance from the original steel surface to the Al9FeNi (T) phase, and had a lower concentration than Al. The Al9FeNi (T) phase serves as a channel for Al, but acts as a barrier for Fe, and prevents the diffusion of Fe during the growth of the Al9FeNi (T) phase. Hence, there was no significant difference in the thickness of the Al9FeNi (T) phase due to the slow diffusion rate of Fe, and only grain growth occurred with the progress of dipping time.
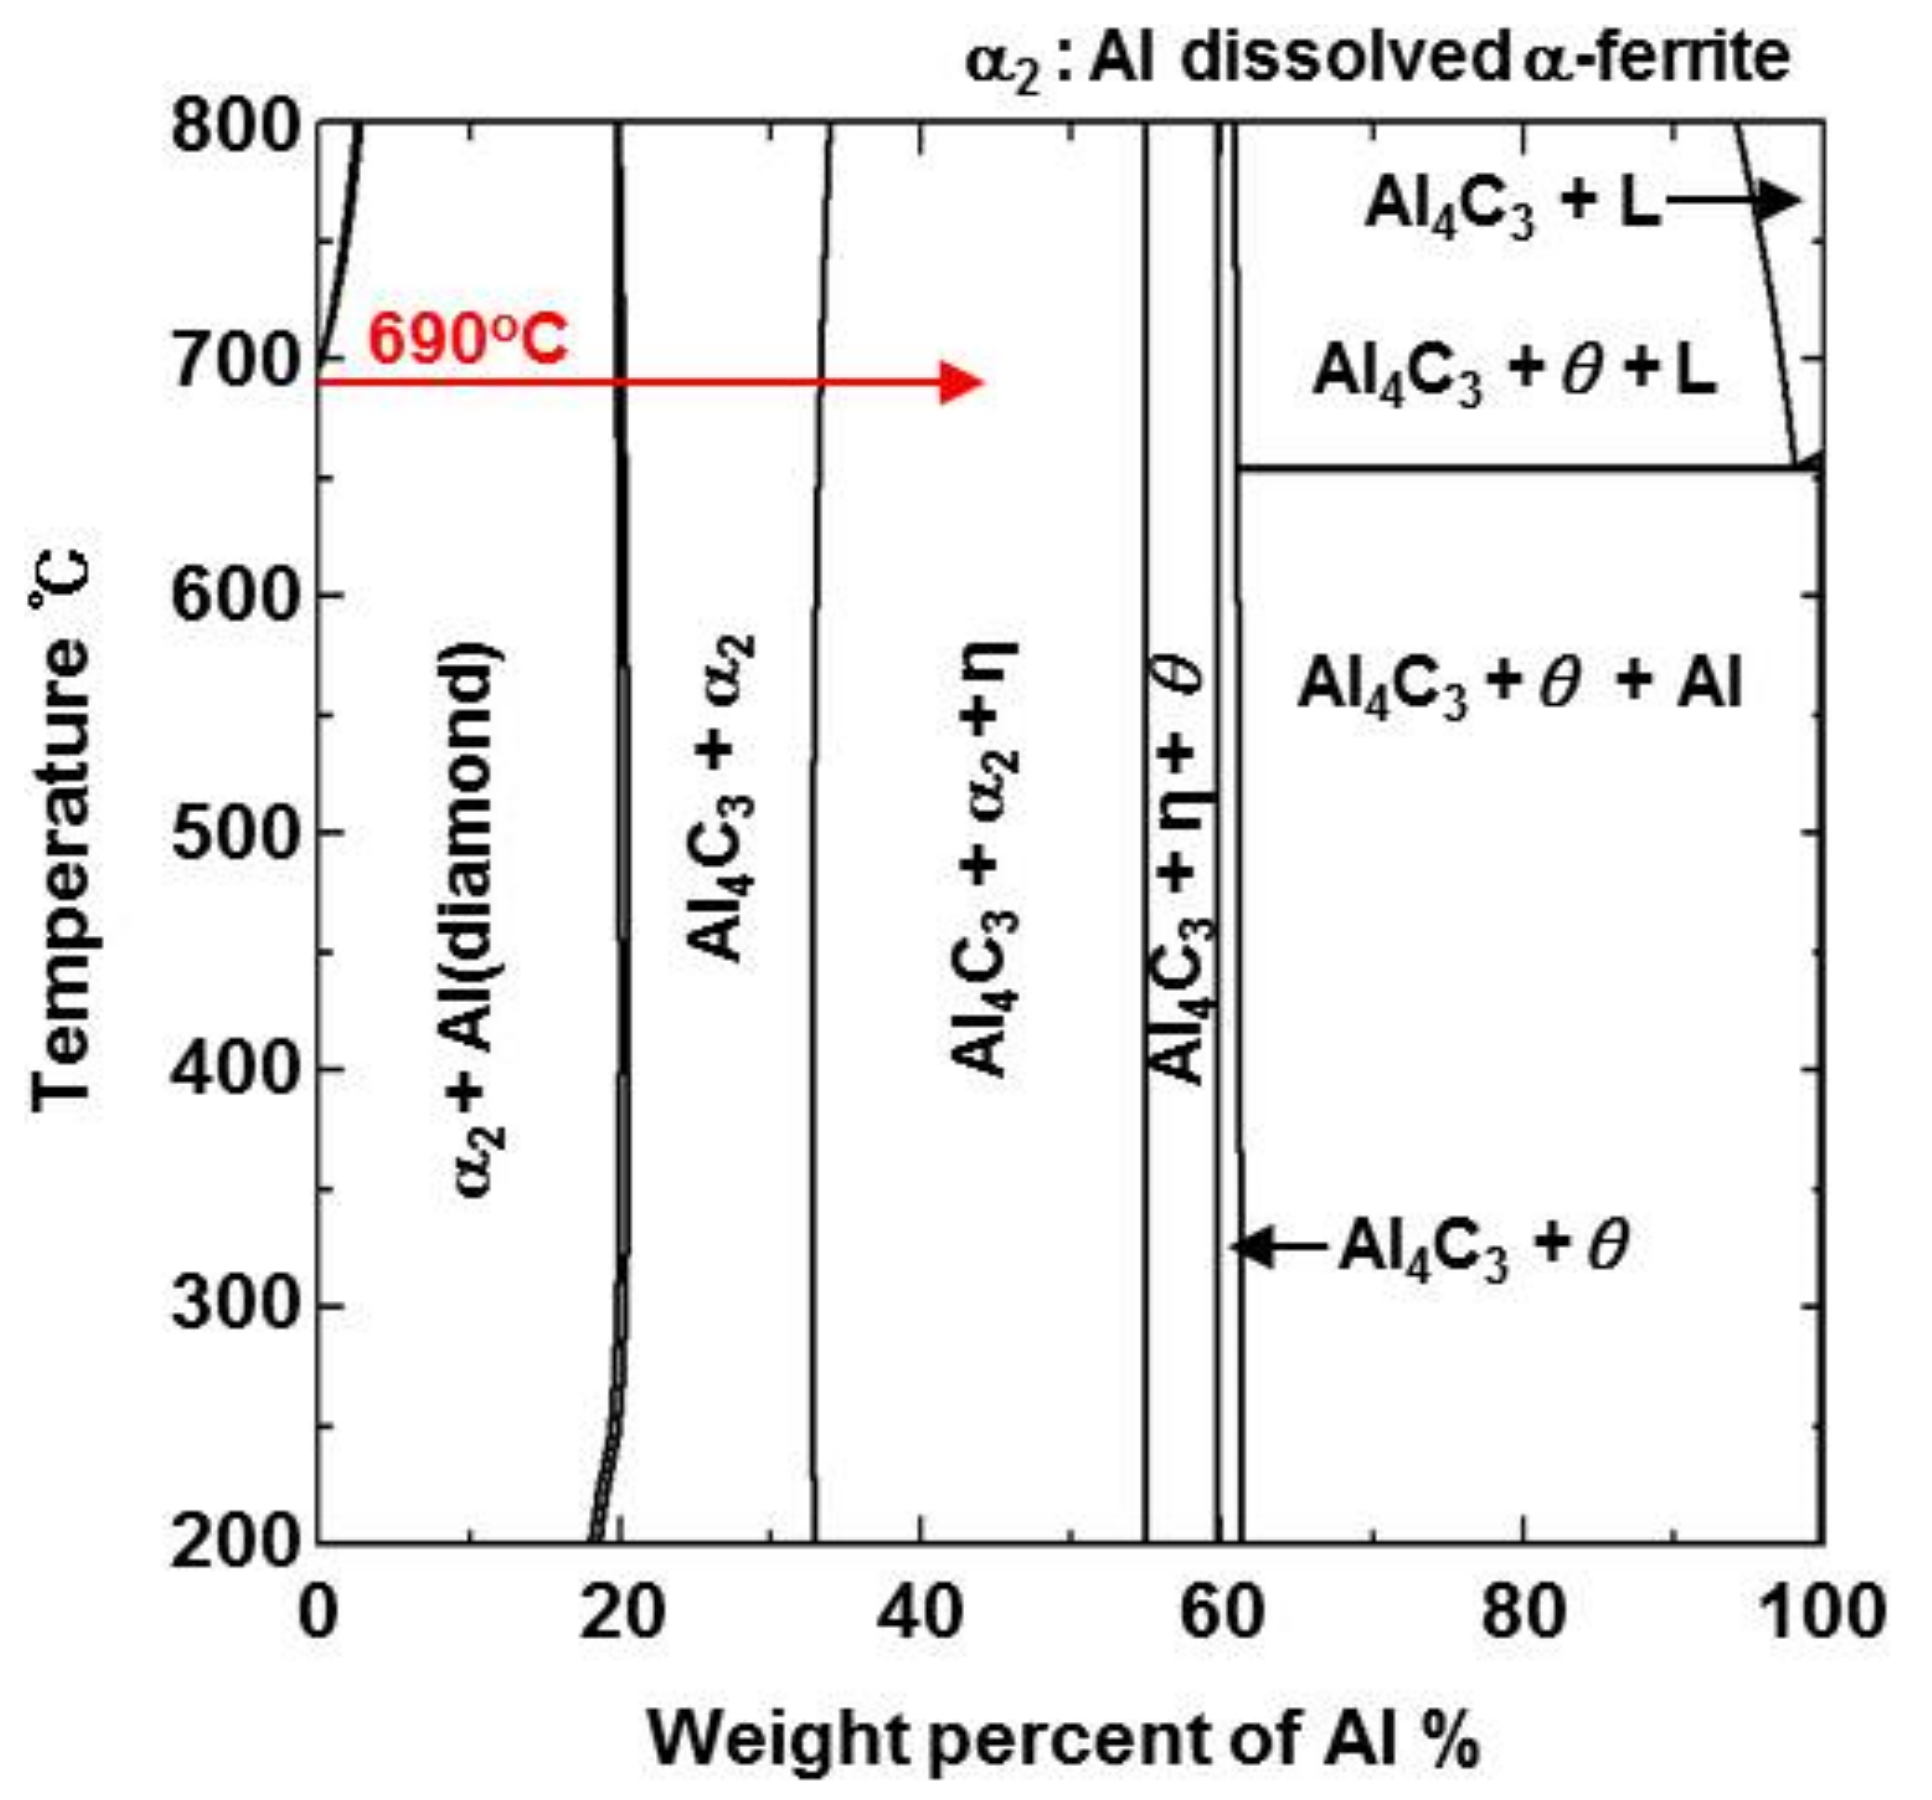
Since the phase formation process in steel occurs due to solid interdiffusion, the phase transformation process cannot be interpreted from the phase diagram in Figure 15. However, Figure 12 shows that only Al, and not Ni, diffused into the Fe2Al5 (η) phase. The formation of the Fe2Al5 (η) phase was studied using the Steel–Al binary phase diagram calculated by Thermo-Calc. (Figure 17). When the Al content is over 32 wt %, the Fe2Al5 (η) phase is formed. Al diffuses toward steel, while Fe diffuses from η → T → liquid. Although the mass of the Al that is diffused is constant, the Al concentration increases due to the decrease in the Fe concentration. In other words, the Fe2Al5 (η) phase will be formed in a smaller amount than that observed in the phase diagram due to interdiffusion.
Studies on the intermetallic compounds formed by the diffusion of Fe and pure Al [10,11,12], Fe and Al alloy [13,14], steel and pure Al [15,16,17,18,19,20,21,22,23,24,25], and steel and Al alloy [26,27,28,29] have been conducted for a long time. The intermetallic compounds formed in these studies were classified into three types: (1) Al/FeAl3 (θ) phase/Fe2Al5 (η) phase/Fe [10,11,12,13,14,15,16,17,18,26,27]: the intermetallic compounds are composed of an outer minor FeAl3 (θ) phase and an inner major Fe2Al5 (η) phase; (2) Al/Fe4Al13 (θ) phase/Fe2Al5 (η) phase/Fe [19,20,21,25]: the intermetallic compounds are composed of an outer minor Fe4Al13 (θ) phase and an inner major Fe2Al5 (η) phase; and (3) Al/Fe2Al5 (η)/Fe [22,23,24]: the reaction product was only Fe2Al5 (η). Many studies have reported that a θ phase (Fe4Al13 or FeAl3) is formed on the Al side and a Fe2Al5 (η) phase is formed on the Fe or steel side [10,11,12,13,14,15,16,17,18,26,27]. In the results of this study, it is considered that the FeAl3 (θ) phase is not formed. According to EDS microanalysis, Al concentration indicates 50–60 wt %. The Al concentration of 55–60 wt % is the composition in which FeAl3 (θ) phase and Fe2Al5 (η) phase is formed, but not FeAl3 (θ) phase. According to Naoi [20] it is reported that the diffusion coefficient of FeAl3 (θ) phase was more than two orders of magnitude smaller than Fe2Al5 (η) phase. Therefore there was no FeAl3 (θ) phase after long period of solid-state diffusion reaction. In this study, because of the short dipping time (10–120 s), formation of FeAl3 (θ) phase with low diffusion coefficient seems to be difficult.
In Figure 13, large columnar Fe2Al5 (η) grains grow along the c-axis of the phase. Studies on the morphology of the Fe2Al5 (η) phase attribute this to the 30% vacancy rate in the c-axis of the crystal structure of Fe2Al5 (η) phase, which can be seen as a rapid diffusion tunnel. This causes the Fe2Al5 (η) phase to be orientated by the fixed c-axis of the crystal, due to which it grows preferentially along the [001] direction during hot-dipping [18,26,27,28].
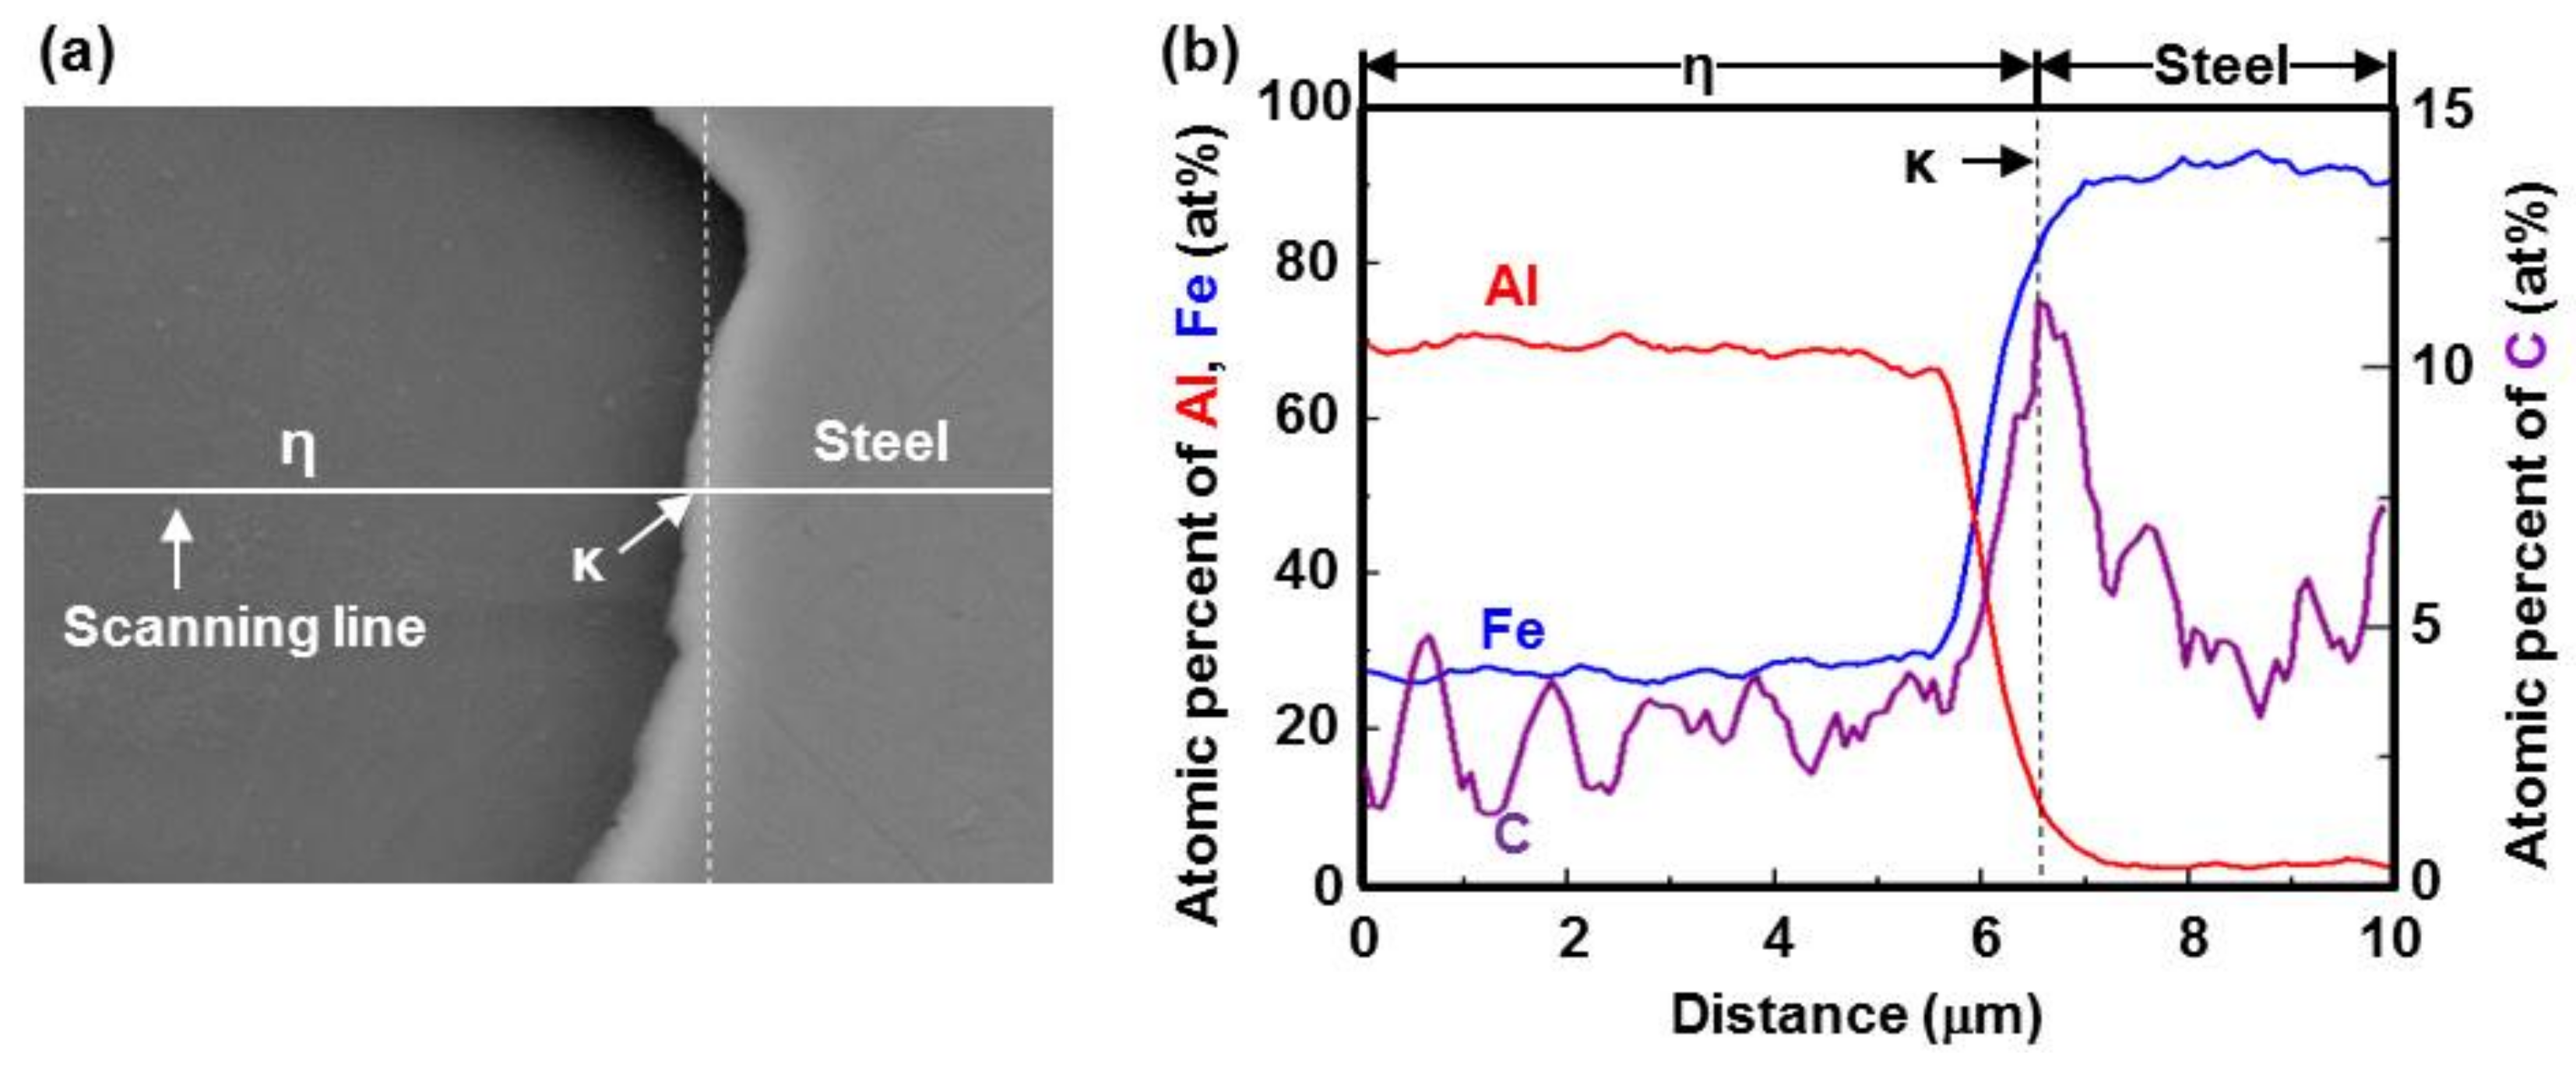
There are few reports on the formation of the Fe3AlC (κ) phase by a diffusion reaction of steel and Al. According to a recent study by Springer [29], an 800-nm-thick band consisting of FeAl (β′) and the Fe3AlC (κ) phase is formed between the Fe2Al5 (η) phase and steel at 690 °С; however, there was no mention of a formation mechanism. In the present study, the Fe3AlC (κ) phase was observed on the steel side of the intermetallic compounds formed at the initial stage of the dipping process (at 690 °С; dipping time of 10 s). The formation mechanism of the Fe3AlC (κ) phase at the interface between the steel and Fe2Al5 (η) phase is as follows. EDS concentration profiles (Figure 18) show that the atomic percent of Al decreases and that of C increases at the Fe2Al5 (η) phase/steel interface along the growth direction. At the interface, the Fe3Al phase (cubic structure, space group: Pm3m) is formed due to the decrease in Al concentration. The Fe3Al phase is adsorbed with C, which cannot be dissolved in the Fe2Al5 (η) phase but is diffused to the interface and forms the Fe3AlC (κ) phase; it is therefore considered that the Fe3AlC (κ) phase was formed by the bond-released C and Fe3Al [30]. Except for C, there is no effect of Mn and Si the constituent elements of the steel on intermetallic compounds formation.
5. Conclusions
The nucleation and growth of the intermetallic compounds formed in boron steel hot-dipped in an Al–7Ni (wt %) alloy at 690 °С for various durations were investigated.
- In the early stages of the dipping process, the Fe3O4 oxide layer formed on the surfaces, then decomposed sporadically. The intermetallic compounds formed on the surfaces as the Al–Ni molten alloy permeated into the oxide layer breakdown region and reacted with the eluted Fe from the steel.
- From the (Al–7Ni)–xFe (wt %) quasi-binary phase diagram, a coexistence zone of the Al9FeNi (T) phase + liquid (Al–Ni alloy) phase was identified in the composition range of 1.5–5.0 wt % Fe. This implies that 1.5 wt % or more of Fe dissolved into the liquid phase formed the Al9FeNi (T) phase and the liquid phase at 690 °С initially, and the Al phase was formed by cooling the liquid phase. The Al9FeNi (T) phase acts as a channel for Al, but as a barrier for Fe, and facilitates only grain growth without significant change in the thickness.
- From the Steel–xAl binary phase diagram, a coexistence zone of the α2 and Fe2Al5 (η) phase was identified in the composition range of 32–55 wt % Al. Therefore, Al diffused according to the sequence Al9FeNi (T) phase → Fe2Al5 (η) phase → steel, and the Fe2Al5 (η) phase with a polygonal structure grew in a columnar form in the [001] direction along the c-axis where Al diffused easily.
- C did not exhibit dissolution into the Fe2Al5 (η) phase and diffused toward the Fe2Al5 (η) phase/steel interface. Moreover, the concentration of Al decreased, resulting in the formation of the Fe3AlC (κ) phase at the steel interface.
- As the dipping time increased, the intermetallic compounds grew along the surface and toward the depth of the steel, and finally combined to form a single coating layer.
Acknowledgments
This work was supported by a National Research Foundation of Korea (NRF) grant funded by the Korea government (MSIP) (No. 2012R1A5A1048294).
Author Contributions
Jae-Hyeong Lee and Chung-Yun Kang conceived and designed the experiments; Jae-Hyeong Lee, Jung-Gil Yun, and Sung-Yun Kwak performed the experiments; Jae-Hyeong Lee and Chung-Yun Kang analyzed the data; Jae-Hyeong Lee wrote the manuscript.
Conflicts of Interest
The authors declare no conflict of interest. The funding sponsors had no role in the design of the study; in the collection, analyses, or interpretation of data; in the writing of the manuscript, and in the decision to publish the results.
References
- Saha, D.C.; Biro, E.; Gerlich, A.P.; Zhou, Y.N. Fiber Laser Welding of Al–Si-Coated Press-Hardened Steel. Procedia Eng. 2016, 95, 147–156. [Google Scholar]
- Kang, C.Y.; Jung, B.H.; Kong, J.P. Effect of Hot-stamping Heat Treatment on the Microstructure of Al-Segregated Zone in TWB Laser Joints of Al–Si-coated Boron Steel and Zn-coated DP Steel. Korean J. Met. Mater. 2012, 50, 455–462. [Google Scholar] [CrossRef]
- Zhang, W.; Sun, D.; Han, L.; Liu, D. Interfacial microstructure and mechanical property of resistance spot welded joint of high strength steel and aluminium alloy with 4047 AlSi12 interlayer. Mater. Des. 2014, 57, 186–194. [Google Scholar] [CrossRef]
- Kang, M.; Kim, C. Joining Al 5052 alloy to aluminized steel sheet using cold metal transfer process. Mater. Des. 2015, 81, 95–103. [Google Scholar] [CrossRef]
- Sun, J.; Yan, Q.; Gao, W.; Huang, J. Investigation of laser welding on butt joints of Al/steel dissimilar materials. Mater. Des. 2015, 83, 120–128. [Google Scholar] [CrossRef]
- Chen, R.; Wang, C.; Jiang, P.; Shao, X.; Zhao, Z.; Zhongmei, G.; Yue, C. Effect of axial magnetic field in the laser beam welding of stainless steel to aluminum alloy. Mater. Des. 2016, 109, 146–152. [Google Scholar] [CrossRef]
- Sun, J.; Yan, Q.; Li, Z.; Huang, J. Effect of bevel angle on microstructure and mechanical property of Al/steel butt joint using laser welding-brazing method. Mater. Des. 2016, 90, 468–477. [Google Scholar] [CrossRef]
- Bahadur, A.; Mohanty, O.N. Structural studies of hot dip aluminized coatings on mild steel. Mater. Trans. JIM 1991, 11, 1053–1061. [Google Scholar] [CrossRef]
- Cheng, W.-J.; Wang, C.-J. Characterization of intermetallic compounds formation in aluminide/nickel duplex coating on mild steel. Mater. Charact. 2012, 69, 63–70. [Google Scholar] [CrossRef]
- Takata, N.; Nishimoto, M.; Kobayashi, S.; Takeyama, M. Crystallography of Fe2Al5 phase at the interface between solid Fe and liquid Al. Intermetallics 2015, 67, 1–11. [Google Scholar] [CrossRef]
- Bouche, K.; Barbier, F.; Coulet, A. Intermetallic compound layer growth between solid iron and molten aluminum. Mater. Sci. Eng. A 1998, 249, 167–175. [Google Scholar] [CrossRef]
- Shahverdi, H.R.; Ghomashchi, M.R.; Shabestari, S.; Hejazi, J. Microstructural analysis of interfacial reaction between molten aluminium and solid iron. J. Mater. Process. Technol. 2002, 124, 345–352. [Google Scholar] [CrossRef]
- Takata, N.; Nishimoto, M.; Kobayashi, S.; Takeyama, M. Morphology and formation of Fe–Al intermetallic layers on iron hot-dipped in Al–Mg–Si alloy melt. Intermetallics 2014, 54, 136–142. [Google Scholar] [CrossRef]
- Yin, F.; Zhao, M.; Liu, Y.; Han, W.; Li, Z. Effect of Si on growth kinetics of intermetallic compounds during reaction between solid iron and molten aluminum. Trans. Nonferr. Met. Soc. China 2013, 23, 556–561. [Google Scholar] [CrossRef]
- Cheng, W.-J.; Wang, C.-J. Growth of intermetallic compounds in the aluminide mild steel during hot-dipped. Surf. Coat. Technol. 2009, 204, 824–828. [Google Scholar] [CrossRef]
- Chen, S.; Yang, D.; Zhang, M.; Huang, J.; Zhao, X. Intermetallic between the growth and dissolution of intermetallic compounds in the interfacial reaction between solid iron and liquid aluminum. Metall. Mater. Trans. A 2016, 47, 5088–5100. [Google Scholar] [CrossRef]
- Sasaki, T.; Yakou, T. Features of intermetallic compounds in aluminized steels formed using aluminum foil. Surf. Coat. Technol. 2006, 201, 2131–2139. [Google Scholar] [CrossRef]
- Wang, D.; Shi, Z.; Zou, L. A liquid aluminum corrosion resistance surface in steel substrate. Appl. Surf. Sci. 2003, 214, 304–311. [Google Scholar]
- Van Alboom, A.; Lemmens, B.; Breitbach, B.; de Grave, E.; Cottenier, S.; Verbeken, K. Multi-method identification and characterization of the intermetallic surface layers of hot-dip Al-coated steel: FeAl3 or Fe4Al13 and Fe2Al5 or Fe2Al5+x. Surf. Coat. Technol. 2017, 324, 419–428. [Google Scholar] [CrossRef]
- Naoi, D.; Kajihara, M. Growth behavior of Fe2Al5 during reactive diffusion between Fe and Al at solid-state temperatures. Mater. Sci. Eng. A 2007, 459, 375–382. [Google Scholar] [CrossRef]
- Mhadhbi, M.; Khitouni, M.; Escoda, L.; Sunol, J.J. Recovery, grain growth and recrystallization of mechanically alloyed FeAl alloy. IOP Conf. Ser. Mater. Sci. Eng. 2010, 13, 012021. [Google Scholar] [CrossRef]
- Heumann, T.; Dittrich, N. Structure character of the Fe2Al5 intermetallics compound in hot dip aluminizing process. Z. Metallk 1959, 50, 617–625. [Google Scholar]
- Burkhardt, U.; Grin, Y.; Ellner, M. Structure Refinement of the Iron-Aluminum Phase with the Approximate Composition Fe2Al5. Acta Cryst. B 1994, 50, 313–316. [Google Scholar] [CrossRef]
- Sasaki, T.; Yakou, T.; Mochiduki, K.; Ichinose, K. Effects of carbon contents in steels on alloy layer growth during hot-dip aluminum coating. ISIJ Int. 2005, 45, 1887–1892. [Google Scholar] [CrossRef]
- Pasche, G.; Scheel, M.; Schäublin, R.; Hébert, C.; Rappaz, M.; Hessler-Wyser, A. Time-resolved X-ray microtomography observation of intermetallic formation between solid Fe and liquid Al. Met. Mater. Trans. Coruña 2013, 44, 4119–4123. [Google Scholar] [CrossRef]
- Awan, G.H.; ul Hasan, F. The morphology of coating/substrate interface in hot-dip-aluminized steels. Mater. Sci. Eng. A 2008, 472, 157–165. [Google Scholar] [CrossRef]
- Cheng, W.-J.; Wang, C.-J. Microstructural evolution of intermetallic layer in hot-dipped aluminide mild steel with silicon addition. Surf. Coat. Technol. 2011, 205, 4726–4731. [Google Scholar] [CrossRef]
- Sakidja, R.; Perepezko, J.H.; Calhoun, P. Synthesis, Thermodynamic Stability and Diffusion Mechanism of Al5Fe2-Based Coatings. Oxid. Met. 2014, 81, 167–177. [Google Scholar] [CrossRef]
- Springer, H.; Kostka, A.; Payton, E.J.; Raabe, D.; Kaysser-Pyzalla, A.; Eggeler, G. On the formation and growth of intermetallic phases during interdiffusion between low-carbon steel and aluminum alloys. Acta Mater. 2011, 59, 1586–1600. [Google Scholar] [CrossRef]
- Yun, J.-G.; Lee, J.-H.; Kwak, S.-Y.; Kang, C. Microstructural Evolution of Intermetallic Compound Formed in Boron Steel Hot-Dipped in Al–7%Ni Alloy. Metals 2017, 7, 393. [Google Scholar] [CrossRef]
Figure 1.
Appearance of various reaction layers formed on the surface of the specimen hot dipped in Al–7Ni (wt %) for 10 s. (a) Light microscope microstructure. (b–d) SEM images: (b) the oxide film (OF) formed on the surface; (c) the decomposition of the oxide film, followed by nucleation of the reaction layer (RL); and (d) the formation of RL.

Figure 2.
Result of XRD analysis for the oxide film formed on the surface of steel.

Figure 3.
(a) BSE image; (b–f) Results of the EPMA area analysis of the specimen (Figure 1c) hot dipped for 10 s: (b) Al, (c) Ni, (d) Fe, (e) O, and (f) C.
Figure 3.
(a) BSE image; (b–f) Results of the EPMA area analysis of the specimen (Figure 1c) hot dipped for 10 s: (b) Al, (c) Ni, (d) Fe, (e) O, and (f) C.

Figure 4.
(a) BSE image; (b–f) Results of the EPMA area analysis of the specimen hot dipped for 10 s: (b) Al, (c) Ni, (d) Fe, (e) O, and (f) C. Scale bar: 5 μm.
Figure 4.
(a) BSE image; (b–f) Results of the EPMA area analysis of the specimen hot dipped for 10 s: (b) Al, (c) Ni, (d) Fe, (e) O, and (f) C. Scale bar: 5 μm.

Figure 5.
(a) 10 s hot-dipped specimen; (b) TEM images of the specimen obtained for the area denoted as X1 in (a) using FIB and (c) specimen divided into two areas; (d–e) The microstructures of areas 1 and 2 in (c), respectively.
Figure 5.
(a) 10 s hot-dipped specimen; (b) TEM images of the specimen obtained for the area denoted as X1 in (a) using FIB and (c) specimen divided into two areas; (d–e) The microstructures of areas 1 and 2 in (c), respectively.
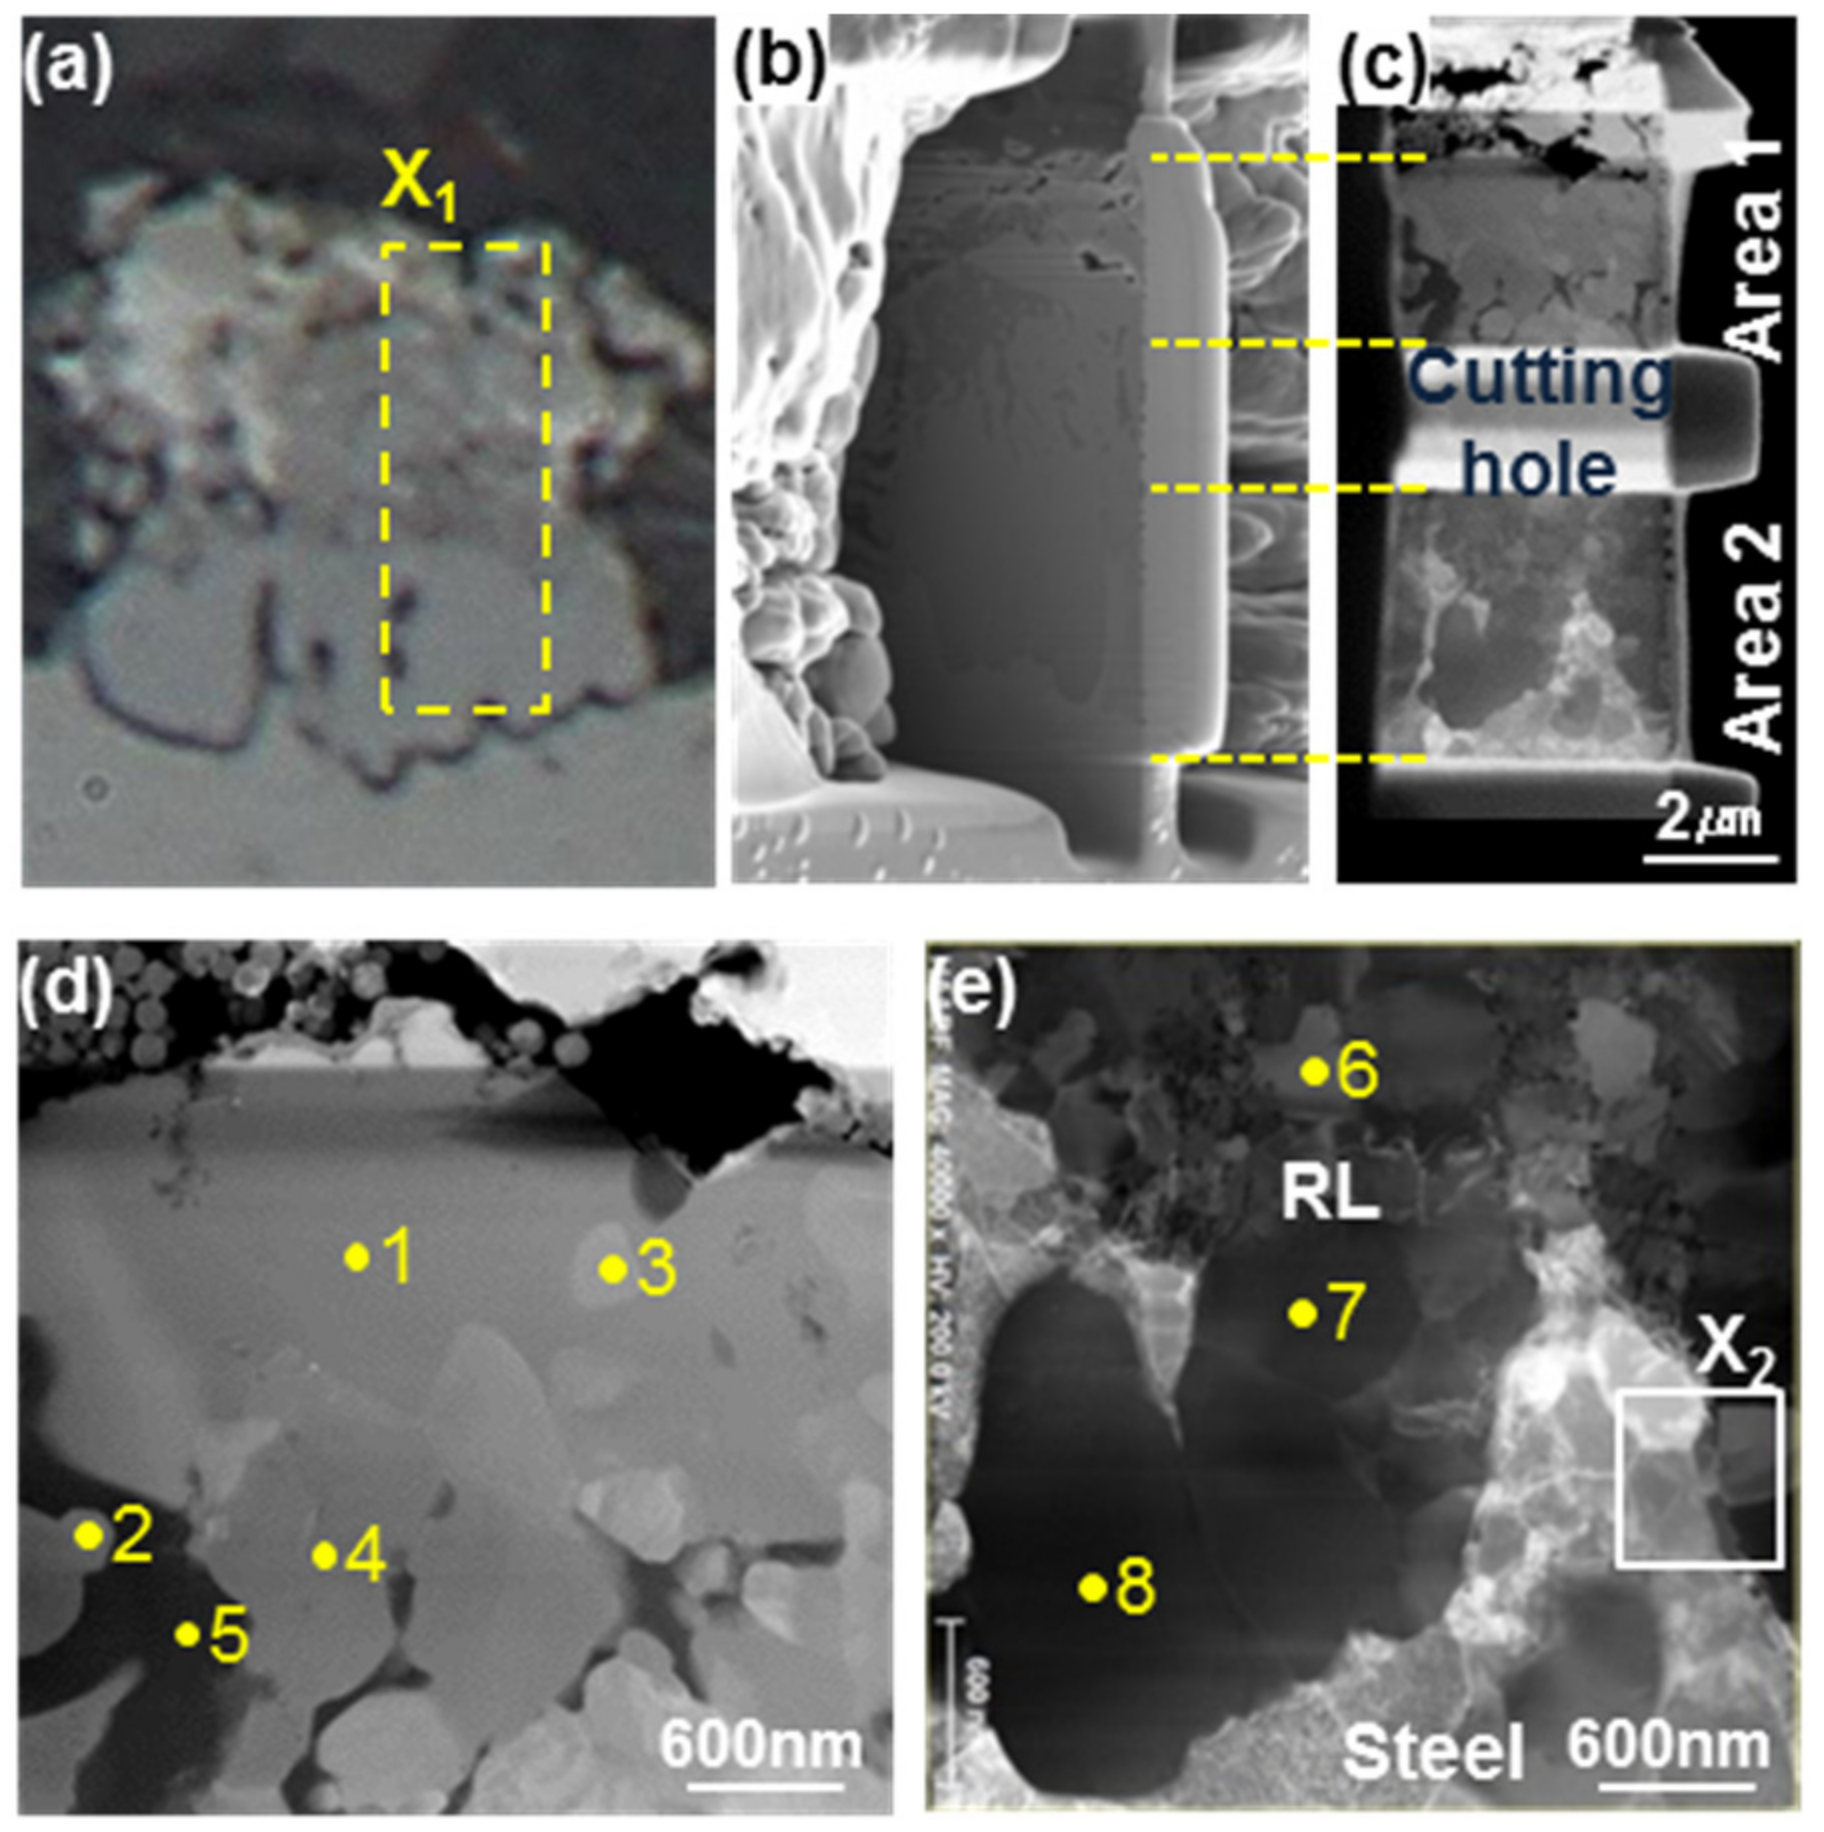
Figure 6.
(a–c) Results of the EDS analysis of Figure 5d: (a) Al, (b) Ni, and (c) Fe. (d–f) Characteristic SAED patterns and their key diagrams taken from the phases denoted as 1–5 in Figure 5d: (d) 1, 2: Z.A [223], Al9FeNi (T); (e) 3, 4: Z.A [112], Fe2Al5 (η); and (f) 5: Z.A [111], Al. (Zone axis: Z.A). Scale bar: 600 nm.

Figure 7.
(a) Microstructure observed for the area marked as □ in Figure 5e; (b–f) Results of the EDS analysis: (b) Al, (c) Ni, (d) Fe, (e) C, and (f) Mn; (g–i) Characteristic SAED patterns and their key diagrams taken from the phases denoted as 9–12 in (a): (g) 9 and 10, (h) 11, and (i) 12 (Zone axis: Z.A).
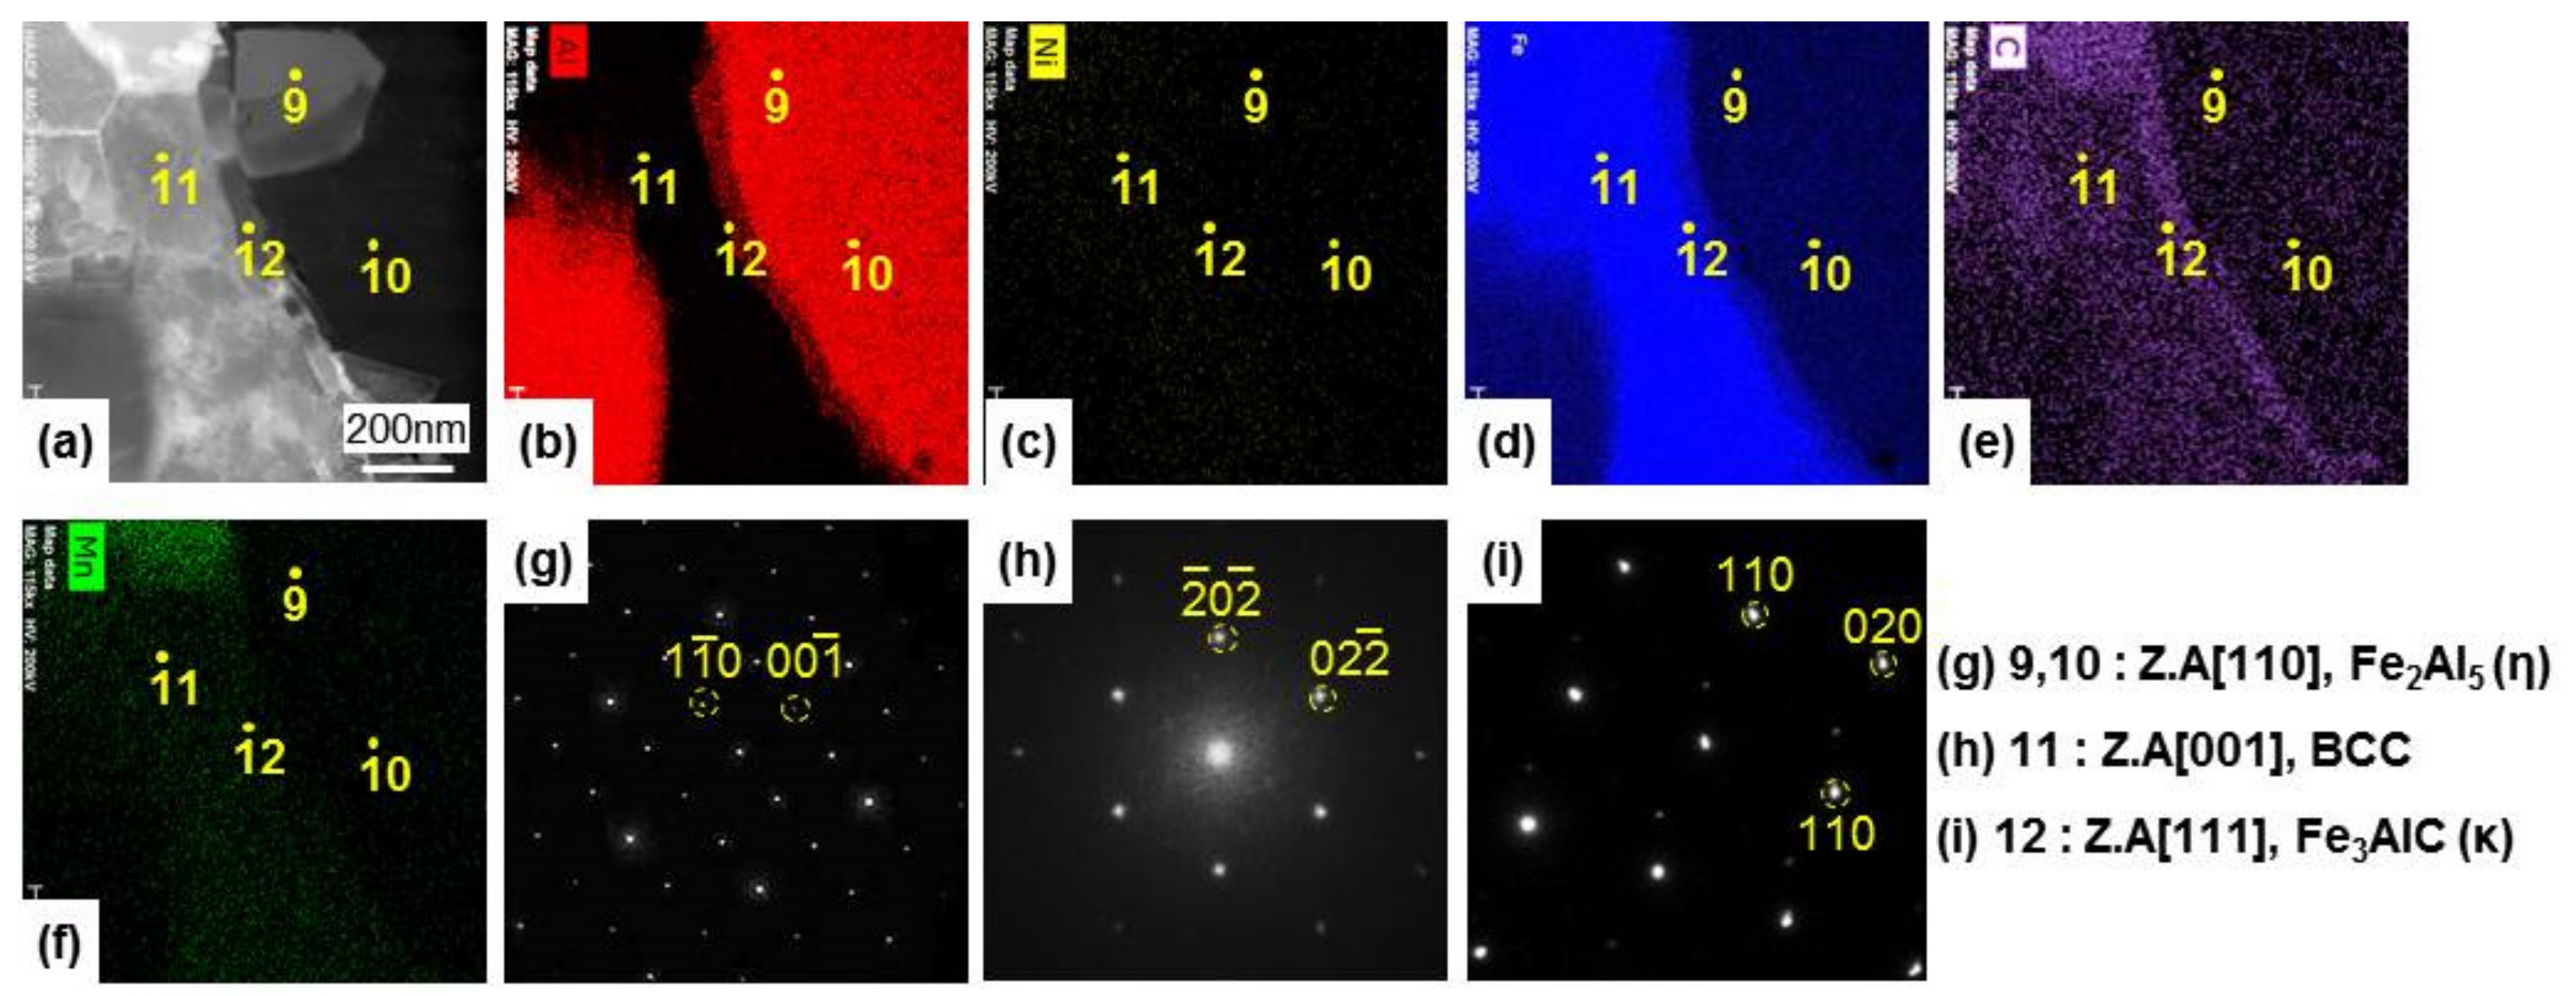
Figure 8.
(a) EBSD phase map; (b) IPF analysis (Al9FeNi (T), Fe2Al5 (η), Fe3AlC (κ) phase); and (c) schematic diagram of the reaction layer hot-dipped for 10 s.
Figure 8.
(a) EBSD phase map; (b) IPF analysis (Al9FeNi (T), Fe2Al5 (η), Fe3AlC (κ) phase); and (c) schematic diagram of the reaction layer hot-dipped for 10 s.
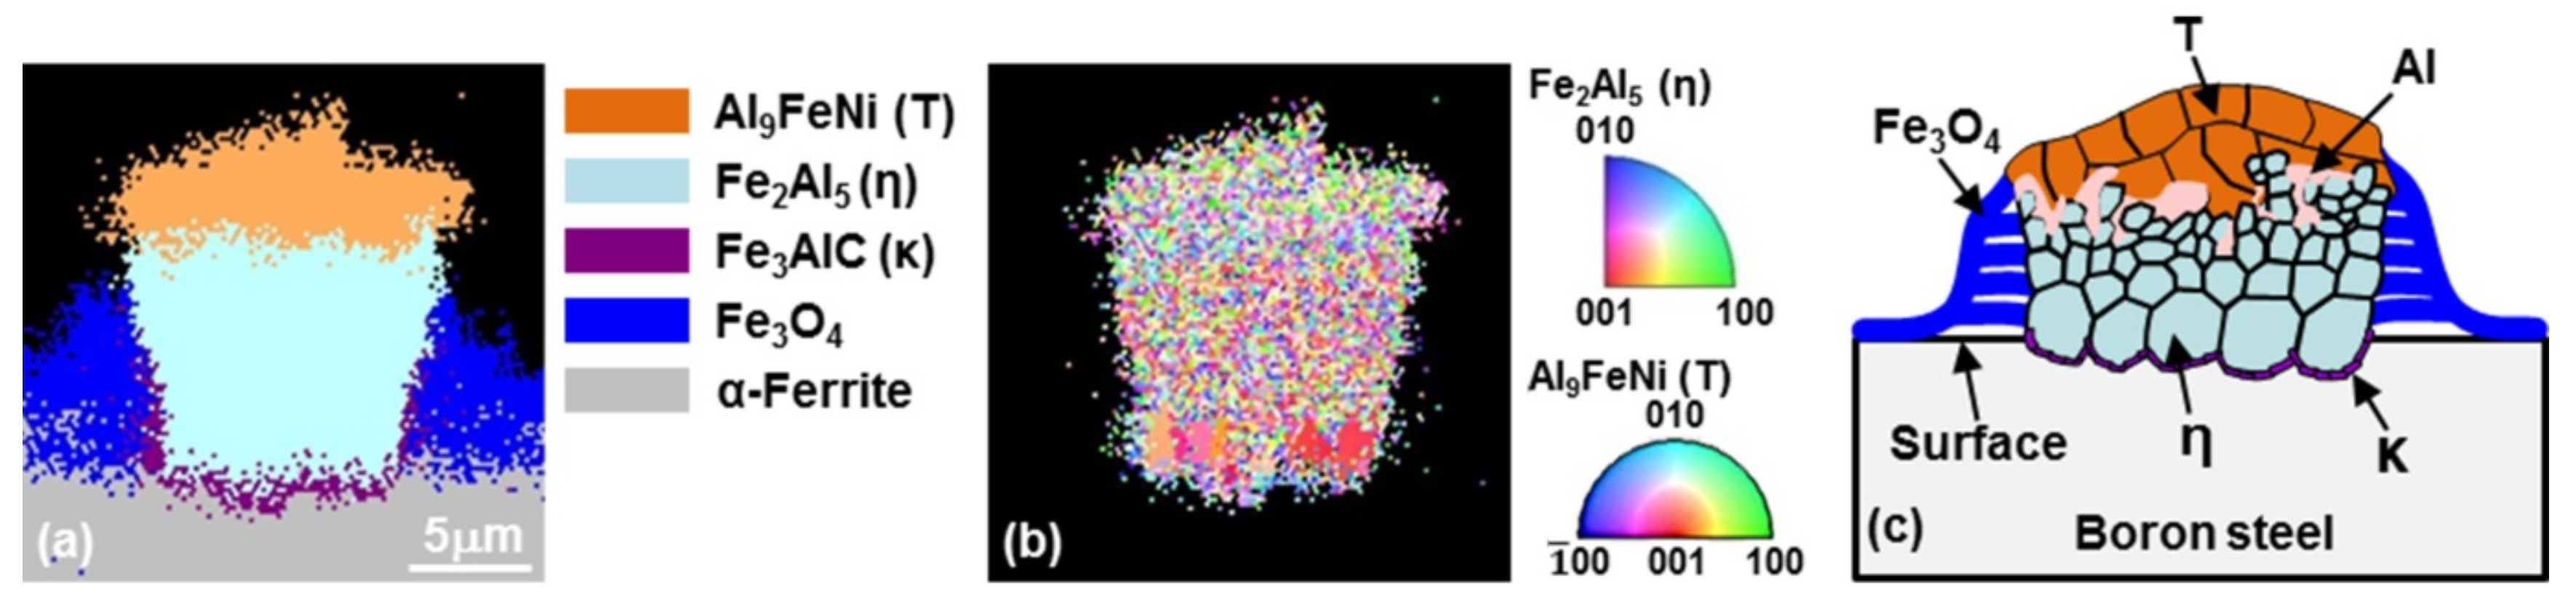
Figure 9.
Cross-sectional light micrographs of steel hot dipped for various times: (a) 20 s, (b) 30 s, (c) 60 s, and (d) 120 s. RL: reaction layer. CL: coating layer.
Figure 9.
Cross-sectional light micrographs of steel hot dipped for various times: (a) 20 s, (b) 30 s, (c) 60 s, and (d) 120 s. RL: reaction layer. CL: coating layer.

Figure 10.
(a) BSE image and (b–e) results of the EPMA area analysis of the specimen (Figure 2c) hot-dipped for 20 s: (b) Al, (c) Ni, (d) Fe, (e) O, and (f) C.
Figure 10.
(a) BSE image and (b–e) results of the EPMA area analysis of the specimen (Figure 2c) hot-dipped for 20 s: (b) Al, (c) Ni, (d) Fe, (e) O, and (f) C.

Figure 11.
(a) EBSD phase map and (b) IPF analysis (Al9FeNi (T), Fe2Al5 (η) and Fe3AlC (κ) phases) of the specimen hot-dipped for 20 s.
Figure 11.
(a) EBSD phase map and (b) IPF analysis (Al9FeNi (T), Fe2Al5 (η) and Fe3AlC (κ) phases) of the specimen hot-dipped for 20 s.
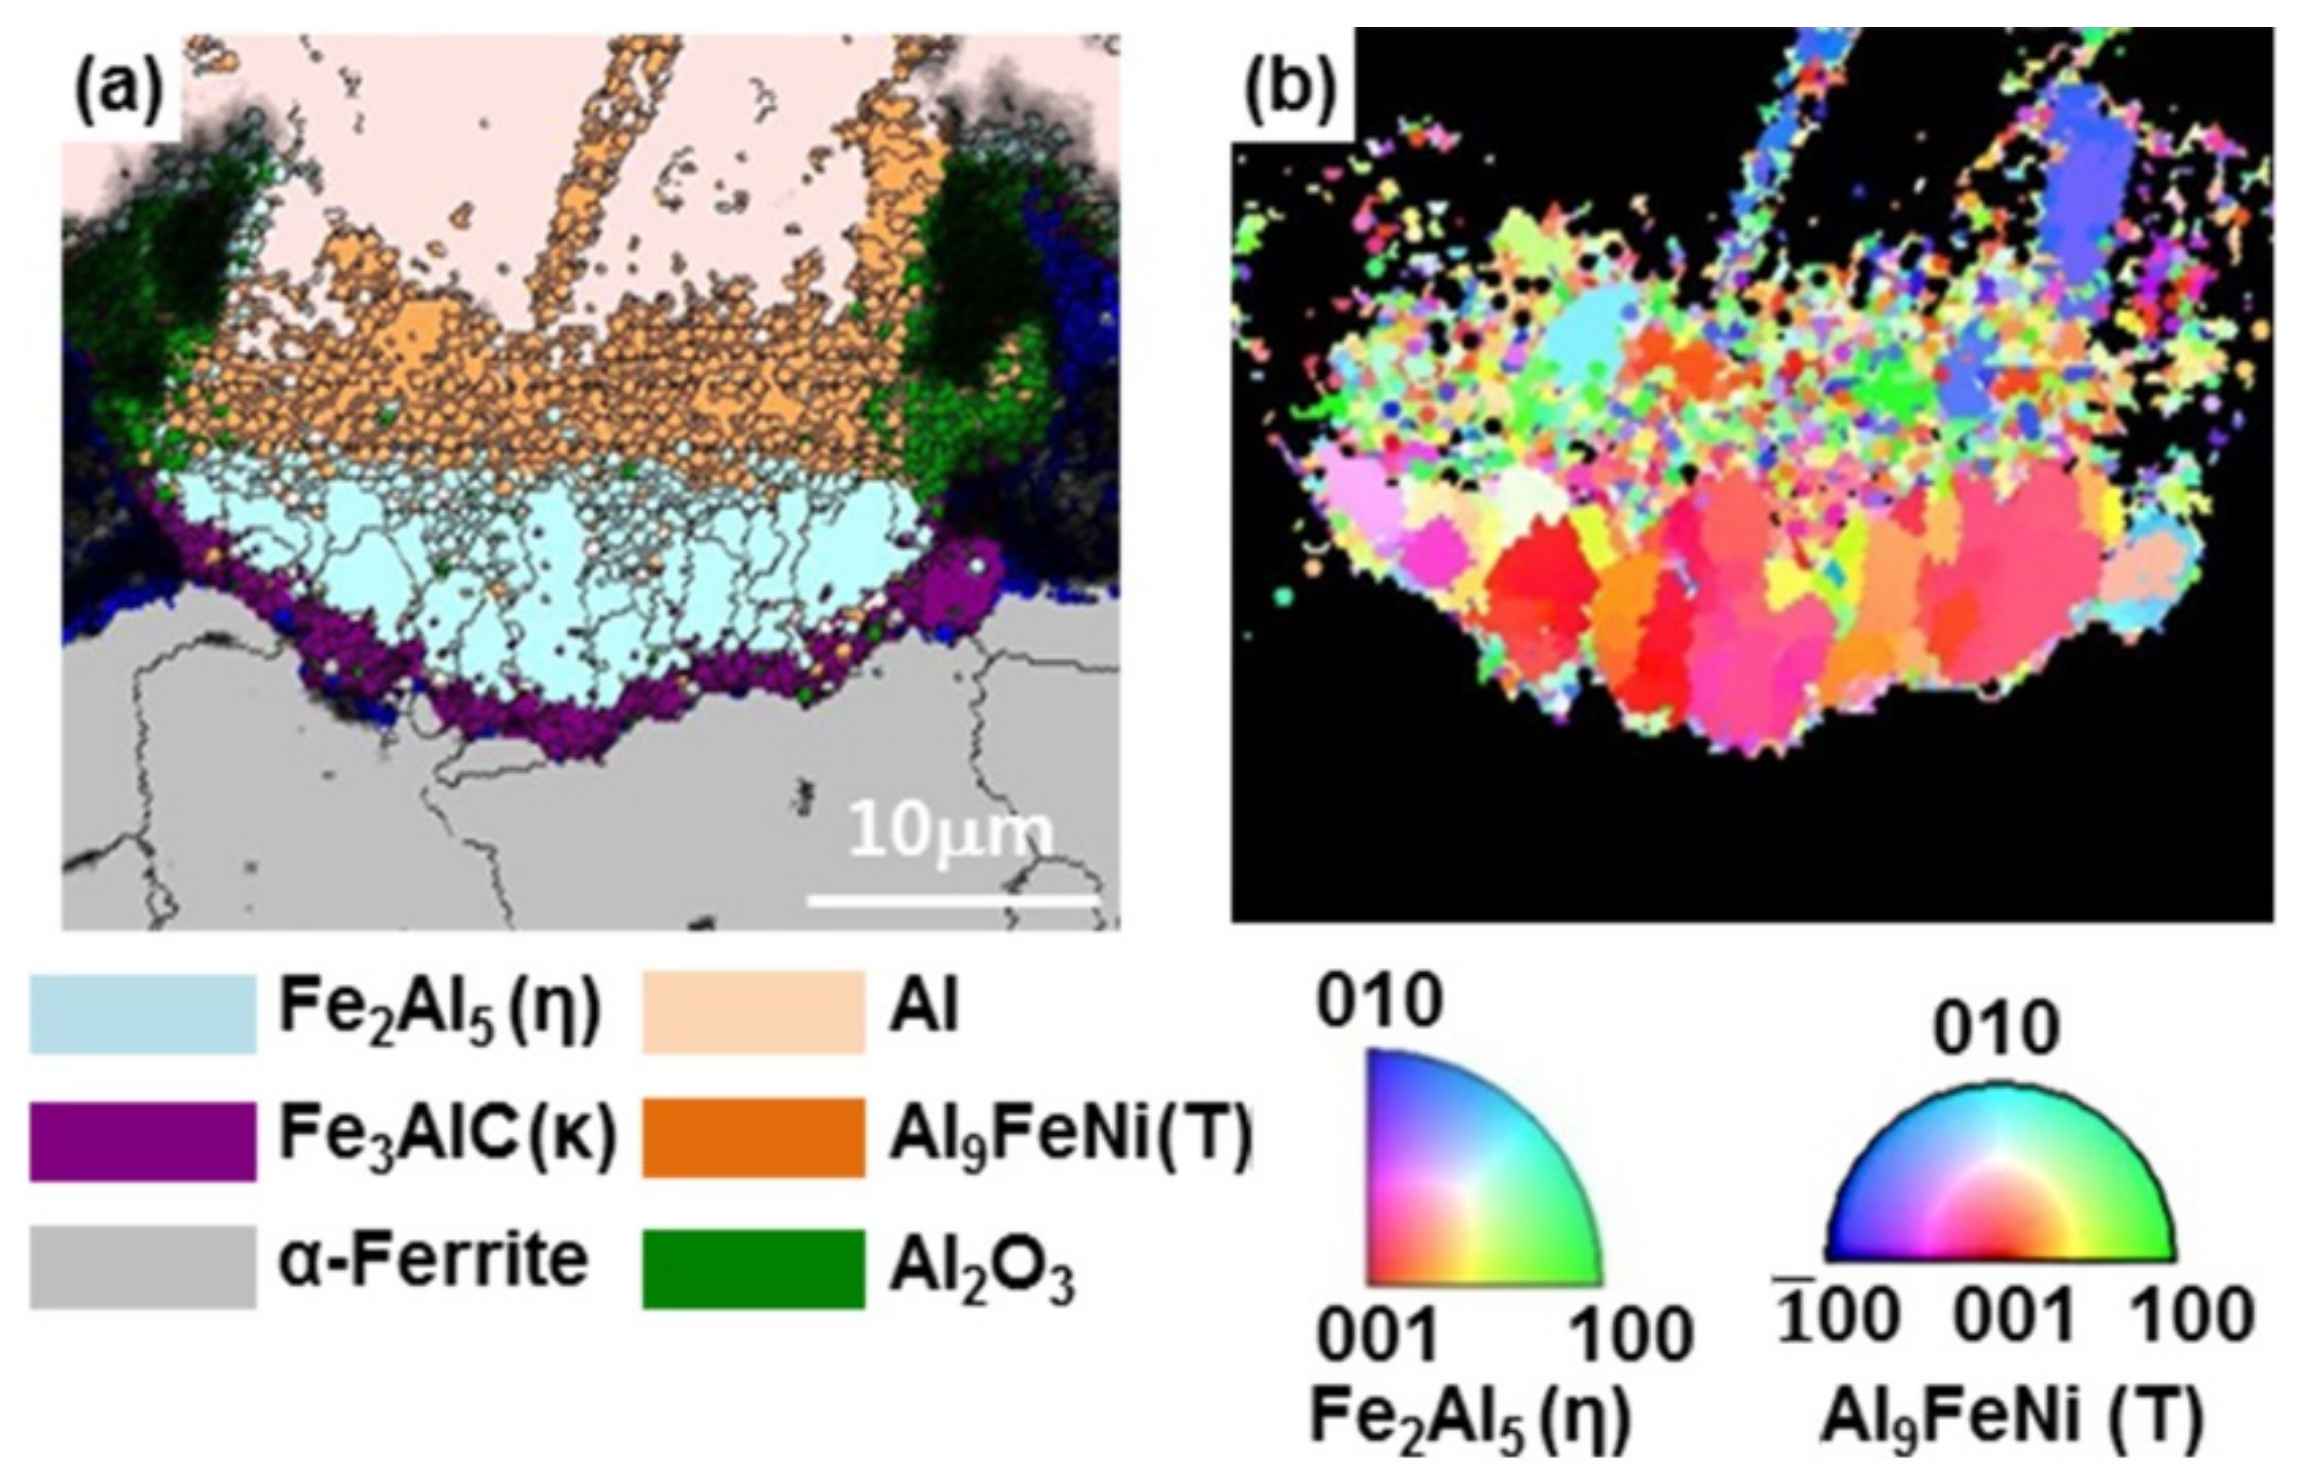
Figure 12.
(a) BSE image and (b–f) results of the EPMA area analysis of the specimen hot-dipped for 120 s: (b) Al, (c) Ni, (d) Fe, (e) O, and (f) C.
Figure 12.
(a) BSE image and (b–f) results of the EPMA area analysis of the specimen hot-dipped for 120 s: (b) Al, (c) Ni, (d) Fe, (e) O, and (f) C.

Figure 13.
(a) EBSD phase map and (b) IPF analysis (Al9FeNi (T), Fe2Al5 (η) and Fe3AlC (κ) phases) of the specimen hot-dipped for 120 s.
Figure 13.
(a) EBSD phase map and (b) IPF analysis (Al9FeNi (T), Fe2Al5 (η) and Fe3AlC (κ) phases) of the specimen hot-dipped for 120 s.

Figure 14.
Schematic diagram of the nucleation and growth processes of intermetallic phases on the steel hot-dipped in Al–7Ni (wt %) alloy.
Figure 14.
Schematic diagram of the nucleation and growth processes of intermetallic phases on the steel hot-dipped in Al–7Ni (wt %) alloy.

Figure 15.
(Al–7Ni)–xFe (wt %) quasi-binary phase diagram calculated using the Thermo-Calc. software.
Figure 15.
(Al–7Ni)–xFe (wt %) quasi-binary phase diagram calculated using the Thermo-Calc. software.

Figure 16.
Formation mechanism of the reaction layer formed by the dissolution and interdiffusion reactions during the hot-dipping process.
Figure 16.
Formation mechanism of the reaction layer formed by the dissolution and interdiffusion reactions during the hot-dipping process.
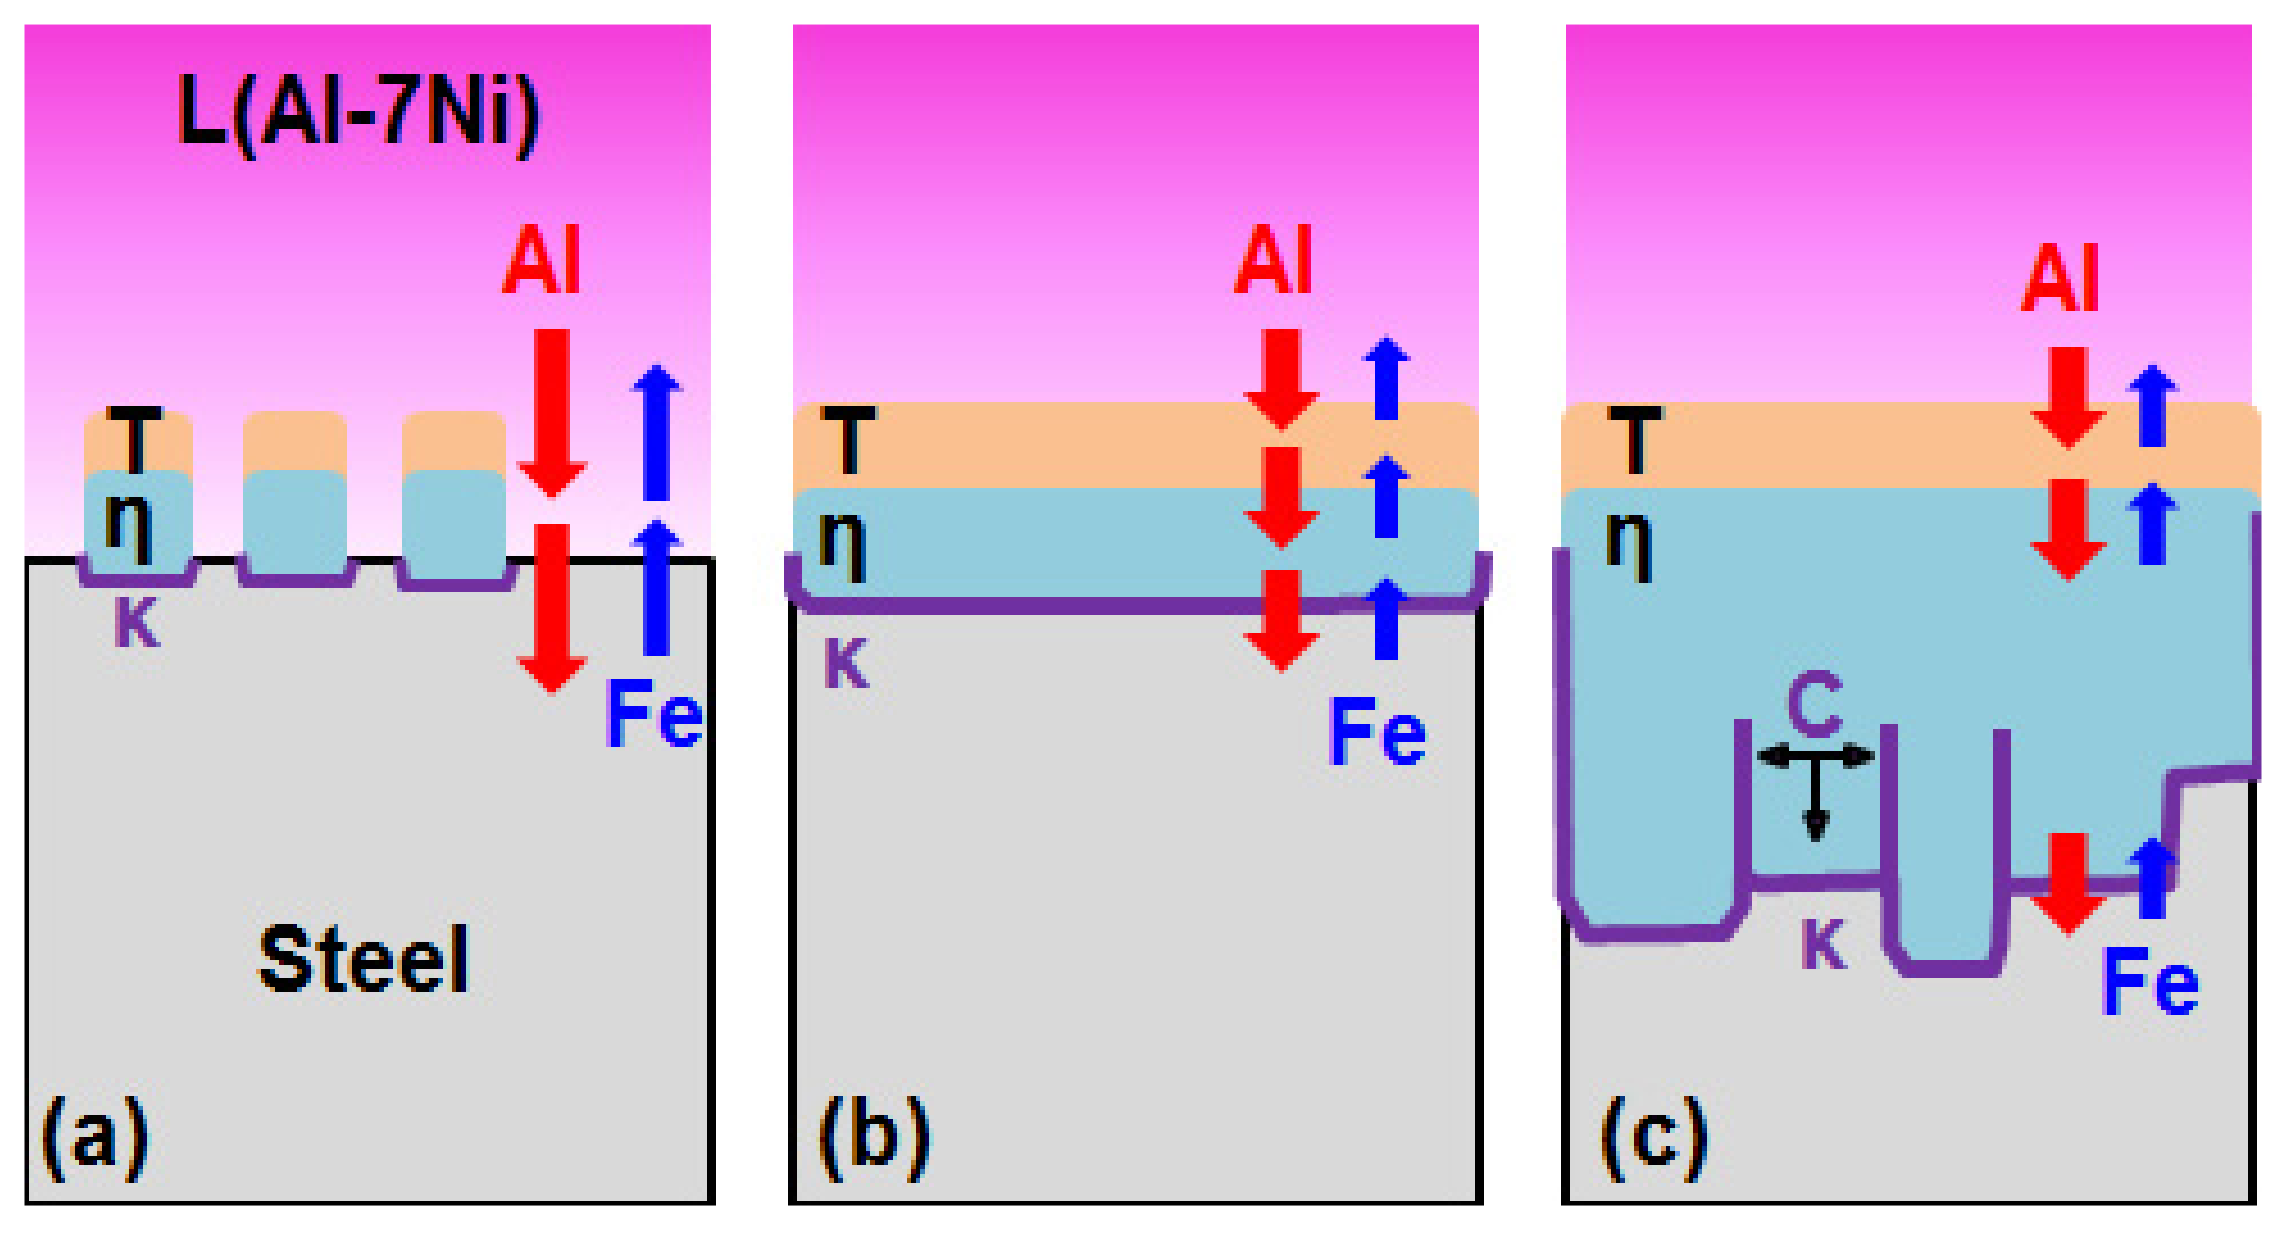
Figure 17.
Steel-xAl quasi-binary phase diagram calculated using the Thermo-Calc. software (α2: Al dissolved α-ferrite. Al: Diamond).
Figure 17.
Steel-xAl quasi-binary phase diagram calculated using the Thermo-Calc. software (α2: Al dissolved α-ferrite. Al: Diamond).

Figure 18.
(a) The Fe2Al5 (η) phase/steel interphase SEM image and (b) concentration profiles of Fe, Al, and C.
Figure 18.
(a) The Fe2Al5 (η) phase/steel interphase SEM image and (b) concentration profiles of Fe, Al, and C.

Table 1.
EDS microanalysis result of phase denoted as “OF” in Figure 1b.
Table 1.
EDS microanalysis result of phase denoted as “OF” in Figure 1b.
| % | Fe | O | B | C |
|---|---|---|---|---|
| at % | 45.5 | 47.0 | 3.3 | 4.2 |
| wt % | 76.0 | 22.4 | 1.1 | 0.5 |
Table 2.
EDS microanalysis results of the phases denoted as A and B in Figure 2a.
Table 2.
EDS microanalysis results of the phases denoted as A and B in Figure 2a.
| No. | Chemical Composition (at %) | Expected Phase | ||
|---|---|---|---|---|
| Al | Ni | Fe | ||
| 1 | 80.1 | 8.30 | 11.6 | Al9FeNi (T) |
| 2 | 74.5 | 1.2 | 24.3 | Fe2Al5 (η) |
Table 3.
EDS microanalysis results of the phases denoted as 1–5 in Figure 5d.
Table 3.
EDS microanalysis results of the phases denoted as 1–5 in Figure 5d.
| No. | Chemical Composition (at %) | Expected Phase | ||
|---|---|---|---|---|
| Al | Ni | Fe | ||
| 1 | 81.4 | 7.2 | 11.5 | Al9FeNi (T) |
| 2 | 82.5 | 8.6 | 8.9 | Al9FeNi (T) |
| 3 | 76.8 | 2.3 | 20.7 | Fe2Al5 (η) |
| 4 | 77.7 | – | 22.3 | Fe2Al5 (η) |
| 5 | 100 | – | – | Al |
© 2017 by the authors. Licensee MDPI, Basel, Switzerland. This article is an open access article distributed under the terms and conditions of the Creative Commons Attribution (CC BY) license (http://creativecommons.org/licenses/by/4.0/).
Share and Cite
MDPI and ACS Style
Lee, J.-H.; Yun, J.-G.; Kwak, S.-Y.; Kang, C.-Y. Nucleation and Growth of Intermetallic Compounds Formed in Boron Steel Hot-Dipped in Al–Ni alloy. Coatings 2017, 7, 195. https://doi.org/10.3390/coatings7110195
AMA Style
Lee J-H, Yun J-G, Kwak S-Y, Kang C-Y. Nucleation and Growth of Intermetallic Compounds Formed in Boron Steel Hot-Dipped in Al–Ni alloy. Coatings. 2017; 7(11):195. https://doi.org/10.3390/coatings7110195
Chicago/Turabian StyleLee, Jae-Hyeong, Jung-Gil Yun, Sung-Yun Kwak, and Chung-Yun Kang. 2017. "Nucleation and Growth of Intermetallic Compounds Formed in Boron Steel Hot-Dipped in Al–Ni alloy" Coatings 7, no. 11: 195. https://doi.org/10.3390/coatings7110195
Note that from the first issue of 2016, this journal uses article numbers instead of page numbers. See further details here.