
IPN Polysiloxane-Epoxy Resin for High Temperature Coatings: Structure Effects on Layer Performance after 450 °C Treatment


1
Department of Chemistry, Material and Chemical Engineering, G. “Natta”, Politecnico di Milano, P.za Leonardo da Vinci 32, 20133 Milano, Italy
2
Akzo Nobel Coatings, Via Silvio Pellico, 10, 22100 Como, Italy
*
Author to whom correspondence should be addressed.
†
Present address: Institute of Materials, École Polytechnique Fédérale de Lausanne, EPFL, Route Cantonale, 1015 Lausanne, Switzerland
Coatings 2017, 7(12), 213; https://doi.org/10.3390/coatings7120213
Submission received: 23 October 2017
/
Revised: 21 November 2017
/
Accepted: 22 November 2017
/
Published: 28 November 2017
(This article belongs to the Special Issue Active Organic and Organic-Inorganic Hybrid Coatings and Thin Films: Challenges, Developments, Perspectives)
Abstract
:Coatings for high temperatures (HT > 400 °C) are obtained from interpenetrating polymer network (IPN) binders formed by simultaneous polymerization of silicone and epoxide pre-polymers. A ceramic layer; mainly composed of silica and fillers; remains on the metal surface after a thermal treatment at 450 °C. The layer adhesion and the inorganic filler’s distribution have been investigated by, firstly, exchanging the organic substituents (methyl and phenyl) of the silicone chains and, secondly, by adding conductive graphene nanoplatelets with the aim to assure a uniform distribution of heat during the thermal treatment. The results are evidence that different substituent ratios affect the polymer initial layout. The adhesion tests of paint formulations are analysed and were related to instrumental analyses performed using glow discharge optical emission spectroscopy (GDOES); thermal analyses (TG/DTA and DSC); electron microscopy with energy dispersive X-ray analysis (SEM-EDX). A greater resistance to powdering using phenyl groups instead of methyl ones; and an improved distribution of fillers due to graphene nanoplatelet addition; is evidenced.
1. Introduction
The protection against corrosion of a metal surface with an organic or inorganic coating is the main application for coatings [1] (the global anticorrosion coating market was estimated to be $24.84 billion in 2017 and is projected to reach $31.73 billion by 2022, at a CAGR (Compound Annual Growth Rate) of 5.0% from 2017 to 2022 [2]). An important demand in this sector is the protection against thermo-oxidative corrosion of the metal parts of the internal combustion engines, turbines, and heaters (other applications are: oven parts, chimney pipes, fireplace inserts, steam lines, furnaces, lighting fixtures, heat exchangers, boilers, engines, exhaust stacks, and mufflers). The wall temperature reaches 400–600 °C, at which point the organic binders degrade due to the chemical and thermal instability of the C–C bonds. Traditional organic coatings for metals, like those based on acrylic and/or epoxy polymers, are stable only up to 60–80 °C; above 150 °C, degradation takes place. On the contrary, the binders based on hybrid organic–inorganic-containing polysiloxane show superior thermal stability [3].
The thermal stability increases more if an interpenetrating polymer network (IPN), with the chains entangled one into the other in a dense network, is used as the binder [3]. Indeed, organic- and inorganic-based monomers, or pre-polymers, mixed together, can separately self-polymerize with different chemistries changing the material performances, an example is the thermal behaviour, from that obtained with the single resin one [4]. These binders, when they also contain ceramic or metallic fillers, find application for heat resistant coatings at high temperatures [4,5]. However, the binders previously described in the literature are intercrosslinked networks obtained with sequential reaction steps, not with a simultaneous polymerization, using networking agents and curing. In the first case, the compatibility between organic and hybrid polymeric materials is obtained by the formation of covalent bonds, but thermal stability appears lower than in the simultaneous IPN obtained by a single step.
The characterisation of silicone or IPN coatings, used as binders, relies on colour and gloss changes, blistering, cracking, and loss of adhesion after exposures at high temperature. Loss of gloss is produced by continuous break-down of the organic chains at the surface. However, when the phenomenon becomes so strong and extensive, until the complete degradation of the binder, the pigment splits from the binder and chalking occurs; chalking is the term used to define the release of pigments and particles [6,7].
The present work concerns the coatings obtained by a simultaneous polymerization of silicone and epoxy-acrylic pre-polymers to give IPNs [4], in which the formation of physical constraints, like polymeric domains or polymer-matrix nanocomposite distribution, affects the chalking extent. The constraints are supposed to affect the removal of thermally-degraded organic fractions from the coating surface. Silicone-epoxy-acrylic IPNs were selected according to their properties. Epoxy resins are characterized by low shrinkage, easy curing and processing, and the films obtained from them acquire excellent solvent and chemical resistance, great toughness, and good adhesive strength; otherwise, they suffer thermal stability and pigment holding ability [7]. Silicone resins and the derived films show superior thermal and thermo-oxidative resistance, partial ionic nature, excellent moisture resistance, low surface energy and good flame retardant properties. Moreover, silicone resins are used as epoxy resin modifiers [8]. Acrylics, properly reacting with epoxies, were added to improve the mechanical properties of the coatings. With the aim of increasing IPNs thermal resistance, we examined the properties of polymer-graphene nanocomposites to understand the behaviour of these materials at high temperatures. Indeed, following the indications of the literature [9,10,11], the high graphene thermal conductivity associated with its leaflet morphology, could promote a homogeneous thermo-oxidative degradation of the coatings [12]. Moreover, graphene’s low permeability to all gases and salts, due to the quasi 2D structure, appears to be an excellent candidate in anticorrosion coatings [13].
Sample films were obtained by powder paints due to the high performances and environmental constraints, accompanied by a satisfactory and easy application [14,15,16]. Adhesion tests are performed and the results, examined also to infer the powdering degree, are interpreted by the data obtained with instrumental analyses: firstly, thermal analysis, and then GDOES and SEM.
2. Materials and Methods
2.1. Materials
The coating components were:
- As binder: (IPN polymer resin) the silicone resins (Wacker Silres®, Milano (MI), Italy) and Dow Corning Xiameter® (Midland, MI, USA) and epoxy resins (DOW D.E.R.®, Midland, MI, USA), were added with acrylic resins (BASF, Joncryl®, Ludwigshafen am Rhein, Rhineland-Palatinate, Germany);
- As fillers/pigments: baryte (Aprochimide Baryte, Muggiò (MI), Italy), wollastonite (Nyco Nyad, Hermosillo, Sonora, Mexico), micro mica (Norwegian Talc, N-5355 Knarrevik, Norway), manganese ferrite black spinel (Ferro, Cleveland, OH, USA), and graphene nanoplatelets (Directa Plus, Lomazzo, Italy);
- As additives: benzoin (Miwon Speciality Chemical, Gyeonggi-do, Korea), flow control additive (Estron Chemical, Calvert City, KY, USA) and fluidization additive (Evonik Industries, Essen, Germany).
2.2. Paint Formulations
Many different paint formulations were prepared (see [17] for a complete description of formulations and a listing of prepared samples). In this paper, we considered four of them using the compositions reported in Table 1.
The weight of each batch was 1 kg and the total ligand amount was 510 g.
The components of pigment and filler inorganic mixtures are presented in Table 2, together with the physical properties.
2.3. Paint Preparation
A detailed description of the powder coatings production process is outlined in the following list: Raw material weighting—Low temperature mixing—Extrusion—Calendering—Cooling down—Pelletizing—Milling—Sieving—Post-additivation—Sieving, again.
An OMC Saronno EBVP30/20 co-rotating intermeshing twin screw extruder (OMC, Saronno (MI) Italy) was used; right-handed and left-handed elements and kneading disks provided distributive and dispersive mixing, extremely important in the case of nanofillers [10]. During extrusion, the temperatures of the five screw regions were set at 15 °C, 30 °C, 90 °C, 110 °C, and 80 °C respectively; the feeding screw was set to 1.5 rpm, and torque was checked.
After calendering, −25 °C cooling was performed in order to simplify the pelletizing process. Polymeric pellets were milled by an ALPINE rod mill (HOSOKAWA ALPINE Aktiengesellschaft, Augsburg, Germany) and later sieved using an Endecotts laboratory test (London, UK), 125-μm sieve.
2.4. Application
Powder coatings were applied on standard low-carbon, cold-rolled steel (6 cm × 20 cm) panels after sandblasting with inert soda-lime and tempered glass microspheres, whose mean particle size was 214.6 μm. The treatment was performed manually adopting a gun-iron panel distance at about 30 cm.
Powder coatings application was performed manually using a corona charging system on a GEMA powder gun (GEMA, Trezzano sul Naviglio, Italy), according to [18]. Powder was carefully fed into a venturi pump and then pneumatically transported to the corona gun by a feeding gas at 1.3 bar pressure. One hundred kilovolts were applied at room temperature at a 250-mm gun tip-substrate distance. A flat nozzle was used, forming an elliptical powder cloud in front of the gun. Then, a 40–60 μm coating thicknesses were applied in order to maximize the thermal resistance. Curing was performed in a Thermo Scientific Heraeus batch oven (Thermo Fisher Scientific, Waltham, MA, USA) at 210 °C for 20 min. High-temperature tests (HT) were performed at 450 °C for 12 h.
2.5. Instrumental Methods
The thickness of the coated panels was measured by electromagnetic induction based on Byko test 8500 (Byko, Norvik hf, Reykjavik, Iceland). High-temperature samples with exposure at 450 °C for 12 h was performed. Paint formulations, coated on sandblasted panels, were placed in a Galli G-21HT muffle furnace (Galli, Fizzonasco di Pieve Emanele, Italy). After exposure, specimens were removed from the furnace to be air-cooled to room temperature for at least one hour. Inspection was carried out according to the ASTM D2485-91 (2013) standard. Evidence of peeling, cracking, blistering, abnormal discoloration, chalking, and loss of adhesion were checked. An adhesion cross-cut test was performed before and after heat treatment at 450 °C for 12 h according to ISO 2409:2007 (E). A six-blade cutting Byko-cut Universal Paint Inspection Gauge (Byko, Norvik hf, Reykjavik, Iceland) with 1 mm spaced cutting edges was used. Thermogravimetric and differential thermal analyses (TG–DTA) were performed with a SII Seiko Instruments Exstar 6000 TG–DTA 6300 unit (Seiko Instruments, Torrance, CA, USA). Thermal runs were set from 25 °C to 800 °C; an air atmosphere was used to study coatings’ thermal degradation as in real working conditions. A heating rate of 10 °C·min−1 was selected. The results were reported showing wt % vs. temperature in thermogravimetric plots, as wt %·min−1 vs. temperature in DTG graphs, and as thermocouple μV vs. temperature in DTA curves.
Differential scanning calorimetry (DSC) analyses were performed with a heat flux SII Seiko Instruments Exstar 6000 (Seiko Instruments, Torrance, CA, USA). The selected thermal cycle was composed of a ramp from 25 °C to 300 °C at a 10 °C·min−1 heating rate, followed by cooling to 25 °C at the same speed. The heating was then repeated with a thermal run from 25 °C to 500 °C at 10 °C·min−1; a nitrogen atmosphere was used. Results were reported as mW/°C. Finally, the areas under the peaks were calculated using machine software (Seiko Instruments Inc. “SII”, Iwate, Japan).
Qualitative glow discharges optical emission spectroscopy (GDOES) was performed with a Spectruma GDA 750 analyser (Spectruma, Hof, Germany). Scanning electron microscopy-energy dispersive X-ray spectroscopy (SEM-EDS) analyses was performed using a Zeiss EVO 50 EP-Oxford Inca energy 200 LZ4 spectrometer (Carl Zeiss, Oberkochen, Germany).
3. Results and Discussion
Four IPN specimens were taken as representative among the many (the investigations were performed using more than 100 preparations [17] so as to cover many parameter effects); they were named as S4, S6, SF1, and SF2, respectively (Table 1). S4 and S6 are composed of a mixture of three resins (silicone, epoxy, and carboxylic acrylic) together to pigment black, functional fillers, and additives. A phenyl silicone resin is present in S4, while a methyl-phenyl silicone resin is present S6, with the same weight fraction. In SF1 and SF2 IPNs, the same S6 formulation was maintained, except for partial substitution of the pigment concentration by graphene nano-platelets, with different weight fractions. Functional fillers and additives were added to decrease the amount of pyrolytic decomposition of the organic binder and to avoid defect formation during the film-forming process, respectively [19].
3.1. Adhesion
In order to satisfactorily prevent substrate oxidation in thermal oxidative conditions, coatings must adhere to the surface on which they are applied [4,5]. Cross-cut tests were carried out to assess film adhesion before and after heat treatment.
The images of the coated surfaces printed on the tapes, removed from the cross-cut areas, are presented in Figure 1 and Figure 2 in order to provide evidence of the flaking (powdering) degree. Optical microscopy has been used to obtain the high-definition images for a reliable evaluation. S6 and SF1 paint formulations show the best adhesion before heat treatment and their rating is consequently classified as 0 (Table 3 according to ISO 2409:2007 (E)); a different intensity of failures was found for the S4 and SF2 samples.
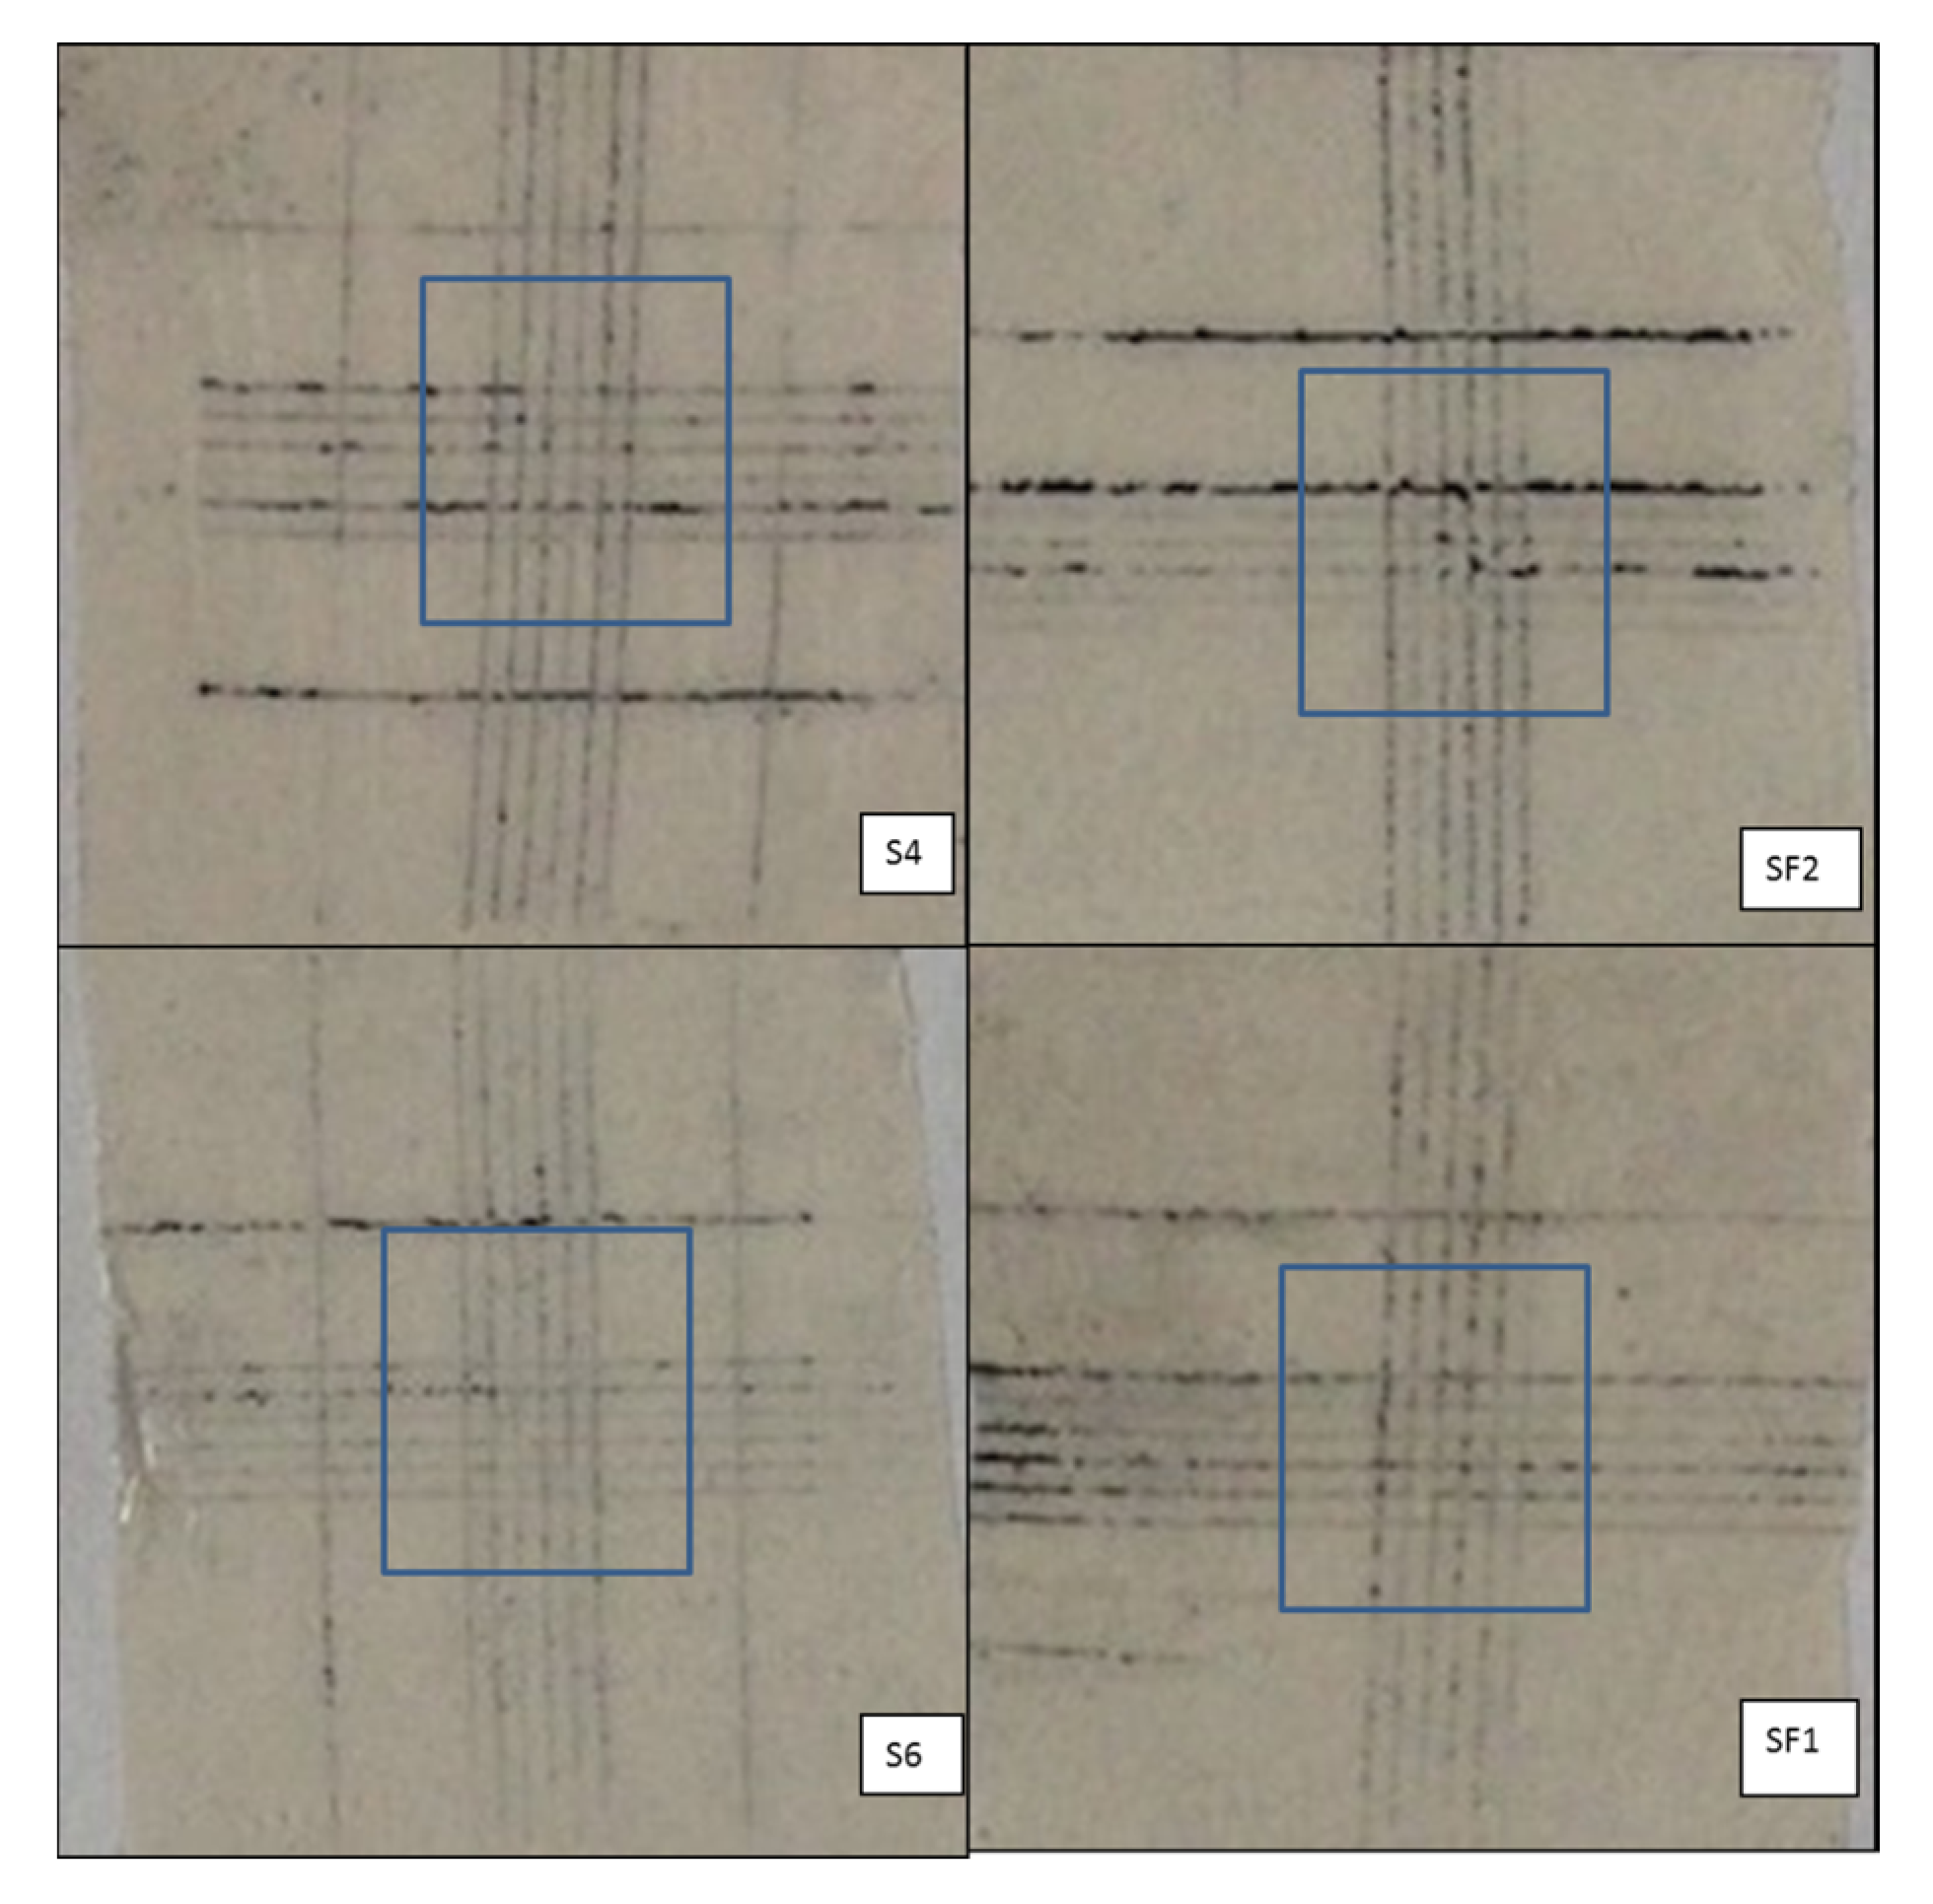
After thermal treatment (the tape images, after heat treatment, are reported in Figure 2), a strong pyrolytic decomposition of the IPN organic part was expected. Indeed, although silicone resin backbone has high thermal stability, its organic substituents suffer strong degradation in air at T > 300 °C [20,21,22,23,24]. According to [20], the oxygen catalyses the silicone weight loss, the residual part of it (the backbone) undergoes the formation of a thermally-stable and tightly-reticulated, more inorganic than organic, network. Furthermore, the adhesion on the substrate may be promoted by the high temperature due to element inter-phase diffusion. Thus, cross-cut tests were carried out one more time to check the substrate coating adhesion and the silicone effect. The adhesion classification, before and after HT, is reported in Table 3.
The S4 samples have the weakest adhesion with a worsening after HT, while the S6 and SF1 coatings remain almost stable and the SF2 samples seems to show a small increase of the adhesion after heat treatment. Adhesion tests suggest that the phenyl amount on silicone chains have to be reduced: phenyl silicone S4 sample indeed shows a bad result on cross-cut test after heat treatment. In an attempt to explain the behaviour, we could hypothesize that carbon and carbonaceous residues would remain for a longer time in the silicon oxide network and interfere with the formation of bonds to the metal during pyrolysis due to slow combustion kinetic of aromatic substituent at 450 °C.
Indications of chalking can be inferred from the images of the adhesion tests; firstly, referring to the high degradation degree of the S4 sample (Figure 2), the tape surface does not present any transparency over the whole cutting area caused by the de-structured binder. In this case, the phenyl silicone resin shows a strong and intense chalking, so the cross-cut area is much darker in S4 tape in comparison with the same area of methyl-phenyl silicone-containing samples.
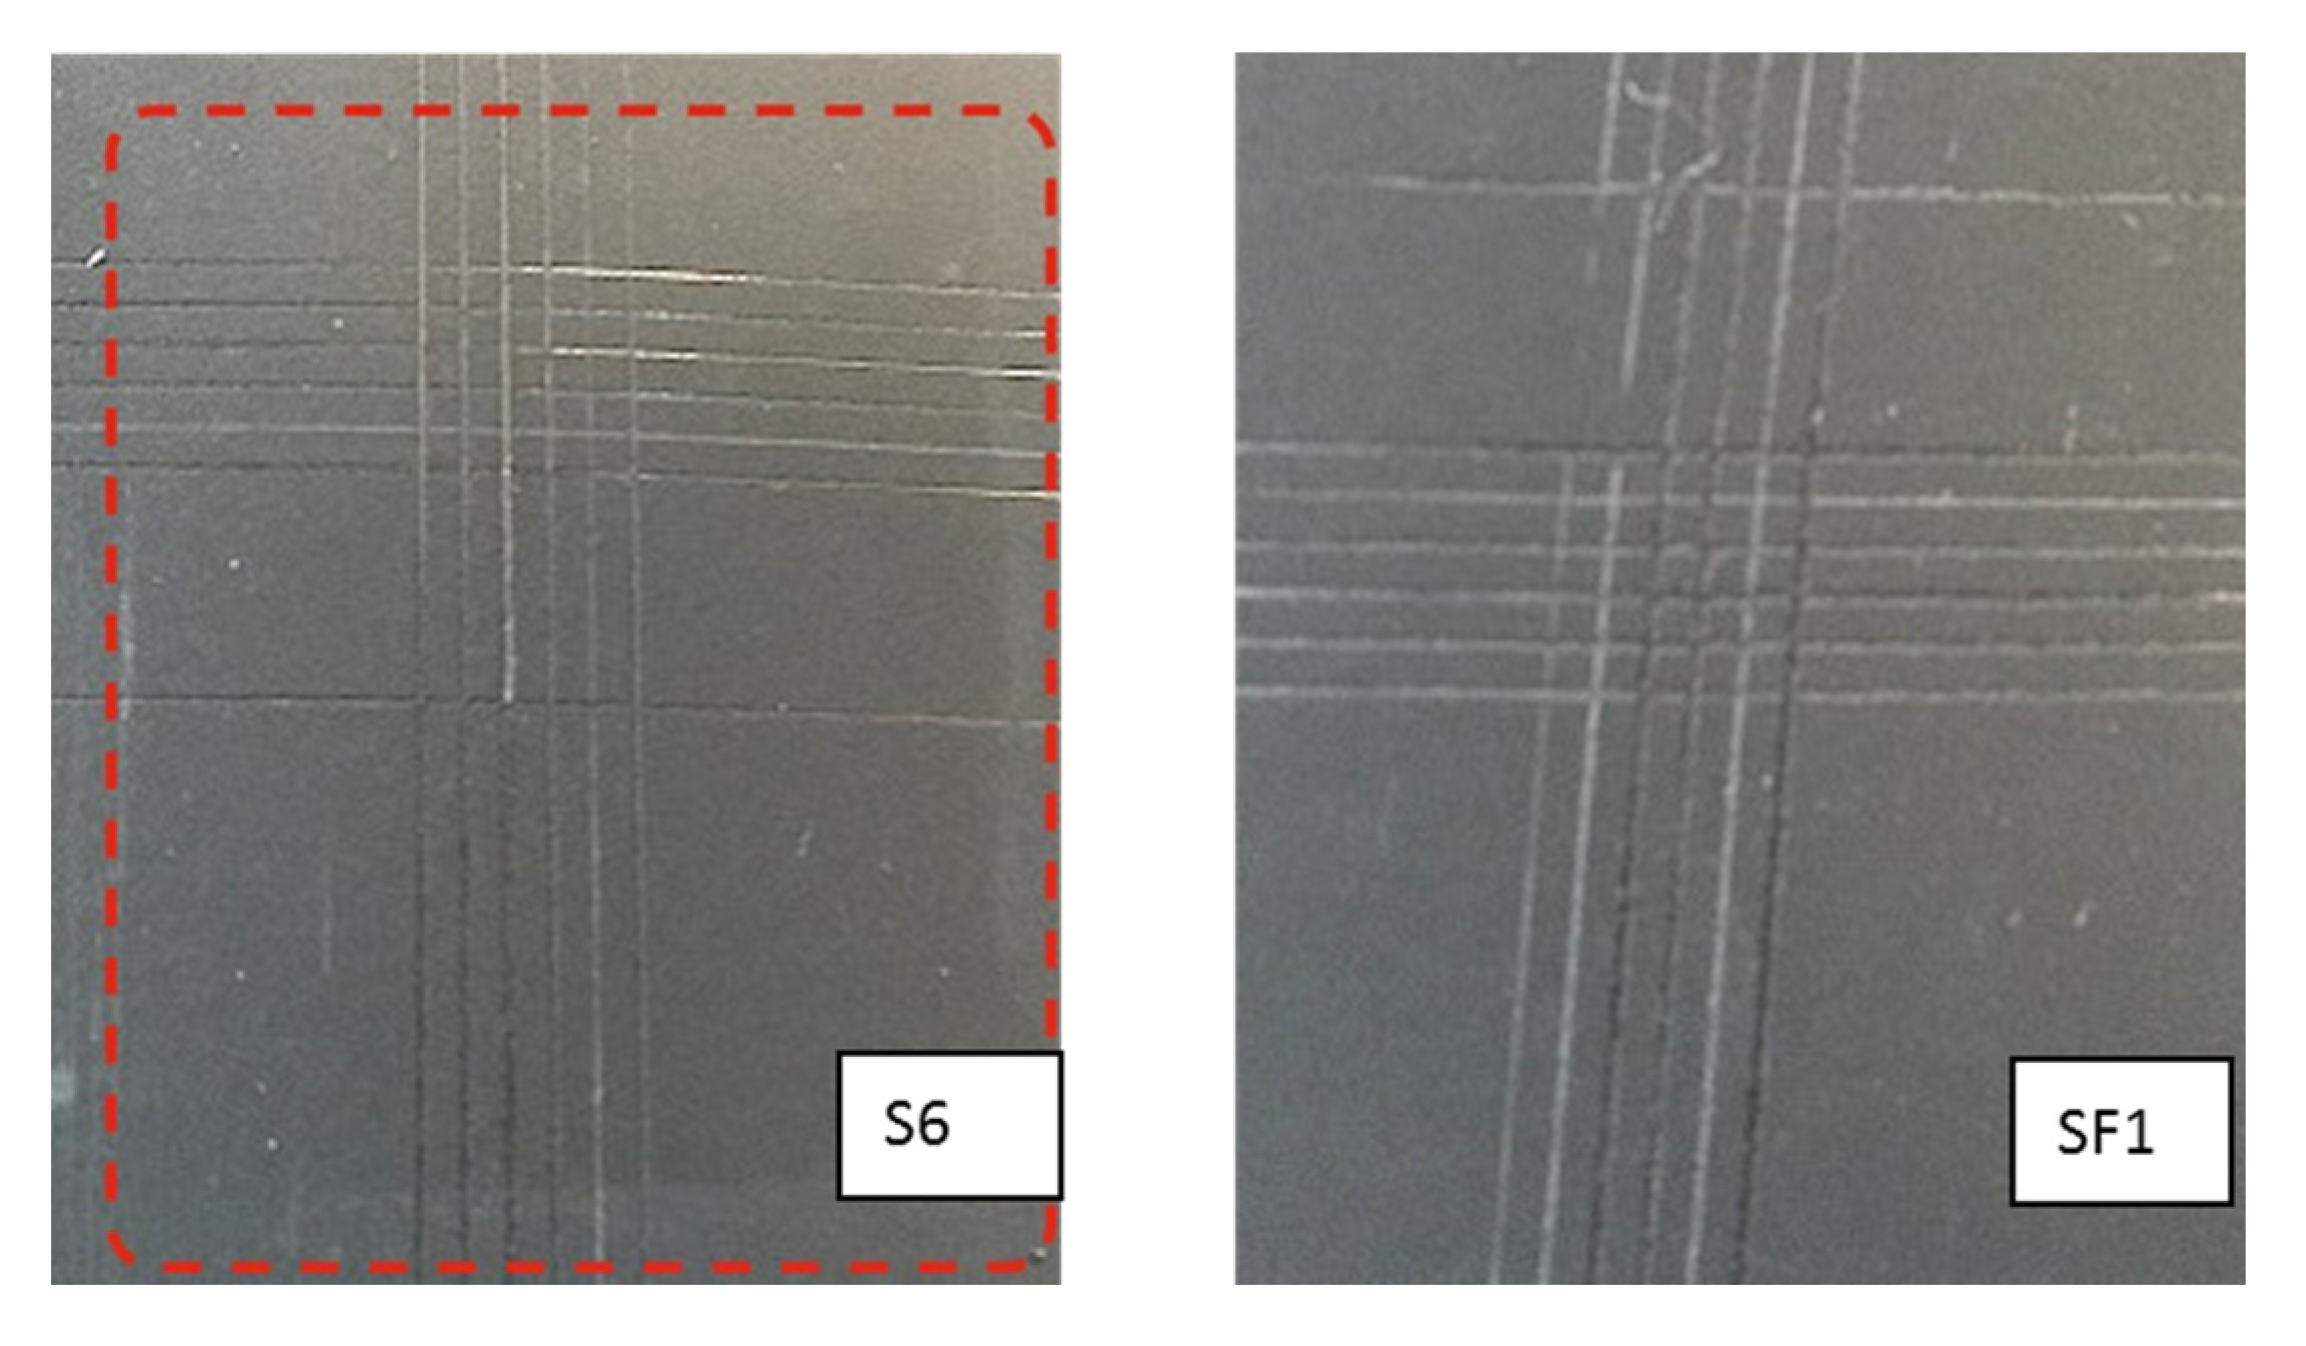
For the sake of completeness, in Figure 3 we report the images of S6 and SF1 panels after heat treatment. At the same adhesion, no shadows are present on the SF1 surface, both in and out of the cutting area, indicating a more limited chalking.
The presence of graphene probably increases adhesion after thermal treatment as the SF2 sample assessment is two steps before HT (Table 3, change from two to one). As expected, the chalking increases after heating as supported by the bad transparency of the tapes, as reported in Figure 2. However, from the visual exam of the panel instead of the tapes after HT (Figure 3), SF1 presents fewer shadows than S6 indicating a less chalking degree. Investigating the filler amount effect, SF1 and SF2 present little and no discernible cleanliness difference on tapes.
The superior resistance to chalking produced by graphene addition may be related to enhanced properties of polymer-graphene nanocomposites [10]. The network of graphene nanoplatelets inside the binder matrix is supposed to increase mechanical and thermal performances at high temperatures [9,11]. Finally, thermal conductivity of the graphene sheet may favor the homogeneous degradation of the organic part of the IPNs binder, avoiding high-temperature peaks [4].
3.2. Thermal Analysis
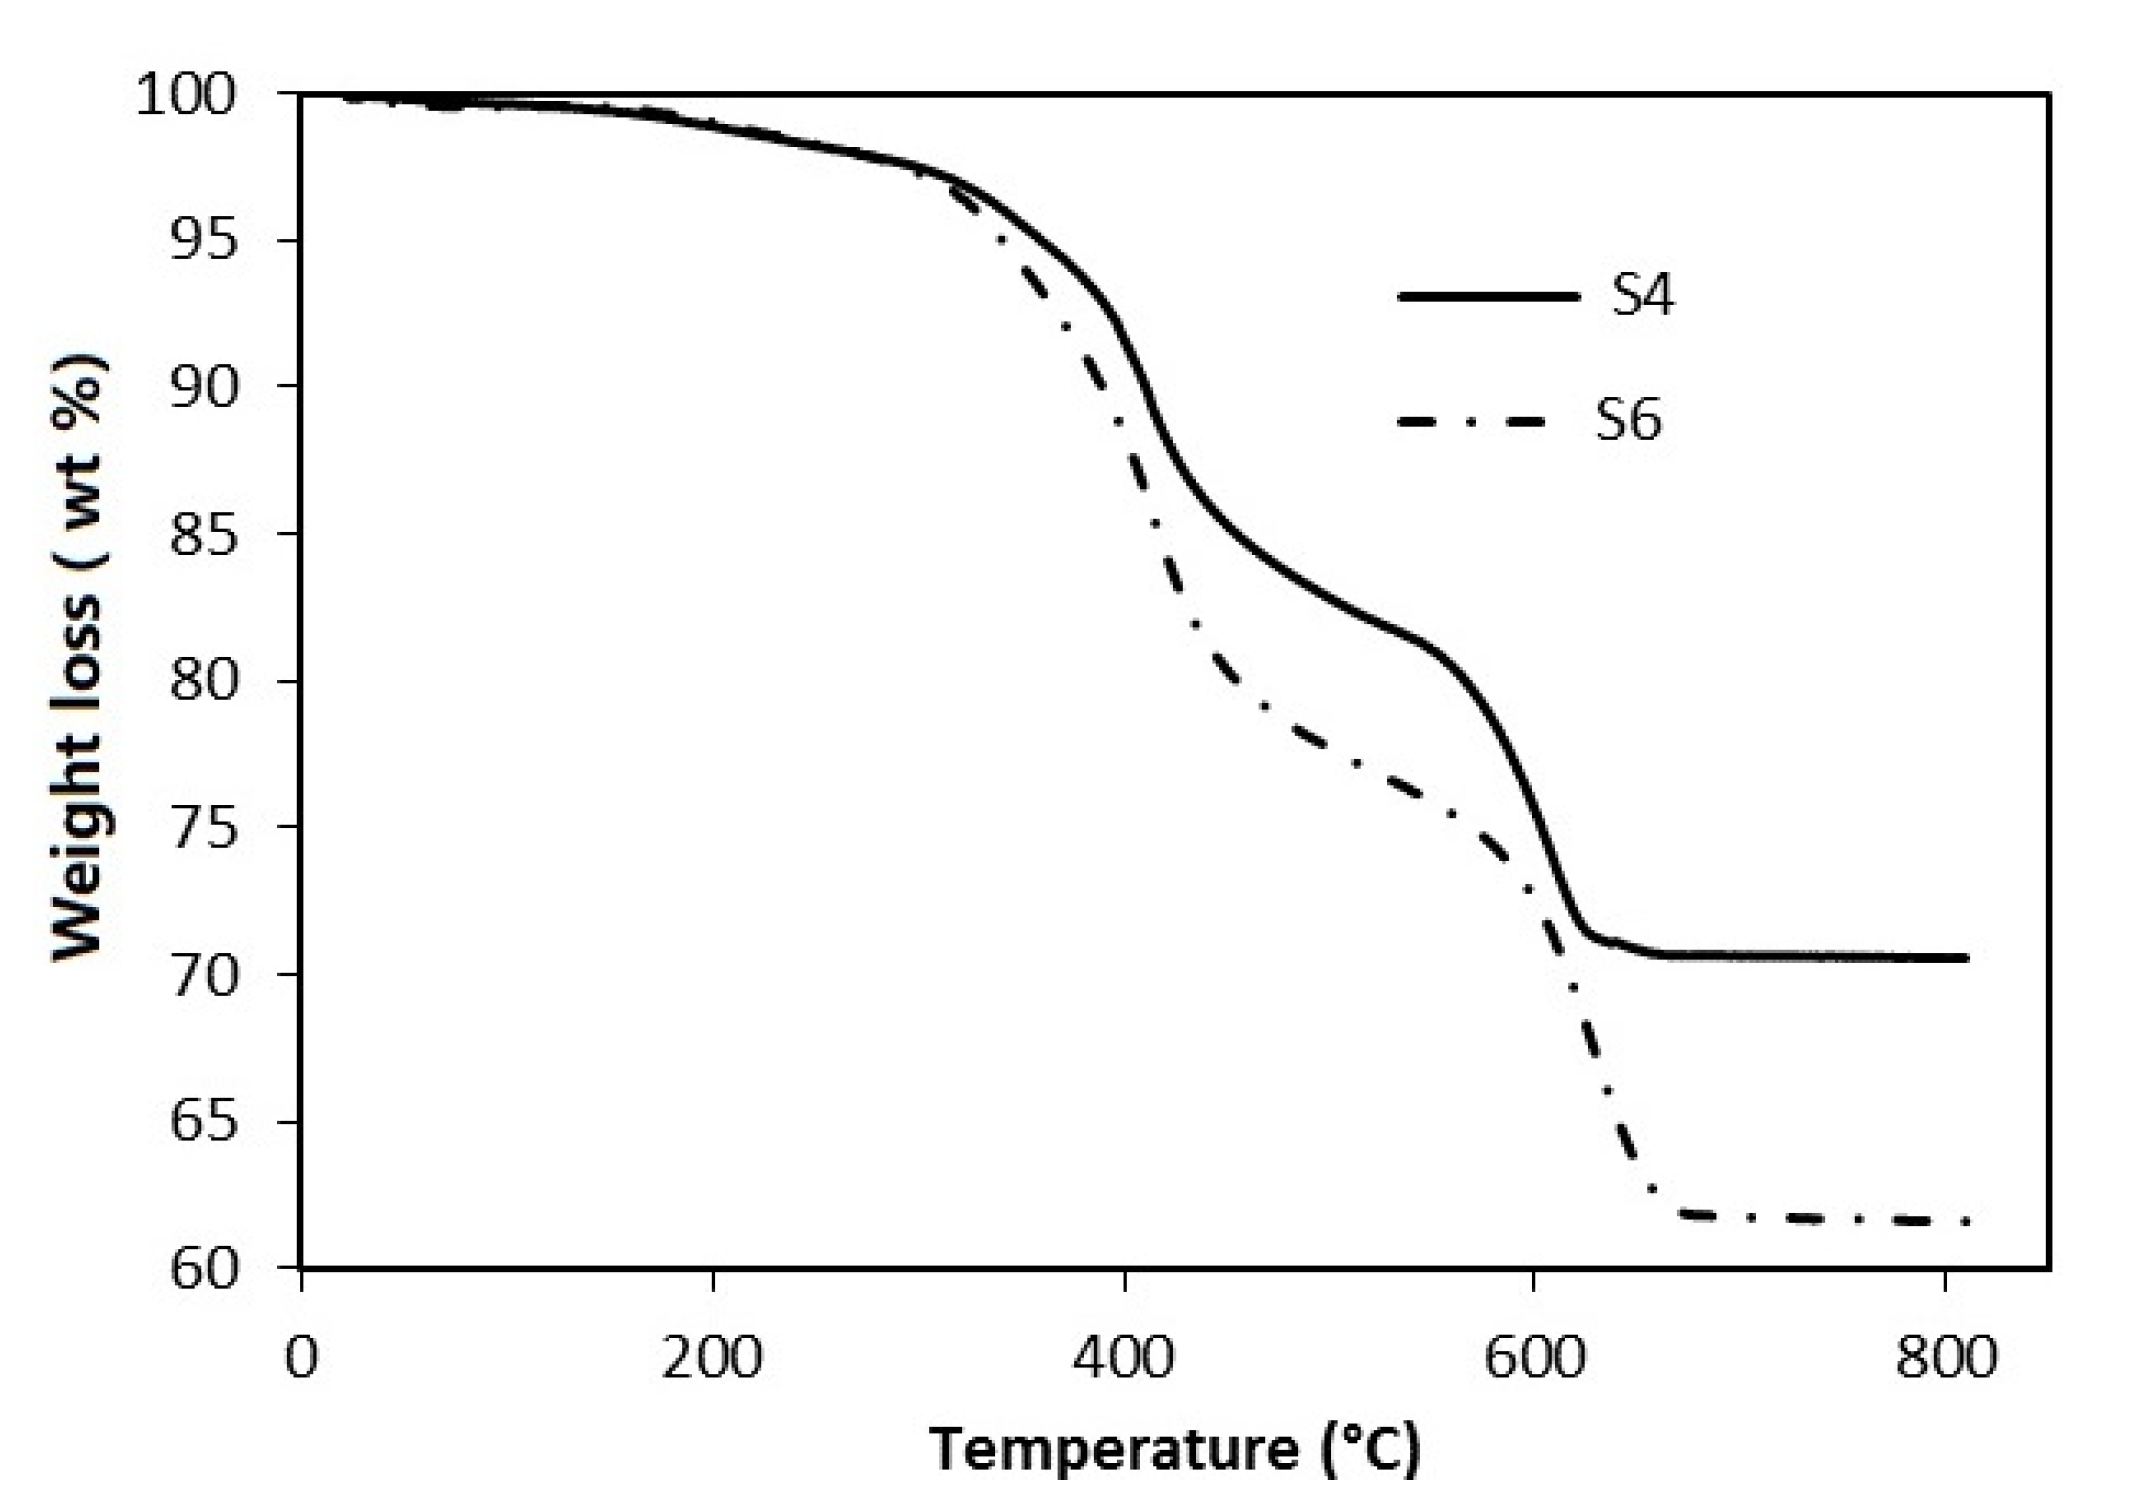
The thermo-gravimetric analysis (TG) provides information on thermal stability (weight loss at increasing temperature) of coatings after heat curing (210 °C) and suggests hypotheses about the degradation mechanism. All curves are characterized by two weight losses (Figure 4) according to the cited literature with different rates of degradation.
The first and the second weight loss (wt %) are reported in Table 4 relative to the four examined samples: the total losses are in the 26–37.3% range at high temperatures (680 °C, max). The result is related not only to the presence of a high amount of functional fillers in each formulation, as reported in Table 1, but also to the presence of silicone polymers that have high residual masses after thermal degradation (up to 55% for methyl-phenyl [24]). Nevertheless, the oxidative cross-linking reaction rearranges all the residual organosilanes to silica. The reaction mechanism is probably triggered by the formation of radicals on side groups that react with oxygen and produce peroxide functions which accelerate the rearrangement. Finally, in an oxidative environment, some silica may be obtained from the competition between volatilization of oligomers and oxidative cross-linking [20,21,22,25].
The S4 sample shows the lowest total wt %, mainly concentrated at low temperatures. S6 and SF1 are characterized by higher weight losses than S4, while SF2 presents an intermediate total wt %. The similarity of the second step wt % between S6 and SF1 allowed us to conclude that weight loss does not depend on graphene. We have to note that, from the thermogravimetric point of view, the SF2 losses are less than both S6 and SF1, and are probably due to a different formulation (more pigment is present, as reported in Table 1).
The presence of two strong weight losses were highlighted by time differentiating the TG curves of S4 and S6 samples, as reported in Figure 5.
For both of these samples, two maxima appear at 413 °C and 630 °C, respectively. The first ones have a similar shape (with a shoulder before the peak) and the same maximum temperatures at 413 °C, suggesting the same thermal effect characterized by a beginning lower than 300 °C that could be attributed to the depolymerisation and bond breakings of epoxy-acrylic organic binder fraction. Therefore, DTG analysis revealed that thermal behaviour of epoxy-acrylic binder is similar, notwithstanding the different substituents (phenyl, instead of methyl groups). The only difference is the shoulder that has a different intensity is probably due to the phenyl group fraction.
Once again, the phenyl group seems responsible for the significant temperature differences attributed to the oxidation of organic substituents of silicones, highlighted for the second peak: this appears 27 °C before in the S4 formulation than in S6. Thermal analysis is in agreement with the literature for PDMS stability [20,21,22,23,24], even when considering the presence of other components inside formulations. The temperature difference between the two high-temperature DTG peaks may be attributed to different organic parts, as S4 silicon resin has phenyl groups only, while S6 has methyl and phenyl substituents. The introduction of phenyl substituents on silicone chains has been found to increase the onset temperature of degradation [21,22]. According to [23], the thermal stability of siloxane polymers increases on decreasing the phenyl content and this trend is confirmed by our analyses (the maximum rate of the weight loss on S4 sample appears at ca. 580 °C instead of ca. 600 °C for the S6 sample). Analysing the thermal behaviour at higher temperatures, during polydiphenyl-dimethyl siloxane pyrolysis, evolution of free benzene and volatile cyclic siloxanes occurs, as reported in [20,22]. As seen in Figure 4, the carbon removal, during silicone thermal degradation appears more pronounced at the 280–530 °C weight loss because of a decrease in the phenyl content (a difference of 5.9%); this effect may be due both to the different steric hindrances and to the layout of silicone chains due to methyl of phenyl groups [23]. Accordingly, the inspections of residues of polydiphenyl-dimethyl siloxanes thermally degraded in air revealed a greyish white powder constituted mainly of white silica and black silicon-oxycarbide [23,25] in which Si atoms are simultaneously bonded to carbon and oxygen [26]. Moreover, from the elemental analysis, the weight percent of C concentrations inside residues has been found to be three times higher in the case of a phenyl polysiloxane with respect to a fully-methylated one [23]. Hence, as the phenyl content decreases, a more stable and protective Si–O–C layer is formed without aromatic ring interferences, with low carbon content [24]. As a conclusion, this hypothesis is in accordance with thermogravimetric analysis, which clearly indicates that the S6, SF1, and SF2 samples, composed by a methyl-phenyl silicone, show a greater weight loss than S4. Specifically, thermal analyses indicate that S4 has a lower weight loss than S6, in agreement with the difficulty of carbon residues’ oxidation/separation, as hypothesized above.
Finally, the S4 residue was supposed to present high C content and low ceramic yield. This hypothesis is strongly supported by the lower adhesion and stronger chalking exhibited by the S4 coating with respect to S6, as discussed above [23,24]. Moreover, the second DTG peak is about 30 °C before for the phenyl substituted silicon chain, probably meaning that the oxidized fragments are placed in the upper part of the film, in a more favourable position for chalking to occur.
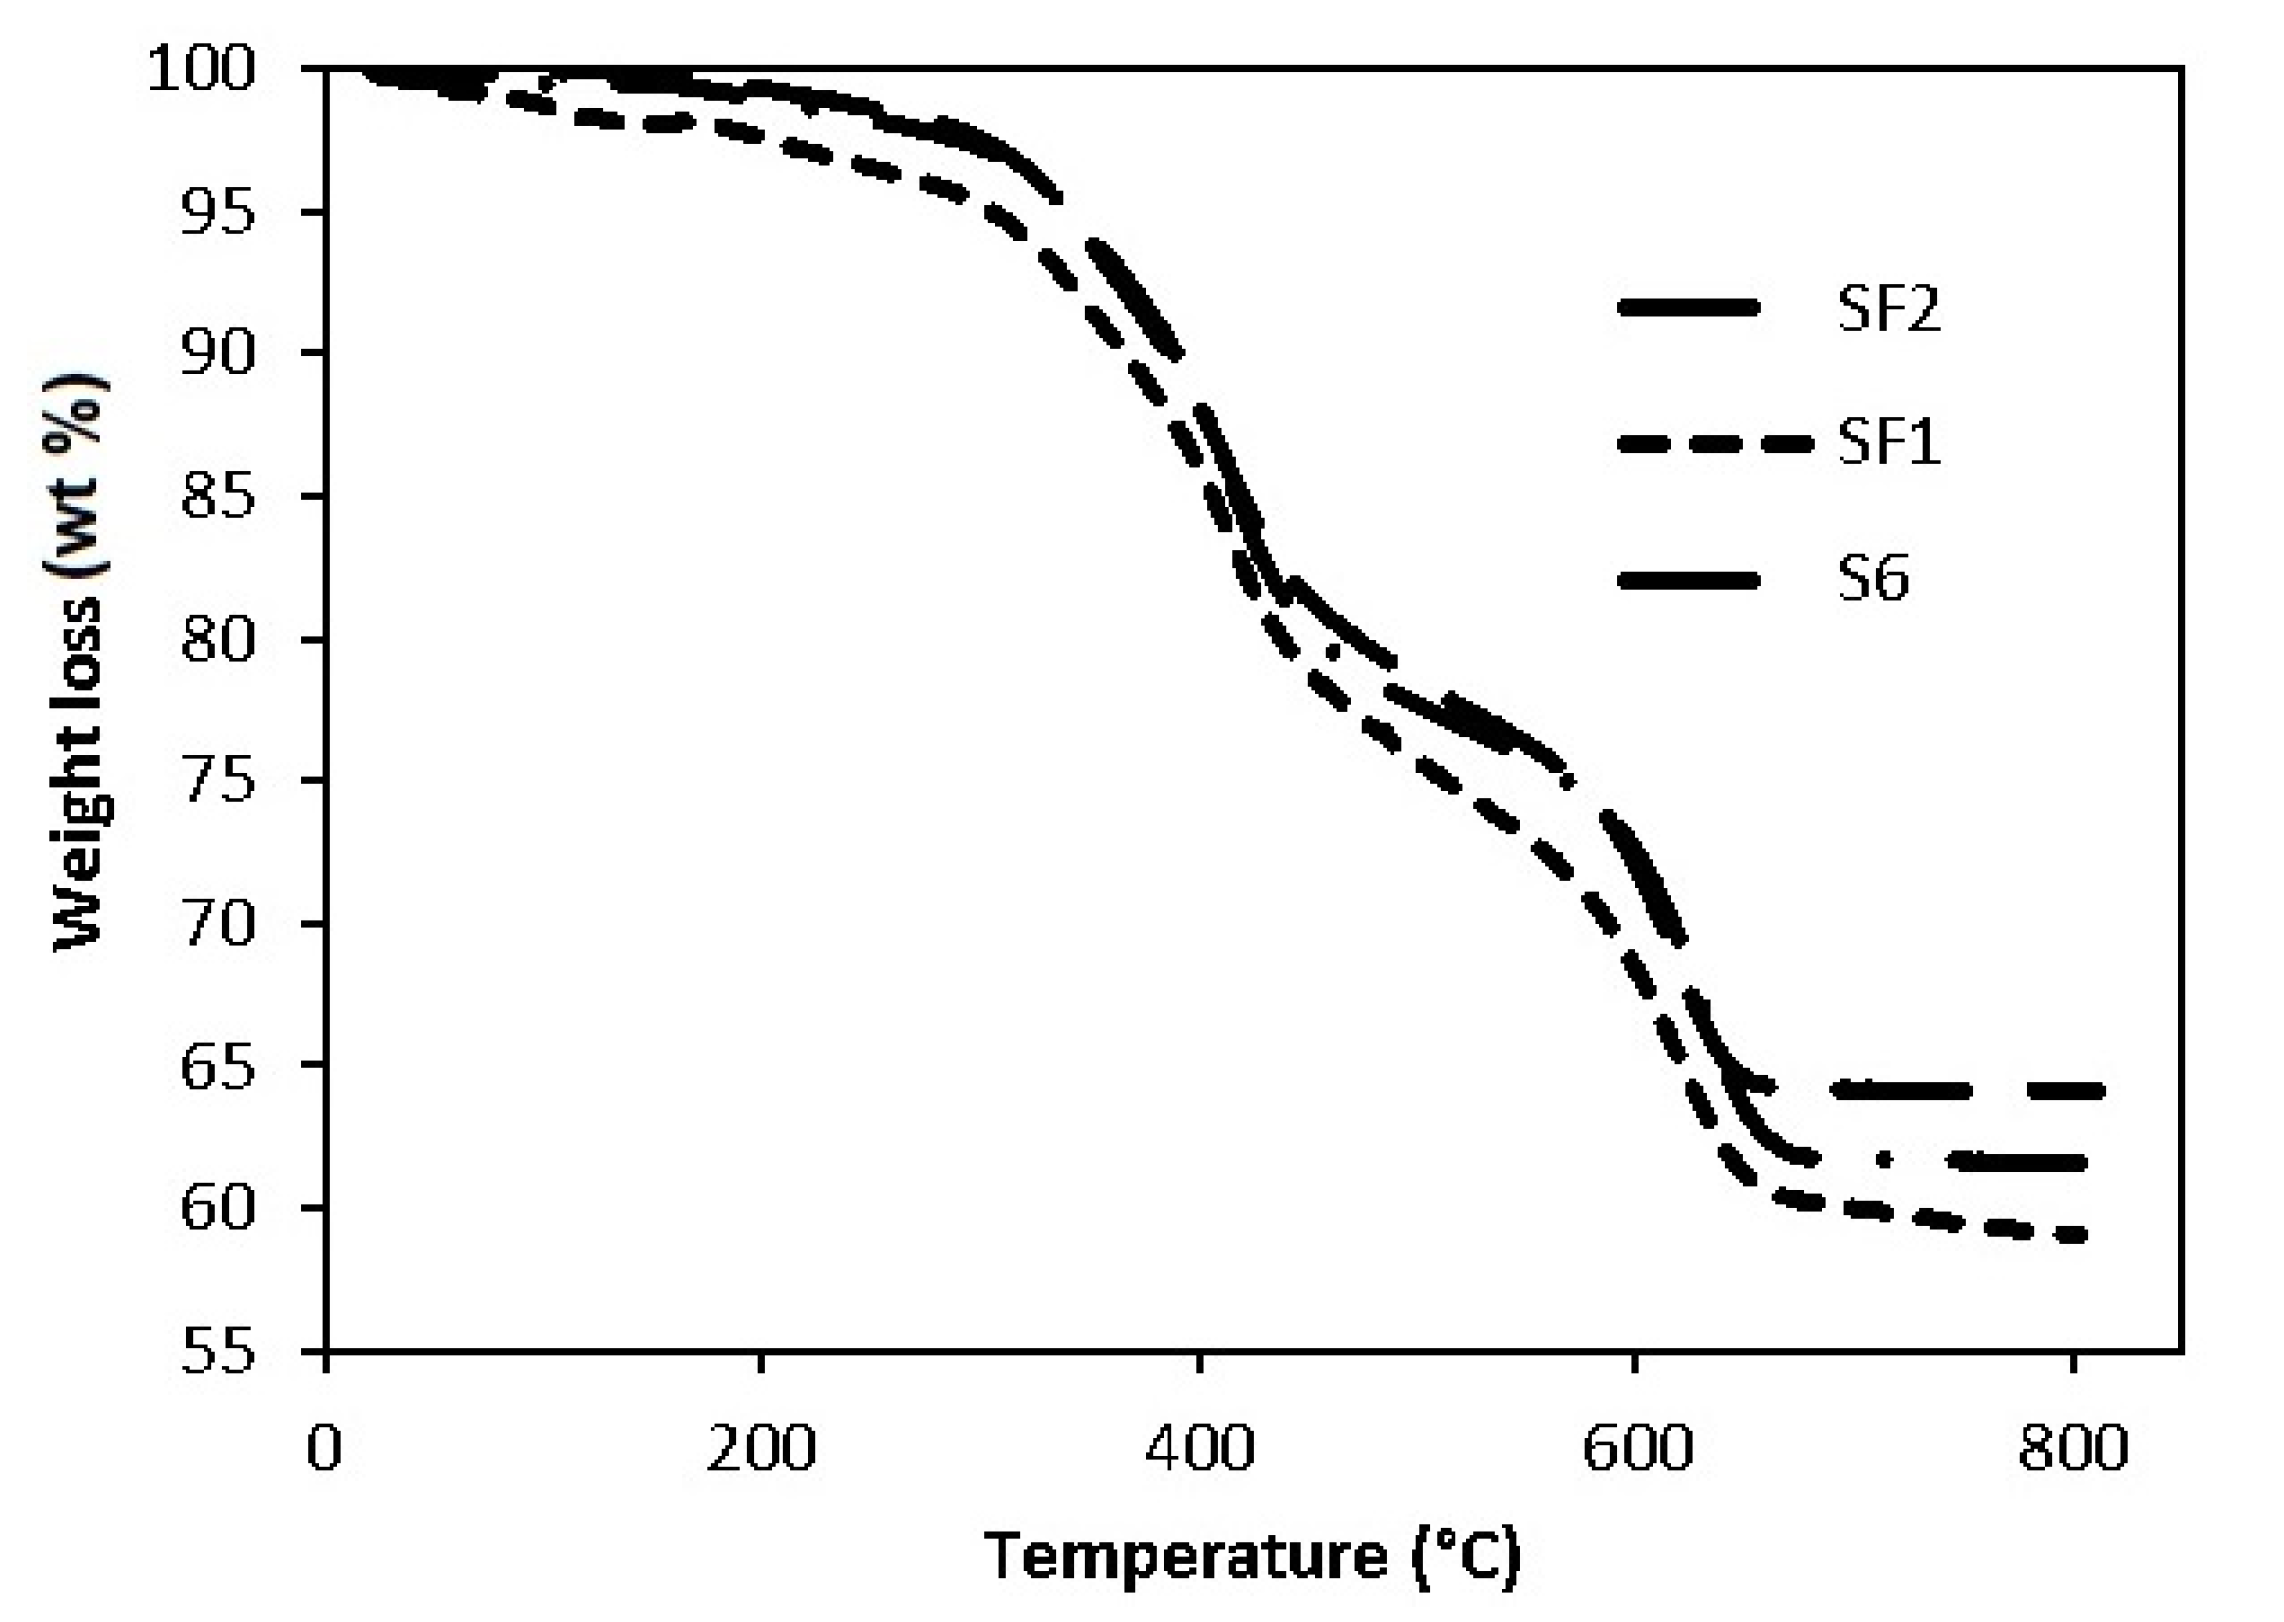
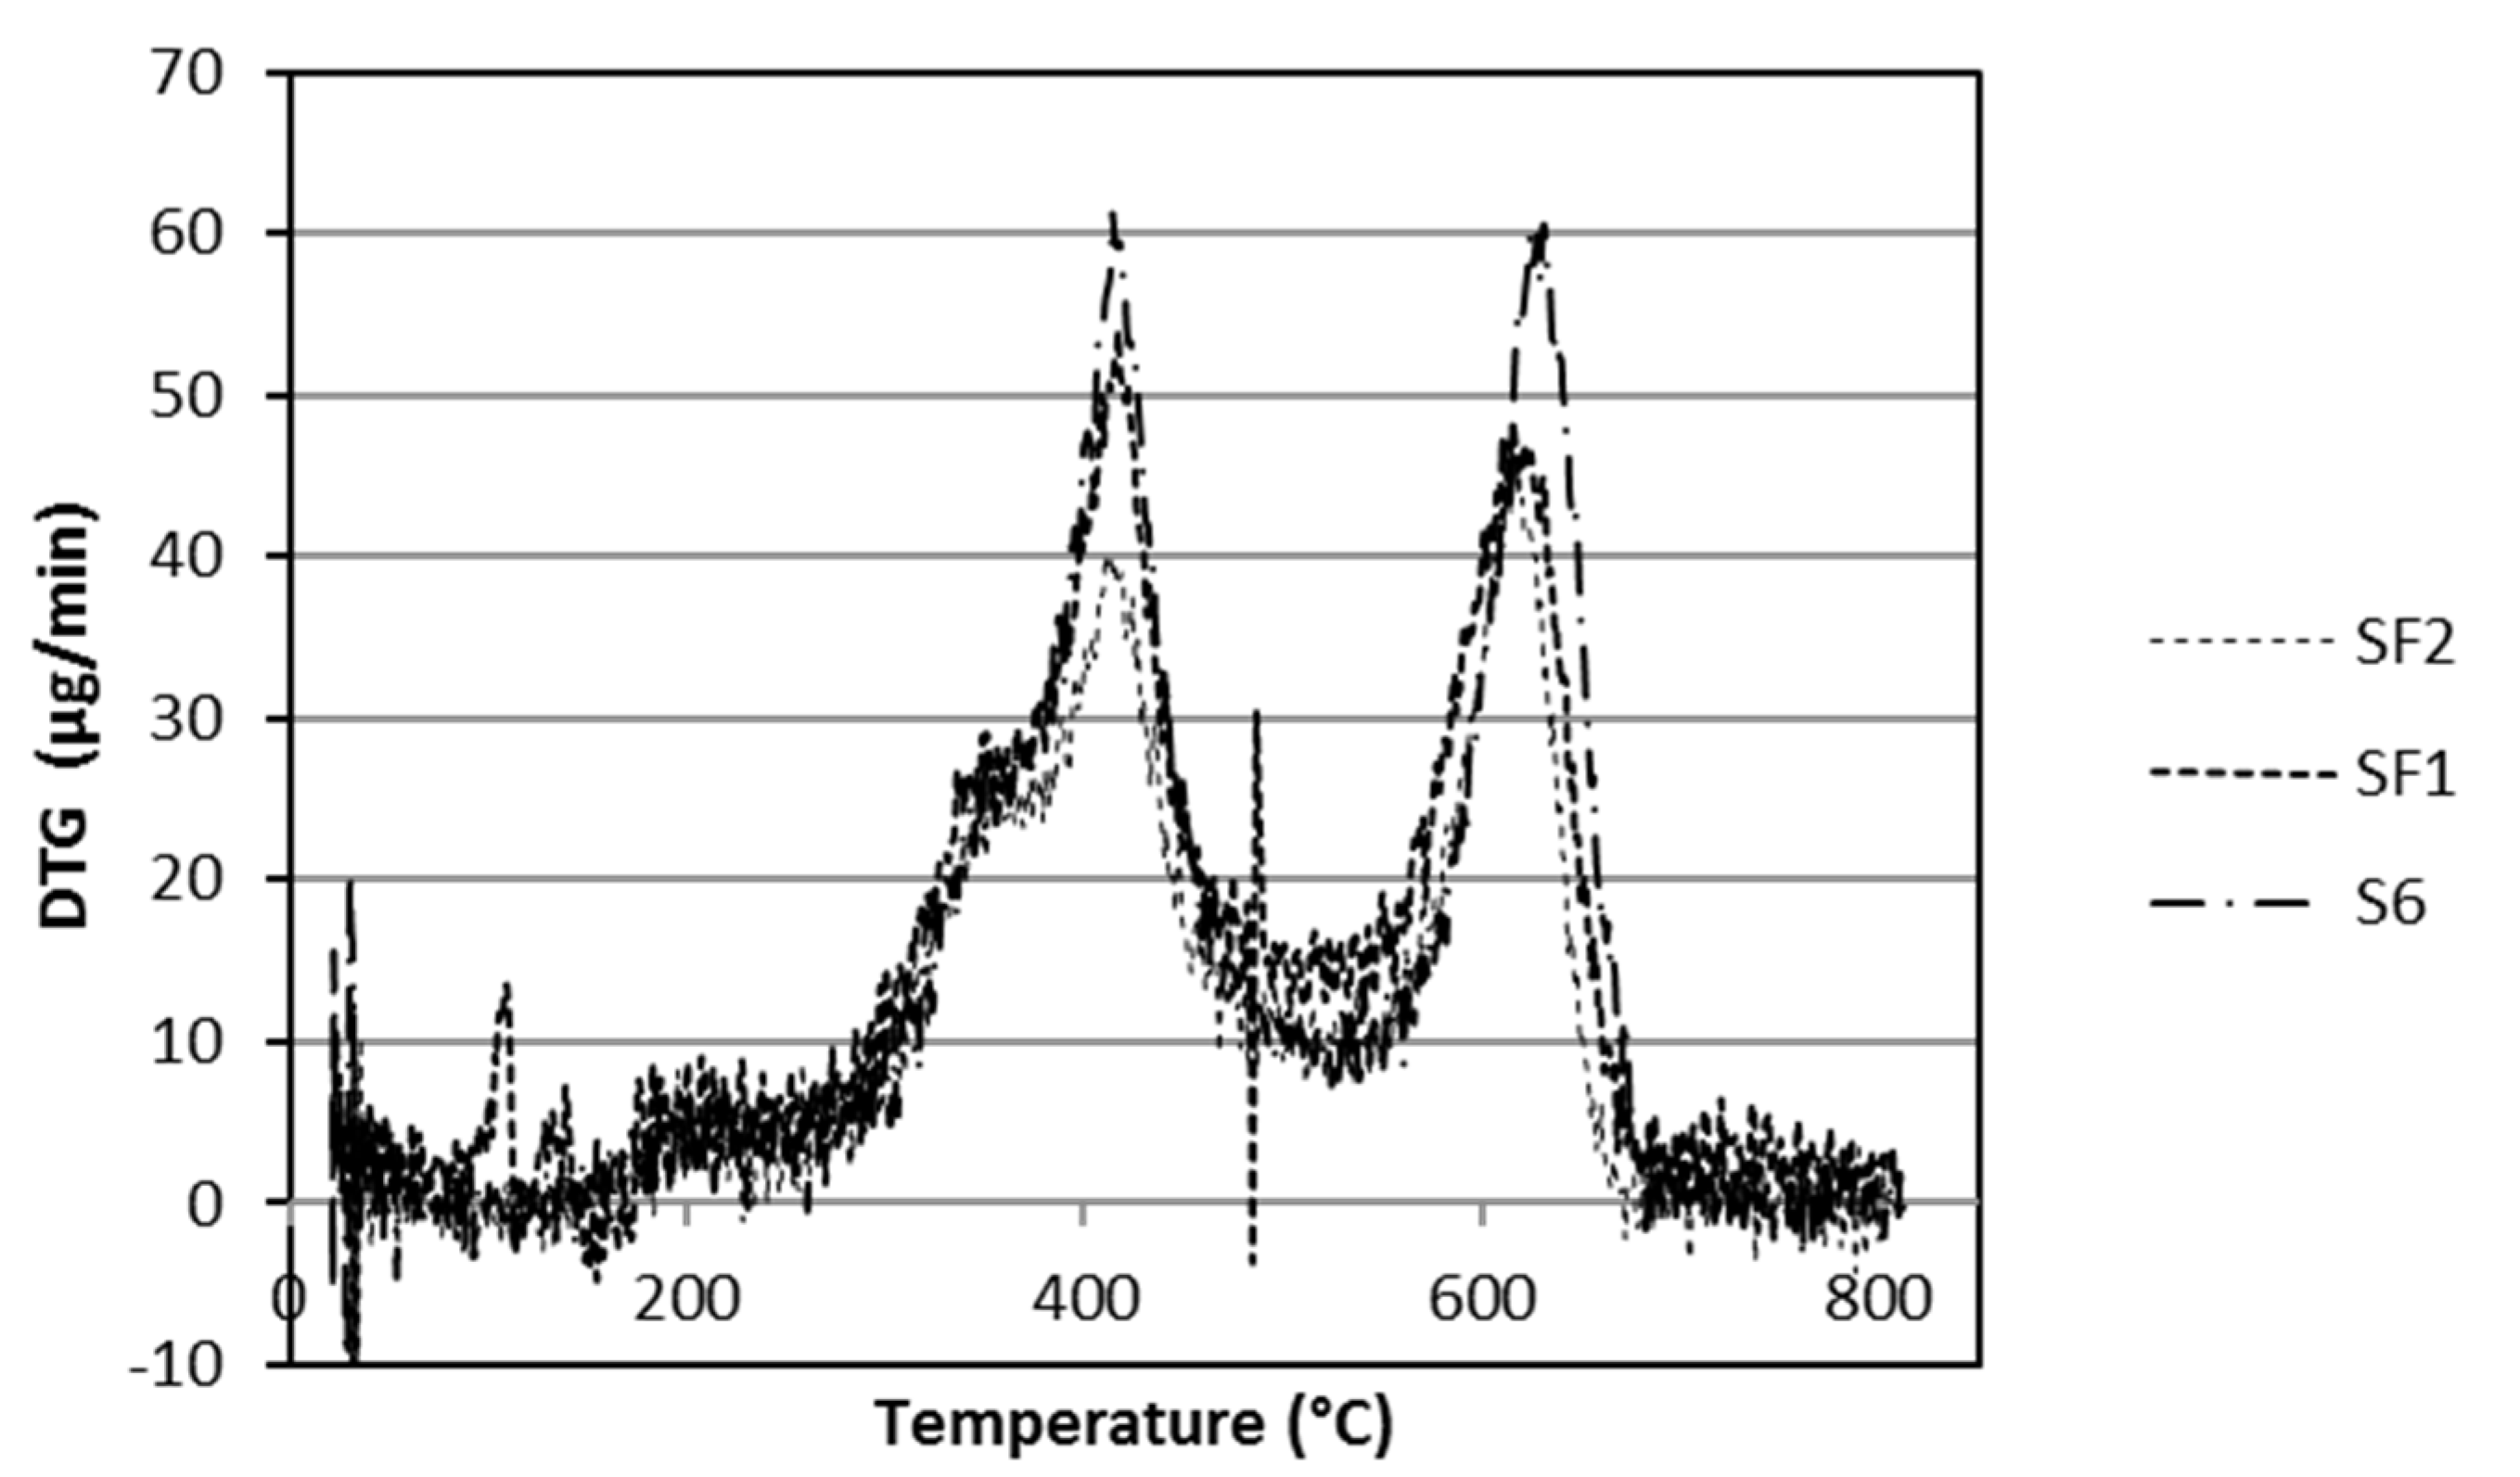
S6, SF1, and SF2 formulations are compared in Figure 6; the shape of the curves is the same for the three coatings. From the DTG plot, reported in Figure 7, it is evident that the amount of graphene is not relevant as the weight losses occur at approximately the same temperatures. In comparison with graphene containing formulations, the shape of the DTG curves of S6 are almost the same as SF1 and SF2, with the exception that the rates of weight losses of SF1 and SF2 (these curves are superimposed in Figure 7), graphene-containing formulations, occur 15 °C before those of the S6 sample, probably due to a different material thermal conductivity.
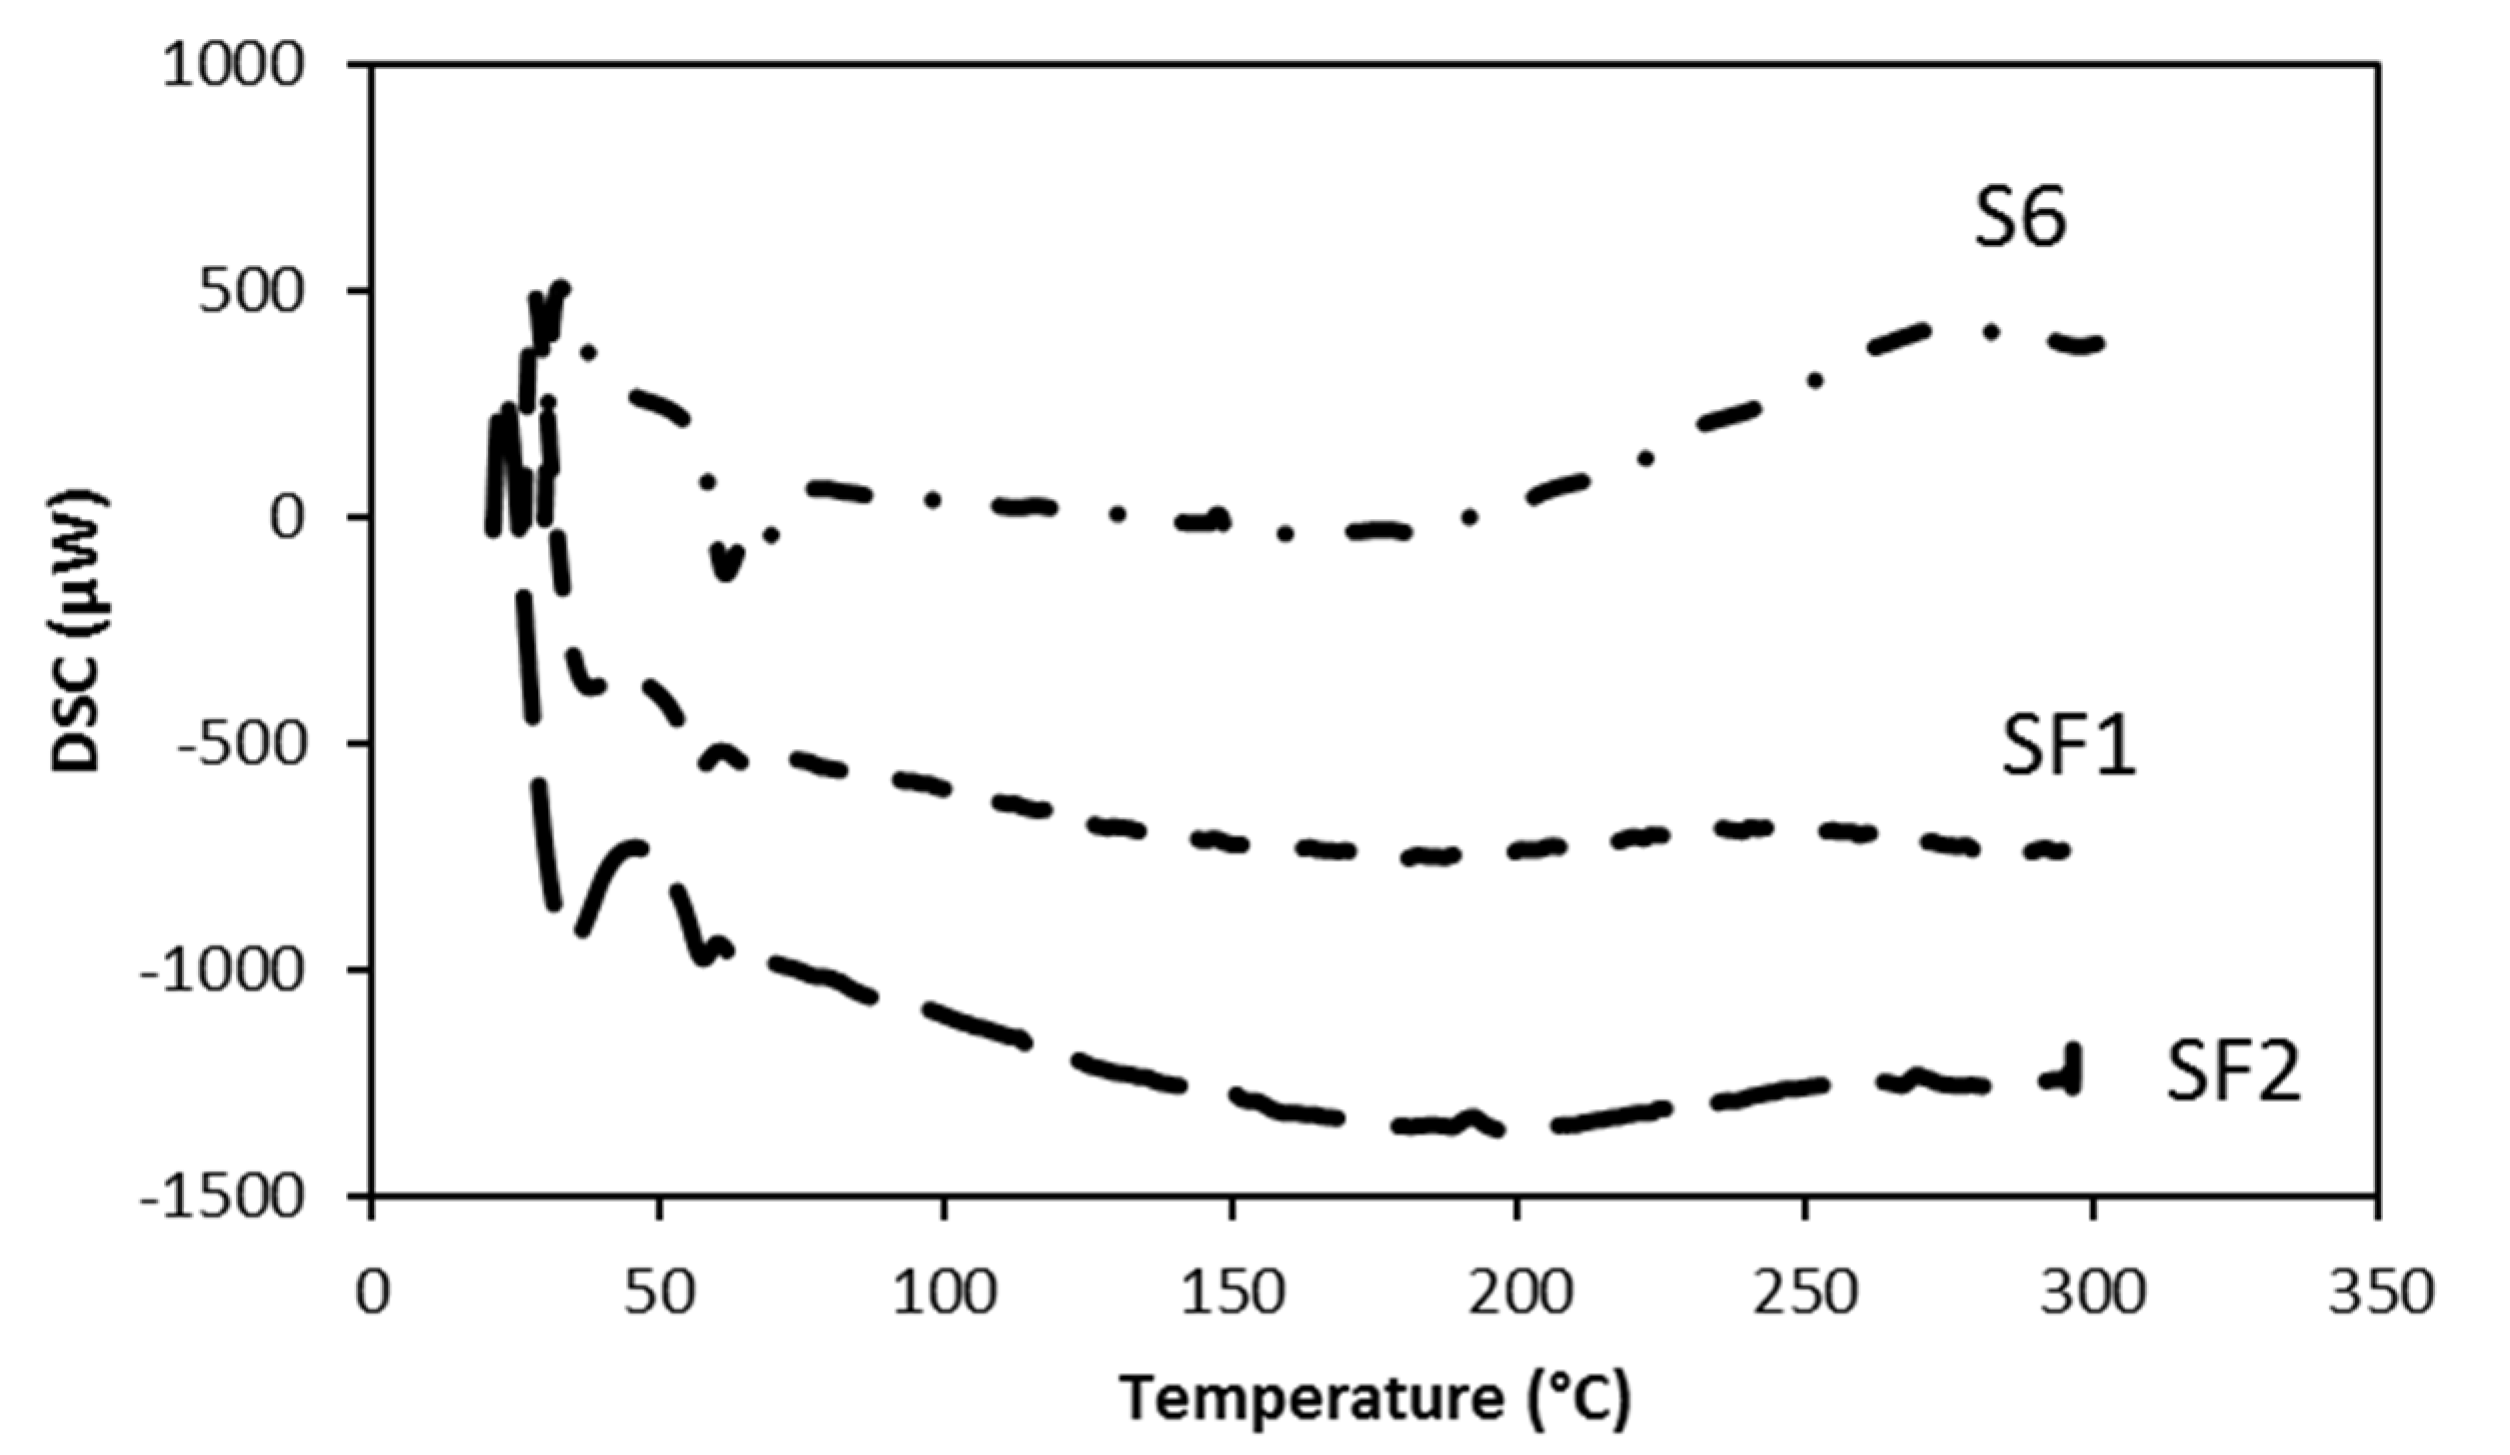
Differential scanning calorimetry (DSC) analyses for the same samples, performed until 300 °C, are reported in Figure 8. The curves are placed at different μW level and have a similar outline, probably related to the graphene amount. In fact, SF1 and SF2 curves appear flatter mainly after 200 °C, meaning a stability of the specific heat, probably related to graphene amount because of the slope of the curve, decreases in the order: S6 (0% graphene) > SF2 (0.3% graphene) > SF1 (0.5% graphene).
3.3. Film Chemical Composition
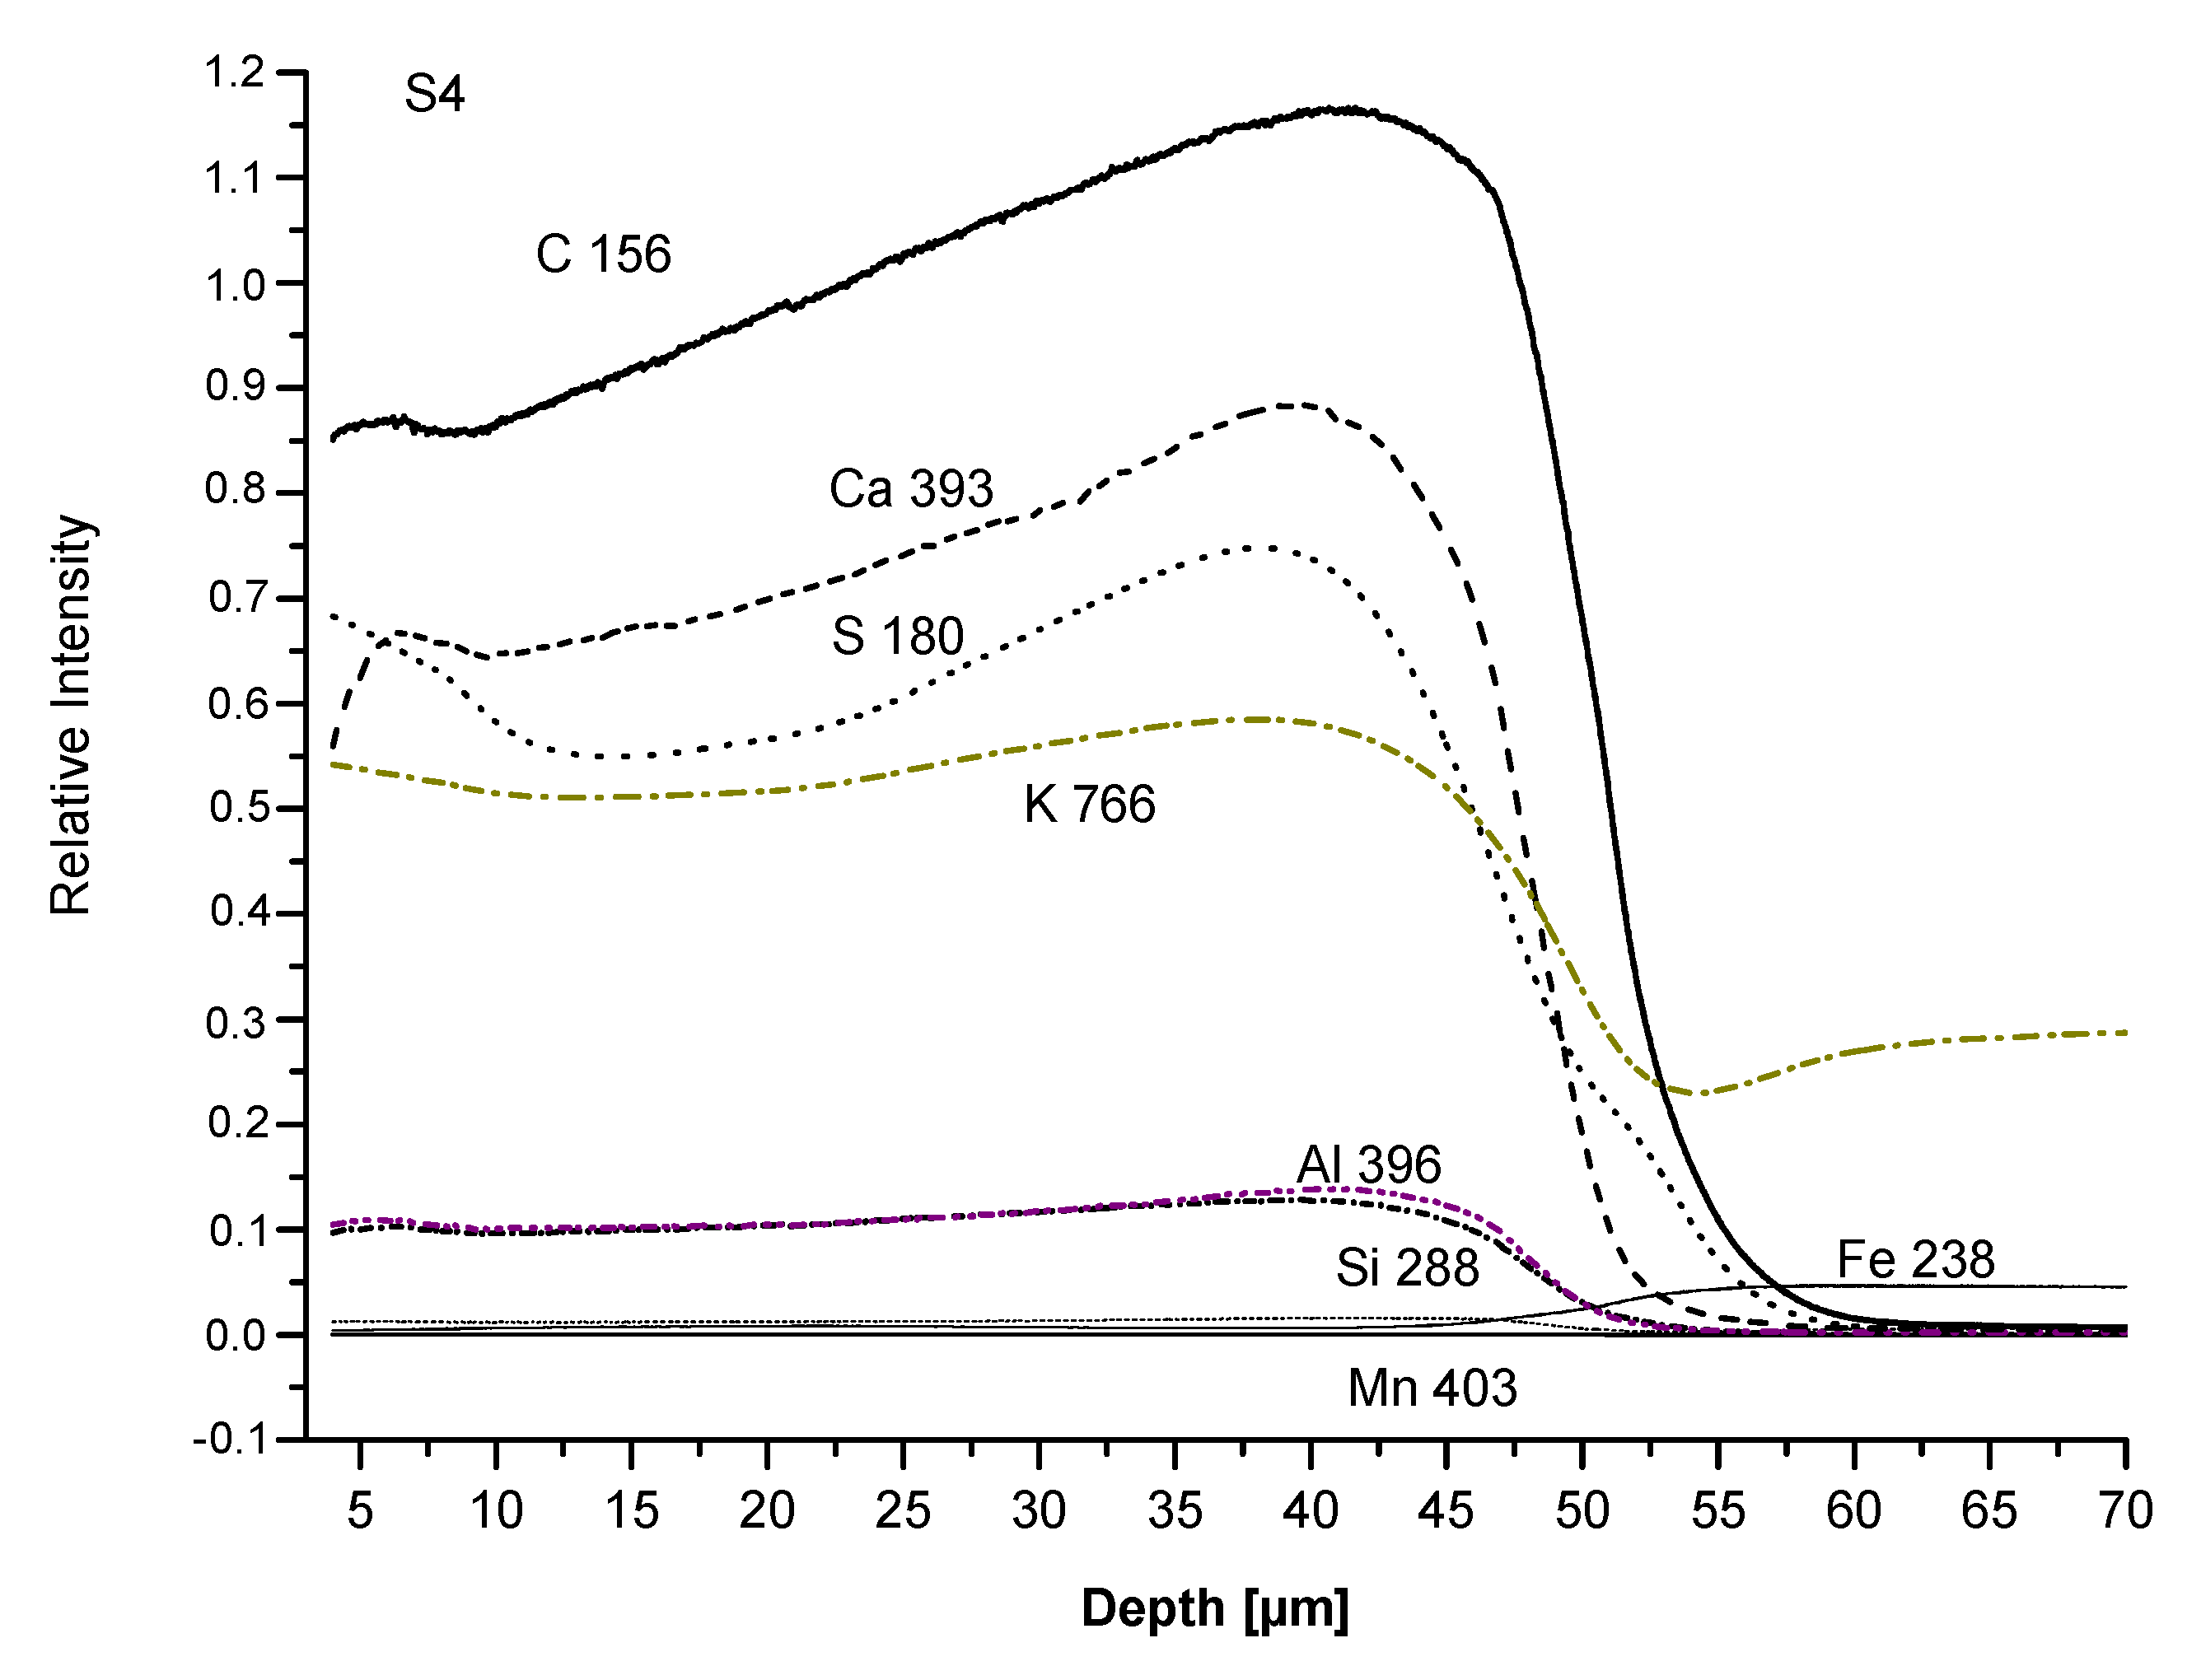
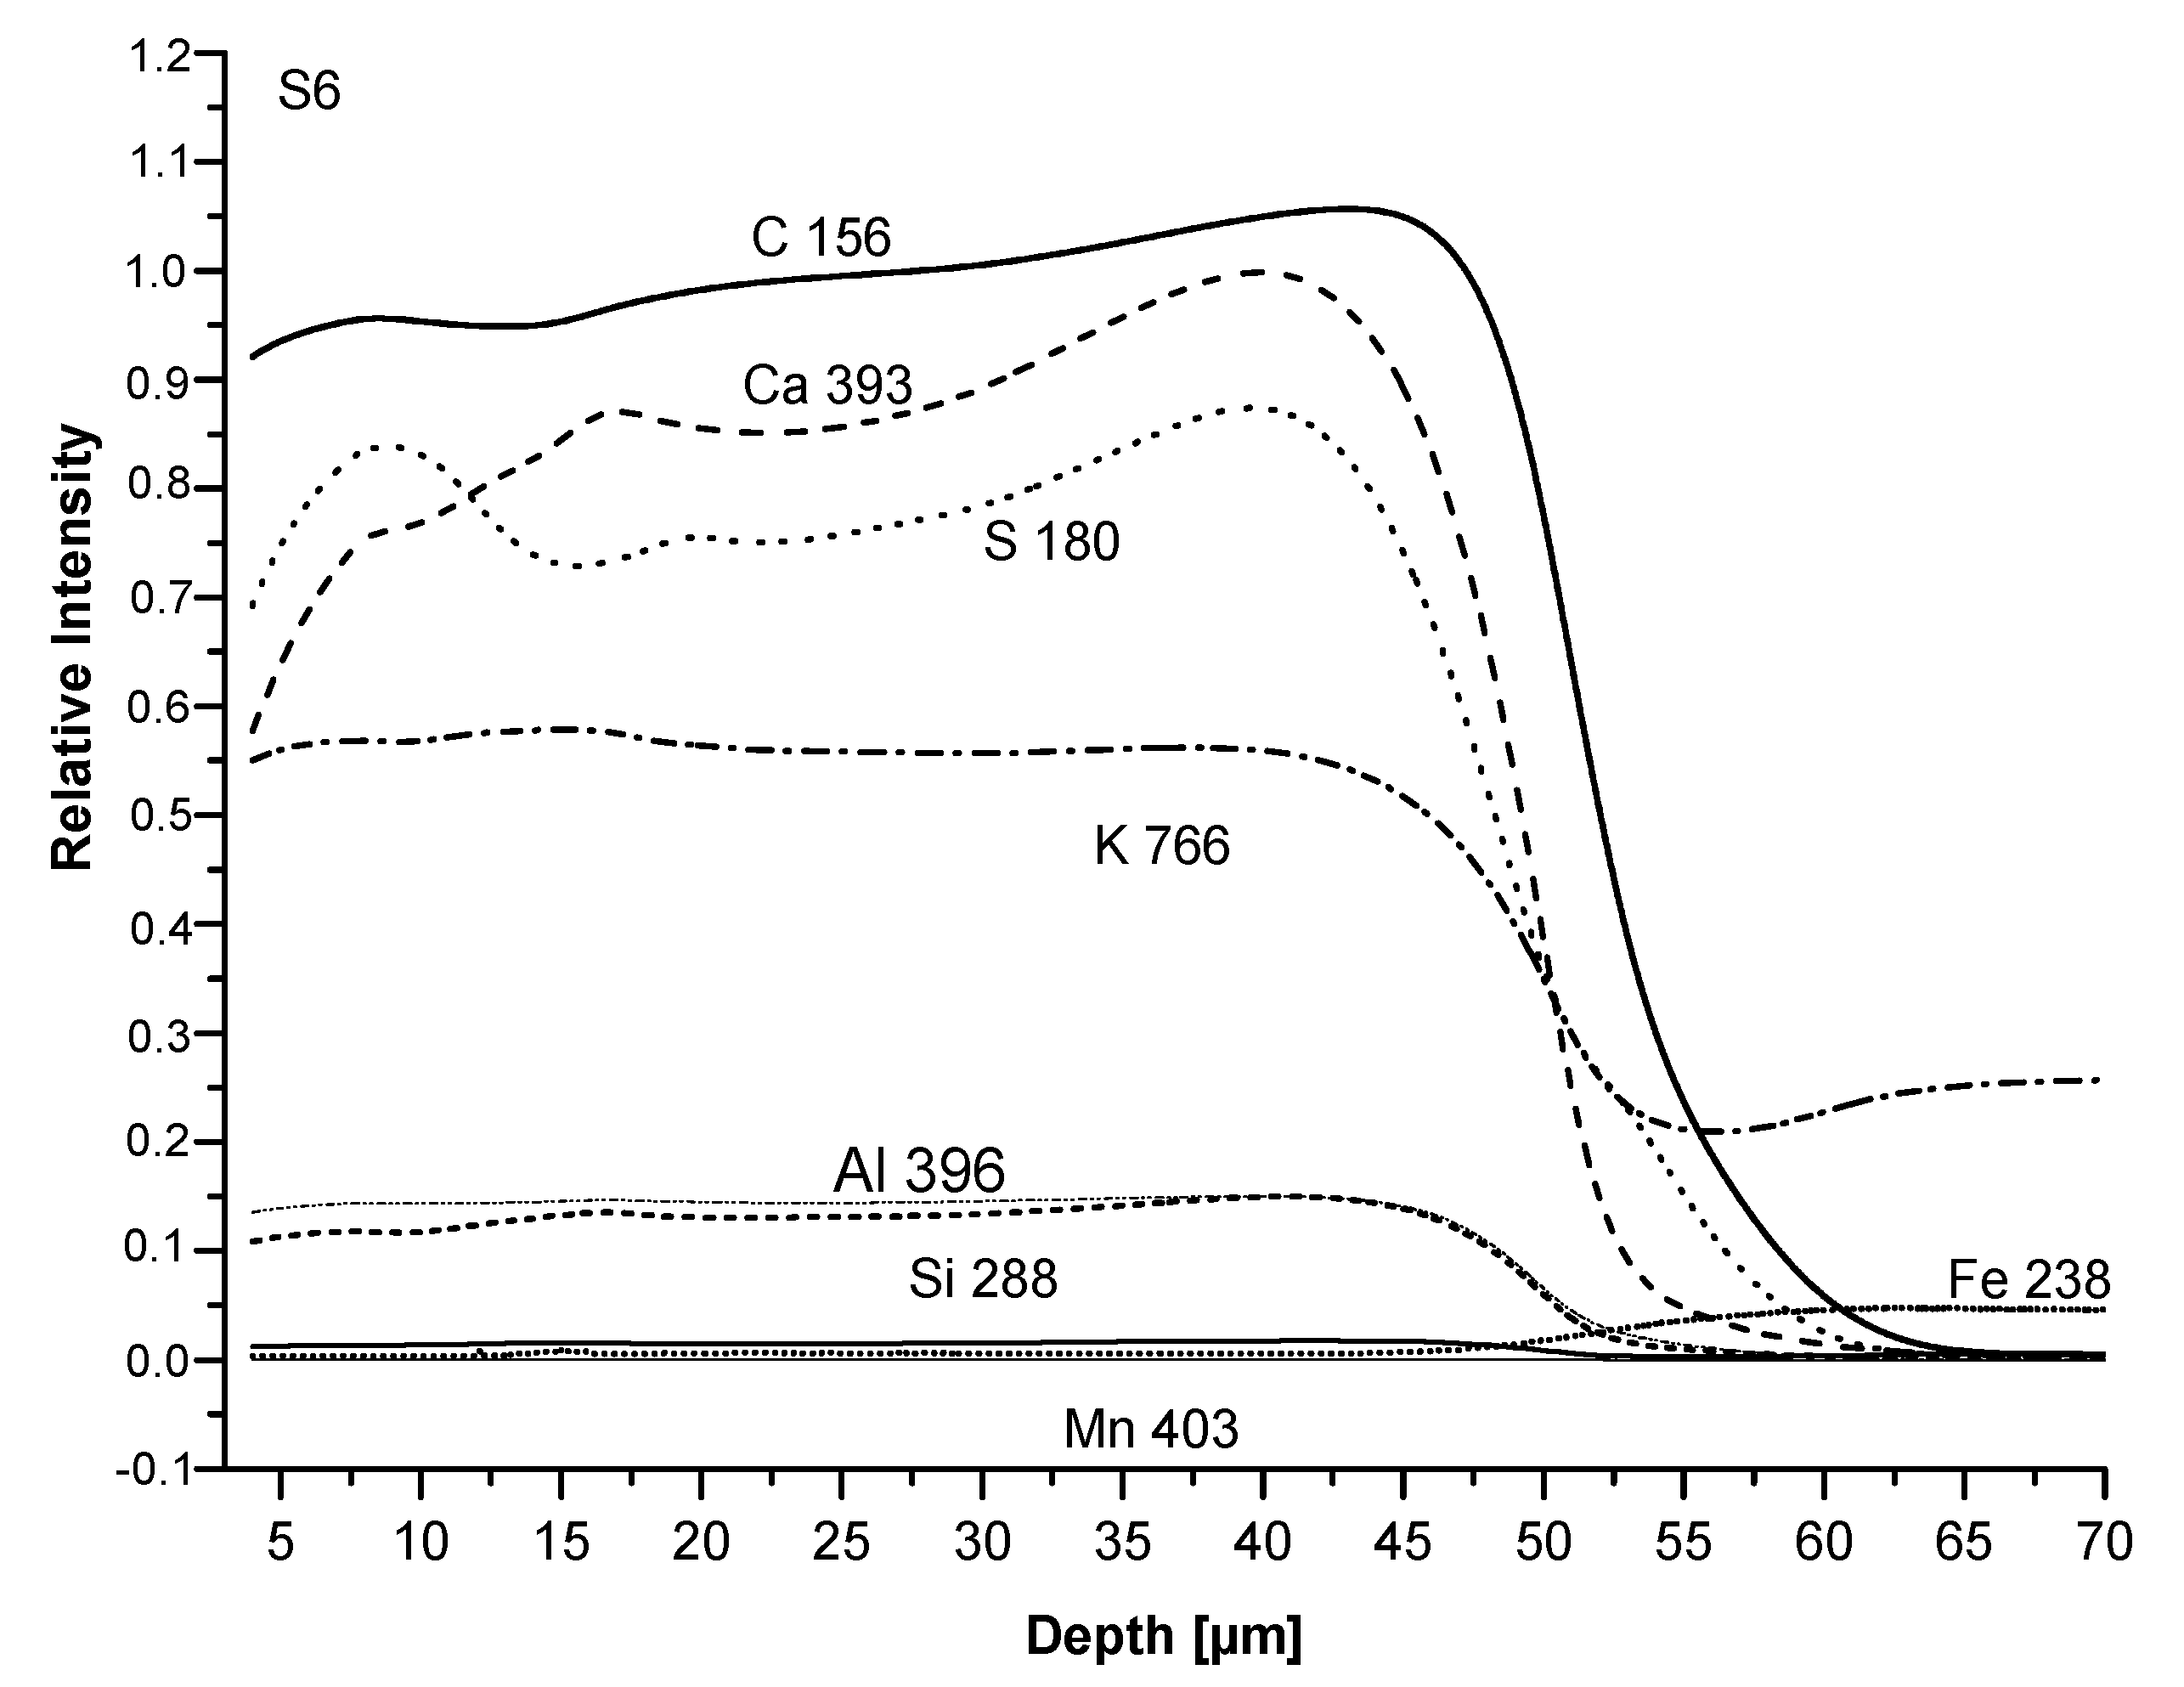
We analysed the S4 and S6 coatings with the Glow discharge optical emission spectroscopy (GDOES). The difference between the two samples is the organic part of silicone binder: methyl (S4) and phenyl-methyl (S6), respectively (Table 1). The analysis allows checking if some layering had taken place due to the inhomogeneous distribution of pigments and fillers all along the coating thickness. Results are plotted in Figure 9 and Figure 10.
Firstly, the film thickness appears properly produced, between 40 and 60 μm. Moreover, no relevant layering is observed in both coatings as the concentration of all elements from the film surface to the substrate both slightly change at the same ratio (C, Ca, S) or remain unchanged (K, Al, Si, Mn). The first group of elements is characterized by concentration gradients; C (from the binder) and Ca appear more densely packed near the substrate, particularly in the S4 than in the S6 sample. Otherwise, the S line, related to the baryte concentration, appears more elevated both at the surface and at the bottom of the film than in the middle. Inversely, S4 and S6 analyses show that the curves related to Mn are nearly horizontal, confirming the homogeneous dispersion of pigment inside the coatings. Similarly, K, Si, and Al concentrations, related to micro mica, appear quite stable. To conclude, the comparison between S4 and S6 coatings indicates a greater homogeneity and lack of important gradients of concentration, this is true of S4 in the S6 composition. For chalking, the GDOES analysis seems to confirm that it depends on the release of pigment particles or extenders (particularly baryte) after the thermal degradation of the binder; no relevant layering of pigment and/or filler appears inside the coating to justify the difference in the chalking performance. From the other site, the increasing binder concentration from the surface towards the substrate, which is very pronounced in the S4 sample, could have caused a deeper degradation and an increase of the particle amount released at a constant concentration of all the other elements.
3.4. SEM Analysis
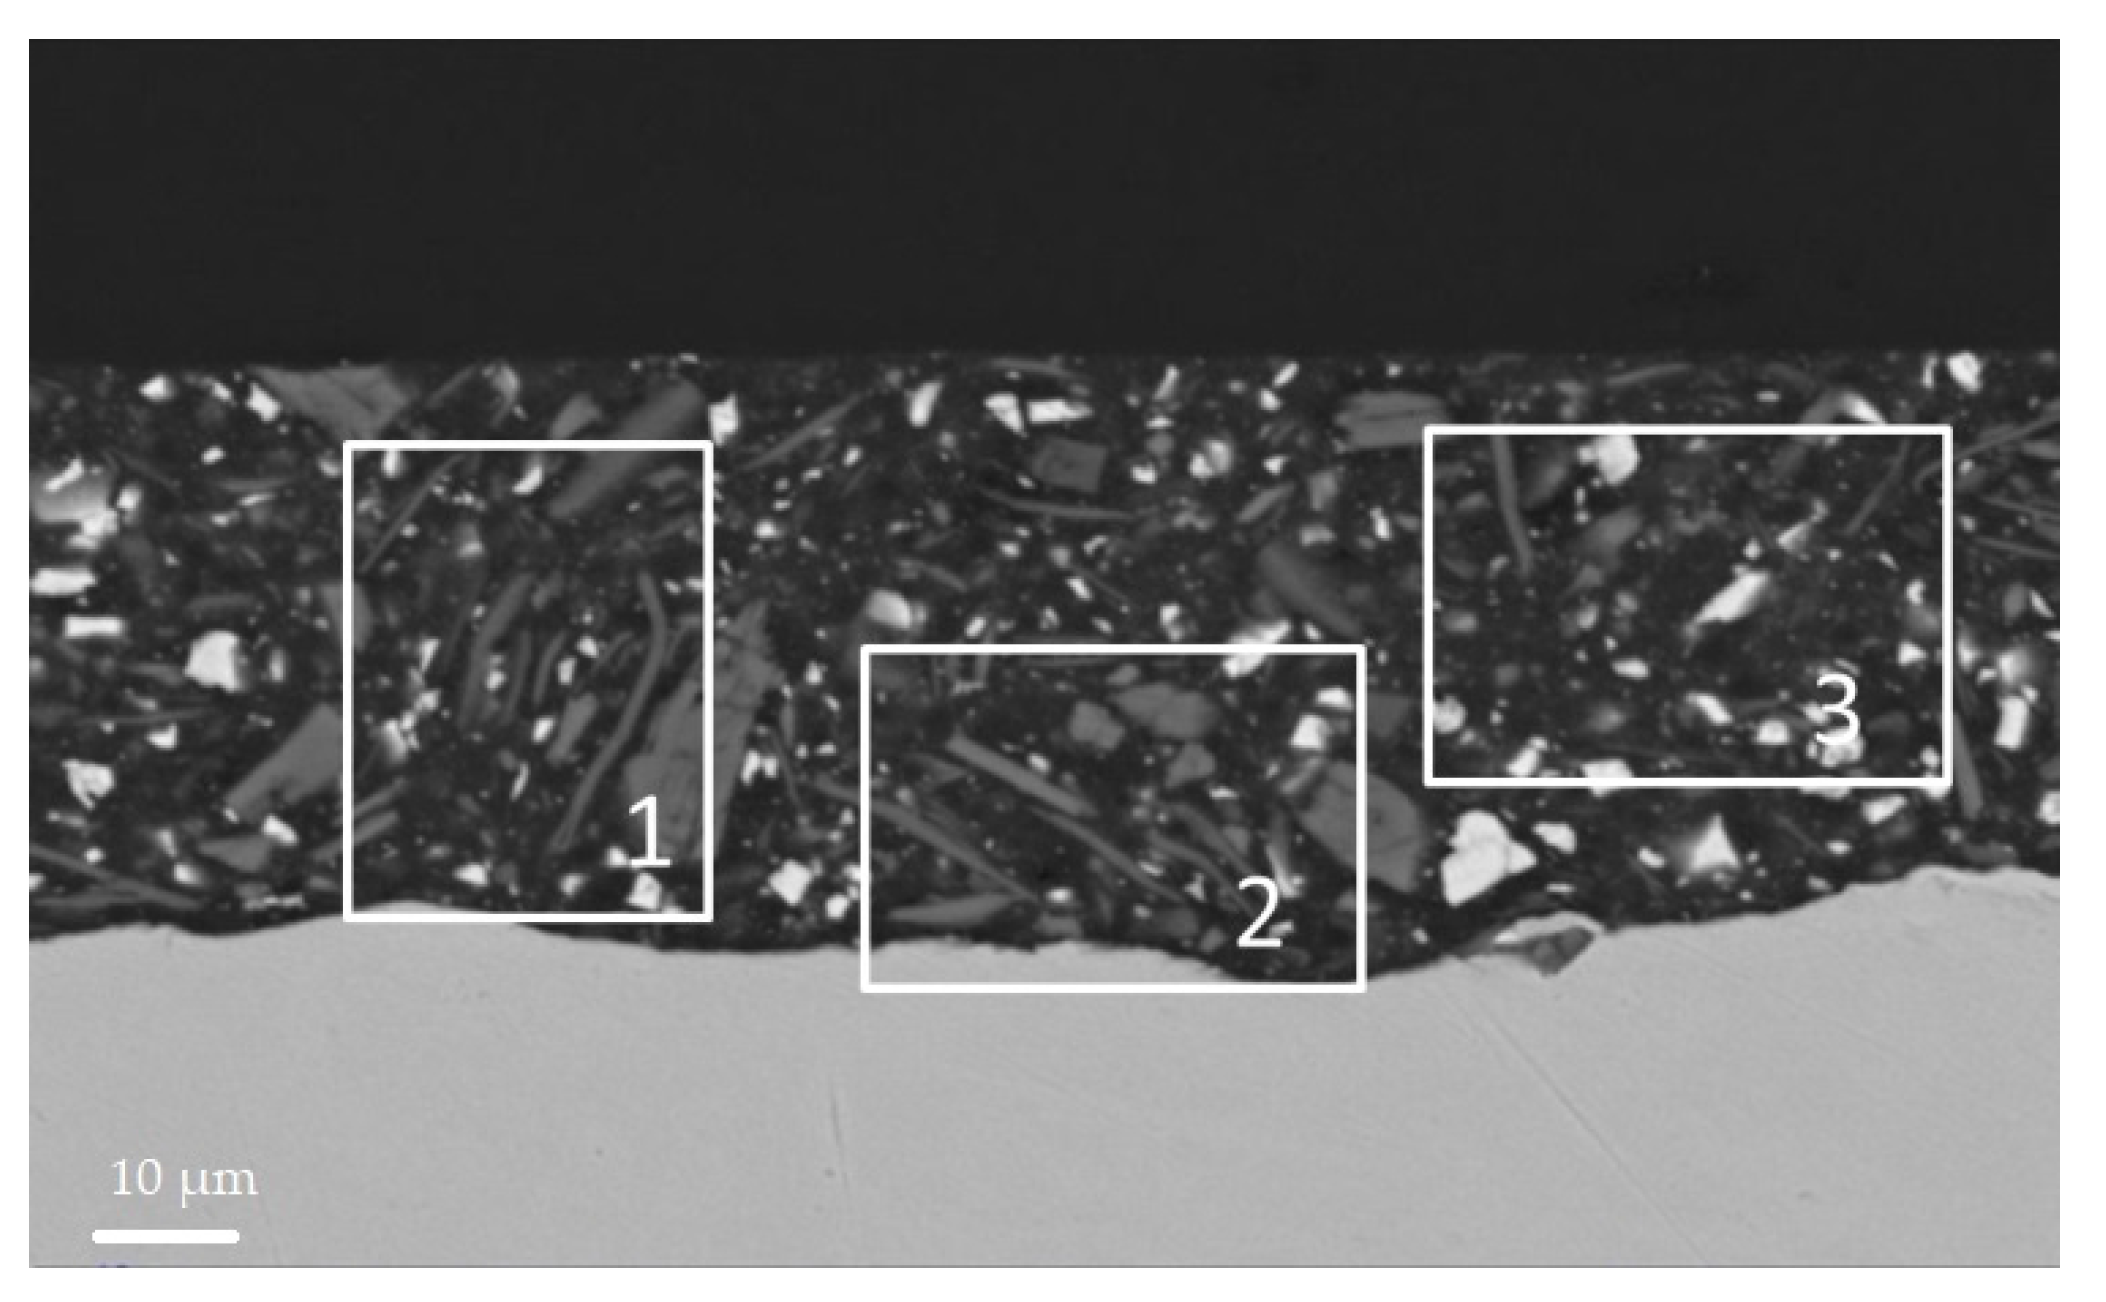
Coating morphology was analysed by scanning electron microscope (SEM) and energy dispersive spectroscopy (EDS). S4 and S6 SEM micrographs, before HT, are reported in Figure 11 and Figure 12.
The SEM micrographs of the coating section before the heat treatment help to analyse the distribution of fillers in the film. White spots were found to be baryte, large light grey ones’, wollastonite, and dark grey ones micro mica. By comparing the distribution of the large wollastonite particles it appears that the filler distribution is more homogeneous in the S6 section (Figure 12). All the particles, however, are (a) more homogeneously distributed in the S6 film than in the S4 one supporting the chalking results; and (b) denser and not homogeneously packed in S4 sample near the substrate surface than in the S6 one, validating the GDOES results.
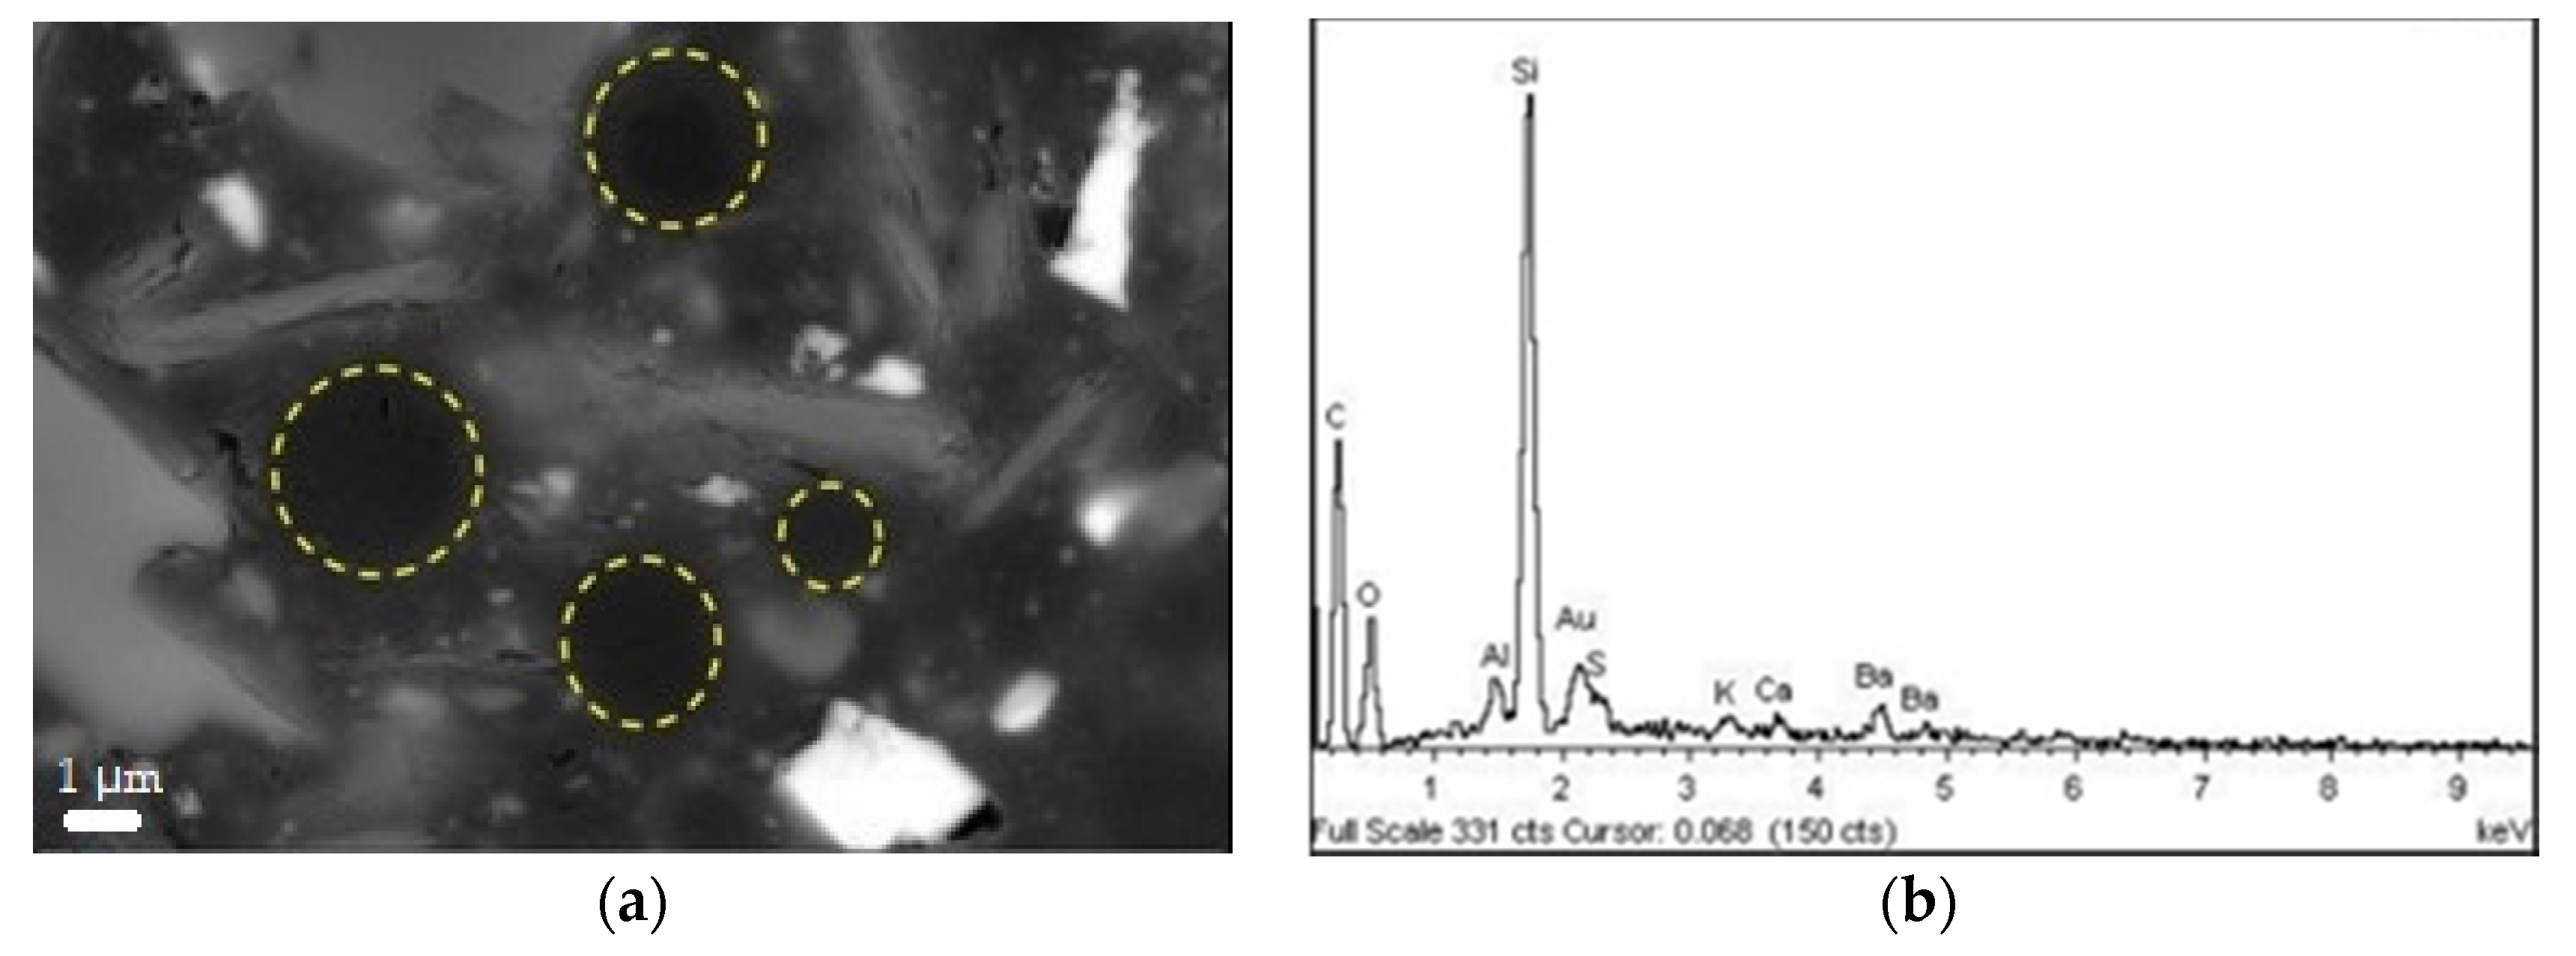
Polymeric domains, with a resembling sphere geometry, were identified in the S6 and not in the S4 coating. Images are reported in Figure 13. From EDS analysis, the domains are rich of silicone inside IPNs. According to [27], the uniformly dispersed dark spherical agglomerates might be formed by condensed polyhedral oligomeric 3D siloxane structures. These may be promoted by the presence of low steric hindrance methyl groups, allowing rearrangements of macromolecules. These domains are reinforcing agents and they can properly affect properties of organic-inorganic hybrid composites. Hence, by heat treatment, agglomerates may be converted into thermally-stable silica particles, enhancing substrate adhesion and film cohesiveness. Additionally, the complexity of paint formulations prevents a more precise understanding of the phenomena. In fact, as reported in [23], the presence of acidic or basic impurities of fillers and residual catalysts might influence the polysiloxane thermo-oxidative degradation mechanism. The choice of the most performant coatings was, however, aimed to link the chalking effect to the film surface morphology after thermal degradation.
After 12 h at 450 °C, we examined S6 and SF1 samples by SEM-EDS; the low-magnification images are reported in Figure 14.
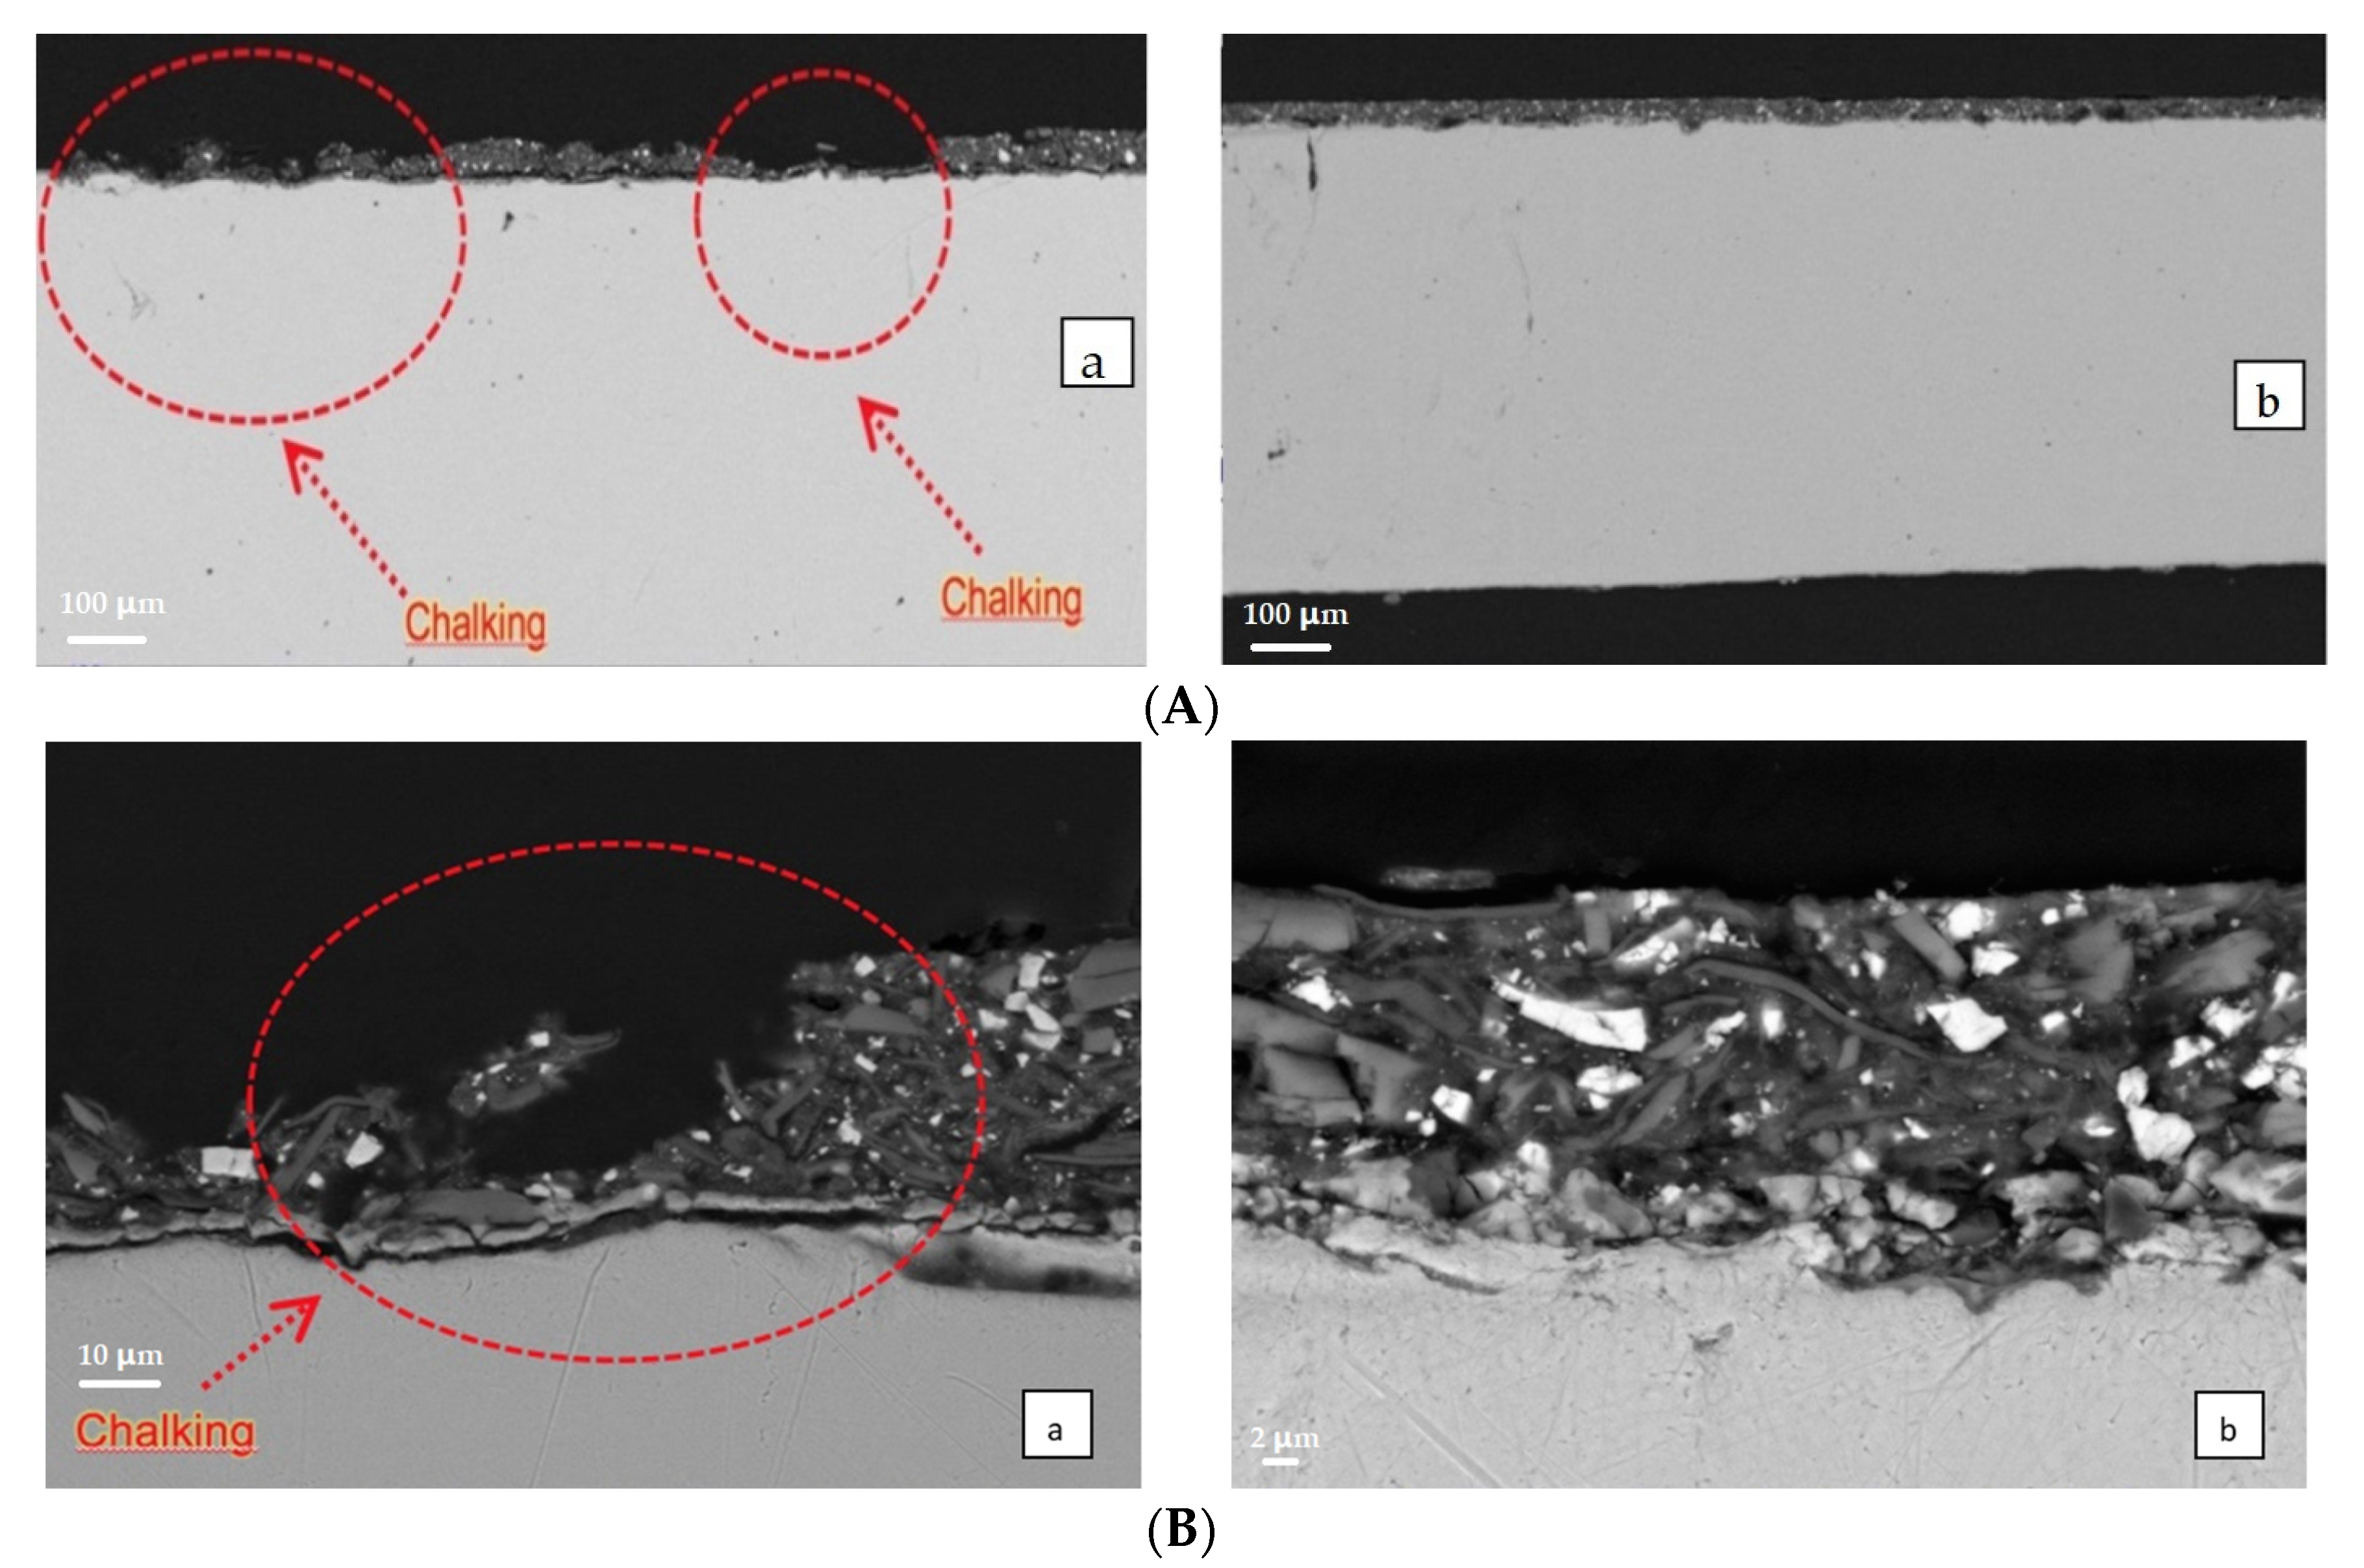
The two images at low magnification give a large sampling area and they clearly show large coating failures. It is evident that SF1 has a superior resistance to chalking in comparison with the S6 sample as the integrity of the coating is preserved in the SF1 sample, but not in the S6 one. Examining more deeply the images of Figure 14, the SF1 coating presents no delamination, blistering, and void formation, while the S6 sample is broken in several points of the coating.
At the end of our investigation, SEM images clearly indicate a greater resistance to deformation and breaking of the graphene containing coatings with respect to the S-type formulations. Superior properties of polymer-graphene nanocomposites are reported in literature [9,10,11,13]. Moreover, during thermal degradation of polysiloxanes, evolution of free benzene and volatile cyclic oligomers occurs [19,20,22].
According to [22], the importance of mass transfer of degradation products away from the coating is significant and it controls the degradation process. Hence, being that graphene has low permeability to all gases [13], it may promote the formation of a nano-structured ceramic residue, upon thermal conversion [26], leading to higher surface integrity, as revealed in Figure 14.
4. Conclusions
In this paper we investigated the surface powdering after high-temperature treatment of IPN silicon-epoxide coatings. At first, the data led us to suppose that the IPN binder that is formed by two homopolymers braided to form a mesh causes the polymer chains to be well organized, without forming high-density domains and without forming intricate arrangements, like long chains typically shaping themselves. Indeed, our results provide evidence that, after the treatment at 450 °C, the organization of the inorganic part depends on the initial layout of the polymer chain. A greater homogeneity develops when the aromatic (phenyl) substituents of the silicone are substituted by methyl groups. Moreover, to obtain a deeper understanding, graphene was added because of its thermal conductivity, which more homogeneously distributes the temperature gradients inside the coating.
The adhesion test analyses reveal that the methyl groups promote a better adhesion of the paint residues on the metal substrate, after the treatment at 450 °C/10 min of the coatings, than the phenyl group. In a parallel manner, the powdering degree is reduced. Thermal analyses support the previous observations and reveal that the carbon residues of the phenyl group remain longer in the layer, with the detrimental effect. Adhesion and thermal analyses mainly refer to the macro-level observations, while both GDOES and the electron microscope analyses substantiate at a micro-level that a greater homogeneous distribution of fillers is obtained with graphene. The distribution of the residue after the high-temperature treatment appears a consequence of the polymer chain layout soon after the application. Parameters that need to be investigated further are as follows: the different organisation induced on the silicone resins by aromatic substituents in comparison to the methyl ones, the different organisation of the chain arrangement physically induced by graphene platelets, and, moreover, the different organisation induced by a better heat distribution during the high-temperature treatment. The likelihood of driving the coatings for high thermo-oxidative protection toward better performance seems to depend on the chemical and physical control of the thermal decomposition of the organic parts.
Acknowledgments
We acknowledge Akzo Nobel Coatings (S.P.A.), Como, CO, Italy, for the technical support and the materials supply.
Author Contributions
Simone Giaveri performed the experiments. Paolo Gronchi contributed analysis tools, analyzed the data, and wrote the paper. Alessandro Barzoni conceived and designed the experiments.
Conflicts of Interest
The authors declare no conflicts of interest.
References
- Bohm, S. Graphene against corrosion. Nat. Nanotechnol. 2014, 9, 741–742. [Google Scholar] [CrossRef] [PubMed]
- Biller, K. Anticorrosion coating market to reach $31.73 bn by 2022. Focus Powder Coat. 2017, 2017, 6. [Google Scholar]
- Dhoke, S.K.; Palraj, S.; Maruthan, K.; Selvaraj, M. Preparation and characterization of heat-resistant interpenetrating polymer network (IPN). Prog. Org. Coat. 2007, 59, 21–27. [Google Scholar] [CrossRef]
- Sperling, L.H.; Hu, R. Interpenetrating polymer networks. In Polymer Blends Handbook; Utacki, L.A., Wilkie, C., Eds.; Springer: Berlin, Germany, 2014; pp. 677–724. [Google Scholar]
- Kumar, S.A.; Narayanan, T.S.N.S. Thermal properties of siliconized epoxy interpenetrating coatings. Prog. Org. Coat. 2002, 45, 323–330. [Google Scholar] [CrossRef]
- Dhoke, S.K.; Maruthan, K.; Palraj, S.; Selvaraj, M. Performance of black pigments incorporated in interpenetrating polymer network (IPN). Prog. Org. Coat. 2006, 56, 53–58. [Google Scholar] [CrossRef]
- Buxbaum, G. Introduction. In Industrial Inorganic Pigments, 2nd ed.; Wiley–VCH Verlag GmbH: Weinheim, Germany, 1998. [Google Scholar]
- Ahmad, S.; Gupta, A.P.; Sharmin, E.; Alam, M.; Pandey, S.K. Synthesis, characterization and development of high performance siloxane-modified epoxy paints. Prog. Org. Coat. 2005, 54, 248–255. [Google Scholar] [CrossRef]
- Kuilla, T.; Bhadra, S.; Yao, D.; Kim, N.H.; Bose, S.; Lee, J.H. Recent advances in graphene based polymer composites. Prog. Polym. Sci. 2010, 35, 1350–1375. [Google Scholar] [CrossRef]
- Naebe, M.; Wang, J.; Amini, A.; Khayyam, H.; Hameed, N.; Li, L.H.; Chen, Y.; Fox, B. Mechanical property and structure of covalent functionalised graphene/epoxy nanocomposites. Sci. Rep. 2014, 4, 4375. [Google Scholar] [CrossRef] [PubMed]
- Tong, Y.; Bohm, S.; Song, M. Graphene based materials and their composites as coatings. Austin J. Nanomed. Nanotechnol. 2013, 1, 1003. [Google Scholar]
- Teng, C.; Ma, C.M.; Lu, C.; Yang, S.; Lee, S.; Hsiao, M.; Yen, M.; Chiou, K.; Lee, T. Thermal conductivity and structure of non-covalent functionalized graphene/epoxy composites. Carbon 2011, 49, 5107–5116. [Google Scholar] [CrossRef]
- Potts, J.R.; Dreyer, D.R.; Bielawski, C.W.; Ruoff, R.S. Graphene-based polymer nanocomposites. Polymer 2011, 52, 5–25. [Google Scholar] [CrossRef]
- Barletta, M.; Lusvarghi, L.; Pighetti Mantini, F.; Rubino, G. Epoxy-based thermosetting powder coatings: Surface appearance, scratch adhesion and wear resistance. Surf. Coat. Technol. 2007, 201, 7479–7504. [Google Scholar] [CrossRef]
- Belder, E.G.; Rutten, H.J.J.; Perera, D.Y. Cure characterization of powder coatings. Prog. Org. Coat. 2001, 42, 142–149. [Google Scholar] [CrossRef]
- Lee, S.S.; Han, H.Z.Y.; Hilborn, J.G.; Manson, J.E. Surface structure build-up in thermosetting powder coatings during curing. Prog. Org. Coat. 1999, 36, 79–88. [Google Scholar] [CrossRef]
- Giaveri, S. High Temperature Organic Powder Coatings: Characterisation and Innovations. Master’s Thesis, Politecnico di Milano, Milan, Italy, September 2015. [Google Scholar]
- Meng, X.; Zhang, H.; Zhu, J. Characterization of particle size evolution of the deposited layer during electrostatic powder coating processes. Powder Technol. 2009, 195, 264–270. [Google Scholar] [CrossRef]
- Grundke, K.; Michel, S.; Osterhold, M. Surface tension studies of additives in acrylic resin-based powder coatings using the wilhelmy balance technique. Prog. Org. Coat. 2000, 39, 101–106. [Google Scholar] [CrossRef]
- Camino, G.; Lomakin, S.; Lazzari, M. Polydimethylsiloxane thermal degradation Part 1. Kinetic aspects. Polymer 2001, 42, 2395–2402. [Google Scholar] [CrossRef]
- Mazhar, M.; Zulfiqar, M.; Piracha, A.; Ali, S.; Ahmed, A. Comparative thermal stability of homopolysiloxanes and copolysiloxanes of dimethyl/diphenyl silanes. J. Chem. Soc. Pak. 1990, 12, 225–229. [Google Scholar]
- Deshpande, G.; Rezac, M.E. The effect of phenyl content on the degradation of poly (dimethyl diphenyl) siloxane copolymers. Polym. Degrad. Stab. 2001, 74, 363–370. [Google Scholar] [CrossRef]
- Deshpande, G.; Rezac, M.E. Kinetic aspects of the thermal degradation of poly (dimethyl siloxane) and poly (dimethyl diphenyl siloxane). Polym. Degrad. Stab. 2002, 76, 17–24. [Google Scholar] [CrossRef]
- Zhou, W.; Yang, H.; Guo, X.; Lu, J. Thermal degradation behaviours of some branched and linear polysiloxanes. Polym. Degrad. Stab. 2006, 91, 1471–1475. [Google Scholar] [CrossRef]
- Narisawa, M. Silicone resin applications for ceramic precursors and composites. Materials 2010, 3, 3518–3536. [Google Scholar] [CrossRef]
- Bernardo, E.; Fiocco, L.; Parcianello, G.; Storti, E.; Colombo, P. Advanced ceramics from preceramic polymers modified at the nano-scale: A review. Materials 2014, 7, 1927–1956. [Google Scholar] [CrossRef] [PubMed]
- Pantano, C.G.; Singh, A.K.; Zhang, H. Silicon oxycarbide glasses. J. Sol-Gel Sci. Technol. 1999, 14, 7–25. [Google Scholar] [CrossRef]
Figure 1.
Prints of cross-cut area on tape before thermal treatment (the clearness is worsened by the glue layer).
Figure 1.
Prints of cross-cut area on tape before thermal treatment (the clearness is worsened by the glue layer).

Figure 2.
Prints of the cross-cut area on tape after the thermal treatment (the clearness is worsened by the glue layer).
Figure 2.
Prints of the cross-cut area on tape after the thermal treatment (the clearness is worsened by the glue layer).
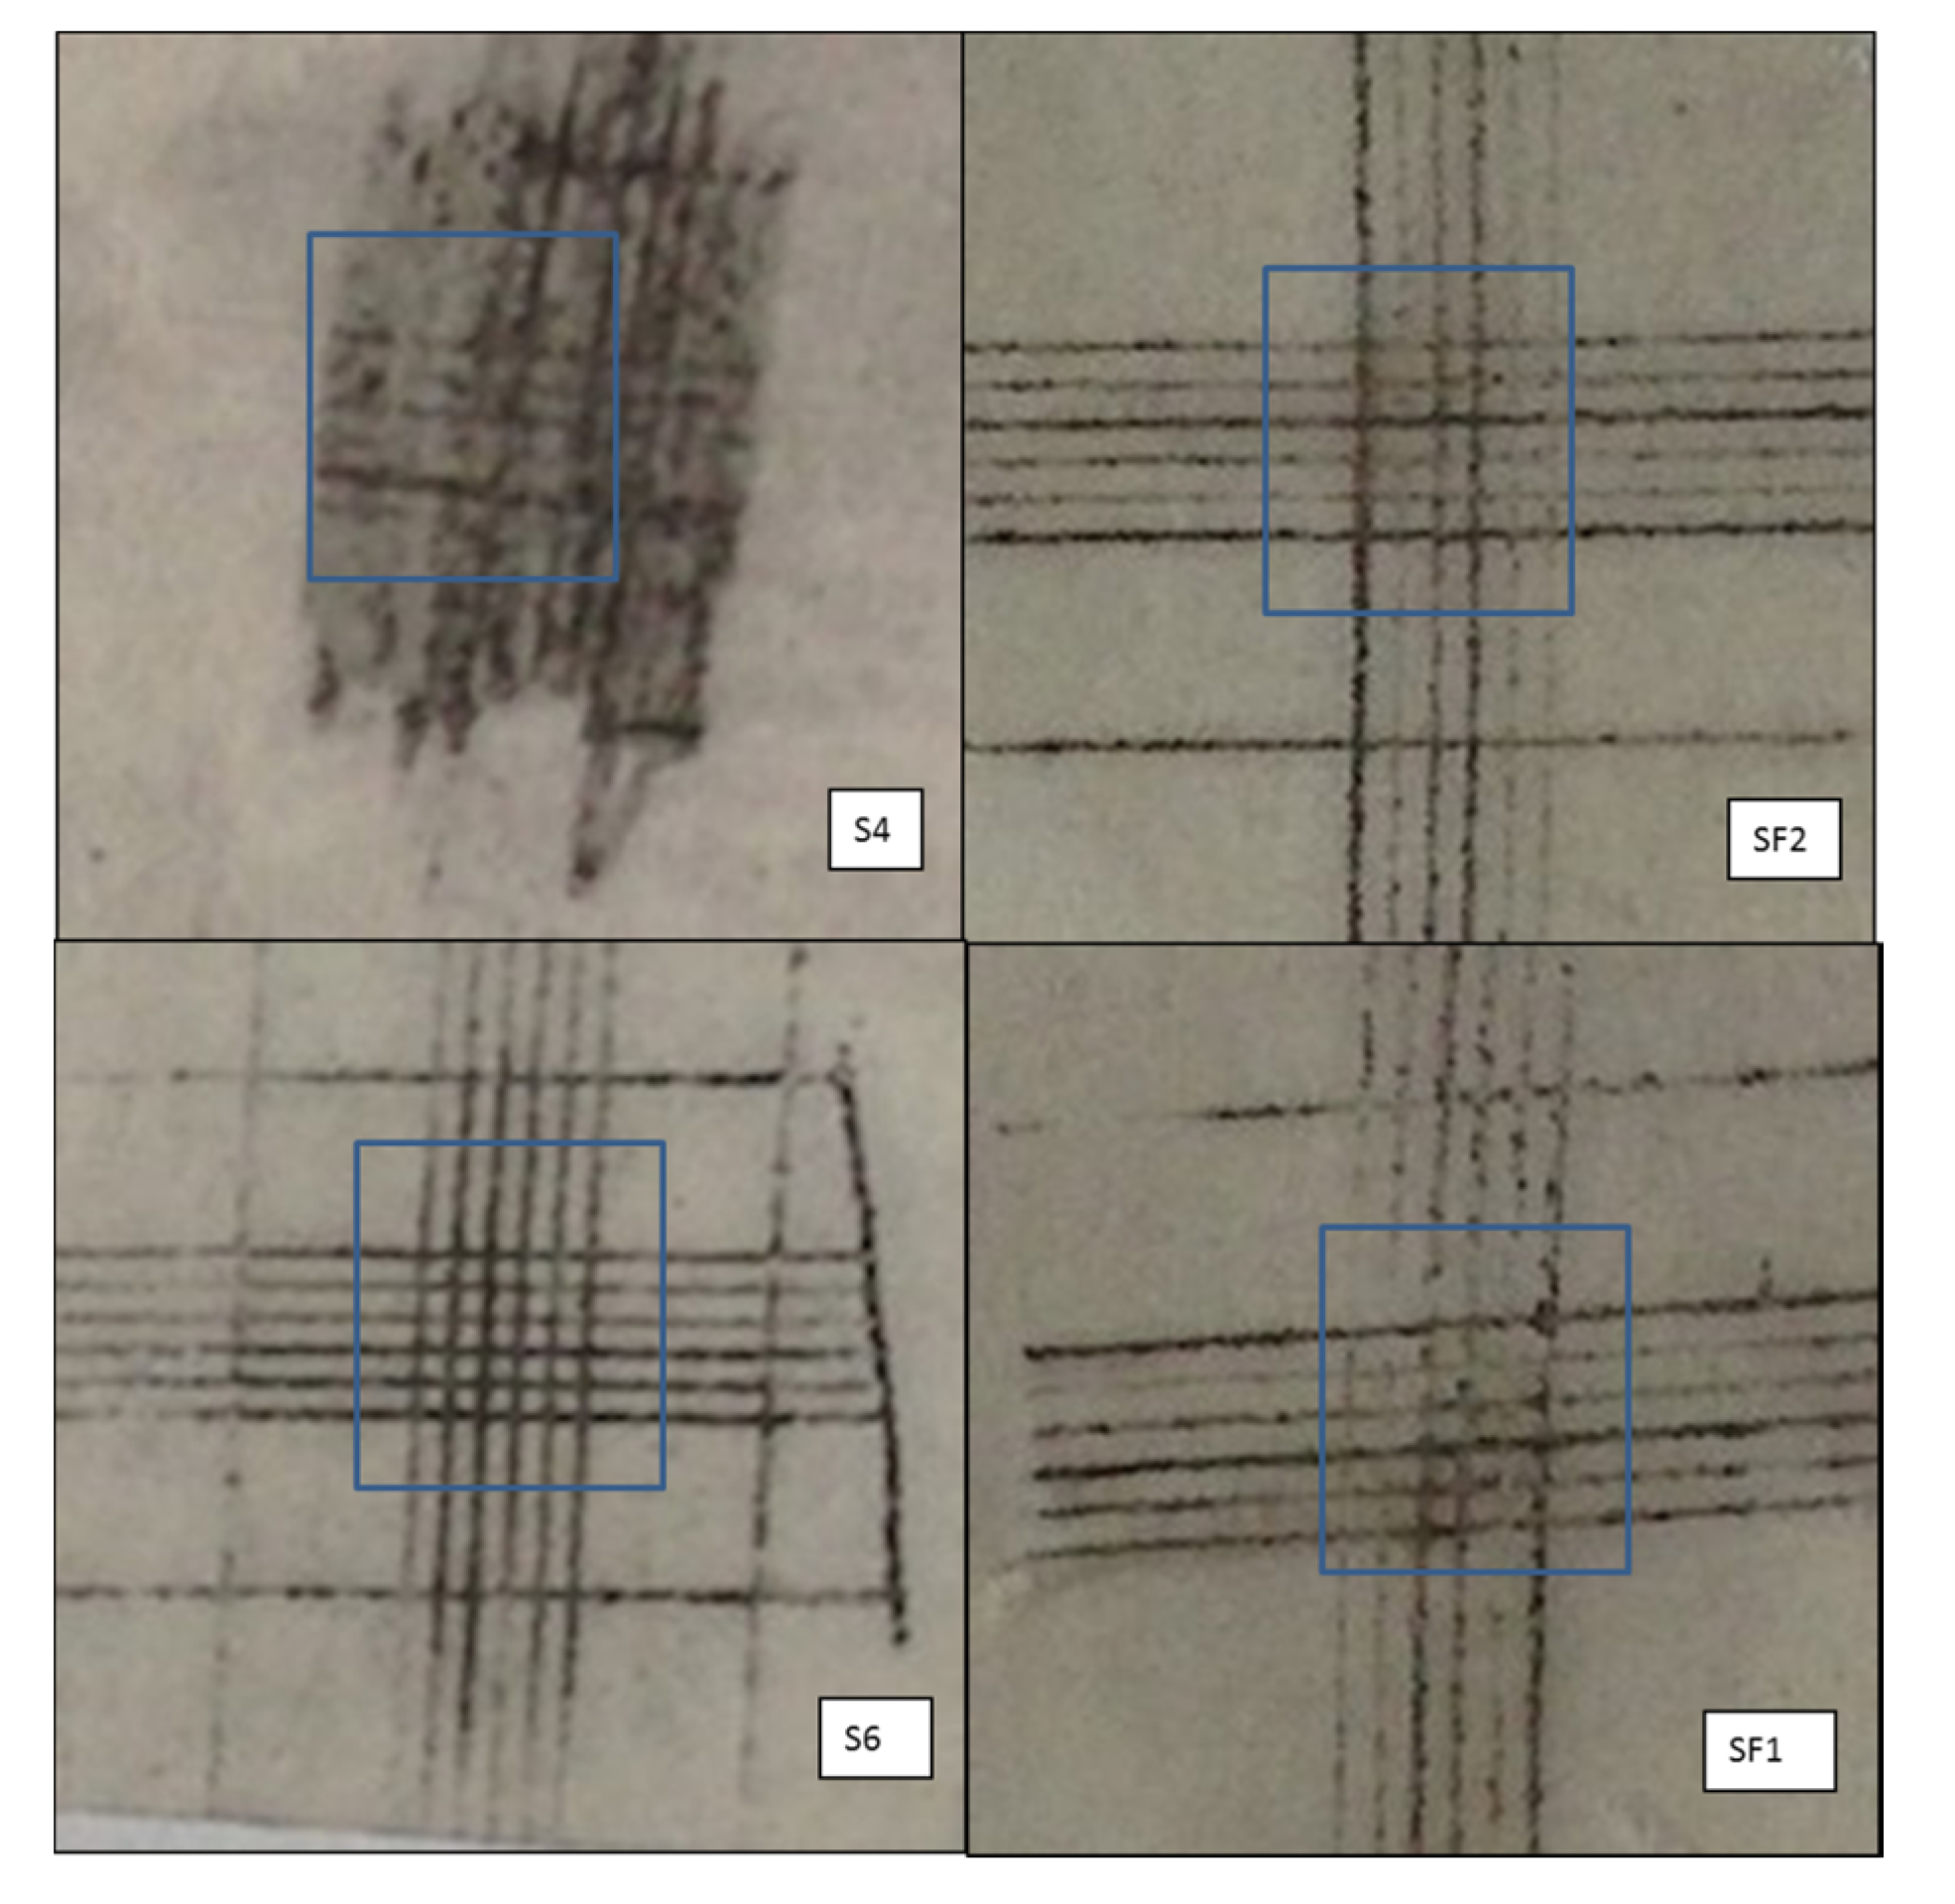
Figure 3.
Comparison between S6 vs. SF1 coated panels after thermal treatment.

Figure 4.
Comparison of the curves describing the normalized weight losses of the S4 and S6 samples.
Figure 4.
Comparison of the curves describing the normalized weight losses of the S4 and S6 samples.

Figure 5.
Comparison of the curves describing the degradation rates of the S4 and S6 samples (5.0 mg and 2.5 mg samples, respectively; not normalized by weight).
Figure 5.
Comparison of the curves describing the degradation rates of the S4 and S6 samples (5.0 mg and 2.5 mg samples, respectively; not normalized by weight).
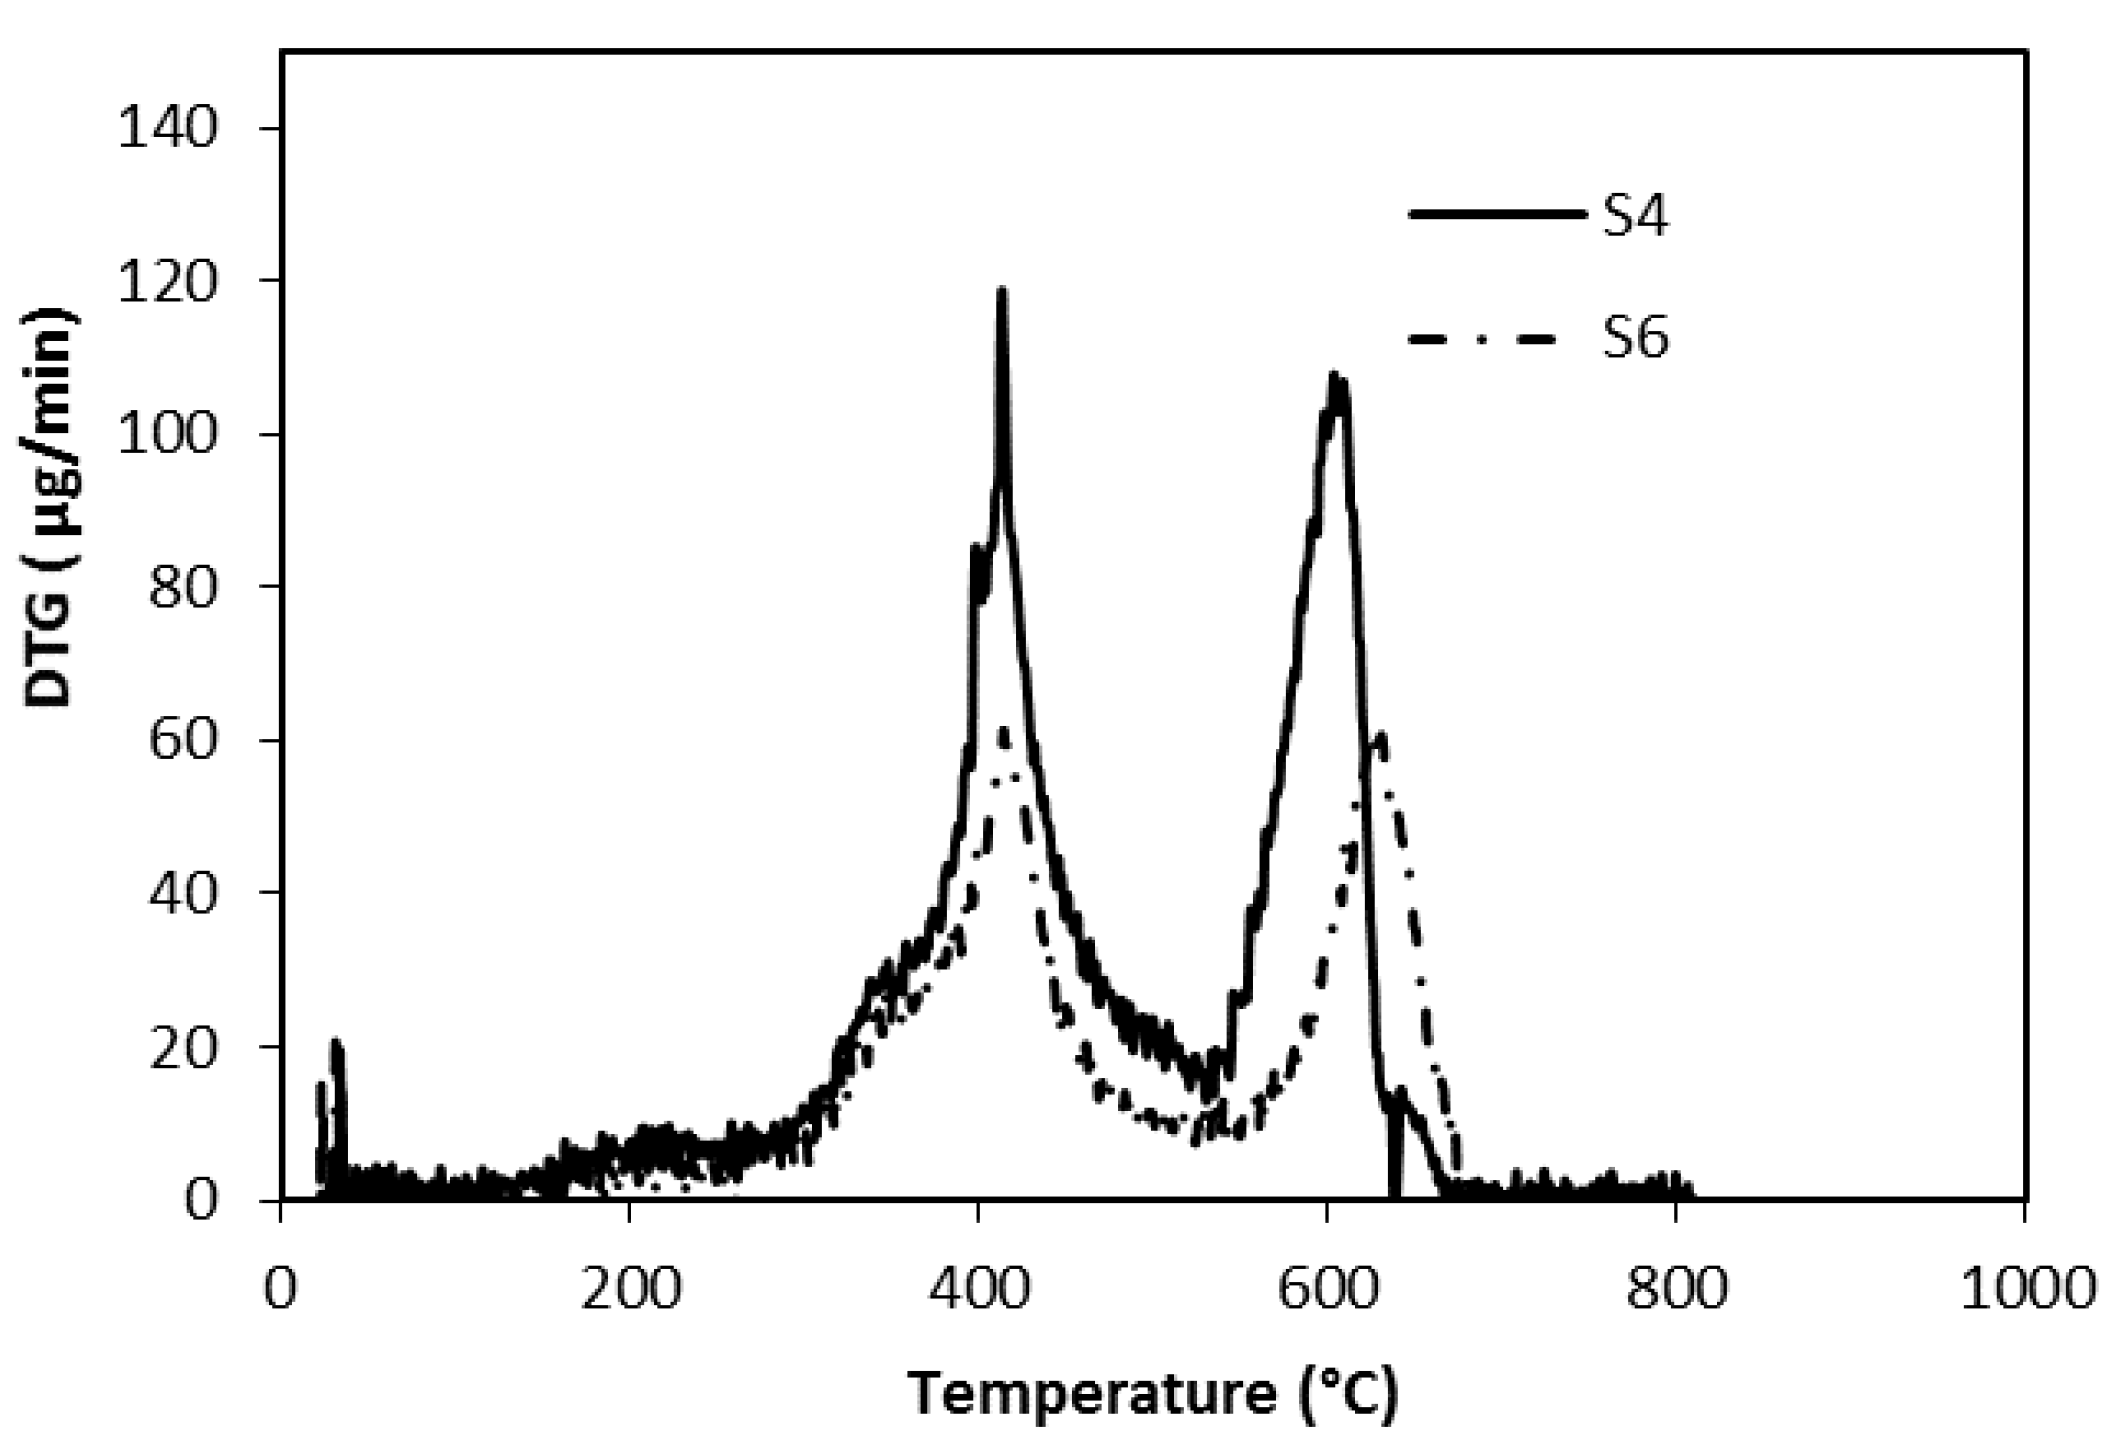
Figure 6.
Comparison of the weight losses of the S6 sample, without graphene, and the SF1 and SF2 samples, with graphene.
Figure 6.
Comparison of the weight losses of the S6 sample, without graphene, and the SF1 and SF2 samples, with graphene.

Figure 7.
DTG curves of S6, SF1, and SF2 samples (not normalized).

Figure 8.
Comparison of the DSC behaviors of S6, SF1, and SF2 samples at the same weight (5 mg).

Figure 9.
GDOES spectra of the S4 sample.

Figure 10.
GDOES of the S6 sample.

Figure 11.
S4 coating; section before HT. In the squares: (1,2) densely packed wollastonite and (3) wollastonite free region.
Figure 11.
S4 coating; section before HT. In the squares: (1,2) densely packed wollastonite and (3) wollastonite free region.

Figure 12.
S6 coating; section before HT. Homogeneous distribution of fillers.
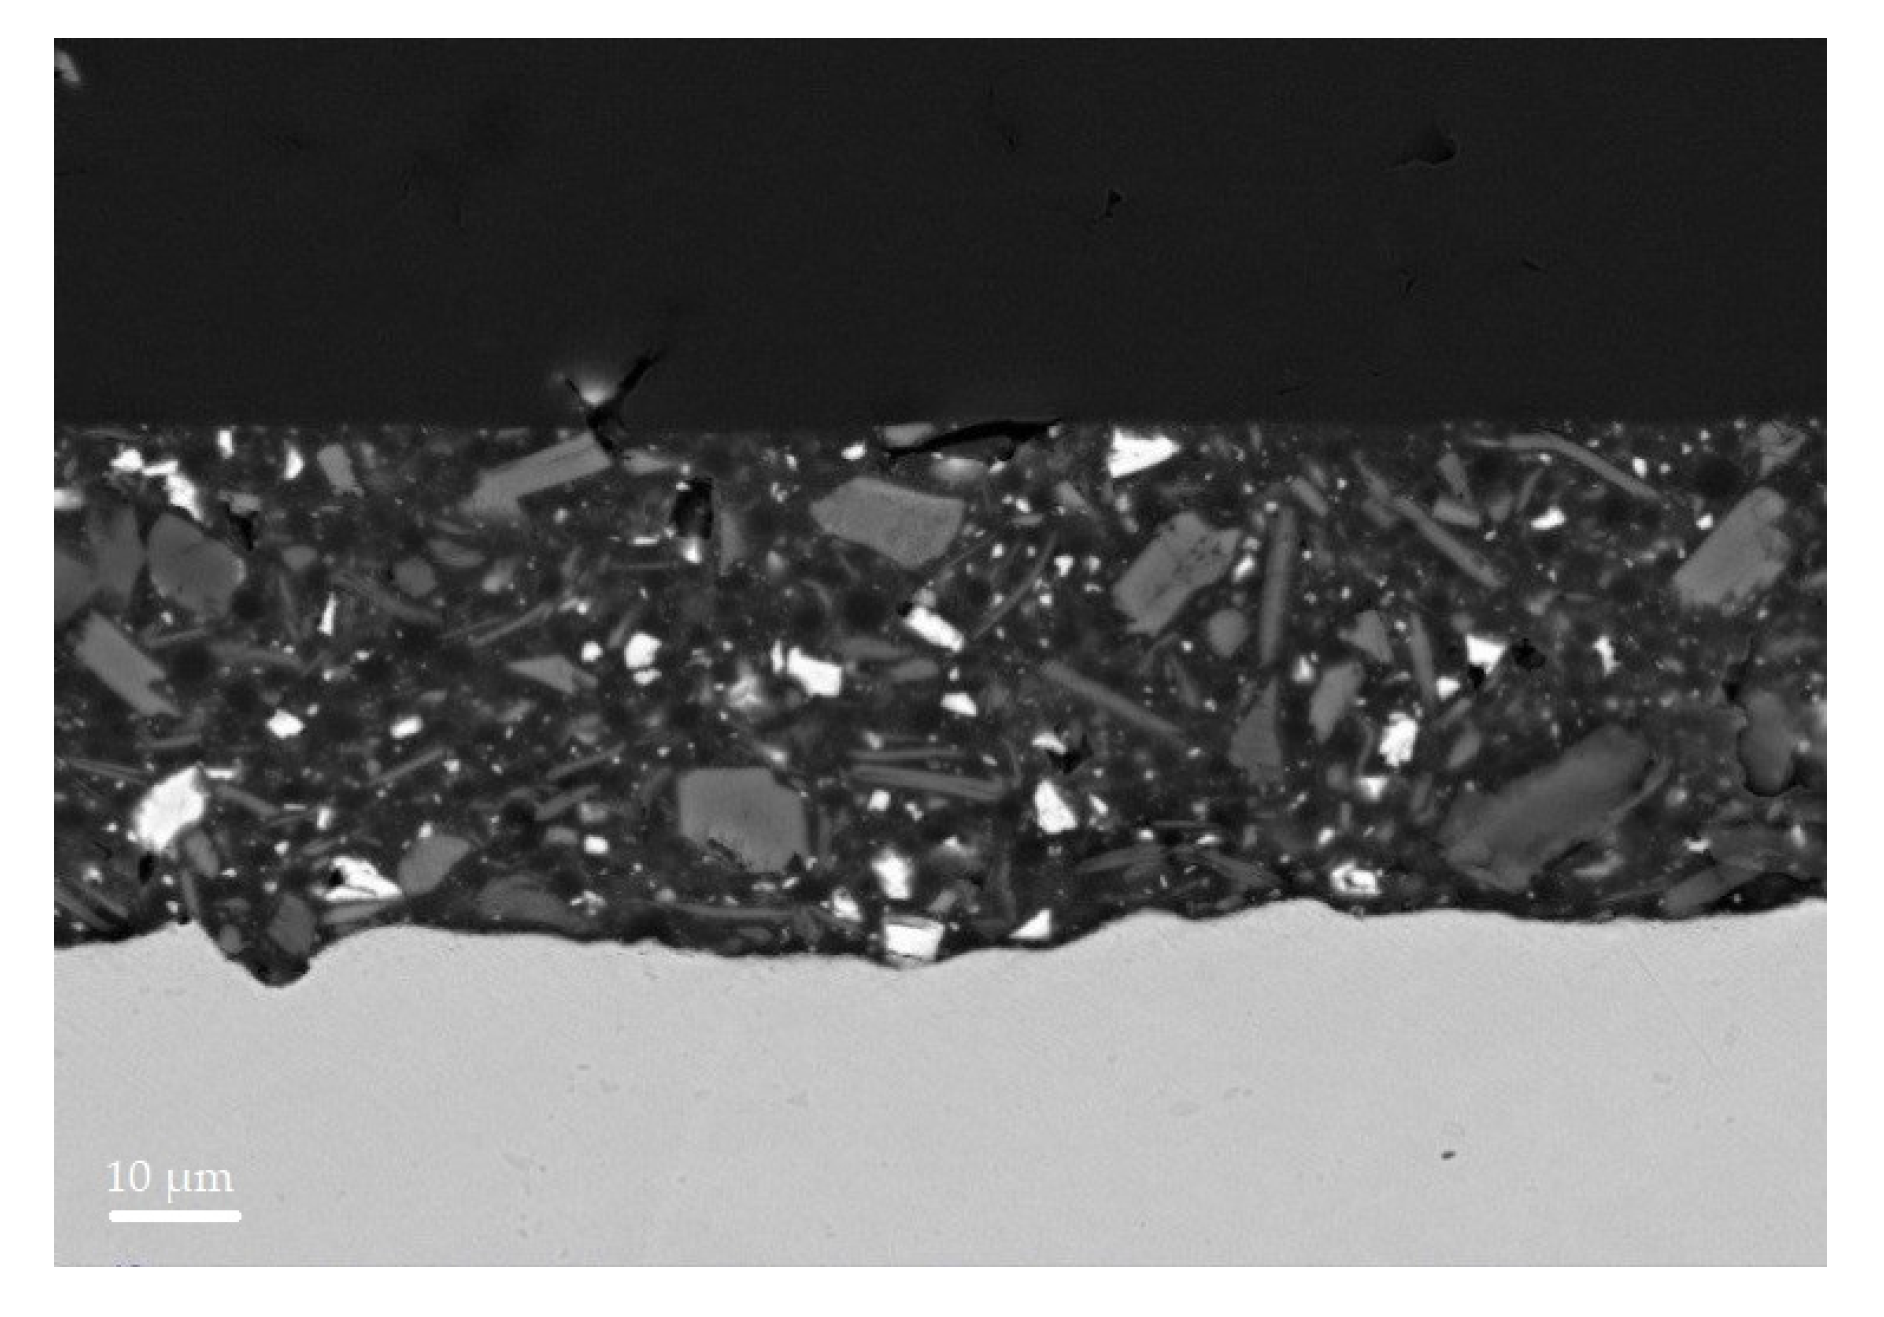
Figure 13.
(a) SEM-EDS images at high magnification of S6 coating before HT. SEM; and (b) EDS analysis of S6 details, highlighted by yellow circles in the SEM image.
Figure 13.
(a) SEM-EDS images at high magnification of S6 coating before HT. SEM; and (b) EDS analysis of S6 details, highlighted by yellow circles in the SEM image.

Figure 14.
(A) Low- and (B) high-magnification images of sections after HT: (a) S6 coating section; (b) SF1 coating section.
Figure 14.
(A) Low- and (B) high-magnification images of sections after HT: (a) S6 coating section; (b) SF1 coating section.


Table 1.
Raw materials (wt %) and sample composition of selected samples *.
| Raw Materials | Coating Composition | |||
|---|---|---|---|---|
| ID | ||||
| S4 | S6 | SF1 | SF2 | |
| Phenyl Silicone | 25 | – | – | – |
| Methyl-Phenyl Silicone | – | 25 | 25 | 25 |
| BPA Epoxy Resin | 11 | 11 | 11 | 11 |
| Carboxyl Acrylic Resin | 15 | 15 | 15 | 15 |
| Pigment Black | 1.5 | 1.5 | 1 | 1.2 |
| Fillers (1) | 46.3 | 46.3 | 46.3 | 46.3 |
| Additives (2) | 1.2 | 1.2 | 1.2 | 1.2 |
| Graphene nanoplatelets | – | – | 0.5 | 0.3 |
*: Batch of 1 kg each: (1) micro mica, baryte, wollastonite; (2) degassing agent, flow control additive and fluidization additive.
Table 2.
Pigment and filler.
| Pigments and Fillers | Chemical Analysis | Density (g·cm−3) | Oil Adsorption (g/100 g) | Particle Size (μm) |
|---|---|---|---|---|
| Pigment Black | MnFe2O4 | 4.5 (1) | 48 (2) | 0.5 (3) |
| Baryte | BaSO4 (97%)–SiO2 (2%) | 4.35 (4) | 11 (5) | 4 (6) |
| Micro Mica | KAl2(AlSi3O10)(OH)2 | 0.5 (7) | 49 (8) | 6 (9) |
| Wollastonite | CaSiO3 | 1.04 (10) | 24 (11) | 9 (3) |
(1): DIN-ISO 787 part/Teil 10; (2): DIN-ISO 787 part/Teil 5; (3): Median particle size; Cilas granulometer HR 850-B; (4): ASTM D153-82; (5): ASTM D281; (6): Average particle size; (7): Tamped density; ISO 787-11; (8): ISO 787-5; (9): Median particle size; (10): ASTM C 87; (11): ASTM C 87.
Table 3.
Sample classification on adhesion tests (according to ISO 2409:2007 E), before and after heat treatment (HT, 450 °C 12 h; air).
Table 3.
Sample classification on adhesion tests (according to ISO 2409:2007 E), before and after heat treatment (HT, 450 °C 12 h; air).
| Sample | Classification | Assessment | |
|---|---|---|---|
| Before HT | After HT | ||
| S4 | 1 | 2 | Before HT: small flake separation (<5% of the analysed area); After HT: The coating has flaked along the edges and/or at the intersections of the cuts. Failure (5–15% of the analysed area) |
| S6 | 0 | 0 | Before/after HT: the edges of the cuts are completely smooth; none of the squares of the lattice is detached |
| SF1 | 0 | 1 | Before HT: the edges of the cuts are completely smooth; none of the squares of the lattice is detached; After HT: small flake separation (<5% of the analysed area) |
| SF2 | 2 | 1 | Before HT: The coating has flaked along the edges and/or at the intersections of the cuts. Failure (5–15% of the analysed area). After HT: small flake separation (<5% of the analysed area). |
Table 4.
Coating weight losses (%).
| Steps | T (°C) | Weight Loss (wt %) | |||
|---|---|---|---|---|---|
| S4 | S6 | SF1 | SF2 | ||
| First step | 280–530 | 15.7 | 21.6 | 22.7 | 20.6 |
| Second step | 530–680 | 11.1 | 14.8 | 14.6 | 12.4 |
| Total | 26.8 | 36.4 | 37.3 | 33.0 | |
© 2017 by the authors. Licensee MDPI, Basel, Switzerland. This article is an open access article distributed under the terms and conditions of the Creative Commons Attribution (CC BY) license (http://creativecommons.org/licenses/by/4.0/).
Share and Cite
MDPI and ACS Style
Giaveri, S.; Gronchi, P.; Barzoni, A. IPN Polysiloxane-Epoxy Resin for High Temperature Coatings: Structure Effects on Layer Performance after 450 °C Treatment. Coatings 2017, 7, 213. https://doi.org/10.3390/coatings7120213
AMA Style
Giaveri S, Gronchi P, Barzoni A. IPN Polysiloxane-Epoxy Resin for High Temperature Coatings: Structure Effects on Layer Performance after 450 °C Treatment. Coatings. 2017; 7(12):213. https://doi.org/10.3390/coatings7120213
Chicago/Turabian StyleGiaveri, Simone, Paolo Gronchi, and Alessandro Barzoni. 2017. "IPN Polysiloxane-Epoxy Resin for High Temperature Coatings: Structure Effects on Layer Performance after 450 °C Treatment" Coatings 7, no. 12: 213. https://doi.org/10.3390/coatings7120213
Note that from the first issue of 2016, this journal uses article numbers instead of page numbers. See further details here.