Quantification of Thermal Barrier Efficiency of Intumescent Coatings on Glass Fibre-Reinforced Epoxy Composites


1
Institute for Materials Research and Innovation, University of Bolton, Bolton BL3 5AB, UK
2
SCG Chemicals Co., Ltd., 10 I-1 Rd., Map TaPhut Industrial Estate, Muang District, Rayong Province 21150, Thailand
3
Univ. Lille, ENSCL, UMR 8207, UMET, Unité Matériaux et Transformations, F 59 000 Lille, France
*
Author to whom correspondence should be addressed.
Coatings 2018, 8(10), 347; https://doi.org/10.3390/coatings8100347
Submission received: 28 July 2018
/
Revised: 23 September 2018
/
Accepted: 27 September 2018
/
Published: 29 September 2018
(This article belongs to the Special Issue Thermal Barrier Coatings)
Abstract
:In this work, the thermal barrier efficiency of three commercial intumescent coatings of varying thicknesses on glass fibre-reinforced epoxy (GRE) composites has been studied using cone calorimetric parameters and temperature profiles through the thicknesses, obtained by inserting thermocouples in the sample during the experiment. The methodologies developed to measure char expansion of the three coatings during the cone experiment as well under slow heating conditions using an advanced rheometric expansion system have been discussed. While the expansion ratios in the two experiments were different, the trends were similar. Thermal conductivities of the chars as a function of time were measured, which could be related to the intumescence steps of respective coatings. The accurate measurements of these parameters are important in predicting the surface requirements of an ideal coating that can enable a given composite structure to survive a defined thermal threat for a specified period of time.
1. Introduction
The use of intumescent coatings is an effective way of protecting flammable or non-flammable materials against fire and excessive heat without affecting the intrinsic properties of the underlying substrate. Intumescence is defined as the swelling of certain chemical formulations, when they are heated [1]. Intumescent coatings are designed to expand to form an insulating and fire resistant charred barrier between the fire and the underlying substrate. This char protects the underlying structure, acting as a thermal insulator/barrier against flame and heat. This means of protecting flammable materials is called “passive fire proofing” as it serves to decrease heat transfer from the fire to the underlying materials. These coatings are particularly helpful in case of fibre-reinforced polymeric structural composites, where with heat the resin part of the composite softens before degrading and then combustion of composite laminate occurs. With the softening of the resin, the fibre-matrix interfacial bonding is weakened and the laminate can lose up to 50% of original mechanical properties [2]. The combustion of composite laminate usually is accompanied by delamination, where the resin part of the composite decomposes and the fibres are torn apart from the matrix [2,3,4,5], resulting in complete loss of mechanical properties of the laminate. Since the intumescent char can effectively protect the substrate against rapid increase of temperature, the structural integrity of the laminate can be maintained for a considerable period of time.
The basic components of an intumescent formulation are an acid source (e.g., ammonium polyphosphate), char former (e.g., pentaerythritol) and a blowing agent (e.g., melamine) [1]. On heating, the acid source produces an acid, which catalyses dehydration reactions of the char former, resulting in the formation of char. In the meantime, blowing agent produces inert gas, which inflates the char [1,6]. The thickness, coherence and porosity of the char determines its thermal barrier efficiency [7,8]. The thick expanded char is usually more effective in prevention of the penetration of heat to underlying components of composite, when compared to thin expanded char layer. To evaluate the thermal barrier effectiveness of a coating on a fibre-reinforced polymeric composite laminate, it is important to predict the thermal barrier behaviour of the coating at elevated temperatures. This is also important because without predictive tools based on thorough understanding of the subject, reliance on experiments alone are expensive and will, at best, only give information specific to the test conditions. Having an accurate knowledge about the material properties is essential if correct and meaningful process modelling is to be performed. Thermal properties such as thermal conductivity are important parameters to simulate the temperature variation inside the polymer during a specific process. Thermal conductivity describes a material's ability to transport heat. Thermal gradients of polymers/composites throughout the thickness of the samples are invariably used for heat transfer modelling.
Resistance to fire of intumescent coatings on steel structures is typically measured by temperature versus time curves from large scale tests described in UL 1709 [9] or CEN [10]. However, if these coatings are to be applied on the surfaces of flammable materials, it is important to study their fire retardant and fire-resistant efficiencies. In this work, a cone calorimeter has been used at 50 kW/m2 to study the fire-retardant behaviour of three commercial intumescent coatings under room fire conditions. To study their fire resistance under these conditions, thermocouples were inserted under the coatings (on the top surface of the laminate) and on the back surfaces of the laminates and temperature profiles measured. The main purpose of this work is to develop methodologies to quantify the char expansion of these intumescent coatings under different heating conditions, measure their thermal conductivities at room and elevated temperatures and to establish relationship between thermal conductivity and char thickness.
2. Materials and Methods
2.1. Materials
2.1.1. Intumescent Coatings
Three types of commercial intumescent coatings, two of which were epoxy resin based and one water based, supplied by Sherwin-Williams (formerly Leigh Paints), UK were used. Being commercial products, their intumescent components are not known. The details of the binder used in each type of coating are as:
Epoxy based intumescent coating (EI): formulation comprises two component materials:
- Base resin containing an epoxy resin, ethyl hexyl glycidyl ether and bisphenol F-epichlorohydrin;
- Hardener containing 2,4,6-tris(dimethylaminomethyl)phenol and triethylenetetramine.
Flame retarded epoxy based intumescent coatings (ED-I): formulation comprises of two component materials.
- Base resin containing an epoxy base resin, DOPO (9,10-Dihydro-9-oxa-10-phosphaphenanthrene-10-oxide) modified epoxy resin complex, 1,4-bis(2,3epoxypropoxy) butane and triphenyl phosphate;
- Hardener containing zinc borate, tetraethylpentamine and 3-aminopropyltriethoxysilane.
The intumescent chemicals are same as in EI coating.
Water based intumescent coating (WI): This is a single component material, containing a vinyl acetate/vinyl ester copolymer system, thermally active pigments, water and butyl diglycol acetate.
2.1.2. Substrate: Glass Fibre-Reinforced Composite
An epoxy novolac resin, AralditeLY5052 (Huntsman) with Aradur 5052 hardener (Huntsman) were used for the matrix. E glass in the form of woven roving (290 g/m2, Glasplies, UK) was used as the reinforcement.
2.2. Sample Preparation
2.2.1. Surface Coating of Glass Fibre-Reinforced Epoxy (GRE) Composite Laminates
A GRE laminate of 300 mm × 300 mm size was prepared by a hand lay-up method. Eight layers of E-glass woven fabric were impregnated with epoxy resin, stacked together, vacuum bagged and cured at room temperature (RT) for 24 h followed by a post cure at 80 °C for another 8 h. The mass fraction of the resin in all samples was 50%.
GRE laminates of 75 mm × 75 mm size and ~3 mm thicknesses were individually coated with three intumescent coatings to obtain 1, 3 and 5 mm coating thicknesses. The surface of GRE laminate samples was firstly cleaned with acetone, wiped very gently with a tissue and dried at room temperature for 10 min before any surface coatings. The coating process involved firstly preparation of different intumescent coatings formulations, EI, ED-I and WI according to the manufacturer’s instructions and then each intumescent coating was independently applied on the GRE composite laminates’ surfaces by using paint brush and roller to get the uniform thickness. The thickness of each of coatings EI, ED-I and WI on GRE laminates are given in Table 1. After coating the laminate’s surface, the coated laminates were cured at room temperature for 24 h and then post-cured at 80 °C for 4 h in an oven.
2.2.2. Intumescent Coating Samples for Char Expansion and Thermal Conductivity Measurements
For char expansion study, intumescent coating samples of circular shape with 25 mm diameter and of 1 mm thickness were used, whereas for thermal conductivity measurements samples were of 50 mm diameter round shapes with 5 mm thicknesses. Samples were prepared by pouring each formulation in aluminium moulds of required dimensions and curing the coating similar to the procedure discussed in Section 2.2.1.
2.3. Thermal Barrier Behaviour Evaluation of Coatings, Applied on GRE Laminates
Control and all surface coated samples were subjected to a cone calorimeter (Fire Testing Technology, East Grinstead, UK) at 50 kW/m2 heat fluxes in the horizontal mode at a distance of 25 mm from the cone heater with a spark ignition according to ISO 5660 [11]. The results were analysed to evaluate the fire retardancy of the coated samples. To observe the thermal barrier properties (resistance to fire), in two out of three replicate cone experiments, three K-type thermocouples were inserted in each sample, one on top of the surface coating, one underneath the coating and another one on the back surface of samples. This set up is demonstrated in Figure 1. The thermocouples recorded temperature as a function of time to get the temperature profiles of each coated sample.
The thicknesses of the residual chars left from GRE samples coated with different intumescent coatings at the end of each cone calorimeter tests were measured in order to study the expansion of the coatings. The specimen thickness was measured before and after the tests. The char expansion was calculated as:
where T0 is original thickness of the laminate and T1 is final thickness of the laminate after the test
2.4. Char Expansion Study of Intumescent Coatings
2.4.1. Char Expansion as a Function of Temperature Measurement Using the Advanced Rheometric Expansion System (ARES)
An advanced rheometric expansion system (ARES 20A, Rheometric Scientific, New Castle, DE, USA) with a cylindrical sample holder (Figure 2) was used to evaluate the char expansion of the intumescent coatings as a function of temperature. The coating sample of a circular shape (disc) with 25 mm diameter and of 1 mm thickness was tested in a cylindrical sample holder of 27 mm diameter and 33 mm height to allow for char expansion as shown in Figure 2. All tests were performed under dynamic temperature ramp from 25 to 500 °C in strain-controlled mode over 1.5–3.0 gmf force range with 5 and 10 °C/min heating rates, 1.0 rad/s frequency range and 1% strain limits. Three replicate specimens of each coating were tested and the results were averaged.
2.4.2. Char Expansion as a Function of Time Measurement Using Infrared Camera in a Mass Loss Calorimeter
The expansion of three intumescent coatings as a function of time in the cone calorimetric equivalent test was conducted using a mass loss cone calorimeter (FTT) and a FLIR (ThermaCAM™ A40, Thermoconcept, Bordeaux, France) infrared camera, factory calibrated from 0 to 1000 °C. The test conditions used were similar to the ones used in cone experiment (Section 2.3), that is, at 50 kW/m2 in presence of an electric spark igniter. The infrared camera was programmed to record temperatures between 50 to 1500 °C and images were recorded at 5 s intervals for test periods of 300 s for GRE composite samples and 1000 s for intumescent coatings. Two specimens of each sample were tested for reproducibility. The char expansion data were evaluated by using image analysis software (ThermoCAM Researcher program, v.2.8) from the movie obtained from the infrared camera.
2.5. Thermal Conductivity Measurements Using the Hot Disk Method
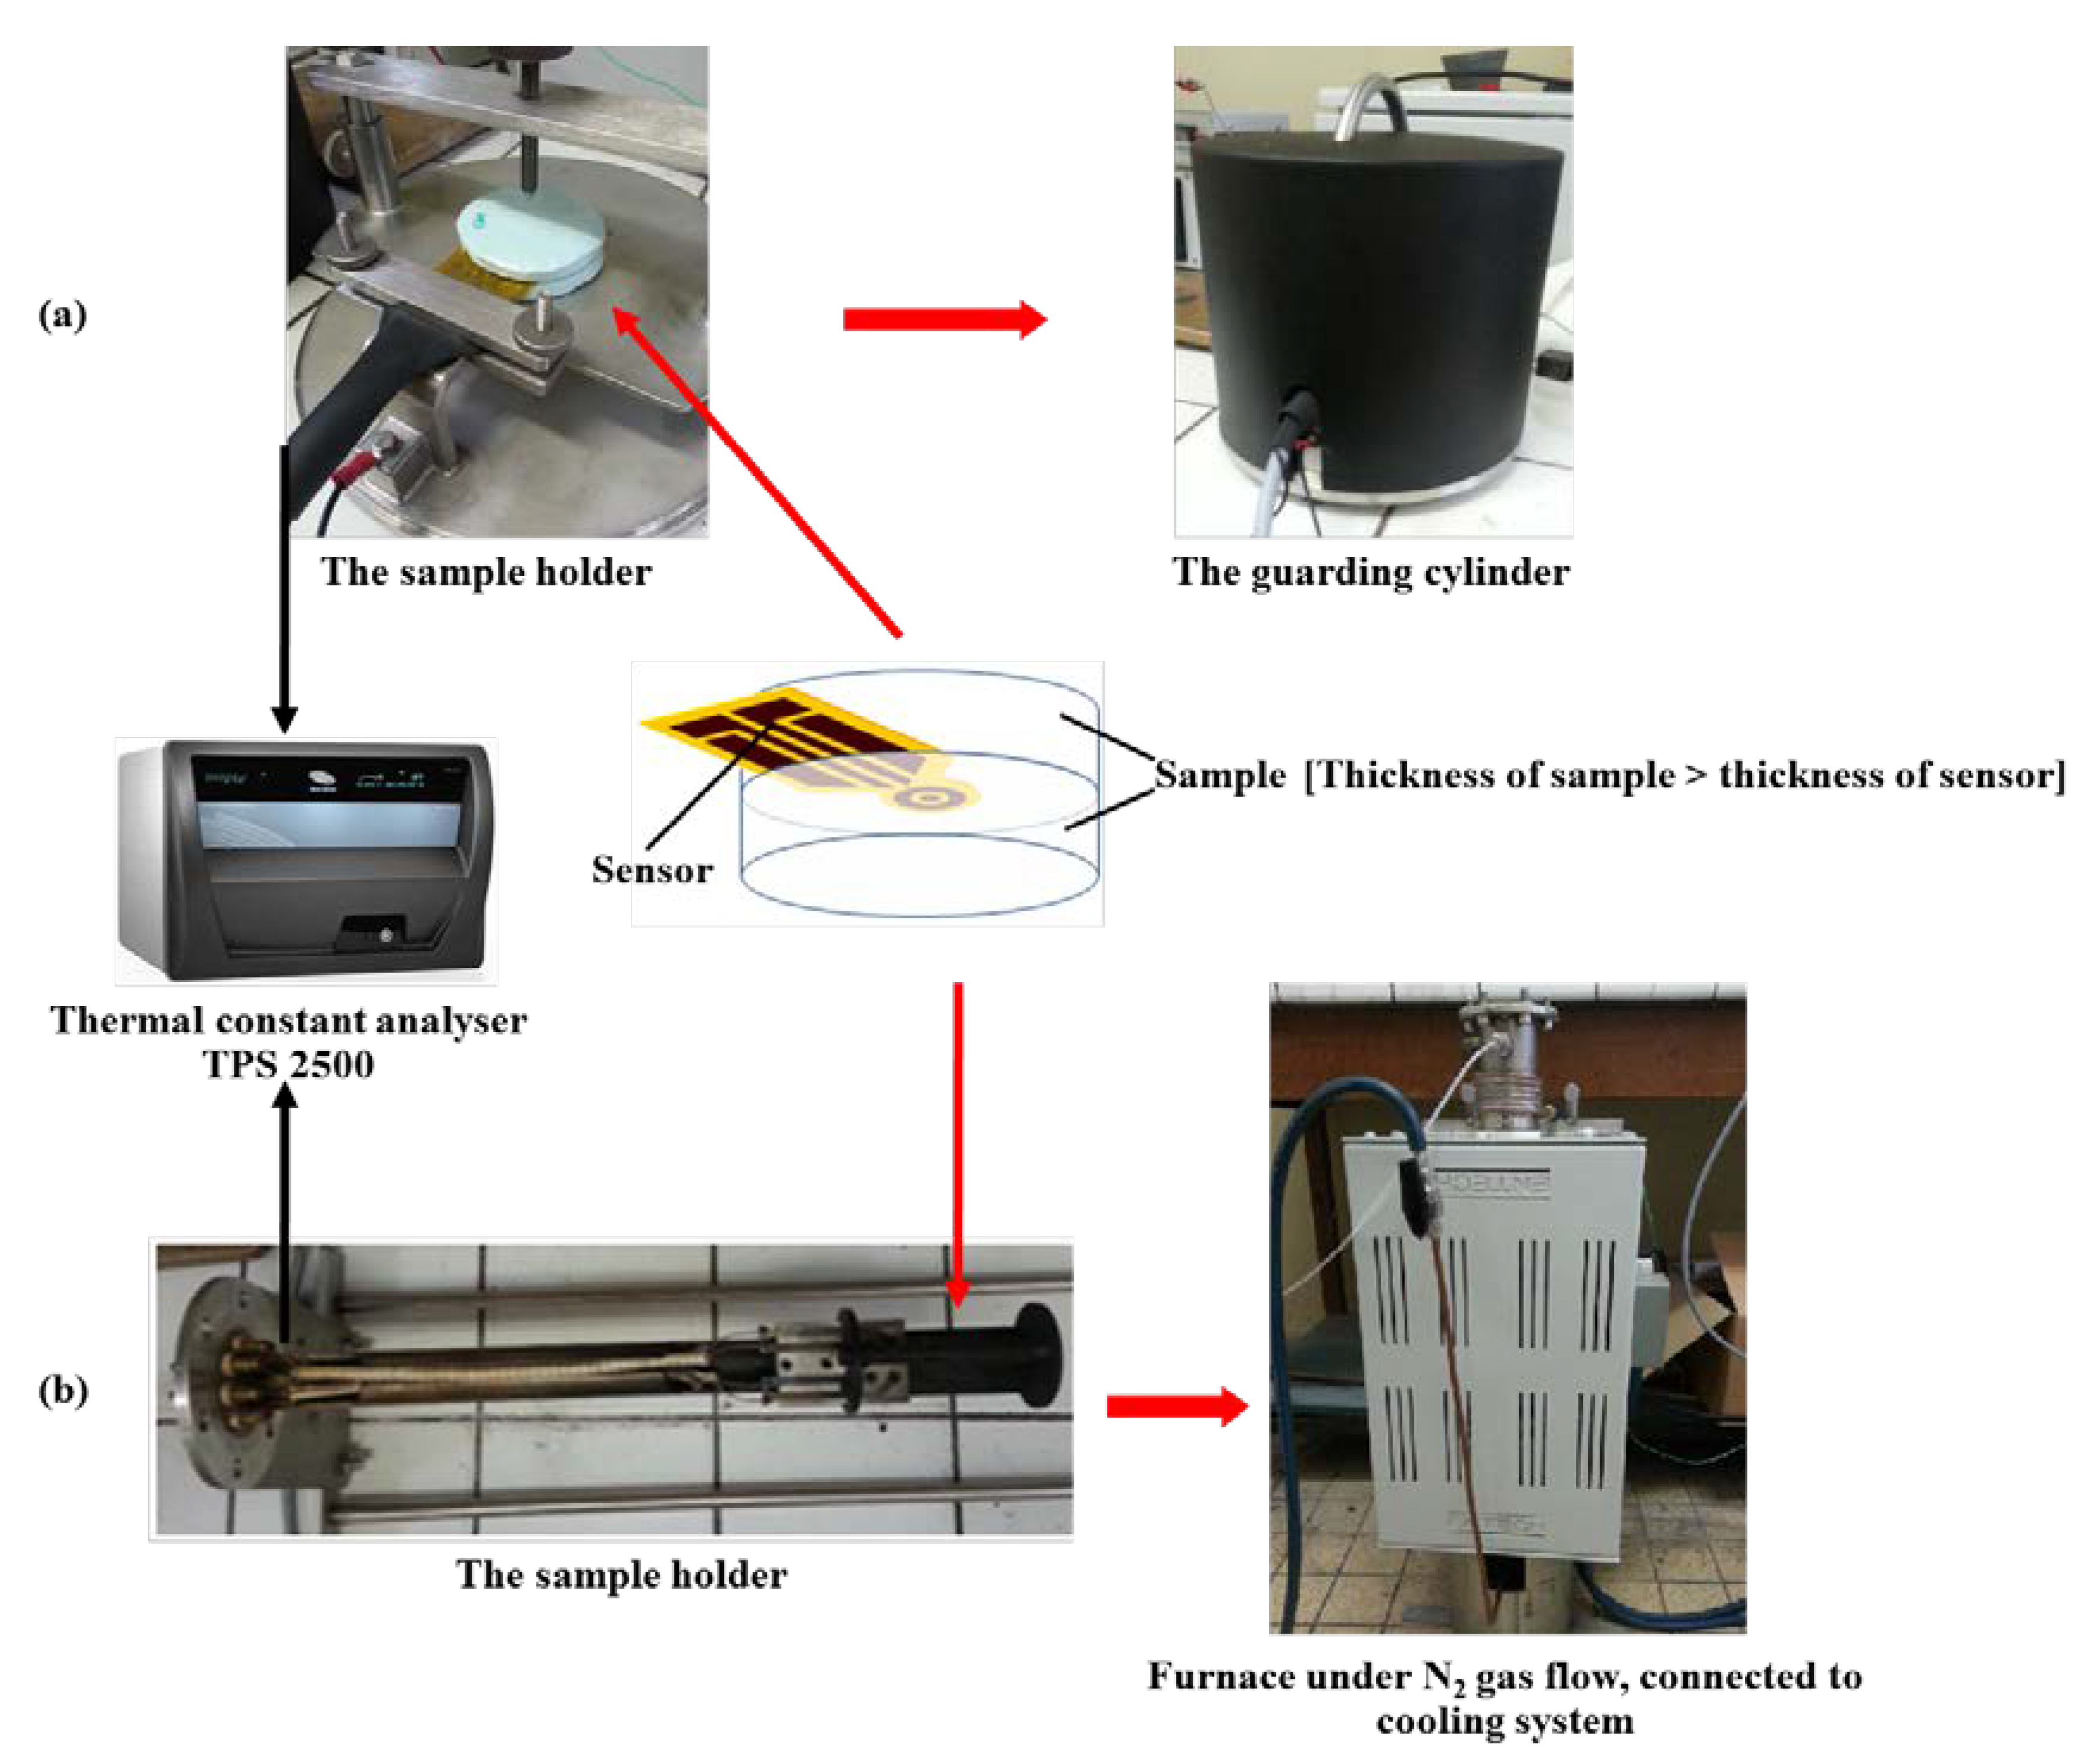
Thermal conductivities of three intumescent coatings and their expanded chars were measured by the hot disk method using a hot disk thermal constant analyser (Hot Disk TPS 2500 S, Thermo-concept, Bordeaux, France). The experimental setup for the coating at room temperature and the char obtained at high temperatures is different. However, in both cases the sensor recording of the mean temperature of the sample combined with a parameter estimation from thermal constant analyser makes it possible to estimate thermal conductivity and thermal diffusivity of the samples from a single experiment [12,13].
2.5.1. The Thermal Conductivity of the Coatings at Room Temperature
Figure 3a illustrates experimental setup for the measurements at room temperature. The hot disk sensor is placed between two sample pieces (50 mm diameter, 5 mm thickness) and installed in the guarding cylinder. The sensor is directly connected to the thermal constant analyser in order to measure the thermal conductivity of the sample at room temperature. Power applied was at 0.01–0.08 W for 10 to 40 s, depending on the thermal conductivity of each sample. The literature as well as our previous knowledge (including theoretical calculations) in our research groups allowed us to estimate the initial values. It is important that the power is adapted to be in the right conditions for solving the heat diffusion equation (assumption is semi-infinite solid). The heat penetration must not be too high and must be kept inside the sample. All tests were run in duplicate and the results averaged.
2.5.2. The Thermal Conductivity Measurement at High Temperatures
For thermal conductivity measurements of intumescent coatings and their chars at different temperatures ranging from 20 to 700 °C, sample preparation involved gluing two samples of intumescent coatings (25 mm diameter and 1 mm thickness) on each side of the hot disk sensor with a small amount of intumescent mixture (chemical formulation) to ensure a good contact between the sample and the sensor during the experiment. The experimental set up is shown in Figure 3b. The furnace and the sample holder are specially designed to permit the expansion and the degradation of the sample as a function of temperature [14]. The furnace is purged with flowing nitrogen to prevent the oxidation of the sensor. A cooling system is also connected to the furnace for measuring the thermal conductivity of the material at a particular temperature. The conductivity measurements were made by applying a power of 0.05–0.19 W for 10–80 s, depending on the thermal conductivity of each sample at a particular temperature. As explained above, the initial estimation of this value was made based on our experience as well as from other temperature dependent properties of such coatings from literature and if obtained value was different, the experimental conditions had to be modified accordingly. One sample of each type was tested. The sample was heated to a particular temperature and held at that temperature for 3–5 min before three readings were taken and the average values reported. The temperature was raised to the next required value and thermal conductivity readings taken again. These experiments were conducted at room temperature, 200, 300, 400, 500, 600 and 700 °C. The reported thermal conductivity values at all temperatures are an average of three measurements taken at a particular temperature.
3. Results and Discussion
3.1. Thermal Barrier Effect of Intumescent Coatings on GRE Laminates
3.1.1. Cone Calorimetric Parameters
The cone calorimetric results of all surface coated GRE laminates at 50 kW/m2 analysed in terms of time-to-ignition (TTI), peak heat release (PHRR), time-to-PHRR (TPHRR) are given in Table 1. To assess the hazard in a developing fire, the PHRR/TPHRR, termed as Fire Hazard Index (FHI) has also been reported in Table 1. This term is similar to FIGRA (fire growth rate = maximum quotient of HRR(t)/TPHRR, which often equals to PHRR/TPHRR) in a cone calorimeter [15], if the peak is sharp and the gradient is well defined. As discussed further on, in the intumescent coated samples, the resin binder of the coating ignites even before the intumescence occurs, the flame though is very small (see Figure 4), giving a very small PHRR. The main peak due to burning (if any) of the GRE laminate occurs at a much later stage. Hence, strictly speaking the ratio of first or second PHRR and TPHRR cannot be termed as FIGRA. This ratio however, is an important criterion to assess the fire hazard and hence, termed as FHI for systems providing passive fire protection.
The heat release rates (HRR) as a function of time curves of all GRE laminates with 1mm thick intumescent coatings are graphically plotted in Figure 4a. The curve for the control GRE shows a single sharp but narrow peak starting at 49 s and terminating within 200 s, indicating a short duration of burning. When the laminate is exposed to the cone heater, the temperature of exposed-surface rapidly increases, resulting in decomposition of the resin matrix while gaseous volatiles release. When the volatiles reach a critical mass flux, in the presence of the spark ignition source these combustible volatiles ignite. Immediately following ignition, the heat release rate (HRR) starts increasing, reaching a peak (PHRR) value of 733 kW/m2 at 91 s followed by a rapid reduction in the HRR which mirrors the conclusion of the flaming combustion process (Table 1).
Figure 4a also shows that the HRR-curve for GRE-EI-1 is very different from the control sample, being less intense but broader with two peaks, indicating a longer burning duration. The first peak is due to ignition and burning of the binder resin of the coating formulation. In the meantime, the intumescent reactions are activated and char is formed, which suppresses the burning of underlying laminate, resulting in a slow increase in HRR. The insulating effect of the intumescent char layer is clear from the drop in HRR after the initial ignition. However, after prolonged exposure to heat, the intumescent char oxidizes/degrades and underlying resin starts decomposing and burning, representing the second HRR peak. The interval between the first and the second HRR peaks indicates the thermal durability of the intumescent char.
As the coating thickness increases from 1 to 3 mm, (and hence, the increase in intumescent char thickness), the interval between the two peaks of HRR increases and the intensity of the second PHRR decreases, indicating the stability and thermal barrier efficiency of the intumescent char. The PHRR values for the second peak of GRE-EI-1, GRE-EI-3 and GRE-EI-5 samples are 321, 115 and 108 kW/m2 respectively (see Table 1), which correspond to 50%–85% reduction relative to the control sample. However, as can be noted from Table 1, all M-90 coated samples ignite slightly earlier than the control sample and the coating thickness has no effect on TTI and the first PHRR. This is most probably due to the fact that the binder resin of the intumescent coating ignites at similar time regardless of the coating thickness. The FHI value for this first stage for all three coating thicknesses is in the range 1.3–1.8, which is considerably reduced than that of the control sample. This cannot be termed as a real hazard, considering very low PHRR values (96–131 kW/m2). However, the 3 and 5 mm thick coatings provided a thicker char layer, which is a better insulator resulting in reduction in heat release rate during continued radiant heat exposure. These observations can be related to the char expansion results obtained at the end of the test as shown Table 2. The char thickness from GRE-EI-1 has the least thickness (6.8 mm) followed by GRE-EI-3 (10 mm) and GRE-EI-5 (15.8 mm). Similarly, the time to reach the second (main) peak HRR (TPHRR) was also significantly prolonged by a thicker intumescent char. This also helped in reducing the FHI values, which can identify materials’ potential fire safety. The FHI values for GRE-EI-3 and GRE-EI-5 are very low (~0.3 kW/m2·s) compared to control sample (8.1 kW/m2·s), which reflects the thermal barrier efficiency of the EI charred coating. These results suggest that the EI epoxy-based intumescent coating provided a thermally insulating expanded char on the GRE composite surface to prevent heat transfer and a rapidly growing fire. The optimal coating thickness providing a char thick enough to provide efficient thermal protection lies between 1 and 3 mm.
The ED-I coating is also an epoxy-based intumescent coating, similar to EI but the epoxy resin contains ~10 wt % of DOPO and ~1 wt % triphenyl phosphate (see Section 2.1.1). As can be seen from Table 1, TTI values of GRE-ED-I samples are reduced to 35–38 s compared to 44–46 s in GRE-EI samples. DOPO—containing epoxy resin is seen to be decomposing at a lower temperature and igniting earlier than the control resin, as also reported in literature [17]. As can be seen from Figure 4a, the pattern of the HRR curve of GRE-ED-I sample is similar to that observed for GRE-EI but the second peak is less intense and the time interval between the first and second peak HRR is longer than for the GRE-EI. The PHRR decreases with increase in coating thickness, the values being 176, 150 and 94 kW/m2 for GRE-ED-I-1, GRE-ED-I-3 and GRE-ED-I-5 samples, respectively (Table 1). THR values are also lower than the EI coated samples while the TPHRR values for the second (main) peak are delayed, resulting in further reduction in FHI value, while the FHI for the ignition stage remains similar for coatings of different thicknesses (1.6–2.1 kW/m2·s), the FHI for the second stage in GRE-ED-I-5 is reduced to 0.1 kW/m2·s. This indicates that ED-I coating provides further improvement in fire resistance and also has higher thermal barrier efficiency than EI coating at respective coating thicknesses. This can be explained by the char expansion results (Table 2), showing that GRE-ED-I-1 sample has the highest char expansion ratio (7.2), followed by GRE-ED-I-3 (7.0) and GRE-ED-I-5 (4.8) has the least char expansion ratio. For all coated samples the char expansion ratio decreases with increasing coating thickness. The higher expansion of ED-I compared to EI indicates that the presence of DOPO and other phosphorous compounds in the ED-I coating contribute to a higher char expansion and the expanded char provides more thermal barrier and hence, fire resistance than the char of the EI coating. The effect of coating thickness is similar to that of EI, that is, no effect on TTI, flame out time increases, PHRR decreases and THR increases. The optimal thickness is 3 mm.
The application of water-based intumescent coating (WI) results in shortest TTI values, which is due to flammable nature of vinyl acetate/vinyl ester copolymer binder used in this coating as opposed to less flammable epoxy resin binder in other two coatings, leading to slightly higher FHI (2.2–2.7) due to resin binder ignition. However, the expansion of the coating also starts earlier than other coatings. On comparing with GRE-EI-1 and GRE-ED-I-1 samples, GRE-WI-1 shows similar pattern of HRR curve in Figure 4a but the second peak is of much lower intensity, which can be related to their highest char expansion ratio values, for instance, 25.6 of GRE-WI-1 sample, which is higher than GRE-ED-I-1 and GRE-ED-I-1 by approximately 3–5 times (see Table 2). The thicker char provides lower PHRR values for the second peak of 55, 54 and 53 kW/m2 for GRE-WI-1, GRE-WI-3 and GRE-WI-5 samples, respectively. The second FHI values of GRE-WI-1 (0.4 kW/m2·s), GRE-WI-3 (0.1 kW/m2·s) and GRE-WI-5 (0.1 kW/m2·s) are also very low compared to that of the control sample. The superior flame retardant efficacy of WI coating can be demonstrated by the significant reduction in THR values compared with the control sample.
The effect of the thickness of all the coatings is better observed from Figure 4b–e where Δ parameters of TTI, PHRR, THR and FHI are plotted as a function of coatings thickness. The expression Δ parameter is taken as difference in the particular parameter (TTI, PHRR etc.) of the coated sample and the control sample. The results in Figure 4b show that the coating thickness of each coating has a minimal effect on TTI. PHRR however decreased from 1 to 3 mm coating and was not further affected by increasing coating thickness to 5 mm. This behaviour can be explained by the fact that when expanded char becomes very thick, it gets closer to the cone heater and hence, the incident heat flux gets higher than that for the sample kept at 25mm distance in the cone experiment. Similar trend is observed for FHI values (Figure 4c,d). The THR values increased at respective coating thicknesses, except for WI, which significantly decreased from 1 to 5 mm coating as clearly seen in Figure 4e.
3.1.2. Temperature Gradient through the Thickness of the Sample
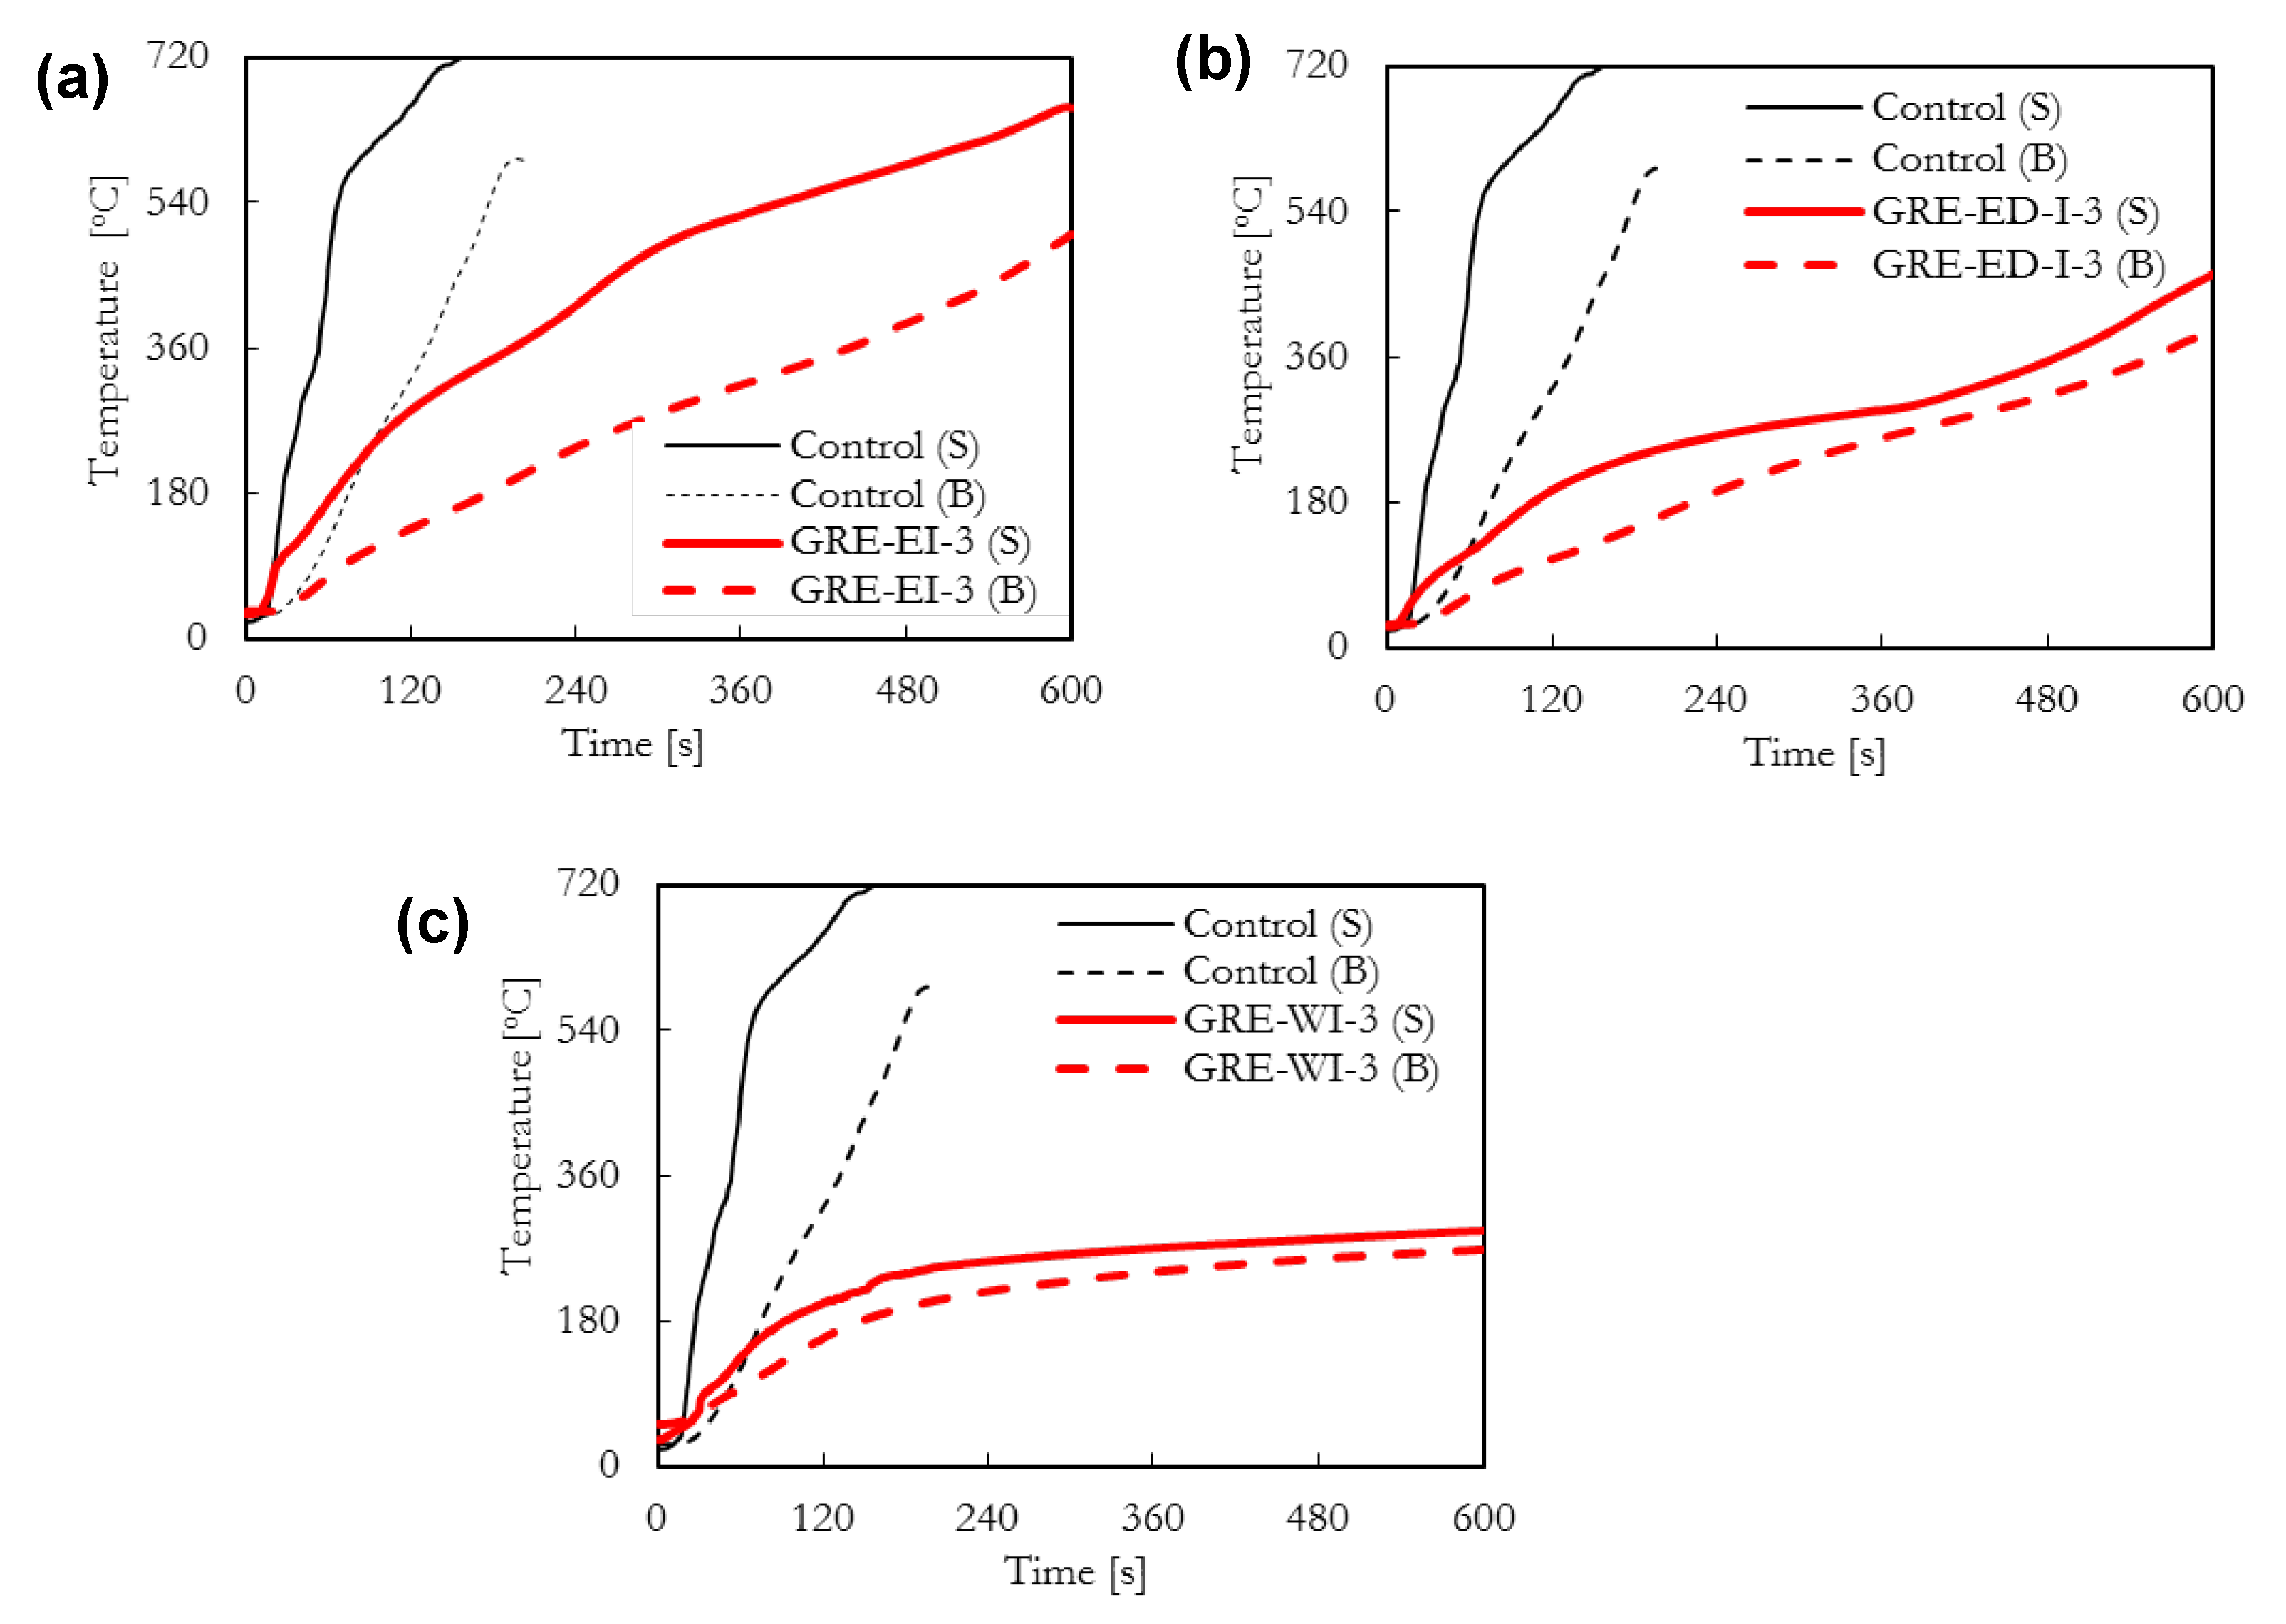
The thermal barrier effect of these intumescent coatings was investigated by measuring the temperature at the surface (TS) and the back surface (un-exposed) of the laminate (TB) during the cone calorimetric test at 50 kW/m2 heal flux (Figure 1), the results for 3 mm thick coatings are plotted in Figure 5. This approach is commonly used for measuring thermal barrier efficiency of materials [18,19,20]. It is to be noted that in the control sample, the thermocouple was placed on the surface, hence it is an estimated surface temperature, whereas, for coated laminates, the temperature measured was underneath the coating and represents the temperature at the interface of the laminate and the coating.
The uncoated GRE composite (control) shows a rapid rise in the surface temperature reaching the highest value of 720 °C only after 156 s, which indicates very high rate of temperature rise at the surface of uncoated GRE composite. The application of intumescent coatings of varied thicknesses resulted in a reduction of the rate of temperature rise of the GRE composite surface temperature, shown by lower slope of the temperature-time curve.
In a laminate, when the temperature reaches the softening or the glass transition temperature (Tg) of the epoxy resin, mechanical properties of the laminate are lost [2,16,21]. As an effective thermal barrier protection, the coating should stop or retard the temperature rise at the surface to reach Tg or the pyrolysis temperature (the temperature at which decomposition of the resin starts) of the epoxy resin. The Tg of the resin used in this work is 180 °C. The results showed (for 3 mm thick coatings, see Figure 5 that within 120 s, the surface temperature of all the coated samples has already reached the glass transition temperature of the resin (180 °C), except for the back surface temperatures which required a longer time, that is, >180 s. As can be seen from Table 1 the surface temperature of control sample reaches the glass transition temperature within 28 s. When the samples are protected by a 1 mm thick coating, there is no significant delay in time (32–38 s) to reach 180 °C. That means with the 1 mm coatings of GRE-EI, GRE-ED-I and GRE-WI, the GRE composite will start losing its mechanical properties in short period of time after exposure to a high heat source and are not very effective. However, a 3 mm thick coating significantly delayed the time taken to reach 180 °C by 65–110 s. For 5 mm coatings, the time was increased to over 300 s for EI and ED-I coatings, whilst for the WI the time was 353 s, which is not much different than that for the 3 mm thick coating. A similar effect is seen for the time required to reach the pyrolysis temperature of the resin (250 °C) on the surface for all coated samples. Among 3 mm thick coatings, GRE-WI-3 shows the longest time (223 s) and all 5 mm thick coatings are effective and take >470 s to reach 250 °C compared to 37 s in control sample. Coatings of ≥ 3 mm thickness could provide longer time to retain the mechanical properties.
3.2. Char Expansion Study
3.2.1. Char Expansion as a Function of Time, by Using a Mass Loss Calorimeter and an Infrared Camera
The char expansion of EI (1 mm), ED-I (1 mm) and WI (0.5 mm) intumescent coatings as a function of time measured during cone calorimeter condition at 50 kW/m2 using an infrared camera are shown in Figure 6 and Figure 7. This study is important as it reflects the char expansion in a real fire situation, where the heating rate is ~200 °C/min (estimated from the slope of the temperature profiles in Figure 5). In this experiment, a constant heat flux is applied with which the char expands very quickly and once the surface temperature stabilizes, the char expansion/oxidation behaviour becomes time dependent.
As can be seen from Figure 6, both EI and ED-I coatings started expanding immediately and rate of expansion was very high until 80 s, after which expansion was slower and became constant after 300 s. For the WI coating, the char kept expanding until 450 s and then stopped. The images of the chars obtained at the end of experiments in Figure 6 show the porous structure of the intumescent chars. The expansion process can also be clearly seen in Figure 7 with a sequence of infrared images taken during the formation of an intumescent char under a mass loss calorimeter. Based on these results, the WI coating showed highest char expansion and most porous char compared to other two coatings. The char expansion of three intumescent coatings can be ranked from high to low as: WI > ED-I > EI
3.2.2. Char Expansion as a Function of Temperature
The char expansion of three coatings under slow heating conditions was measured using an advanced rheometric expansion system. The char expansion results obtained under dynamic conditions with temperature ramping from 25 to 500 °C using two different heating rates (5 and 10 °C/min) are plotted in Figure 8 and analysed results are given in Table 3. The sample (coating) thickness for all coating types are 1 mm in these experiments. This particular thickness was used because char expansion ratio is maximum with this thickness (see Table 2). Moreover, the aim of this study is to understand the expansion as a function of temperature and the responses of 3 and 5 mm thick coatings as a function of temperature would be similar to that of 1 mm thick coating, the actual expansion though will vary as seen from char expansion results in cone calorimetric test in Table 2. Another reason is the experimental limitation as there is a defined gap (33 mm, Figure 2) between the two plates and with thicker coatings, in particular WI coating, the expansion could be more than the maximum gap between the plates, hence for comparison we used the same coatings thickness for the three formulations. With such a high expansion, there was also a problem in getting correct signal.
The results in Figure 8 show that the three intumescent expand at the slower heating rate in two distinct stages. In the first stage char expansion is slow, whereas in the second stage expansion rate is much higher. While the coatings used in this work are commercial products and their exact composition may involve many constituents apart from the basic intumescent materials, expansion occurs mainly because of the latter, though other constituent and in particular the binder may affect the expansion. Typically, the ‘active’ ingredients of an intumescent coating are: an acid source (e.g., ammonium polyphosphate, APP), a carbon source (polyols, e.g., petnaerythritol) and a blowing agent (e.g., melamine). These ingredients are bound together using binders, which are different for these three coatings (Section 2.1.1). The mechanism of intumescence has been well established and widely reported in literature [19,22,23]. The acid is released typically between 150 and 250 °C depending upon the source of the acid. APP for example decomposes around 215 °C [22] to produce polyphosphoric acid. The acid esterifies the carbon sources between 280 and 330 °C [23], while both of them are in semi-liquid stage. The ester decomposes via dehydration reaction resulting in the formation of a carbonaceous char. During this stage, some char expansion can also happen particularly with APP. This phenomenon corresponds to the first stage of expansion in Figure 7. In the meantime, the blowing agent decomposes while char is still in a semi - liquid stage and the formed gas expands the char, into a porous structure of very low thermal conductivity. Melamine, for example sublimes at 250 °C and over the temperature range of 270—400 °C releases large amount of ammonia [22,23]. As the reaction completes, solidification of the char occurs. This process represents the second stage of expansion in Figure 8. Beyond these stages, thermal decomposition and oxidation of char occurs resulting in ablation of the char.
For epoxy based EI and ED-I coatings, the first significant expansion started at ~180 °C and then the second expansion occurred at ~300 °C. Similar behaviour of EI and ED-I coatings suggests that intumescent chemicals in both of them are similar. On the other hand, water based WI water coating started expanding ~300 °C, followed by the second major expansion occurring after 350 °C. The effect of heating rate on char expansion of these intumescent coatings can also be observed from Figure 8. The increase of heating rate from 5 °C/min to 10 °C/min increased the char expansion ratio of EI from 2.6 to 4 and ED-I from 3.1 to 5.1, whereas in that of WI, it was reduced from 22.1 to 20.7 (see Table 3). This is probably due to the EI and ED-I being epoxy based intumescent coating systems, require a higher heat treatment to build up the char, whereas the water based intumescent coating (WI) could char better at the lower heating condition. Therefore, the char expansion of these three intumescent coatings under slow heating rate can be ordered from high to low as WI > ED-I > EI, which is consistent with the char expansion under the constant radiant heat flux (in cone tests). These results confirm that WI coating can provide higher expanded char compared to EI and ED-I coatings under all conditions.
On comparing the char formation/expansion efficiency of intumescent coatings under two different heating scenarios, that is, a constant radiant heat flux from cone calorimeter (Table 2) or slow heating conditions; that is, using a rheometer (Table 3), it can be seen that with the constant high heat flux the expansion though is very quick and with the maximum expansion being slightly higher than that observed from the slow heating test in the rheometer, the results are comparable. The expansion ratio of WI, ED-I and EI (1 mm coating) with 10 °C/min heating rate can reach up to 20.7, 5.1 and 4.0 of its original value, while, with a fixed heat flux condition at 50 kW/m2, the ratio can reach up to 25.6 (WI), 7.2 (ED-I) and 5.3 (EI).
3.3. Thermal Conductivity of the Intumescent Coatings
The thermal conductivity (k) values of EI, ED-I and WI coatings with 1 mm thickness were determined at both room temperature and elevated temperatures using the hot disk method. The observed thermal conductivity values at every 100 °C from room temperature up to 700 °C are reported in Table 4 and graphically plotted in Figure 9.
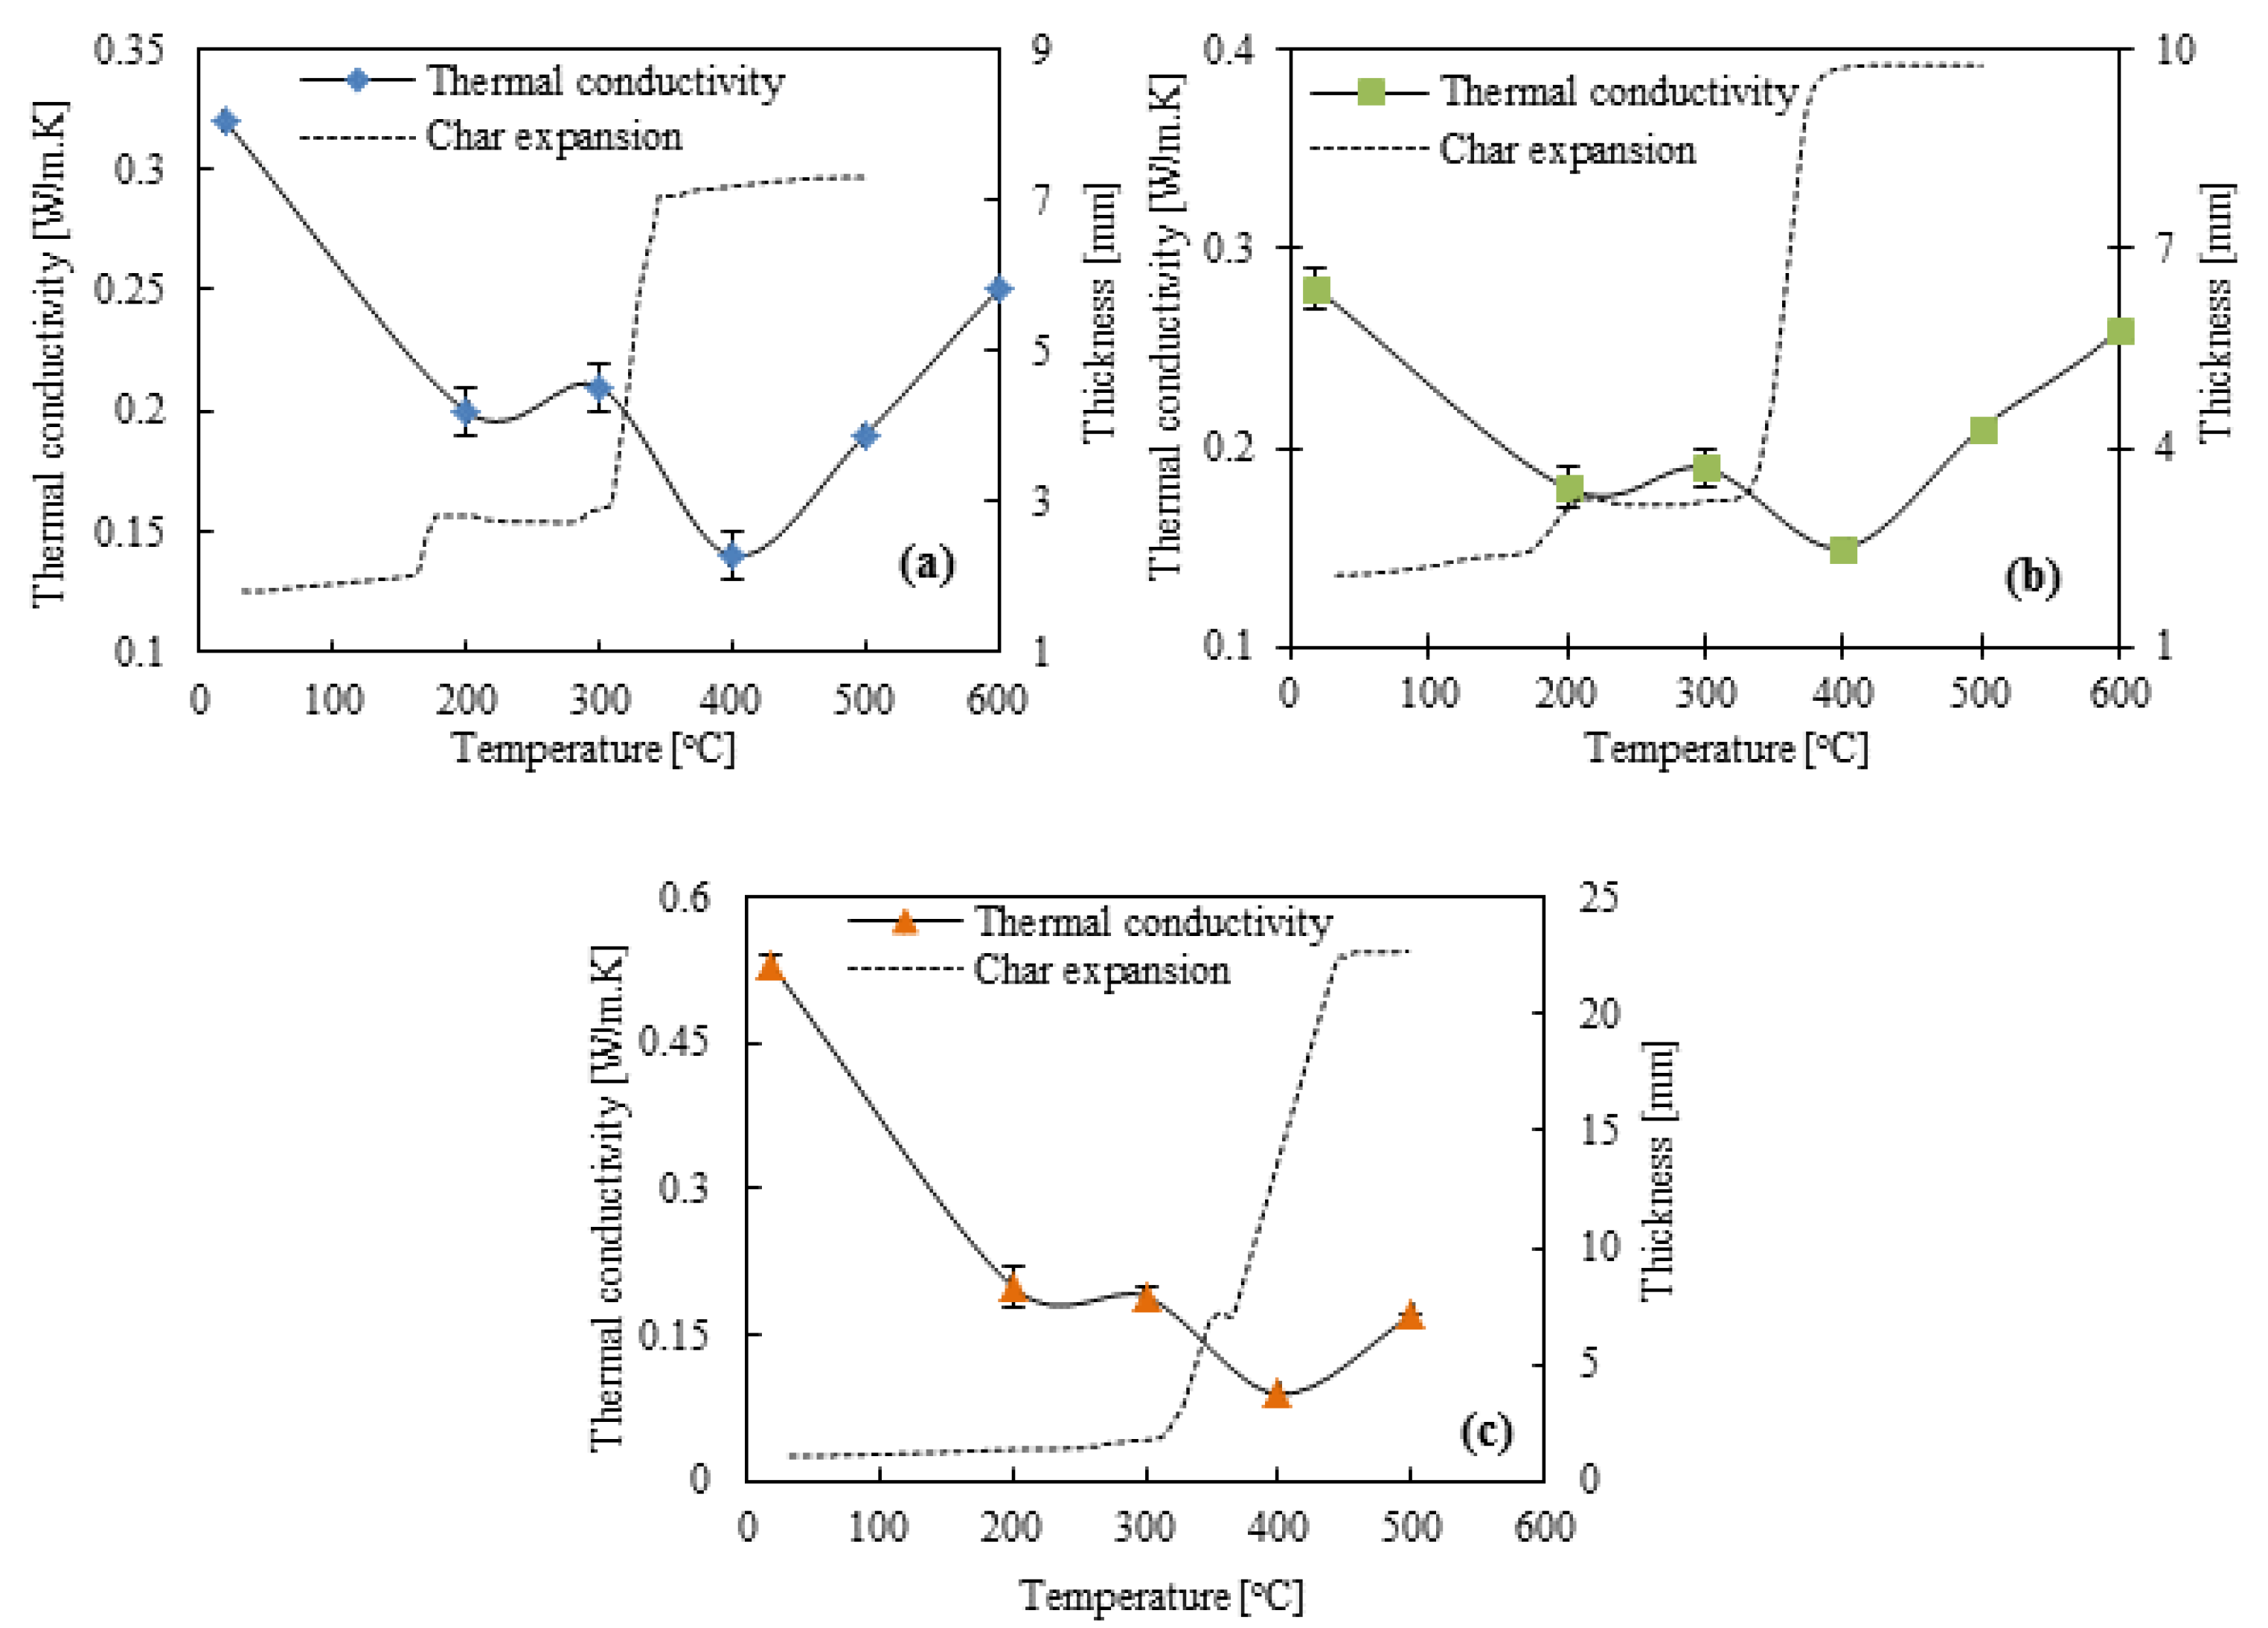
In the literature, the thermal conductivity values of intumescent char materials are reported to be varying from 0.1W/m·K to 0.4 W/m·K from room temperature to 600°C [24,25]. As can be seen from results in Table 4, the obtained thermal conductivity values for these three coatings are within the range as reported in the literature. At room temperature, WI coatings of 1 mm thickness has higher thermal conductivity values of 0.53 W/m·K compared with those of ED-I (0.32 W/m·K) and EI (0.27 W/m·K). The thermal conductivity of these three coatings first decreased and then increased with increasing temperature (Figure 9). The first significant drop in thermal conductivity values of these EI, ED-I and WI intumescent coatings was observed at 200 °C (0.20 for EI, 0.18 for ED-I and 0.20 W/m·K for WI). These values remained constant until 300 °C and then decreased again, the minimum for all three coatings being at 400 °C, after which the values increased steadily until 700 °C (see Table 4 and Figure 8). This behaviour is characteristic of an intumescent material; when exposed to high temperature, the material expands and forms a porous char structure of low thermal conductivity. The porosity of the char, defined as the ratio of the volume of voids produced by the blowing agent to the total volume, determines its thermal conductivity [24]. Hence, as the char expands due to increase in porosity the thermal conductivity decreases. Above 400 °C, the char structure does not change significantly and the thermal conductivity increases as a function of temperature due to conduction in the solid part and radiation within the voids of the char [24].
To corroborate this observation, the thermal conductivity results and the char expansions results obtained from the rheometer at 10 °C/min heating rate are overlaid in Figure 10, which shows the relationship between the thermal conductivity values and char expansion at each particular temperature of each intumescent coating.
It can be clearly seen that the first drop in thermal conductivity values of all intumescent coatings is due to the beginning of char expansion, at around 200 °C. As discussed above, around this temperature the acid source decomposes to releases an acid, which esterifies the carbon source. During these reactions, both acid and carbon source are in semi-liquid (visco-elastic) stage. Due to change from solid to visco-elastic phase, the thermal conductivity decreases. The char thickness remains constant up to 300 °C while the thermal conductivity increases slightly due to conduction and convection. Further heating promotes a greater expanded char, which also means structural changes in char (high porosity) leading to the lowest heat conductivity at 400 °C in all coatings, especially WI coating (see Figure 10c). After 400 °C, the char structure of EI and ED-I did not change much and hence the thermal conductivity increases as function of temperature due to radiation effect in voids and conduction in solid. The maximum char expansion observed for the WI coating is reflected by its lowest thermal conductivity at 400 °C. It must be noted that while the char expansion as a function of temperature calculated by the rheometer can be co-related with the temperature dependent thermal conductivity values measured by hot disk method; however, no direct relationship between the two values can be drawn due to different test conditions in both experiments. The expansion of char is limited in the hot disk method because of the design of the holder, while in rheometer the char expansion is unrestricted and hence, will be higher. After the experiments, all charred samples were cooled down to room temperature and their thermal conductivities were measured again. The results in Table 4 show that the thermal conductivities of all intumescent chars at room temperature are much lower than those at evaluated temperature, which is as expected.
From this discussion, it can be concluded that while the thermal conductivity is an intrinsic property of a material, the changes in values with temperature are due to structural changes in the material. In case of intumescent materials, it is inversely proportional to degree of char expansion and porosity of the char. These parameters are useful in designing surface coatings that can protect a particular substrate from a defined thermal threat for a specified period of time. For example, in case of composites used in this work, since glass transition temperature and decomposition temperature of the epoxy resin are ~180 and 250 °C, a temperature point at 200 °C was selected to evaluate the minimum requirement for both of thermal conductivity and coating thickness in order to protect the underlying composite structure. The results are reported in Table 4 and Figure 10. The evaluated thermal conductivity values and char thickness values in Table 4 suggest that ~0.2 W/m·K is the minimum thermal conductivity value of a ~3 mm thick char that should be able to protect a composite structure from combustion to maintain structural integrity for a period of time. This has been discussed in detail elsewhere [16], where the results have been used to set a benchmark for requirement of an ideal coating, which can provide fire protection to a composite laminate at defined heat flux for a specified period of time and maintain its mechanical integrity.
4. Conclusions
In this study, the thermal barrier effect of three commercial coatings on the fire resistance of a GRE composite has been demonstrated. The cone results showed that these three coatings had no effect on the TTI of the GRE composites but significantly reduced the peak heat release (PHRR) values (>50%). The coatings could delay and reduce the heat transfer through the laminate, measured as delay in time to reach surface temperature of the laminate (below the coating) 180 °C, which is Tg (glass transition temperature) of most epoxy resins, which helps to maintain the mechanical integrity of the composite laminates during exposure to fire/heat for a longer time. Best results were observed from 3 mm thick coatings of epoxy based intumescent coatings and 1 mm thick coating of water based intumescent coating. A good correlation in the thickness of intumescent char and its thermal conductivity at evaluated temperatures has been observed. This approach could be used to predict the requirements that an ideal coating should possess that would enable a composite structure to survive at defined heat flux for a specified period time.
Author Contributions
P.L. conducted all the tests, obtained, analysed and interpreted all the results. B.K.K. coordinated tasks relating to sample preparation, thermal barrier and flammability analyses, helped interpreting the results and wrote the paper. S.D. and S.B. coordinated tasks relating to thermophysical properties and helped P.L. in analysing and interpreting the results.
Funding
A short-term (3 months) scientific mission to visit and work at the École Nationale Supérieure de Chimie de Lille, Unité Matériaux et Transformations (UMR CNRS 8207) in the team ‘Équipe Ingénierie des systèmes polymères’ for one of the authors, Piyanuch Luangtriratana was funded by European COST (European Cooperation in Science and Technology) Action “Sustainable flame retardancy for textiles and related materials based on nanoparticles substituting conventional chemicals—FLARETEX MP1105.
Acknowledgments
The authors would like to thank Sherwin-Williams, UK for the provision of materials and Andrew Taylor for technical advice.
Conflicts of Interest
The authors declare no conflict of interest.
References
- Alongi, J.; Han, Z.; Bourbigot, S. Intumescence: Tradition versus novelty. A comprehensive review. Prog. Polym. Sci. 2015, 51, 28–73. [Google Scholar] [CrossRef]
- Kandare, E.; Kandola, B.K.; Myler, P.; Edwards, G. Thermo-mechanical responses of fiber-reinforced epoxy composites exposed to high temperature environments. Part I: Experimental data acquisition. J. Compos. Mater. 2010, 44, 3093–3114. [Google Scholar] [CrossRef]
- Khaneghahi, M.H.; Najafabadi, E.P.; Shoaei, P.; Oskouei, A.V. Effect of intumescent paint coating on mechanical properties of FRP bars at elevated temperature. Polym. Test. 2018, 71, 72–86. [Google Scholar] [CrossRef]
- Ashrafi, H.; Bazli, M.; Najafabadi, E.P.; Oskouei, A.V. The effect of mechanical and thermal properties of FRP bars on their tensile performance under elevated temperatures. Construct. Build. Mater. 2017, 157, 1001–1010. [Google Scholar] [CrossRef]
- Kandola, B.; Kandare, E. Composites having improved fire resistance. In Advances in Fire Retardant Materials; Horrocks, A.R., Price, D., Eds.; Woodhead Publishing Ltd.: Cambridge, UK, 2008; pp. 398–442. [Google Scholar]
- Le Bras, M.; Camino, G.; Bourbigot, S.; Delobel, R. Fire Retardancy of Polymers: The Use of Intumescence; The Royal Society of Chemistry: Cambridge, UK, 1998. [Google Scholar]
- Yew, M.C.; Ramli Sulong, N.H.; Yew, M.K.; Amalina, M.A.; Johan, M.R. Influences of flame-retardant fillers on fire protection and mechanical properties of intumescent coatings. Prog. Org. Coat. 2015, 78, 59–66. [Google Scholar] [CrossRef]
- Xia, Y.; Jin, F.; Mao, Z.; Guan, Y.; Zheng, A. Effects of ammonium polyphosphate to pentaerythritol ratio on composition and properties of carbonaceous foam deriving from intumescent flame-retardant polypropylene. Polym. Degrad. Stab. 2014, 107, 64–73. [Google Scholar] [CrossRef]
- UL Rapid Rise Fire Tests of Protection Materials for Structural Steel, UL 1709; Underwriter Laboratories: Northbrook, IL, USA, 1994.
- BS EN 13381-8 Test Methods for Determining the Contribution to the Fire Resistance of Structural Members-Part 8: Applied Passive Protection Products to Steel Member; BSI: London, UK, 2010.
- BS 476-15 Fire Tests on Building Materials and Structures-Part 15: Method for Measuring the Rate of Heat Release of Products; British Standards Institute: London, UK, 1993.
- Gustafsson, S.E.; Karawacki, E.; Khan, M.N. Transient hot-strip method for simultaneously measuring thermal conductivity and thermal diffusivity of solids and fluids. J. Phys. D Appl. Phys. 1979, 12, 1411–1421. [Google Scholar] [CrossRef]
- Bohac, V.; Gustavsson, M.K.; Kubicar, L.; Gustafsson, S.E. Parameter estimations for measurements of thermal transport properties with the hot disk thermal constants analyzer. Rev. Sci. Instrum. 2000, 71, 2452–2455. [Google Scholar] [CrossRef]
- Gustafsson, S.E. Transient plane source techniques for thermal conductivity and thermal diffusivity measurements of solid material. Rev. Sci. Instrum. 1991, 62, 797–804. [Google Scholar] [CrossRef]
- Schartel, B.; Hull, T.R. Development of fire-retarded materials—Interpretation of cone calorimeter data. Fire Mater. 2007, 31, 327–354. [Google Scholar] [CrossRef]
- Kandola, B.K.; Luangtriratana, P.; Duquesne, S.; Bourbigot, S. The effects of thermophysical properties and environmental conditions on fire performance of intumescent coatings on glass fibre-reinforced epoxy composites. Materials 2015, 8, 5216–5237. [Google Scholar] [CrossRef] [PubMed]
- Wang, X.; Song, L.; Xing, W.; Lu, H.; Hu, Y. A effective flame retardant for epoxy resins based on poly(DOPO substituted dihydroxyl phenyl pentaerythritol diphosphonate). Mater. Chem. Phys. 2011, 125, 536–541. [Google Scholar] [CrossRef]
- Vovelle, C.; Akrich, R.; Mellottee, H. Thermal degradation of painted wood. An experimental study. J. Fire Sci. 1983, 1, 191–199. [Google Scholar] [CrossRef]
- Jimenez, M.; Duquesne, S.; Bourbigot, S. Characterization of the performance of an intumescent fire protective coating. Surf. Coat. Technol. 2006, 201, 979–987. [Google Scholar] [CrossRef]
- Kandola, B.K.; Bhatti, W.; Kandare, E. A comparative study on the efficacy of varied surface coatings in fire proofing glass/epoxy composites. Polym. Degrad. Stab. 2012, 97, 2418–2427. [Google Scholar] [CrossRef]
- Kandare, E.; Chukwudolue, C.; Kandola, B.K. The use of fire-retardant intumescent mats for fire and heat protection of glass fibre-reinforced polyester composites: Thermal barrier properties. Fire Mater. 2010, 34, 21–38. [Google Scholar] [CrossRef]
- Camino, G.; Costa, L.; Martinasso, G. Intumescent fire-retardant systems. Polym. Degrad. Stab. 1989, 23, 359–376. [Google Scholar] [CrossRef]
- Kandola, B.K.; Horrocks, A.R. Complex char formation in flame-retarded fibre-intumescent combinations—II. Thermal analytical studies. Polym. Degrad. Stab. 1996, 54, 289–303. [Google Scholar] [CrossRef]
- Staggs, J.E. Thermal conductivity estimates of intumescent chars by direct numerical simulation. Fire Saf. J. 2010, 45, 228–237. [Google Scholar] [CrossRef]
- Gardelle, B.; Duquesne, S.; Rerat, V.; Bourbigot, S. Thermal degradation and fire performance of intumescent silicone-based coatings. Polym. Adv. Technol. 2013, 24, 62–69. [Google Scholar] [CrossRef]
Figure 1.
Experimental setup for temperature profile measurements in intumescent coated glass fibre-reinforced epoxy (GRE) composites during cone experiment at 50 kW/m2.
Figure 1.
Experimental setup for temperature profile measurements in intumescent coated glass fibre-reinforced epoxy (GRE) composites during cone experiment at 50 kW/m2.

Figure 2.
Sample holder used for the measurement of the expansion.

Figure 3.
Experimental setup for thermal conductivity measurement at (a) room temperature and (b) elevated temperatures.
Figure 3.
Experimental setup for thermal conductivity measurement at (a) room temperature and (b) elevated temperatures.

Figure 4.
(a) Heat release rate (HRR) versus time curves of control and coated samples of 1 mm coating of each type; and difference in (b) time-to-ignition (TTI), (c) peak heat release rate (PHRR), (d) fire hazard index (FHI) and (e) total heat release (THR) of each coated sample w.r.t control sample as a function of coating thickness.

Figure 5.
The surface and back surface temperatures vs. time for control and (a) EI, (b) ED-I and (c) WI coated (coating thickness = 3mm) samples at 50 kW/m2.
Figure 5.
The surface and back surface temperatures vs. time for control and (a) EI, (b) ED-I and (c) WI coated (coating thickness = 3mm) samples at 50 kW/m2.

Figure 6.
The char expansion vs. time curves and images of residual chars of EI, ED-I and WI intumescent coatings exposed to 50 kW/m2 incident heat flux for 900s (part of the figure reproduced from [16]).
Figure 6.
The char expansion vs. time curves and images of residual chars of EI, ED-I and WI intumescent coatings exposed to 50 kW/m2 incident heat flux for 900s (part of the figure reproduced from [16]).

Figure 7.
The intumescent char formation of EI-1mm, ED-I-1mm and WI-0.5mm during mass loss calorimetric test at 50 kW/m2 for 900s.
Figure 7.
The intumescent char formation of EI-1mm, ED-I-1mm and WI-0.5mm during mass loss calorimetric test at 50 kW/m2 for 900s.

Figure 8.
The char thickness vs. temperature curves from rheometer of (a) EI, (b) ED-I and (c) WI coatings at 5 and 10 °C/min heating rate up to 500 °C. (Based on data reported in [16].)
Figure 8.
The char thickness vs. temperature curves from rheometer of (a) EI, (b) ED-I and (c) WI coatings at 5 and 10 °C/min heating rate up to 500 °C. (Based on data reported in [16].)

Figure 9.
The thermal conductivity as a function of temperature of EI, ED-I, WI intumescent coatings (reproduced from [16]).
Figure 9.
The thermal conductivity as a function of temperature of EI, ED-I, WI intumescent coatings (reproduced from [16]).

Figure 10.
The relationship between char expansion and thermal conductivity values vs. temperature of (a) EI, (b) ED-I and (c) WI.
Figure 10.
The relationship between char expansion and thermal conductivity values vs. temperature of (a) EI, (b) ED-I and (c) WI.

Table 1.
Cone calorimetric results for different intumescent coatings of varying thicknesses on GRE composite samples, exposed to 50 kW/m2 heat flux.
Table 1.
Cone calorimetric results for different intumescent coatings of varying thicknesses on GRE composite samples, exposed to 50 kW/m2 heat flux.
| Sample | Coating Thickness (mm) | Cone Calorimetric Results * | Thermal Barrier; Time to Reach Surface Temp *** | ||||||
|---|---|---|---|---|---|---|---|---|---|
| TTI (s) | 1st Peak | 2nd Peak | THR (MJ/m²) | 180 °C (s) | 250 °C (s) | ||||
| PHRR (kW/m²)/TPHRR (s) | FHI ** (kW/m2·s) | PHRR (kW/m²)/TPHRR (s) | FHI ** (kW/m2·s) | ||||||
| Control | - | 49 | 733/91 | 8.1 | - | - | 38.8 | 28 | 37 |
| GRE-EI-1 | 1.27 ± 0.01 | 44 | 131/74 | 1.8 | 321/205 | 1.6 | 50.8 | 33 | 43 |
| GRE-EI-3 | 2.96 ± 0.16 | 44 | 96/75 | 1.3 | 115/405 | 0.3 | 51.5 | 65 | 98 |
| GRE-EI-5 | 5.28 ± 0.22 | 48 | 128/77 | 1.7 | 108/617 | 0.3 | 109.4 | 338 | 471 |
| GRE-ED-I-1 | 1.35 ± 0.02 | 35 | 113/57 | 2.0 | 176/262 | 0.7 | 42.9 | 38 | 56 |
| GRE-ED-I-3 | 2.95 ± 0.09 | 38 | 123/59 | 2.1 | 150/473 | 0.4 | 72.1 | 107 | 208 |
| GRE-ED-I-5 | 5.72 ± 0.09 | 37 | 96/59 | 1.6 | 94/814 | 0.1 | 76.1 | 337 | 507 |
| GRE-WI-1 | 0.94 ± 0.03 | 17 | 126/47 | 2.7 | 55/134 | 0.4 | 26.6 | 32 | 48 |
| GRE-WI-3 | 2.91 ± 0.09 | 20 | 106/47 | 2.2 | 54/385 | 0.1 | 31.2 | 110 | 236 |
| GRE-WI-5 | 5.25 ± 0.82 | 19 | 127/48 | 2.7 | 53/541 | 0.1 | 32.8 | 153 | 494 |
* The results presented are reproducible to within ±10%; ** FHI = PHRR divided by TPHRR (kW/m2·s) of 2nd Peak; *** Taken from [16].
Table 2.
Digital images and thicknesses of residual char obtained at the end of cone calorimeter experiment of control and intumescent coated GRE composites (data taken from [16]).
Table 2.
Digital images and thicknesses of residual char obtained at the end of cone calorimeter experiment of control and intumescent coated GRE composites (data taken from [16]).
| Sample | Char Residual Images | Exposure Time (s) | Char Thickness (mm) | Expansion Ratio |
|---|---|---|---|---|
| Control | 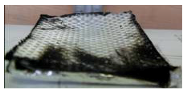 | 200 | – | – |
| GRE-EI-1 |  | 500 | 6.8 ± 2.2 | 5.3 ± 1.8 |
| GRE-EI-3 | 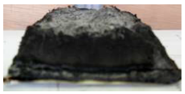 | 900 | 10.0 ± 2.0 | 3.4 ± 0.4 |
| GRE-EI-5 |  | 1400 | 15.8 ± 0.9 | 3.0 ± 0.4 |
| GRE-ED-I-1 | 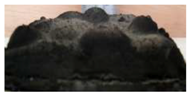 | 500 | 9.8 ± 2.8 | 7.2 ± 2.2 |
| GRE-ED-I-3 | 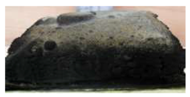 | 900 | 20.7 ± 1.3 | 7.0 ± 0.1 |
| GRE-ED-I-5 | 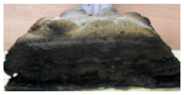 | 1600 | 27.2 ± 2.7 | 4.8 ± 0.4 |
| GRE-WI-1 | 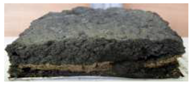 | 800 | 24.1 ± 2.6 | 25.6 ± 1.5 |
| GRE-WI-3 | 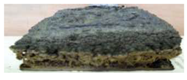 | 800 | 41.7 ± 2.4 | 14.3 ± 0.8 |
| GRE-WI-5 | 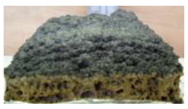 | 1200 | 36.3 ± 4.5 | 6.9 ± 0.7 |
Table 3.
The char thicknesses of intumescent coating samples from rheometer experiments at different heating rate.
Table 3.
The char thicknesses of intumescent coating samples from rheometer experiments at different heating rate.
| Heating Rate (°C/min) | Coating | Initial Thickness | Final Char Thickness | Char Expansion Ratio |
|---|---|---|---|---|
| 5 | EI | 2.156 ± 0.017 | 5.631 ± 0.250 | 2.6 ± 0.1 |
| ED-I | 2.008 ± 0.095 | 6.117 ± 0.077 | 3.1 ± 0.2 | |
| WI | 1.394 ± 0.214 | 30.135 ± 0.545 | 22.1 ± 3.0 | |
| 10 | EI | 1.811 ± 0.125 | 7.147 ± 0.234 | 4.0 ± 0.2 |
| ED-I | 1.865 ± 0.235 | 9.444 ± 0.228 | 5.1 ± 0.6 | |
| WI | 1.107 ± 0.013 | 22.929 ± 0.441 | 20.7 ± 0.6 |
Table 4.
Thermal conductivity values of the chars of intumescent coatings at different temperatures and images of residual chars obtained at the end of the test.
Table 4.
Thermal conductivity values of the chars of intumescent coatings at different temperatures and images of residual chars obtained at the end of the test.
| Temperature (°C) | Thermal Conductivity (W/m·K) * | ||
|---|---|---|---|
| EI | ED-I | WI | |
| 19 | 0.32 ± 0 | 0.28 ± 0.01 | 0.53 ± 0.01 |
| 200 | 0.20 ± 0.01 | 0.18 ± 0.01 | 0.20 ± 0.02 |
| 300 | 0.21 ± 0.01 | 0.19 ± 0.01 | 0.19 ± 0.01 |
| 400 | 0.14 ± 0.01 | 0.15 ± 0 | 0.09 ± 0 |
| 500 | 0.19 ± 0 | 0.21 ± 0 | 0.17 ± 0 |
| 600 | 0.25 ± 0 | 0.26 ± 0 | – |
| 700 | 0.30 ± 0.01 | 0.34 ± 0.01 | – |
| At room temperature after the test | 0.12 ± 0.01 | 0.11± 0 | 0.06 ± 0.01 |
| Residual char after the test |  Thickness = 10 mm | 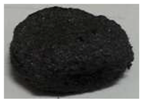 Thickness = 11 mm | 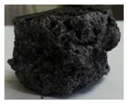 Thickness = 23 mm |
* One sample of each type was tested; heated to a particular temperature and held at that temperature for 3–5 min and then three readings taken. The reported values are average of three readings.
© 2018 by the authors. Licensee MDPI, Basel, Switzerland. This article is an open access article distributed under the terms and conditions of the Creative Commons Attribution (CC BY) license (http://creativecommons.org/licenses/by/4.0/).
Share and Cite
MDPI and ACS Style
Luangtriratana, P.; Kandola, B.K.; Duquesne, S.; Bourbigot, S. Quantification of Thermal Barrier Efficiency of Intumescent Coatings on Glass Fibre-Reinforced Epoxy Composites. Coatings 2018, 8, 347. https://doi.org/10.3390/coatings8100347
AMA Style
Luangtriratana P, Kandola BK, Duquesne S, Bourbigot S. Quantification of Thermal Barrier Efficiency of Intumescent Coatings on Glass Fibre-Reinforced Epoxy Composites. Coatings. 2018; 8(10):347. https://doi.org/10.3390/coatings8100347
Chicago/Turabian StyleLuangtriratana, Piyanuch, Baljinder K. Kandola, Sophie Duquesne, and Serge Bourbigot. 2018. "Quantification of Thermal Barrier Efficiency of Intumescent Coatings on Glass Fibre-Reinforced Epoxy Composites" Coatings 8, no. 10: 347. https://doi.org/10.3390/coatings8100347
Note that from the first issue of 2016, this journal uses article numbers instead of page numbers. See further details here.