Detection of AFB1 via TiO2 Nanotubes/Au Nanoparticles/Enzyme Photoelectrochemical Biosensor
by

Qiong Yuan
1, 
Chuxian He
1,
Rijian Mo
1,
Lei He
1,
Chunxia Zhou
1,2,3,
Pengzhi Hong
1,2,3,
Shengli Sun
4,5,6 and
Chengyong Li
1,2,3,4,5,* 1
College of Food Science and Technology, Guangdong Ocean University, Zhanjiang 524088, China
2
Shenzhen Institute of Guangdong Ocean University, Shenzhen 518108, China
3
Guangdong Modern Agricultural Science and Technology Innovation Center, Guangdong Ocean University, Zhanjiang 524088, China
4
School of Chemistry and Environment, Guangdong Ocean University, Zhanjiang 524088, China
5
Coastal Ecology Engineering Technology Research Center of Zhanjiang City, Guangdong Ocean University, Zhanjiang 524088, China
6
Center of Analysis and Test, Guangdong Ocean University, Zhanjiang 524088, China
*
Author to whom correspondence should be addressed.
Coatings 2018, 8(3), 90; https://doi.org/10.3390/coatings8030090
Submission received: 5 January 2018
/
Revised: 17 February 2018
/
Accepted: 27 February 2018
/
Published: 2 March 2018
Abstract
:TiO2 nanotubes/Au nanoparticles/enzyme photoelectrochemical biosensor is developed by the chemical bonding of acetylcholinesterase with Au nanoparticles-modified TiO2 photoactive electrode, based on the inhibitory effect of aflatoxin B1 on acetylcholinesterase activity. In this method, AuNPs were deposited on the surface of the electrode by potentiostatic deposition and the acetylcholinesterase was chemically crosslinked to the surface for determination of aflatoxin B1. Enzymatic hydrolysate is generated to capture the photogenerated holes of UV-sensitized TiO2 nanotube arrays, causing magnification of the photoelectrochemical signal. The photoelectrochemical biosensor morphological and structural details were evaluated, applying different techniques, such as X-ray Diffraction (XRD) and Scanning Electron Microscopy (SEM). Aflatoxin B1 competitively inhibits acetylcholinesterase, leading to a decrease in photocurrent that should have been increased. The detection performance of biosensors for different concentrations of AFB1 is discussed. The linear response range of the biosensor is from 1–6 nM with detection limitation of 0.33 nM, the linear equation is I (μA) = −0.13C (nM) + 9.98 (μA), with a correlation coefficient of 0.988. This new biosensor could be used to detect Aflatoxin B1 in foods.
1. Introduction
Aflatoxin B1 (AFB1) has a strong toxicity, carcinogenicity, mutagenicity, and teratogenic toxicity, existing extensively in natural food. Previous studies have shown that AFB1 is 10 times more toxic than potassium cyanide, 68 times more toxic than arsenic [1], and its carcinogenicity is 70-fold that of dimethylnitrosamine. It was also defined by the IARC (international agency for research on cancer) [2,3]. The chronic exposure of human to AFB1, even at a low concentration level, will cause the drastic health problems, such as nausea, fever, jaundice, lower extremity edema, and even fulminant hepatic failure. What is worse is that it has very stable physical and chemical properties under high temperature during cooking process. Thus, it is very important to develop a simple and rapid method to detect AFB1 in the environment to protect public health and ensure food safety. To date, a number of analysis methods are usually used to interrogate AFB1 levels in foods, including liquid chromatography-mass spectrometry (LC-MS), enzyme-linked immunosorbent assay (ELISA), and immune colloidal gold technique (GICT) [4]. Other immunological-based technologies are also available to quickly detect aflatoxins, such as radioimmunoassay, time-resolved fluorescence immunoassay, fluorescence polarization immunoassay, and lateral flow immunoassay [5]. The traditional analytical tests often require expensive instruments, tedious sample preparation, pre-treatment procedures and trained testers.
The photoelectrochemical (PEC) test, a newly developed detection method, uses light and electricity energy for the sensor excitation and determination, which can effectively reduce unwanted background noise and improve sensitivity. A molecular imprinted polymer thin film for photoelectrochemical (PEC) sensing of chlorpyrifos molecules could be successfully applied to the detection of reduced chlorpyrifos in green vegetables [6]. Based on the nanocomposite of CdSe@ZnS quantum dots (QDs) and graphene deposited on the ITO coated glass electrode as a photoactive electrode, a sensitive photoelectrochemical (PEC) biosensor had been applied in the detection of organophosphorus pesticides (OPs) [7]. The fabricated derivative photoelectrochemical sensor based on the perylene-3,4,9,10-tetracarboxylic acid/titanium dioxide (PTCA/TiO2) heterojunction had been successfully applied to the detection of parathion-methyl in green vegetables [8]. The photonic charge process of the photoactive materials, such as organic dyes and inorganic semiconductor materials, are highly sensitive to the surface chemistry and microenvironment fluctuation. TiO2 is a very attractive candidate for PEC detection, because of its strong light absorption, high chemical stability, environmental benignity, and low cost [9]. Among the matrixes, TiO2-based nanostructures feature a high degree of vertically oriented geometry and unidirectional charge transfer channel, thereby making them prime candidates for photocatalytic and PEC applications [10], and their semiconducting nanostructures have proven to be potential electrode materials that can immobilize biomolecules. Nonetheless, poor light absorption in the visible light spectrum and fast recombination of photoexcited electron-hole charge carriers remarkably hinder the potential applications of TiO2. To overpass these obstacles, various synthetic strategies have been explored, including metal or nonmetal doping [11,12], metal deposition [13], and heterocoupling with narrow-band gap semiconductors [14]. In our study, the introduction of precious metal Au nanoparticles on the surface of titanium dioxide, excited electrons flow from the semiconductor to the metal under light irradiation, and then the Schottky barrier between the titanium oxide and the metal nanoparticles prevents electrons from flowing to the titanium dioxide and prevents electron-hole recombination, acting as an electron trap, thereby improving the stability of the photocatalyst [15,16]. We mainly explore the simple, sensitive, and rapid photoelectrochemical method for detecting aflatoxin B1 in food. In the photoelectrochemical (PEC) test of TiO2, the use of electronic detection makes the optoelectrochemical apparatus easier and low-cost when compared with traditional optical methods.
In this manuscript, a photoelectrochemical biosensor is developed by the chemical bonding of acetylcholinesterase (AchE) on TiO2 photoactive electrode modified with Au nanoparticles (AuNPs), based on the inhibitory effect of AFB1. By this means, enzymatic hydrolysate (sulfhydryl) was generated to capture the photogenerated holes UV-sensitized TiO2 nanotube arrays (TiO2NTs), resulting in an amplification of the photocurrent signal. AFB1 could competitively inhibit AchE activity, leading to a decrease in photocurrent. In addition, we found that the bandgap effect of doped AuNPs on TiO2NTs contributed significantly to the enhanced PEC and photocatalytic performances of ternary nanostructures. This detection technique could be applied to detect aflatoxins B1 in foods.
2. Materials and Methods
Ammonium fluoride (≥99.99% trace metal basis), glycerol (anhydrous, 99.8%), dibasic sodium phosphate (≥99.0%, powder), potassium dihydrogen phosphate (≥99.0%, powder), acetone (≥99.0%), anhydrous ethanol (≥99.0%), chloroauric acid, chitosan (CS, deacetylation, 95%), glutaraldehyde (CAD ≥ 99.0%), acetylcholinesterase (AchE, specific activity 1000 U/mg), 2-acetylsulfanylethyl (trimethyl) azanium, chloride (ATCl), aflatoxin B1 (AFB1), and methanol (≥99.0%) were purchased by Sigma-Aldrich St. Louis, MO, USA. Titanium tablets (≥99.7%) and aluminum sheet (≥99.7%) were used as a substrate material. All of the solutions were prepared with ultrapure water (Milli-Q, Merck, Darmstadt, Germany).
All electrochemical experiments we reported were executed with CHI660E electrochemical workstation (CH Instruments Ins., Austin, TX, USA) and three-electrode arrangement. Constant potential deposition and amperometric i-t method was performed with Ag/AgCl (3 M NaCl type) and platinum wire as reference and auxiliary electrodes, separately. The exposed or modified form of TiO2NTs was used as the working electrode. The potential was 0 V and sample interval is 0.1 s. The working electrode surface was irradiated by a focused UV light beam from a high-pressure mercury lamp (365 nm, F8T5). Scanning electron microscopy studies were performed with S-4800 (Hitachi S-4800, Tokyo, Japan). Samples were coated with platinum (5 nm) prior to imaging with SEM. X-ray diffraction spectra (XRD) of the samples were performed using Rigaku MiniFlex 600, Tokyo, Japan. All of the samples were detected at a scan rate of 1°/min and a step of 0.03° in the 2θ range of 10°–90°.
2.1. Biosensors Preparation
2.1.1. Fabrication of TiO2NTs Electrode
TiO2NTs electrode was fabricated using an anodization process described elsewhere [17]. Specifically, titanium foils of thickness 0.25 mm and 99.8% purity were used to fabricate titania nanotubes. The electrolyte consisted of 0.5 wt % NH4F-glycerol and water (1:1), a platinum electrode served as a cathode, and titanium served as anode. Anodization was carried out at a constant voltage of 20 V for 2 h. Then, the anodized samples were ultrasonically cleaned in absolute ethanol and deionized water for 15 s to remove surface debris. The nanotubes were then annealed at 500 °C for 1 h in dry oxygen because these environmental conditions are known to affect the phase transition of titanium dioxide. Titanium dioxide with pore size of 100 nm was obtained ultimately.
2.1.2. Fabrication of Au/TiO2NTs Composite Electrode
Au/TiO2NTs composite electrode was prepared by potentiostatic electrodeposition of chloroauric acid. Three-electrode arrangement was used for electrochemical deposition. The TiO2NTs electrode was immersed in a 0.1 mM HAuCl4·4H2O electrodeposition solution. After the electrochemical deposited at 0 V for 5 min using a current time profile (i-t), during this period, the Au nanoparticles was reduced to the electrode surface, then the electrode was rinsed with water and dried to get a Au/TiO2NTs composite electrode.
2.1.3. Fabrication of Au/AchE/TiO2NTs Modified Electrode
The Au/TiO2NTs composite electrode was immersed in 5% chitosan solution overnight, then dried at room temperature and immersed in 5% glutaraldehyde solution overnight. After drying at room temperature, 10 μL of AchE (500 U/mL) was added dropwise to the electrode surface and placed in a refrigerator (4 °C).
2.2. Procedure for Electrochemical Biosensor
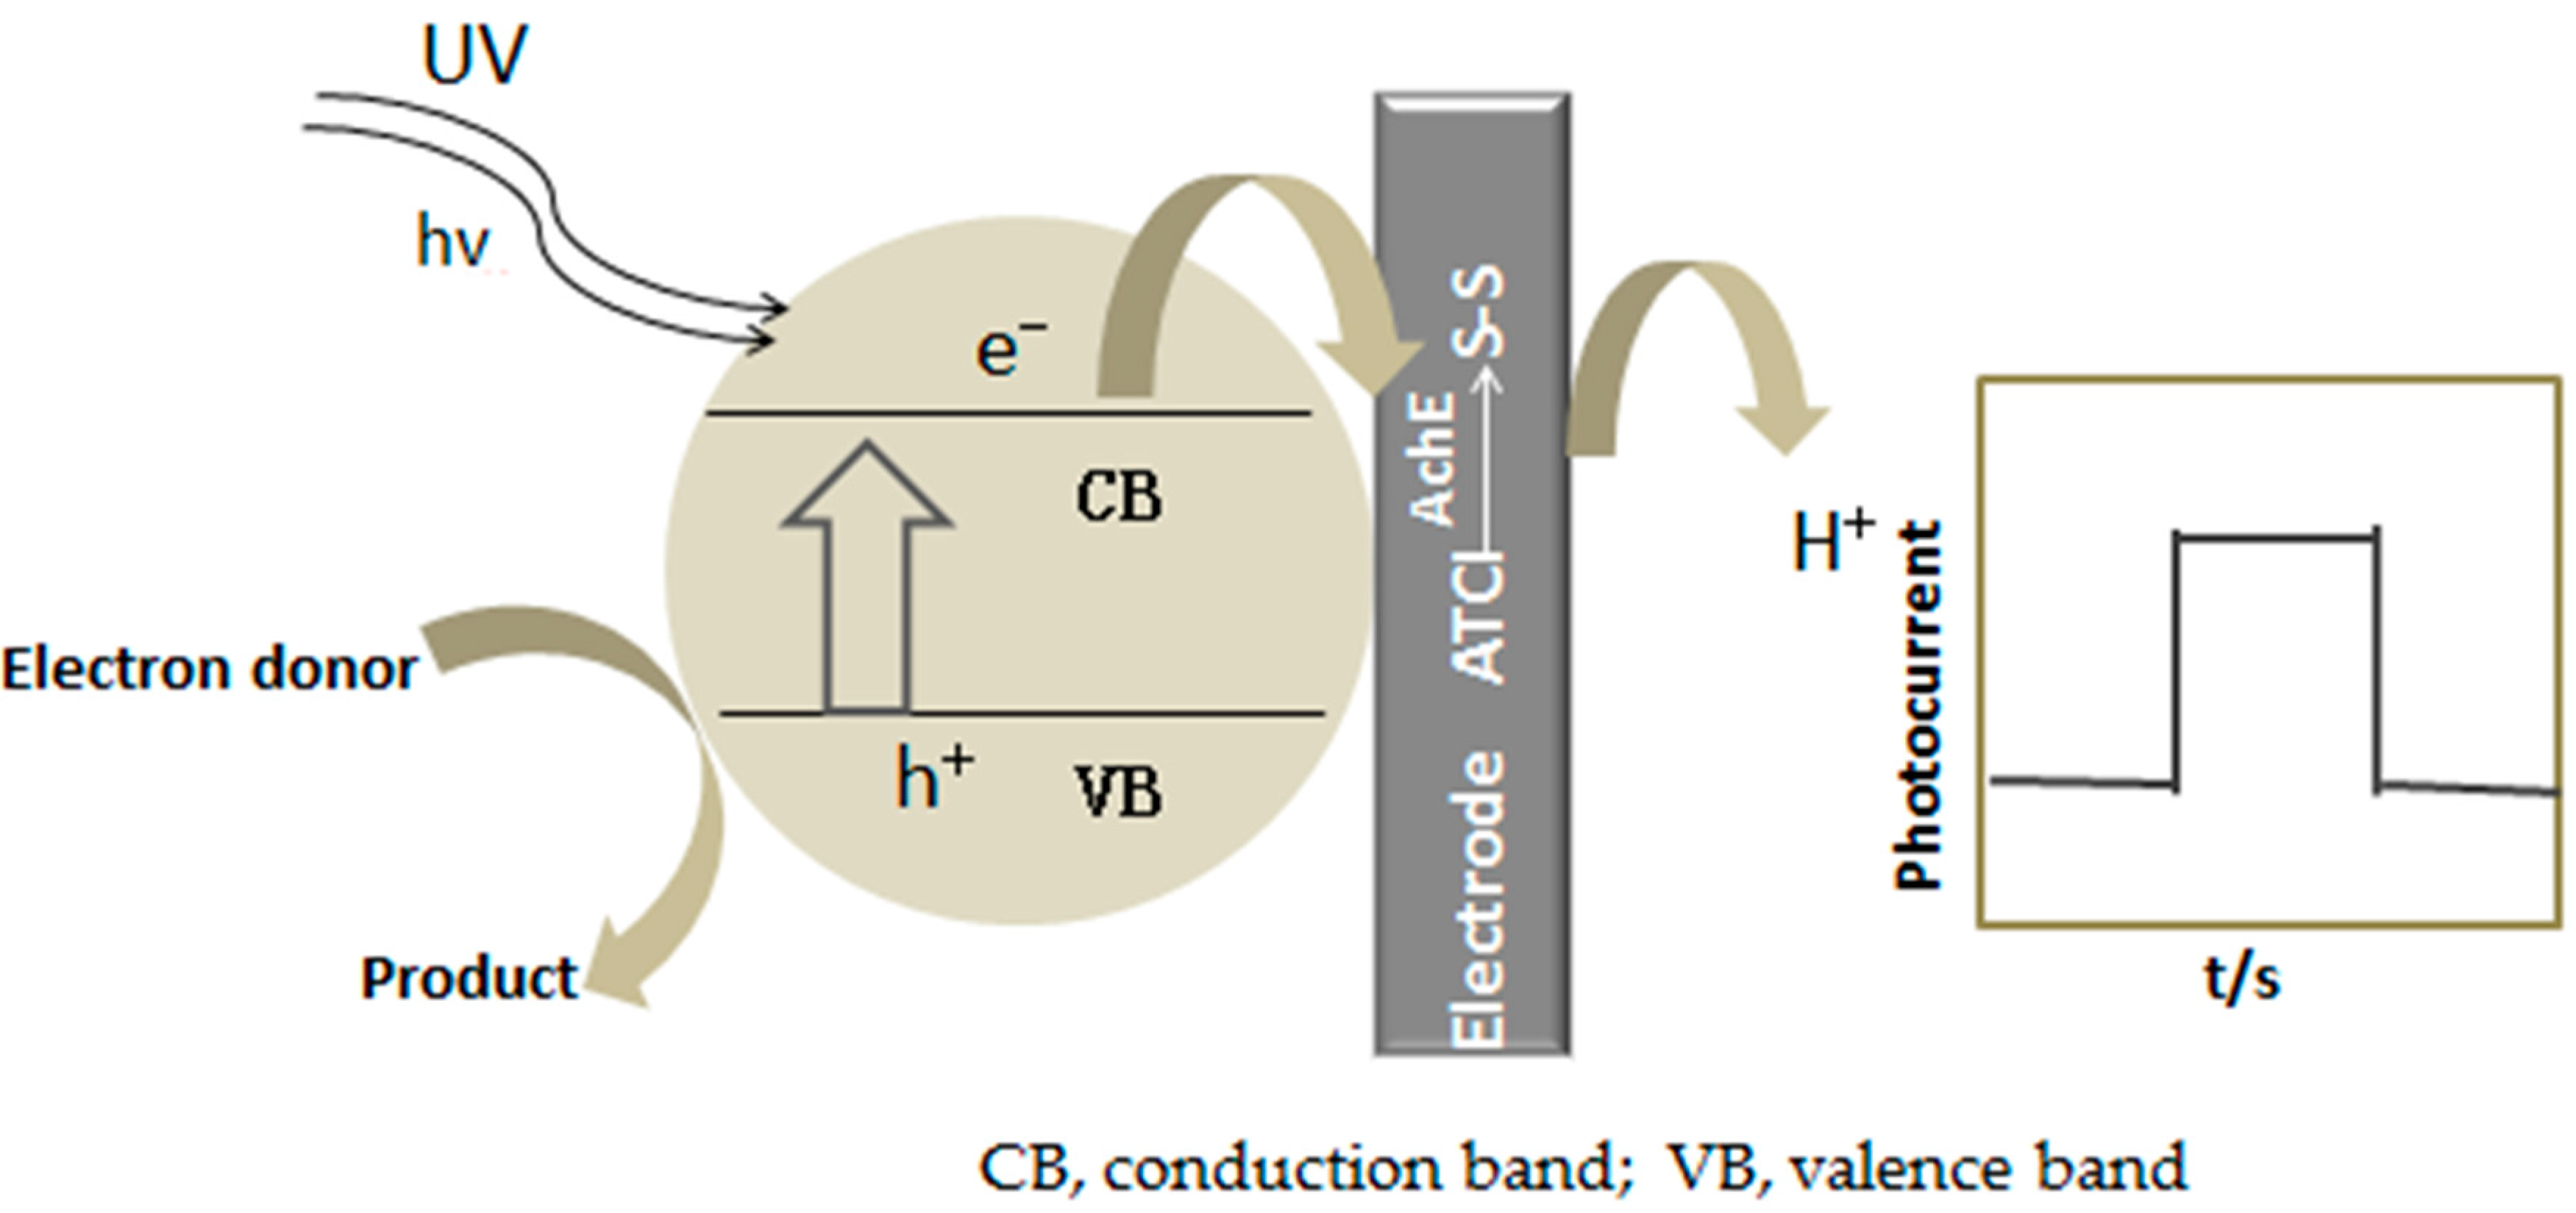
The schematic diagram of the biosensor is shown in Scheme 1. TiO2NTs form an oxidation-reduction system of electron-hole pairs under the irradiation of ultraviolet light. Acetylcholinesterase catalyzes the formation of mercapto-containing cholinechloride by ATCl. The mercapto groups are easily oxidized and the photocurrent response increases as a result of the effect of electron-hole pairs system. AFB1 has a strong inhibitory effect on acetylcholinesterase and irreversibly noncompetitive inhibition by altering the site of action of acetylcholinesterase [18,19,20,21,22]. The reaction formula is as follows:
The schematic diagram of the biosensors assembly procedure is shown in Scheme 2. Experiments were performed by placing 100 µL of different concentrations AFB1 on top of the biosensor (i.e., Au/AchE/TiO2NTs) and allowed to stand still for 5 min. The surface of the electrode was gently washed with water and then placed in 0.1 M PBS (c (ATCl) = 0.1 mM, pH = 7.4). Then, the time-current (i-t) curve was used to obtain the peak current value of different concentrations of AFB1 standard solution.
3. Results and Discussion
3.1. Characterizationn
The morphology of TiO2 nanotube array was also useful for separating and directing electrons to the collecting electrode surface, making it an ideal candidate for photocurrent response [23]. However, the large band gap of TiO2 nanotube array (3.2 eV) determined its inherent low photoelectric conversion efficiency in the visible region, limiting its further applications [24]. Hence, Au/TiO2NTs could be employed as the photoelectric transducer in this work, because doping Au has been proved to narrow the band gap and greatly sensitize to the visible light photoresponse [25,26,27]. Figure 1 shows X-ray diffraction (XRD) patterns of the samples. When comparing with pure TiO2NTs as-prepared (blue), characteristic peaks of anatase are appearing at 2θ 25.3° and 47.0° after annealing (green), deposited with AuNPs (black) and immobilized AchE (red), respectively. In addition, Au characteristic peaks could be observed at 2θ 38.20° (111), 44.40° (200), 64.50° (220), and 77.50° (311) after electrochemical deposition.
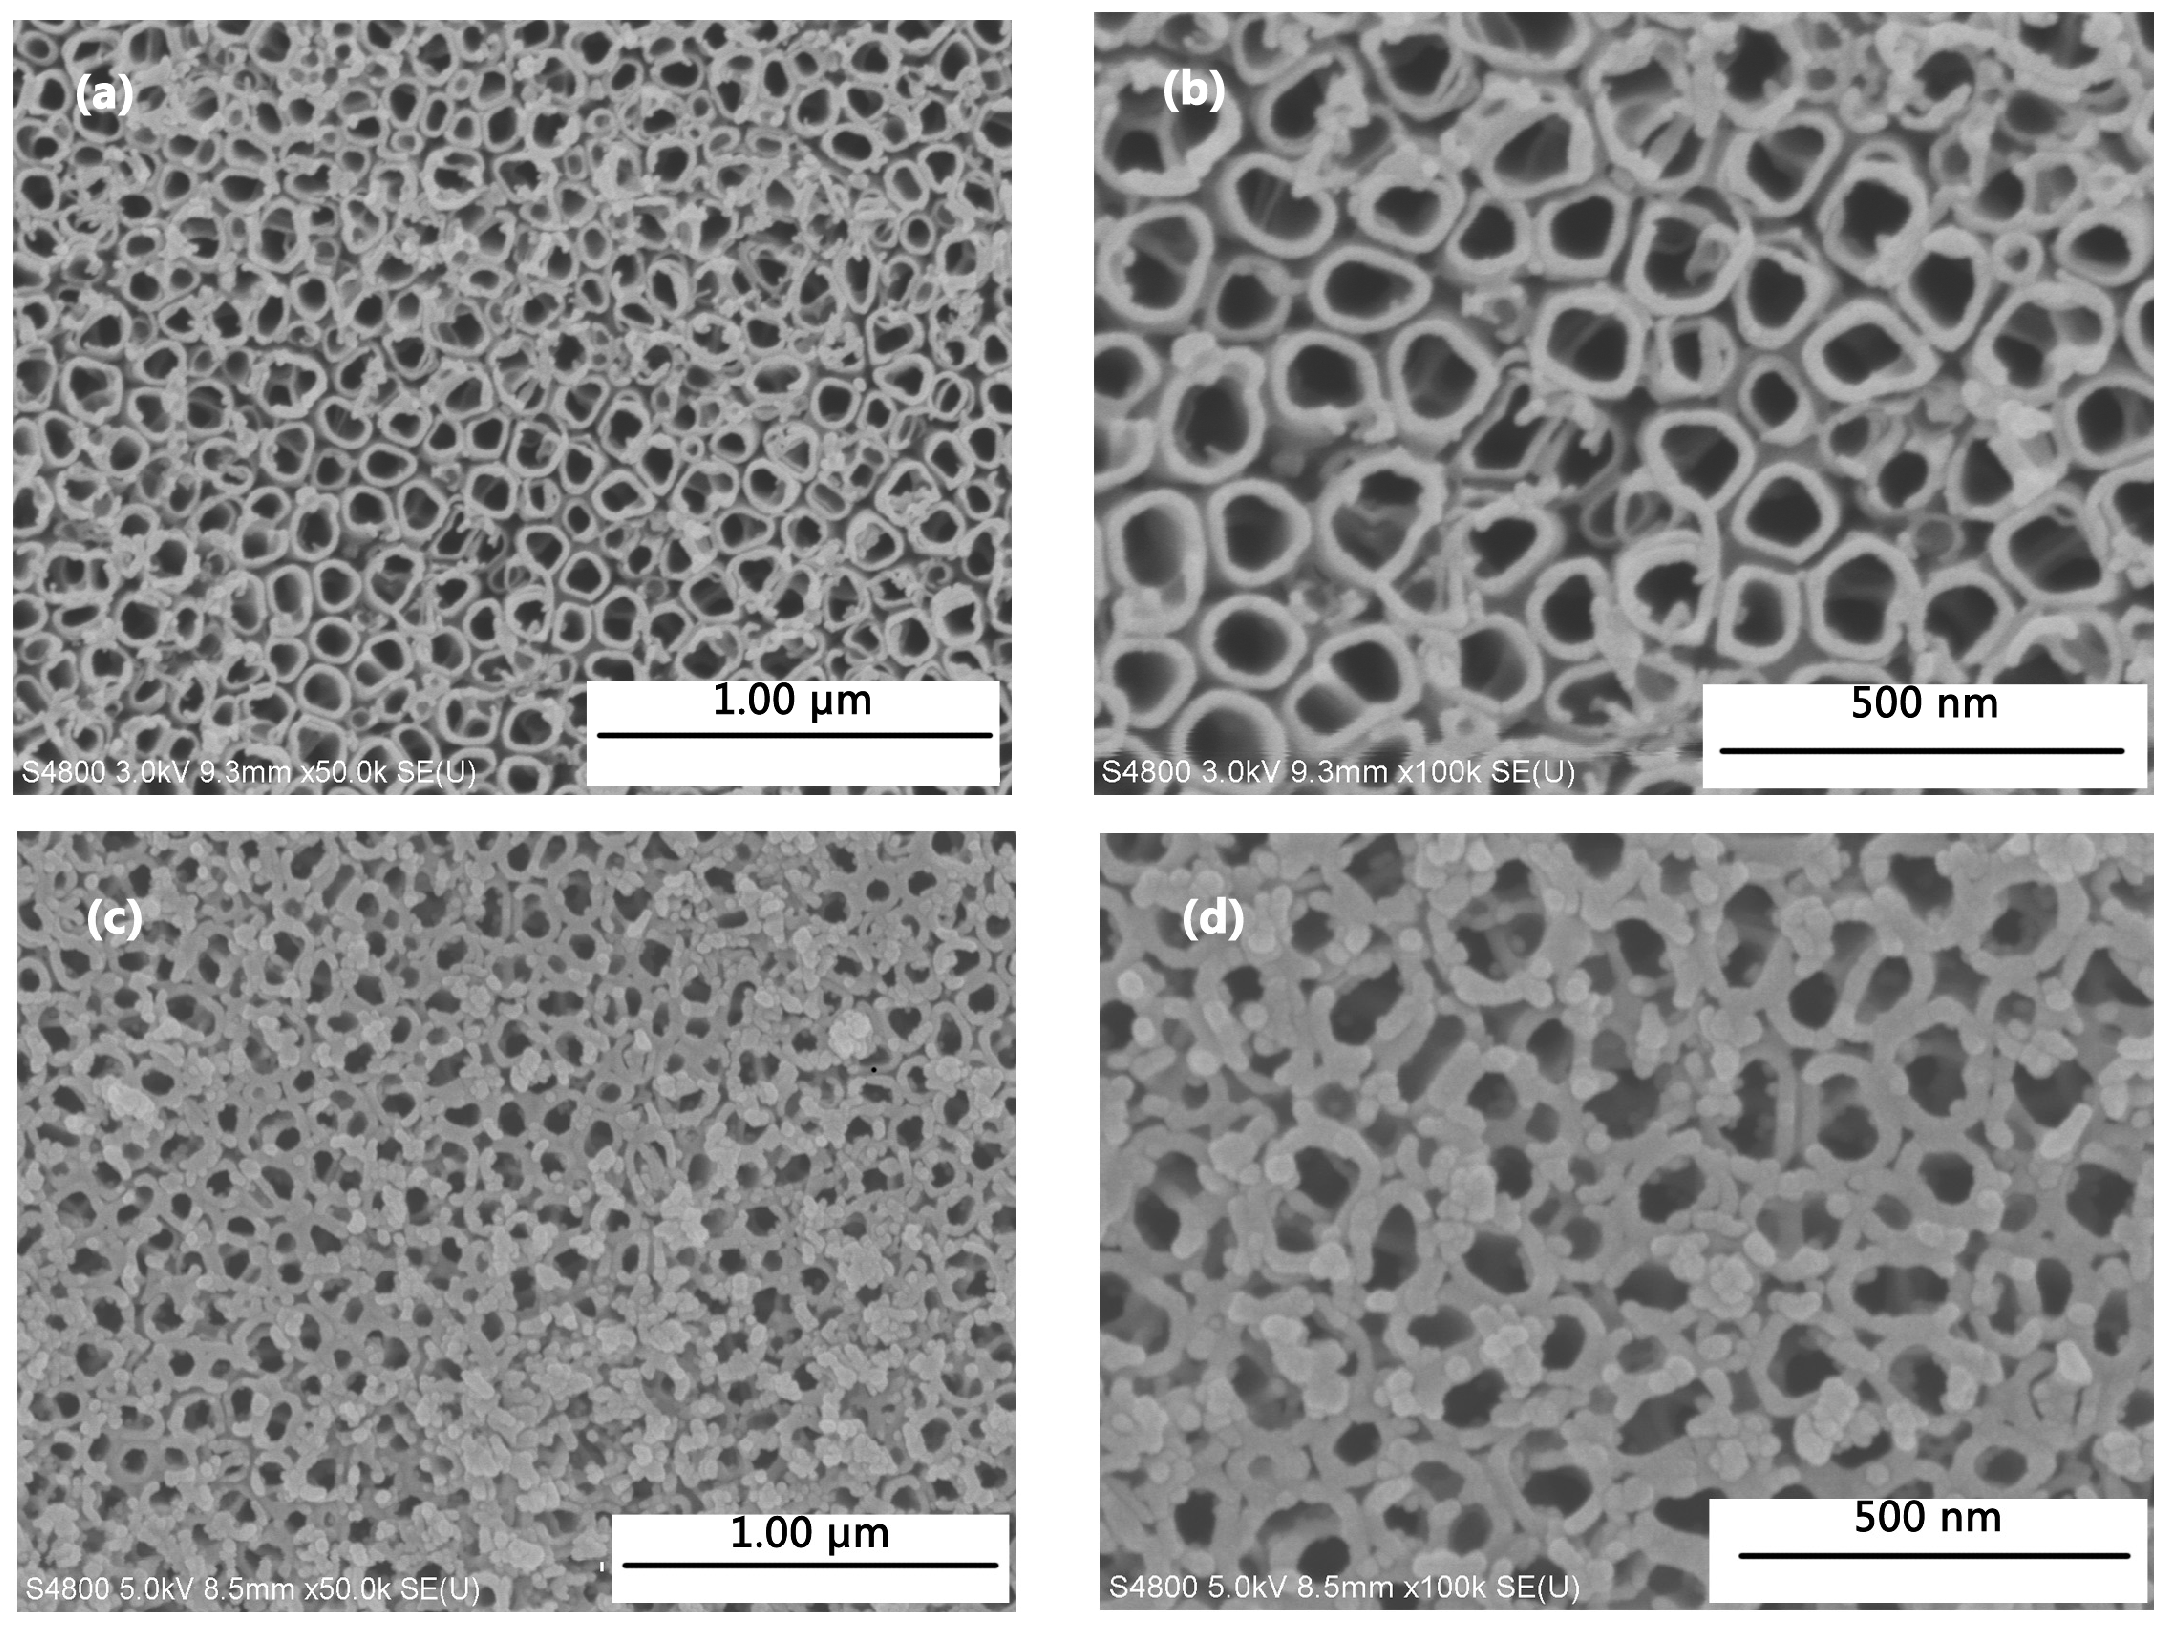
Figure 2 shows SEM images of samples. TiO2NTs after annealed are highly self-ordered porous tubular structure, and the nozzle is more regular smooth. The average pore diameter is approximately 100 nm and the average pore spacing is approximately 150 nm (Figure 2a,b). After constant potential deposition, a mass of AuNPs is observed on the surface of TiO2NTs (Figure 2c,d).
3.2. Effect of AuNPs on Photocatalytic Effect of TiO2NTs
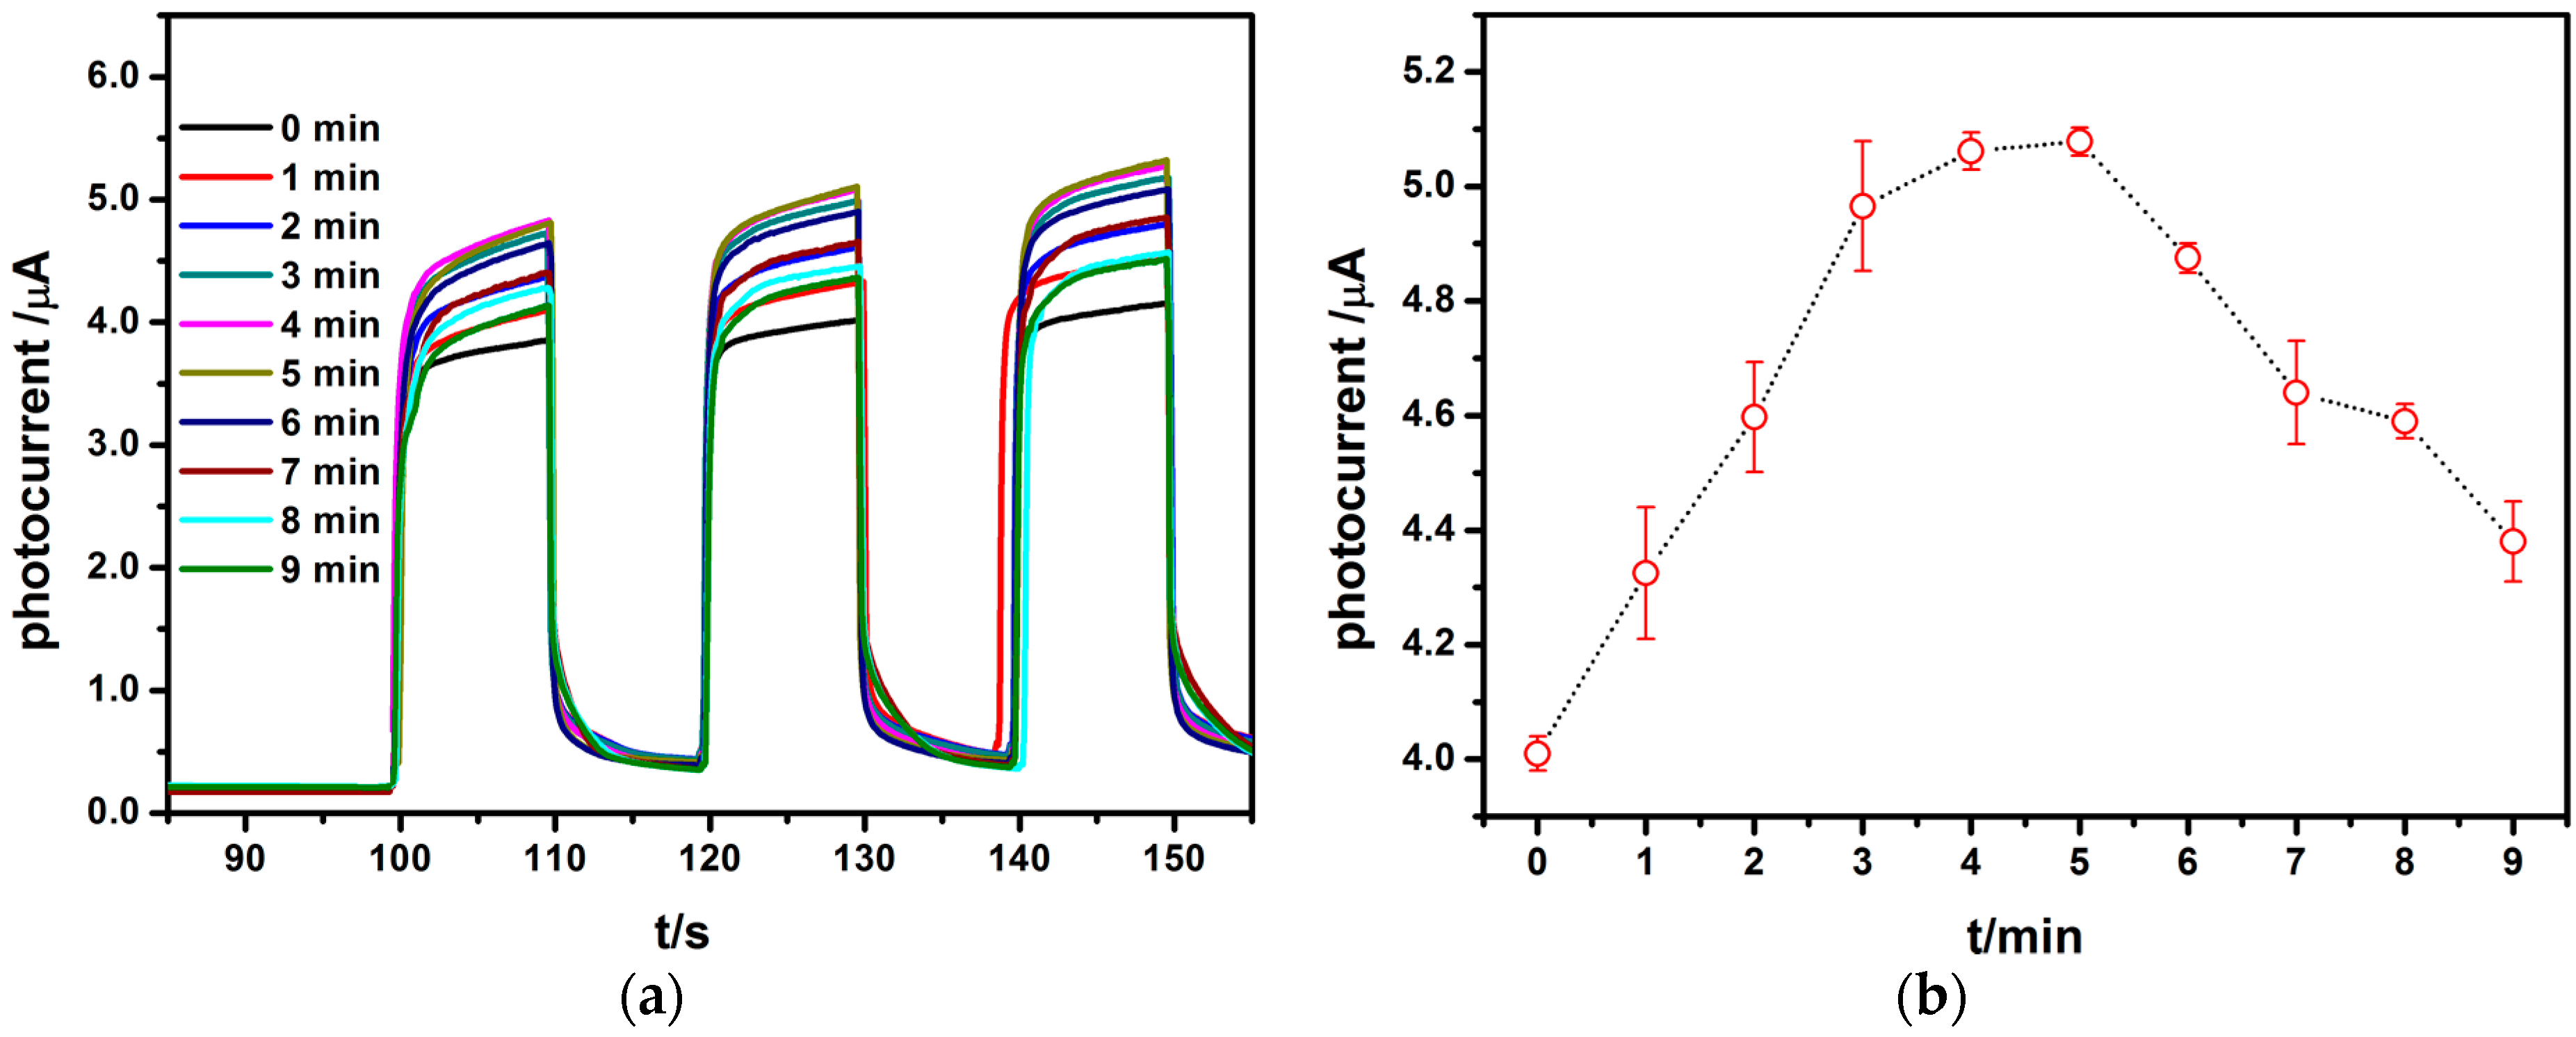
Constant potential deposition was conducted by placing the electrode (i.e., TiO2NTs) in 0.1 mM HAuCl4·4H2O (initial potential 0 V). When the energy of light is greater than the band gap of TiO2, the photoexcited electrons transit to the conduction band to form conduction band electrons, while holes leaving in the valence band. The PEC detection system is exposed to visible light. As the electrode, TiO2NTs/Auabsorbs the energy of its band gap, resulting in Au valence band photoelectrons to its conduction band excitation to form electron-hole pairs. The holes in the valence band are transferred to the surface of the Au and are captured by the electron donor. At the same time, the electron enters into the TiO2 and transfers to the external circuit through the conductive Ti foil to produce the photoelectric current. For improving the biosensors performance, electrochemical deposition time was investigated at first. Figure 3a is photocurrent responses of TiO2NTs/AuNPs after a different deposition time (0, 1, 2, 3, 4, 5, 6, 7 8, 9 min). Figure 3b presents temporal evolution of peak photocurrents of the electrode (i.e., TiO2NTs). The photocurrent increases first as deposition time increases, and then decreases slightly, and a maximum value of the photocurrent as deposited appears after 5 min. The main results are summarized as follows. First, the dopant Au is introduced into the intermediate energy level for the TiO2NTs, and its larger electronegativity leads to a lower position of its conduction band, resulting in narrowing the band gap of the TiO2NTs. Thus, it is easier for the generation and transition process of photo-generated electrons. Meanwhile, it can be associated with trapping wells of photocatalytic carriers generated by the intrinsic excitation of TiO2. The shallow trapping facilitates the diffusion process of the excited carriers in the TiO2NTs, prolongs the life of the excited carriers, greatly reduces the surface recombination of the electron hole pairs, and enhances the photocatalytic activity of the photocatalysts. However, the photocurrent increases first and then decreases with the increasing of deposition time, because that excess doping AuNPs inhibit the light absorption of TiO2 and reduce the photocatalytic activity of TiO2 [28].
3.3. Effect of Acetylcholine Concentration on Photocurrent Response of Enzyme Biosensor
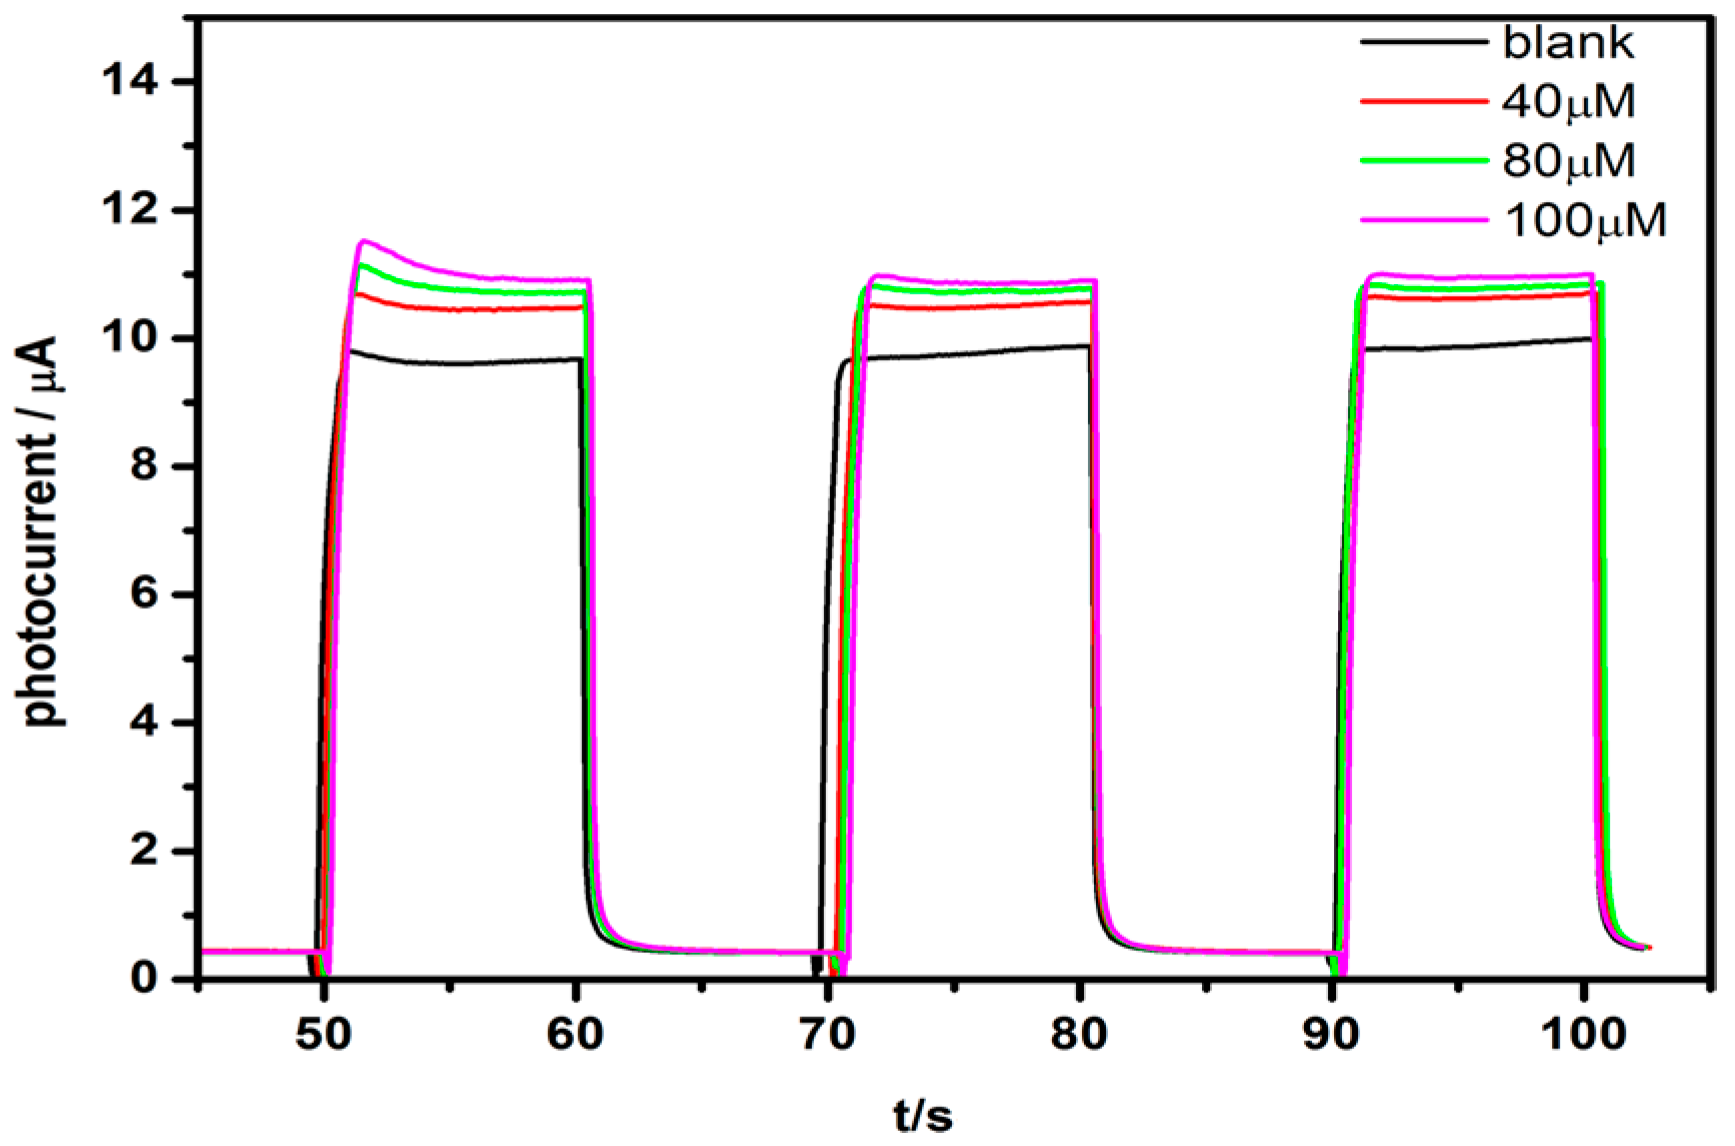
For bioinhibitory sensors, substrate concentration is one of the important influence parameters. AuNPs/AChE/TiO2NTs electrode was placed in different concentrations of ATCl (40 μM, 80 μM, 100 μM) with 0.1 mM, pH = 7.4 phosphate buffered saline (PBS) in order to investigate the effects on the response of the sensor. Embedded AchE biological activity will be affected by the solution pH. According to the literature, the optimal pH of acetylcholinesterase is closed to 7 [29,30]. As shown in Figure 4, the photocatalyses of the enzyme biosensor are found to become more obvious as the concentration of ATCl solution increased. This experimental phenomenon is ascribed to the catalytic reaction of AchE to ATCl. The mercapto that is generated by the catalytic reaction is easily oxidized by the electron-hole pair system that is produced by TiO2NTs, so that the photocurrent response increases. However, when concentration of ATCl is increased more than 80 μM, the change of photocurrent response is very slight, indicating that the catalytic reaction is approached to equilibration. Therefore, the later experiments were performed with ATCl concentrations of 0.1 mM.
3.4. Performance of the Biosensor
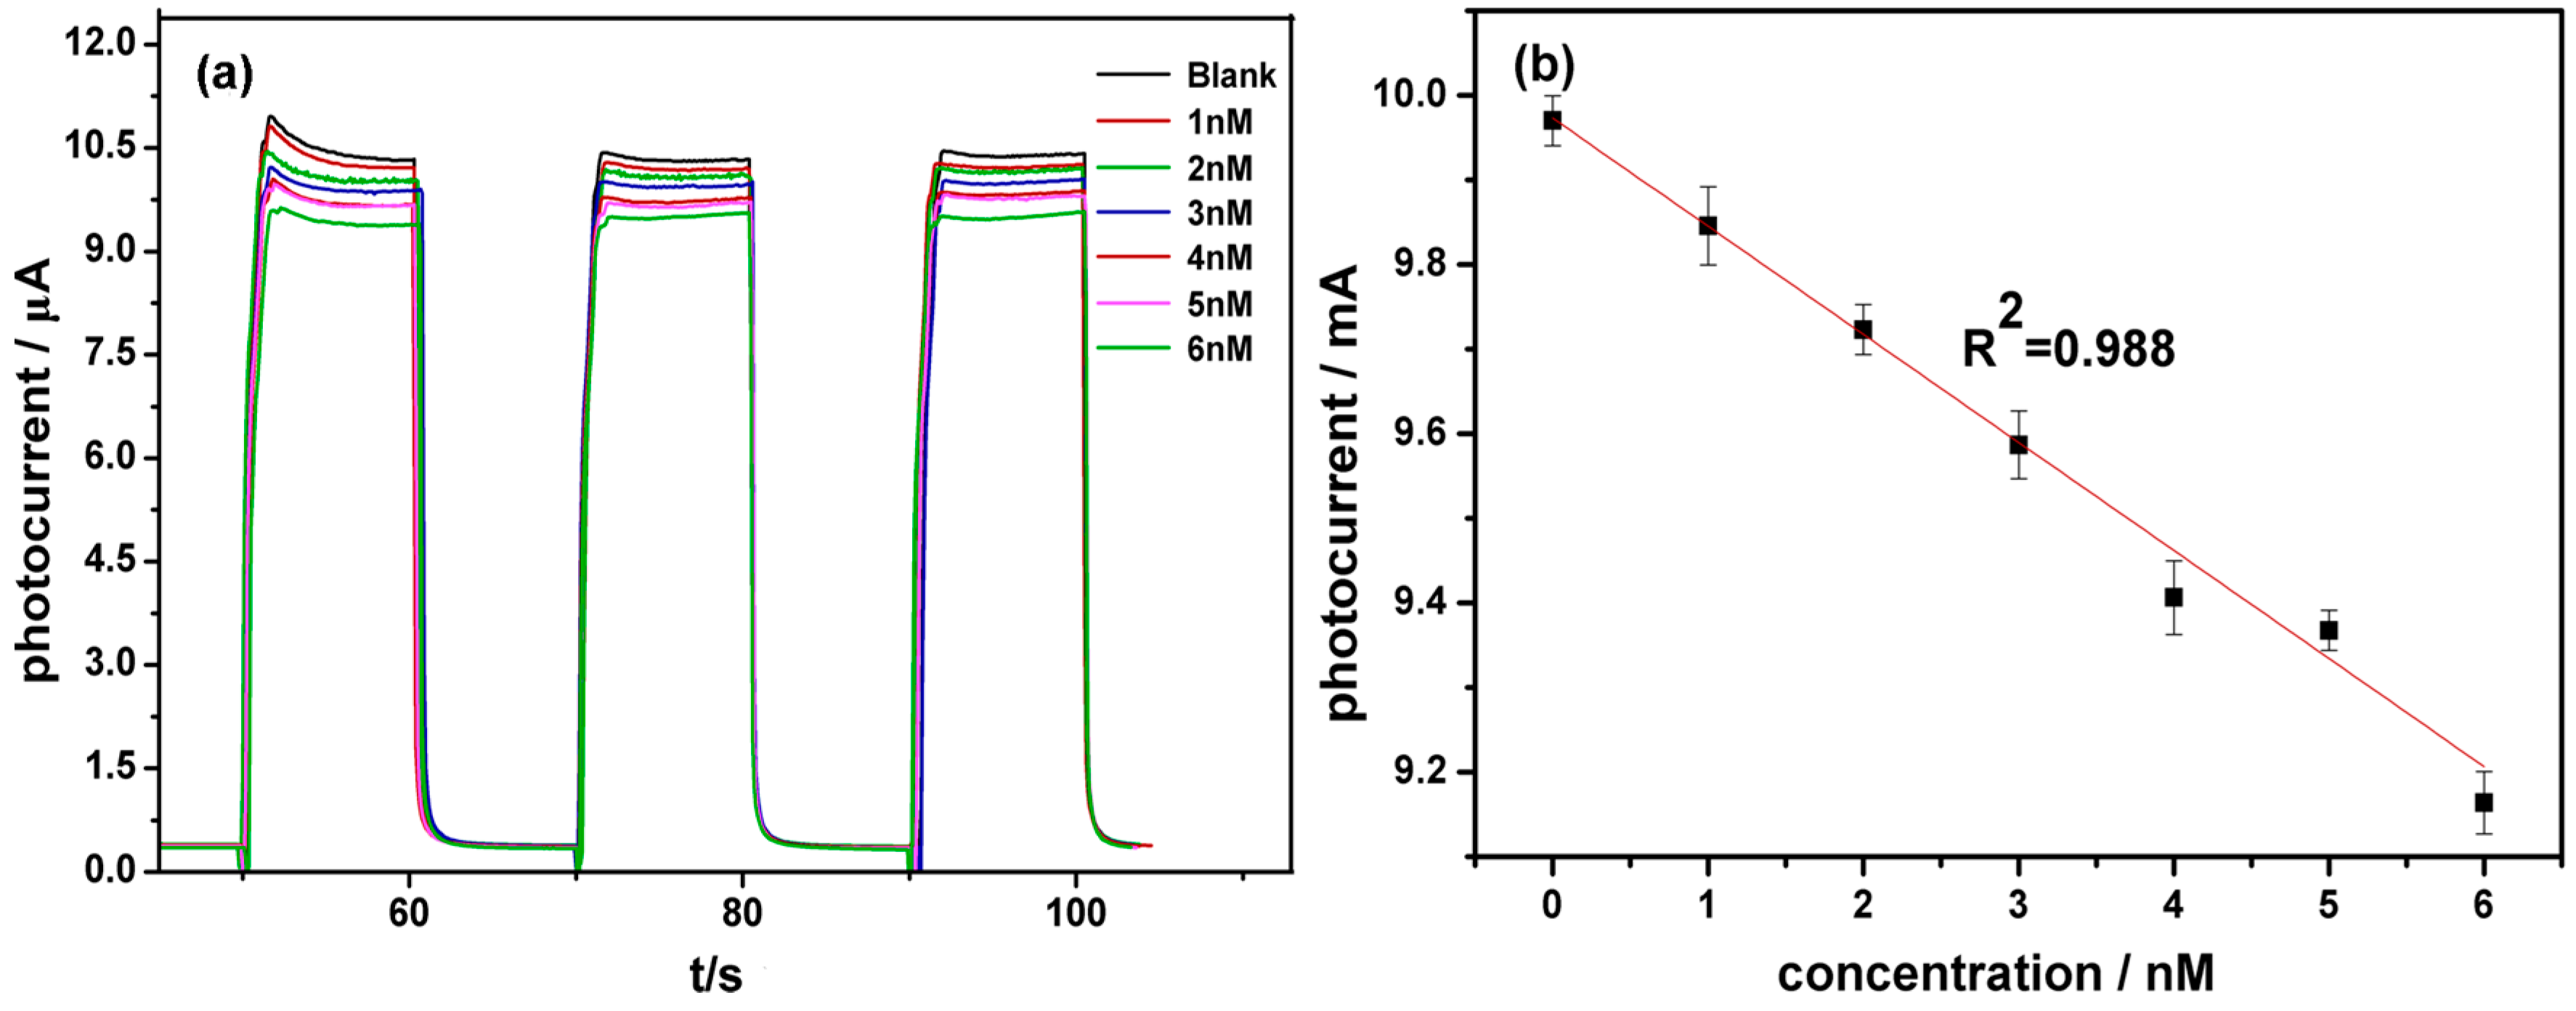
As mixed, AFB1 can inhibit AChE enzyme activity by blocking access of the substrate to the active site or by inducing a defective conformational change in the enzyme through non-covalent bonding interacting with the AChE peripheral binding site. When AFB1 is added, the activity of AchE is inhibited, thereby inhibiting the hydrolysis of ATCl and reducing the generated electroactive substance choline and acetic acid, reducing the oxidation current [31]. When comparing the change of the photocurrent of the enzymatic reaction, the concentration of AFB1 could be obtained via the inhibitory rate of AFB1 to AchE. The responses of the biosensor to AFB1 were recorded with the current-time curve as shown in Figure 5. The attenuation of the photocurrent response is dependent on AFB1 concentration. The peak current is inversely proportional to the analyte concentration, which demonstrates that AFB1 indeed inhibits the catalytic reaction of AchE by the two mechanisms described previously. The response time of the sensor is about 5 s. The time for the calculation curve is selected as the current approached steady state. For example, it is about 55, 75, or 95 s. The linear response range of the biosensor is from 1–6 nM with detection limitation of 0.33 nM, the linear equation is I (μA) = −0.13C (nM) + 9.98 (μA) with a correlation coefficient of 0.988. The results show that TiO2 nanotubes/Au nanoparticles/enzyme photoelectrochemical biosensor has a certain feasibility.
The comparison of aflatoxin B1 detection methods by several different biosensors is displayed in Table 1. The detection line of TiO2 nanotubes/Au nanoparticles/enzyme photoelectrochemical biosensor is second only to the optical biosensor based on gold nanorods (GNRs) [32,33,34,35,36,37,38,39,40,41,42,43,44,45,46]. However, TiO2 nanotubes/Au nanoparticles/enzyme photoelectrochemical biosensor do not require the purchase of expensive antibodies, so that the detection steps are simpler and less costly [43,44].
4. Conclusions
A new photoelectrochemical biosensor is developed via chemical bonding of AchE with Au NPs-modified TiO2NTs from the present work. Two steps were used to synthesize the Au/AchE/TiO2 electrode. In Step 1, immobilizing the nanogold to CS-GAD mixed film that was applied to chemical deposition using nano-gold constant potential deposition. In Step 2, AchE was modified to the electrode surface of CS-GAD mixed membrane by chemical cross-linking. It was shown that TiO2NTs electrode deposited Au nanoparticles obtained more obvious photocurrent response signal. AFB1 can inhibit the enzyme activity of AchE, leading to a decrease in photocurrent. Through the electrochemical detection, the linear response range of the biosensor is from 1–6 nM with detection limitation of 0.33 nM, which is significantly more sensitive than other methods, the linear equation is I (μA) = −0.13C (nM) + 9.98 (μA) with a correlation coefficient of 0.988. This photoelectrochemical biosensor could be applied to detect aflatoxins B1 in foods.
Acknowledgments
This work is supported by Science and Technology Planning Project of Guangdong Province (2016A020210114), Science and Technology Planning Project of Zhanjiang City (2015A03025, 2016C01002), Industrial Development Special Funds of Dapeng New Area (KY20170209), Training Programs of Innovation and Entrepreneurship for Undergraduates (201510566003, 524000087267, CXXL2015003, CXXL2015087, CXXL2015088, CXXL2015089).
Author Contributions
Chengyong Li proposed the research topic and revised the paper; Qiong Yuan designed the experiments and wrote the paper, Chuxian He, Rijian Mo and Lei He performed the experiments; Chunxia Zhou measured XRD patterns; Pengzhi Hong observed SEM images; Shengli Sun analyzed the data.
Conflicts of Interest
The authors declare no conflict of interest.
References
- Shyu, R.H.; Shyu, H.F.; Liu, H.W.; Tang, S.S. Colloidal gold-based immunochromatographic assay for detection of ricin. Toxicon 2002, 40, 255–258. [Google Scholar] [CrossRef]
- Egner, P.A.; Wang, J.B.; Zhu, Y.R.; Zhang, B.C.; Wu, Y.; Zhang, Q.N.; Qian, G.S.; Kuang, S.Y.; Gange, S.J.; Jacobson, L.P. Chlorophyllin intervention reduces aflatoxin-DNA adducts in individuals at high risk for liver cancer. Proc. Natl. Acad. Sci. USA 2001, 98, 14601–14606. [Google Scholar] [CrossRef] [PubMed]
- Ren, Y.; Zhang, Y.; Shao, S.; Cai, Z.; Feng, L.; Pan, H.; Wang, Z. Simultaneous determination of multi-component mycotoxin contaminants in foods and feeds by ultra-performance liquid chromatography tandem mass spectrometry. J. Chromatogr. A 2007, 1143, 48–64. [Google Scholar] [CrossRef] [PubMed]
- Amirkhizi, B.; Arefhosseini, S.R.; Ansarin, M.; Nemati, M. Aflatoxin B1 in eggs and chicken livers by dispersive liquid-liquid microextraction and HPLC. Food Addit. Contam. Part B 2015, 8, 245–249. [Google Scholar]
- Wacoo, A.P.; Wendiro, D.; Vuzi, P.C.; Hawumba, J.F. Methods for detection of aflatoxins in agricultural food crops. J. Appl. Chem. 2014, 2014, 706291. [Google Scholar] [CrossRef]
- Wang, P.; Dai, W.; Ge, L.; Yan, M.; Ge, S.; Yu, J. Visible light photoelectrochemical sensor based on Au nanoparticles and molecularly imprinted poly(o-phenylenediamine)-modified TiO2 nanotubes for specific and sensitive detection chlorpyrifos. Analyst 2013, 138, 939–945. [Google Scholar] [CrossRef] [PubMed]
- Li, X.; Zheng, Z.; Liu, X.; Zhao, S.; Liu, S. Nanostructured photoelectrochemical biosensor for highly sensitive detection of organophosphorous pesticides. Biosens. Bioelectron. 2015, 64, 1–5. [Google Scholar] [CrossRef] [PubMed]
- Li, H.; Li, J.; Xu, Q.; Yang, Z.; Hu, X. A derivative photoelectrochemical sensing platform for 4-nitrophenolate contained organophosphates pesticide based on carboxylated perylene sensitized nano-TiO2. Anal. Chim. Acta 2013, 766, 47–52. [Google Scholar] [CrossRef] [PubMed]
- Xu, M.; Da, P.; Wu, H.; Zhao, D.; Zheng, G. Controlled Sn-doping in TiO2 nanowire photoanodes with enhanced photoelectrochemical conversion. Nano Lett. 2012, 12, 1503–1508. [Google Scholar] [CrossRef] [PubMed]
- Liu, C.; Dasgupta, N.P.; Yang, P. Cheminform abstract: Semiconductor nanowires for artificial photosynthesis. Cheminform 2014, 45, 415–422. [Google Scholar] [CrossRef]
- Liu, B.; Chen, H.M.; Liu, C.; Andrews, S.C.; Hahn, C.; Yang, P. Large-scale synthesis of transition-metal-doped TiO2 nanowires with controllable overpotential. J. Amer. Chem. Soc. 2013, 135, 9995–9998. [Google Scholar] [CrossRef] [PubMed]
- Liu, B.; Liu, L.M.; Lang, X.F.; Wang, H.Y.; Lou, X.W.; Aydil, E.S. Doping high-surface-area mesoporous TiO2 microspheres with carbonate for visible light hydrogen production. Energy Environ. Sci. 2014, 7, 2592–2597. [Google Scholar] [CrossRef]
- Bian, Z.; Tachikawa, T.; Zhang, P.; Fujitsuka, M.; Majima, T. Au/TiO2 superstructure-based plasmonic photocatalysts exhibiting efficient charge separation and unprecedented activity. J. Amer. Chem. Soc. 2014, 136, 458–565. [Google Scholar] [CrossRef] [PubMed]
- Xiao, F.X.; Miao, J.; Liu, B. Self-assembly of aligned rutile@anatase TiO2 nanorod@CdS quantum dots ternary core-shell heterostructure: Cascade electron transfer by interfacial design. Mater. Horiz. 2014, 1, 259–263. [Google Scholar] [CrossRef]
- Ni, M.; Leung, M.K.H.; Leung, D.Y.C.; Sumathy, K. A review and recent developments in photocatalytic water-splitting using TiO2 for hydrogen production. Renew. Sustain. Energy Rev. 2007, 11, 401–425. [Google Scholar] [CrossRef]
- Kaur, R.; Pal, B. Size and shape dependent attachments of Au nanostructures to TiO2 for optimum reactivity of Au–TiO2 photocatalysis. J. Mol. Catal. A 2012, 355, 39–43. [Google Scholar] [CrossRef]
- Macak, J.M.; Tsuchiya, H.; Ghicov, A.; Yasuda, K.; Hahn, R.; Bauer, S.; Schmuki, P. TiO2 nanotubes: Self-organized electrochemical formation, properties and applications. Curr. Opin. Solid State Mater. Sci. 2007, 11, 3–18. [Google Scholar] [CrossRef]
- Huang, Q.; Chen, H.; Xu, L.; Lu, D.; Tang, L.; Jin, L.; Xu, Z.; Zhang, W. Visible-light-activated photoelectrochemical biosensor for the study of acetylcholinesterase inhibition induced by endogenous neurotoxins. Biosens. Bioelectron. 2013, 45, 292–299. [Google Scholar] [CrossRef] [PubMed]
- Pohanka, M. Spectrophotomeric assay of aflatoxin B1 using acetylcholinesterase immobilized on standard microplates. Anal. Lett. 2013, 46, 1306–1315. [Google Scholar] [CrossRef]
- Pohanka, M.; Kuca, K.; Jun, D. Aflatoxin assay using an amperometric sensor strip and acetylcholinesterase as recognition element. Sens. Lett. 2008, 6, 450–453. [Google Scholar] [CrossRef]
- Rejeb, I.B.; Arduini, F.; Arvinte, A.; Amine, A.; Gargouri, M.; Micheli, L.; Bala, C.; Moscone, D.; Palleschi, G. Development of a bio-electrochemical assay for aflatoxin B1 detection in olive oil. Biosens. Bioelectron. 2009, 24, 1962–1968. [Google Scholar] [CrossRef] [PubMed]
- Soldatkin, O.O.; Burdak, O.S.; Sergeyeva, T.A.; Arkhypova, V.M.; Dzyadevych, S.V.; Soldatkin, A.P. Acetylcholinesterase-based conductometric biosensor for determination of aflatoxin B1. Sens. Actuators B 2013, 188, 999–1003. [Google Scholar] [CrossRef]
- Baker, D.R.; Kamat, P.V. Photosensitization of TiO2 nanostructures with CdS quantum dots: Particulate versus tubular support architectures. Adv. Funct. Mater. 2009, 19, 805–811. [Google Scholar] [CrossRef]
- Li, G.; Wu, L.; Li, F.; Xu, P.; Zhang, D.; Li, H. Photoelectrocatalytic degradation of organic pollutants via a CdS quantum dots enhanced TiO2 nanotube array electrode under visible light irradiation. Nanoscale 2013, 5, 2118–2125. [Google Scholar] [CrossRef] [PubMed]
- He, L.L.; Oybek, T.; Abidov, A.; Song, J.J.; Jeong, S.W.; Kim, S.Y.; Kim, T.Y. Study of formation and investigation of properties of metal doped titanium dioxide nanotube arrays synthesized by anodizing method. Afore 2012, 11, 466. [Google Scholar]
- Shibu, E.S.; Kimura, K.; Pradeep, T. Gold nanoparticle superlattices: Novel surface enhanced Raman scattering active substrates. Chem. Mater. 2009, 21, 3773–3781. [Google Scholar] [CrossRef]
- Mori, T.; Sharma, A.; Hegmann, T. Significant enhancement of the chiral correlation length in nematic liquid crystals by gold nanoparticle surfaces featuring axially chiral binaphthyl ligands. ACS Nano 2016, 10, 1552–1564. [Google Scholar] [CrossRef] [PubMed]
- Lu, H.F.; Zhou, Y.; Xu, B.Q.; Chen, Y.F.; Liu, H.Z. Effect of gold doping on the photocatalytic activity of the anatase TiO2. Acta Phys. Chim. Sin. 2008, 24, 459–464. [Google Scholar]
- Silman, H.I.; Karlin, A. Effect of local pH changes caused by substrate hydrolysis on the activity of membrane-bound acetylcholinesterase. Proc. Natl. Acad. Sci. USA 1967, 58, 1664–1668. [Google Scholar] [CrossRef] [PubMed]
- Grafius, M.A.; Millar, D.B. Reversible aggregation of acetylcholinesterase. Ii. Interdependencee of pH and ionic strength. Biochemistry 1967, 6, 1034–1046. [Google Scholar] [CrossRef] [PubMed]
- Cometa, M.F.; Lorenzini, P.S.; Volpe, M.T.; Meneguz, A.; Palmery, M. In vitro inhibitory effect of aflatoxin B1 on acetylcholinesterase activity in mouse brain. Toxicology 2005, 206, 125–135. [Google Scholar] [CrossRef] [PubMed]
- Li, S.C.; Chen, J.H.; Cao, H.; Yao, D.S.; Liu, D.L. Amperometric biosensor for aflatoxin B1 based on aflatoxin-oxidase immobilized on multiwalled carbon nanotubes. Food Control 2011, 22, 43–49. [Google Scholar] [CrossRef]
- Ordóñez, L.C.; Escobar, B.; Barbosa, R.; Verde-Gómez, Y. Enhanced performance of direct ethanol fuel cell using pt/mwcnts as anodic electrocatalyst. J. Appl. Electrochem. 2015, 45, 1205–1210. [Google Scholar] [CrossRef]
- Kim, S.K.; Kim, D.; You, J.M.; Han, H.S.; Jeon, S. Non-enzymatic superoxide anion radical sensor based on pt nanoparticles covalently bonded to thiolated MWCNTs. Electrochim. Acta 2012, 81, 31–36. [Google Scholar] [CrossRef]
- Hansmann, T.; Sanson, B.; Stojan, J.; Weik, M.; Marty, J.L.; Fournier, D. Kinetic insight into the mechanism of cholinesterasterase inhibition by aflatoxin B1 to develop biosensors. Biosens. Bioelectron. 2009, 24, 2119–2124. [Google Scholar] [CrossRef] [PubMed]
- de Albuquerque, Y.D.T.; Ferreira, L.F. Amperometric biosensing of carbamate and organophosphate pesticides utilizing screen-printed tyrosinase-modified electrodes. Anal. Chim. Acta 2007, 596, 210–221. [Google Scholar] [CrossRef] [PubMed]
- Darain, F.; Park, S.U.; Shim, Y.B. Disposable amperometric immunosensor system for rabbit igg using a conducting polymer modified screen-printed electrode. Biosens. Bioelectron. 2003, 18, 773–780. [Google Scholar] [CrossRef]
- Stepurska, K.V.; Soldatkin, C.O.; Kucherenko, I.S.; Arkhypova, V.M.; Dzyadevych, S.V.; Soldatkin, A.P. Feasibility of application of conductometric biosensor based on acetylcholinesterase for the inhibitory analysis of toxic compounds of different nature. Anal. Chim. Acta 2015, 854, 161–168. [Google Scholar] [CrossRef] [PubMed]
- Kirdeciler, S.K.; Soy, E.; Oztürk, S.; Kucherenko, I.; Soldatkin, O.; Dzyadevych, S.; Akata, B. A novel urea conductometric biosensor based on zeolite immobilized urease. Talanta 2011, 85, 1435–1441. [Google Scholar] [CrossRef] [PubMed]
- Lee, I.; Luo, X.; Huang, J.; Cui, X.T.; Yun, M. Detection of cardiac biomarkers using single polyaniline nanowire-based conductometric biosensors. Biosensors 2012, 2, 205–220. [Google Scholar] [CrossRef] [PubMed]
- Guedri, H.; Durrieu, C. A self-assembled monolayers based conductometric algal whole cell biosensor for water monitoring. Microchim. Acta 2008, 163, 179–184. [Google Scholar] [CrossRef]
- Moffatt, P.; Smith, C.E.; St-Arnaud, R.; Nanci, A. Evaluation of aflatoxin B1-acetylcholinesterase dissociation kinetic using the amperometric biosensor technology: Prospect for toxicity mechanism. Protein Pept. Lett. 2010, 17, 340–342. [Google Scholar]
- Xu, X.; Ying, Y.; Li, Y. A simple, competitive biosensor for rapid detection of aflatoxin B1 based on aggregation of gold nanorods. In Proceedings of the 2012 IEEE Sensors, Taipei, Taiwan, 28–31 October 2012; pp. 1–4. [Google Scholar]
- Xu, X.; Liu, X.; Li, Y.; Ying, Y. A simple and rapid optical biosensor for detection of aflatoxin B1 based on competitive dispersion of gold nanorods. Biosens. Bioelectron. 2013, 47, 361–367. [Google Scholar] [CrossRef] [PubMed]
- Sapsford, K.E.; Taitt, C.R.; Fertig, S.; Moore, M.H.; Lassman, M.E.; Maragos, C.M.; Shriverlake, L.C. Indirect competitive immunoassay for detection of aflatoxin B1 in corn and nut products using the array biosensor. Biosens. Bioelectron. 2006, 21, 2298–2305. [Google Scholar] [CrossRef] [PubMed]
- Okwu, G.I.; Achar, P.N.; Sharma, S.K. Quantification of aflatoxin B1 in ready-to-use food thickeners in south-east geo-political zone in nigeria. Afr. J. Microbiol. Res. 2010, 4, 1788–1793. [Google Scholar]
Scheme 1.
The schematic diagram of the biosensor photoelectrochemical process.

Scheme 2.
The schematic diagram of the biosensors assembly procedure.
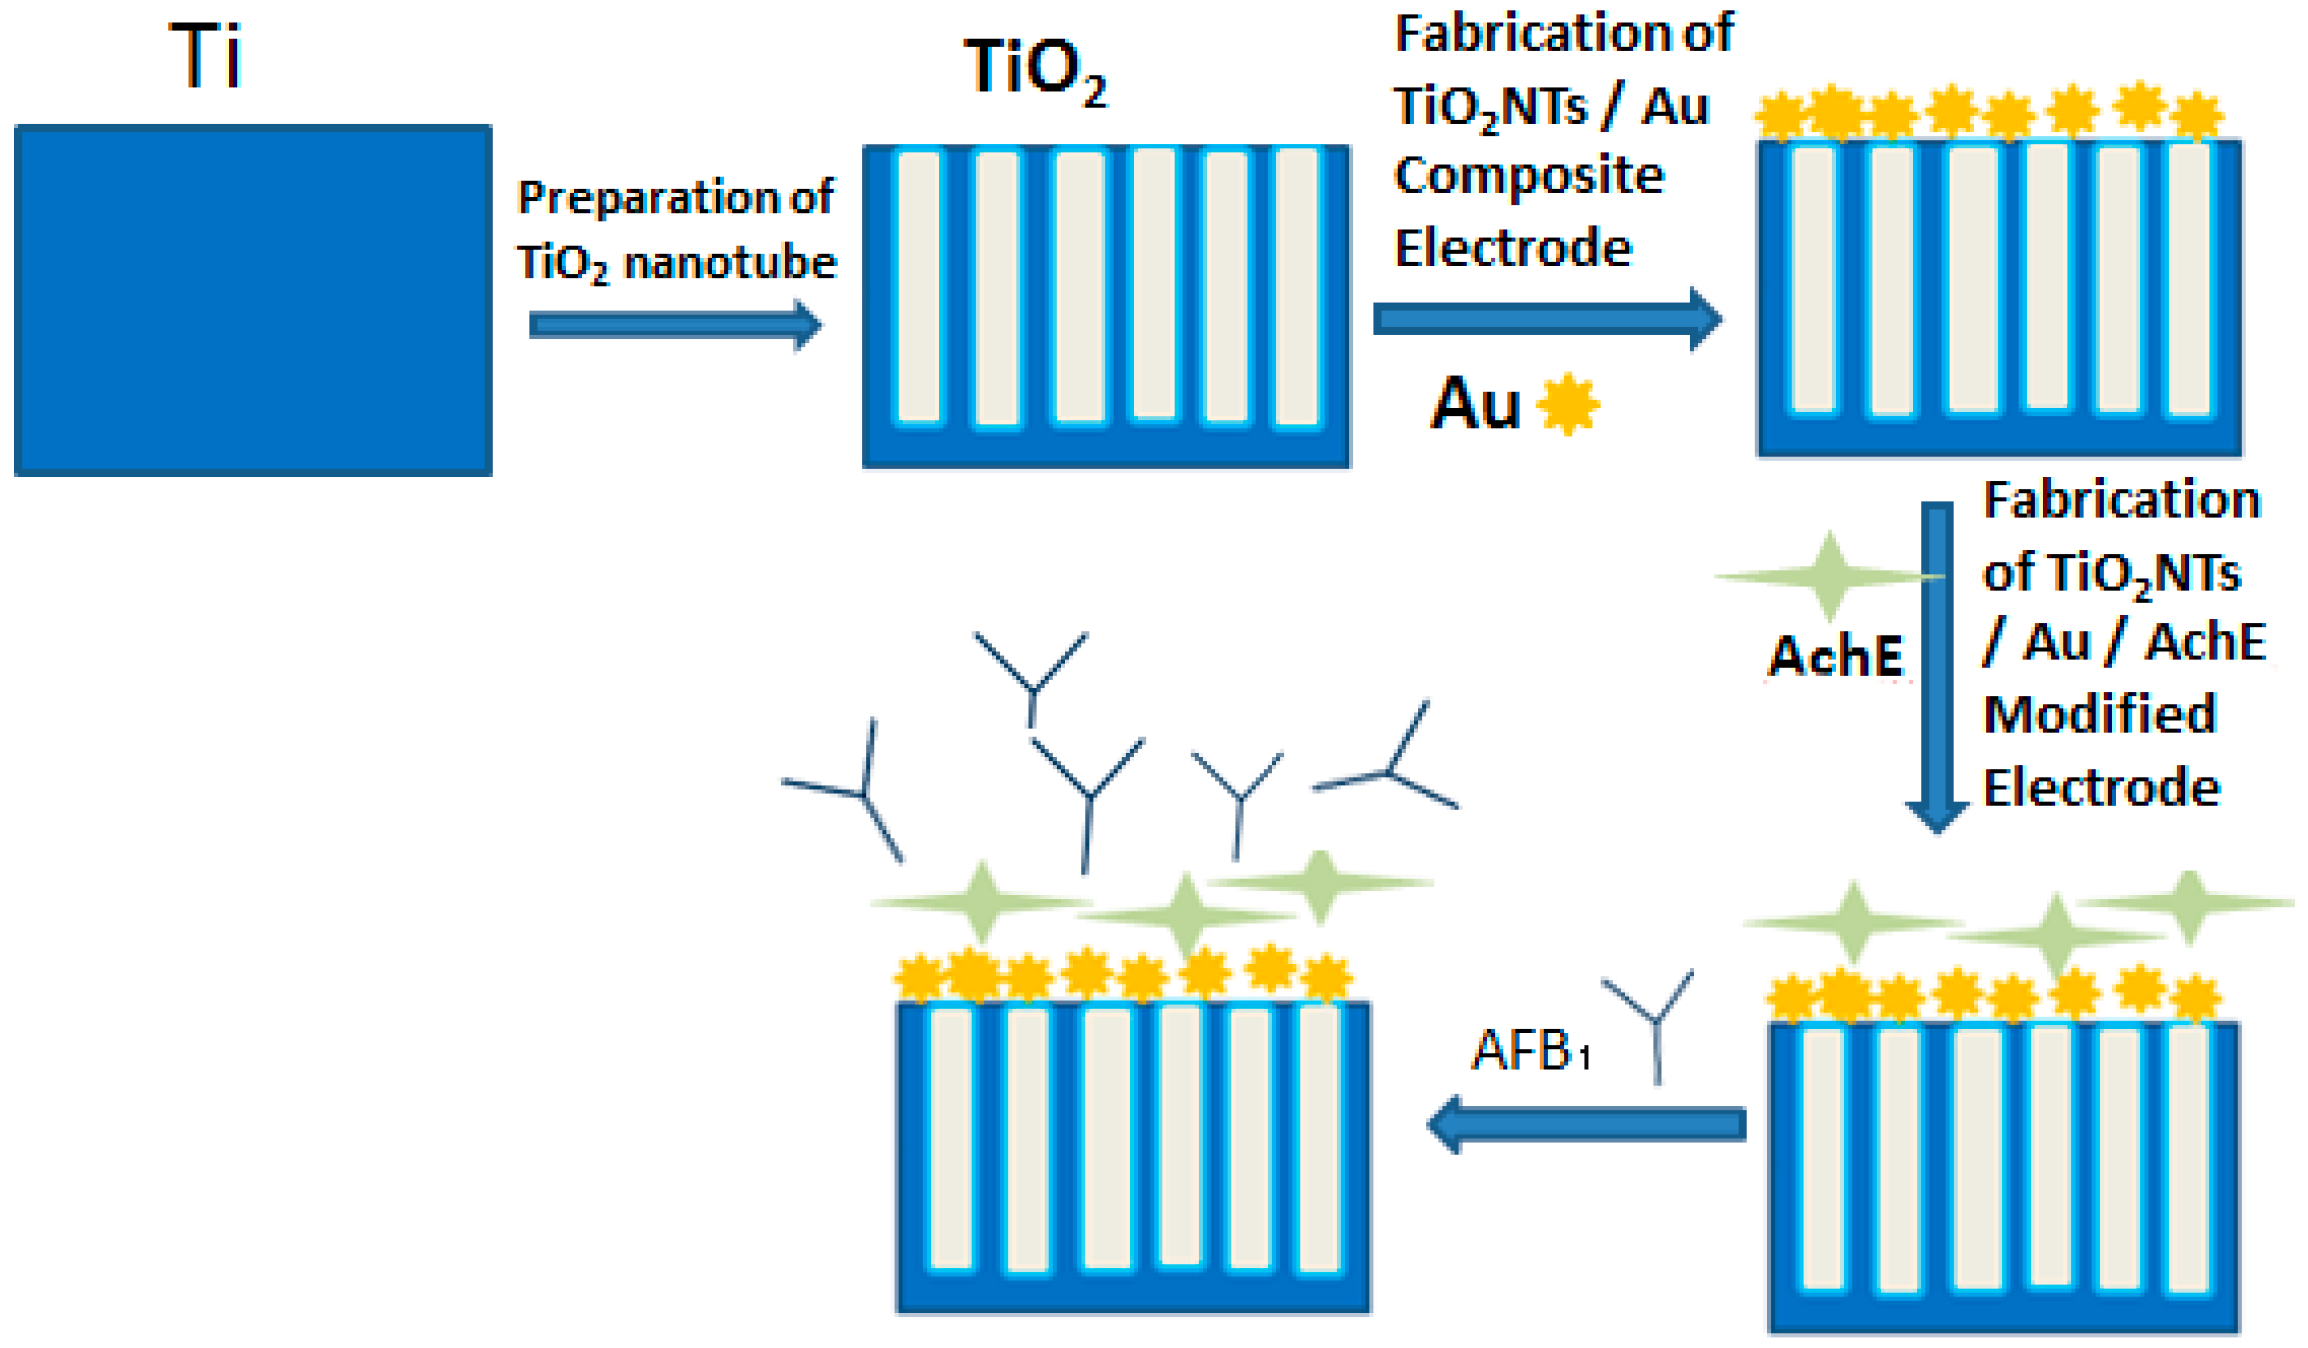
Figure 1.
X-ray Diffraction (XRD) patterns of samples including anodized TiO2 nanotube arrays (TiO2NTs), TiO2NTs annealed under 500 °C, deposited AuNPs and immobilized with AchE.
Figure 1.
X-ray Diffraction (XRD) patterns of samples including anodized TiO2 nanotube arrays (TiO2NTs), TiO2NTs annealed under 500 °C, deposited AuNPs and immobilized with AchE.
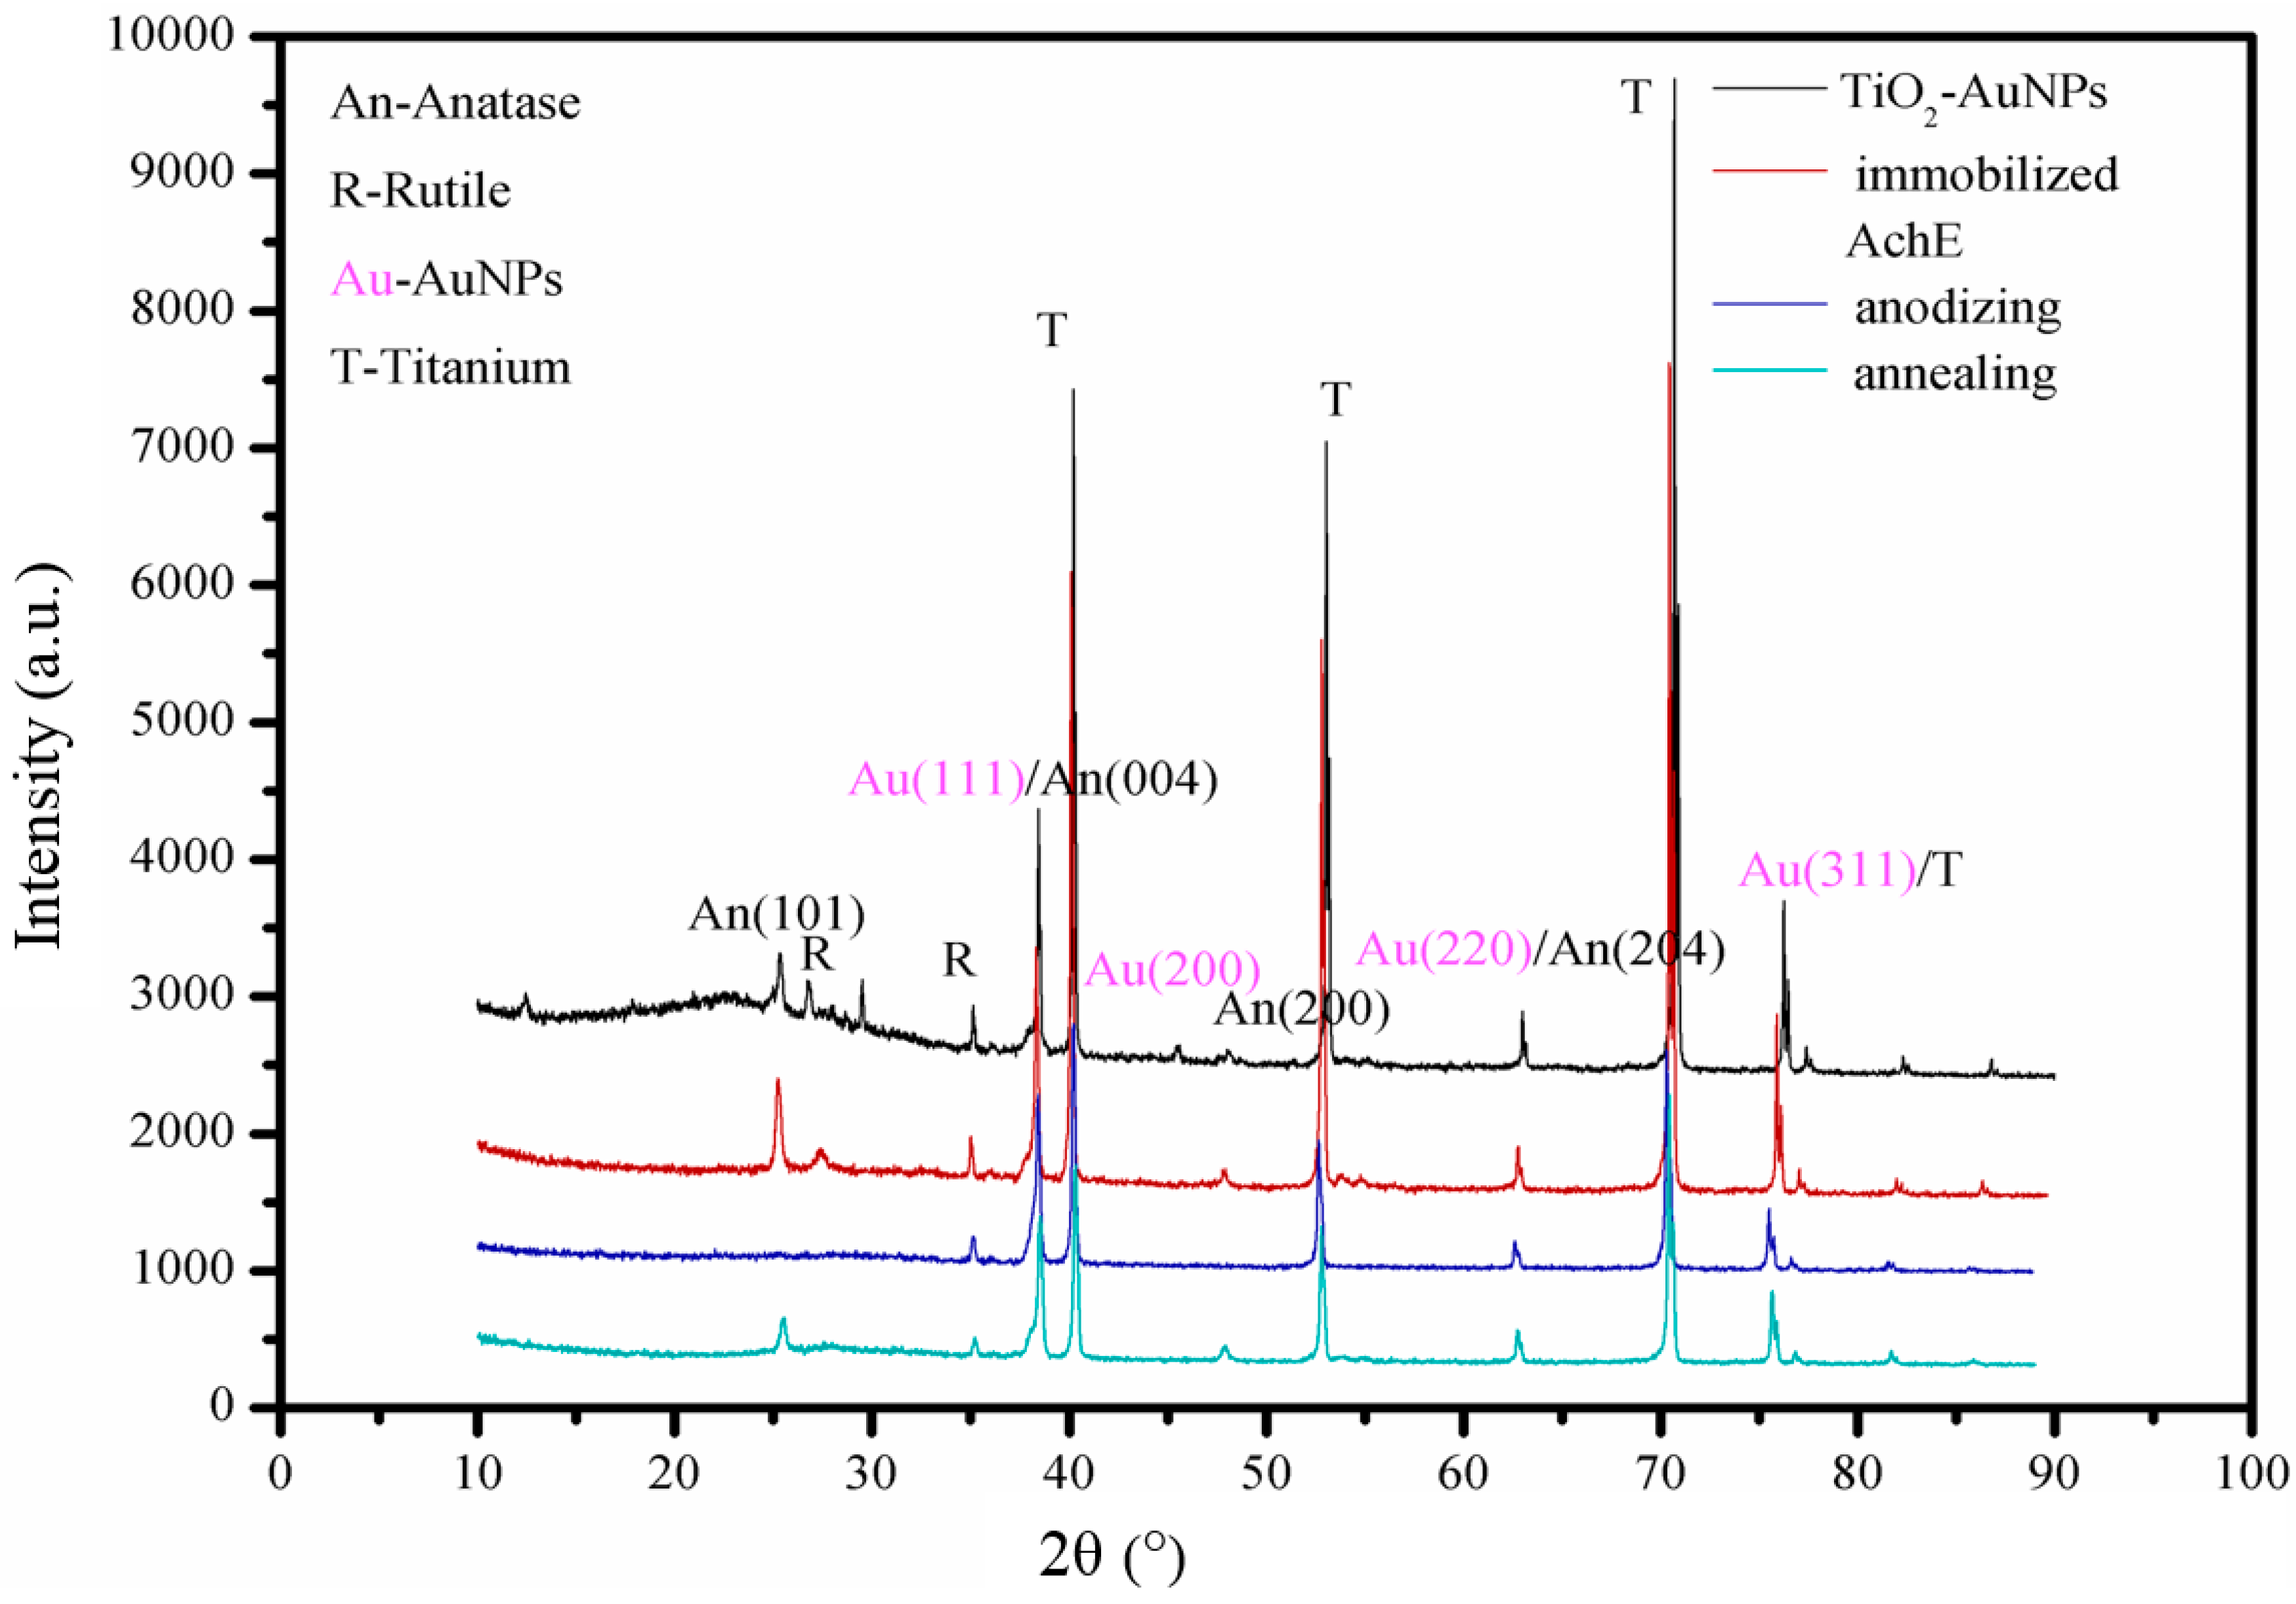
Figure 2.
Scanning Electron Microscopy (SEM) micrographs of samples. Top surface view of anodized TiO2NTs ((a) ×50,000; (b) ×100,000). Top surface view of anodized TiO2NTs deposited with AuNPs ((c) ×50,000; (d) ×100,000).
Figure 2.
Scanning Electron Microscopy (SEM) micrographs of samples. Top surface view of anodized TiO2NTs ((a) ×50,000; (b) ×100,000). Top surface view of anodized TiO2NTs deposited with AuNPs ((c) ×50,000; (d) ×100,000).

Figure 3.
Photocurrent responses of TiO2NTs/Au nanoparticles (AuNPs) after different deposition time (0, 1, 2, 3, 4, 5, 6, 7, 8, 9 min): (a) the photocurrent curves of the TiO2NTs deposited for different times in 0.1 mM HAuCl4·4H2O under deposition potential 0 V; (b) peak currents of the TiO2 NTs for different deposition times (N = 3).

Figure 4.
The photocurrent responses of the AuNPs/AChE/TiO2NTs modified electrode in different concentration of ATCl solutions.
Figure 4.
The photocurrent responses of the AuNPs/AChE/TiO2NTs modified electrode in different concentration of ATCl solutions.

Figure 5.
The photocurrent responses of AFB1: (a) the photocurrent responses of AuNPs/AChE/TiO2 NTs in 0.1 M PBS solution (pH 7.4) containing 0.1 mM ATCl after adding different concentration of AFB1; (b) standard curve line of different concentration of AFB1, N = 3).
Figure 5.
The photocurrent responses of AFB1: (a) the photocurrent responses of AuNPs/AChE/TiO2 NTs in 0.1 M PBS solution (pH 7.4) containing 0.1 mM ATCl after adding different concentration of AFB1; (b) standard curve line of different concentration of AFB1, N = 3).


Table 1.
Several Biosensors for aflatoxin B1 detection.
| Methods | Detection Limit or IC50 | Ref. |
|---|---|---|
| Au/AchE/TiO2NTs | 0.33 nM | This experiment |
| AFO/MWCNTS/Pt | 1.6 nM | [32,33,34] |
| Amperometric, screen printed electrode modified with CoPc | 302 μM | [35,36,37] |
| AchE-based Conductometric Biosensor | 0.05 μg/mL | [38,39,40,41] |
| Amperometric, screen printed electrode | IC50 = 100 ppb | [42] |
| Aflatoxin B1 based on aggregation of gold nanorods | 0.04 ppb | [43,44] |
| Detection of aflatoxin B1 in corn and nut products using the array biosensor | 0.3 ng/mL | [45,46] |
© 2018 by the authors. Licensee MDPI, Basel, Switzerland. This article is an open access article distributed under the terms and conditions of the Creative Commons Attribution (CC BY) license (http://creativecommons.org/licenses/by/4.0/).
Share and Cite
MDPI and ACS Style
Yuan, Q.; He, C.; Mo, R.; He, L.; Zhou, C.; Hong, P.; Sun, S.; Li, C. Detection of AFB1 via TiO2 Nanotubes/Au Nanoparticles/Enzyme Photoelectrochemical Biosensor. Coatings 2018, 8, 90. https://doi.org/10.3390/coatings8030090
AMA Style
Yuan Q, He C, Mo R, He L, Zhou C, Hong P, Sun S, Li C. Detection of AFB1 via TiO2 Nanotubes/Au Nanoparticles/Enzyme Photoelectrochemical Biosensor. Coatings. 2018; 8(3):90. https://doi.org/10.3390/coatings8030090
Chicago/Turabian StyleYuan, Qiong, Chuxian He, Rijian Mo, Lei He, Chunxia Zhou, Pengzhi Hong, Shengli Sun, and Chengyong Li. 2018. "Detection of AFB1 via TiO2 Nanotubes/Au Nanoparticles/Enzyme Photoelectrochemical Biosensor" Coatings 8, no. 3: 90. https://doi.org/10.3390/coatings8030090
Note that from the first issue of 2016, this journal uses article numbers instead of page numbers. See further details here.