Comparative Study of the Corrosion Resistance of Air-Plasma-Sprayed Ca2SiO4 and Al2O3 Coatings in Salt Water

1
The Key Laboratory of Inorganic Coating Materials CAS, Shanghai Institute of Ceramics, Chinese Academy of Science, Shanghai 201899, China
2
University of Chinese Academy of Sciences, Beijing 100039, China
*
Authors to whom correspondence should be addressed.
Coatings 2018, 8(4), 116; https://doi.org/10.3390/coatings8040116
Submission received: 11 January 2018
/
Revised: 15 March 2018
/
Accepted: 19 March 2018
/
Published: 22 March 2018
(This article belongs to the Special Issue Advanced Coatings for Corrosion Protection in Extreme Environments)
Abstract
:In this study, Ca2SiO4 coating was sprayed on stainless steel substrate and the corrosion resistance of the as-sprayed coating was studied in salt water. At the same time, Al2O3 coatings were produced by air-plasma-sprayed technology as comparison. Immersion test was carried out to evaluate the protection performance of coatings. Potentiodynamic polarization curves and electrochemical impedance spectroscopy (EIS) plots were also analyzed. The results indicated that Ca2SiO4 coatings showed a better protection performance than Al2O3 coatings. During the immersion, various calcium carbonate crystals appeared on the surface of Ca2SiO4 coatings. Ca(OH)2 was released from Ca2SiO4 coatings into NaCl aqueous solution, increasing the alkalinity, which is in favor of the formation of passivation film, and thus improves the corrosion resistance. Ca2SiO4 coatings became denser after immersion due to the fact that the pores and micro cracks were filled with hydration products i.e., hydrated calcium silicate (C–S–H) gel. On the contrary, the microstructure of Al2O3 coatings became loose and obvious rusty spots were observed on the surface after the immersion test.
1. Introduction
Marine resources play an important role in the development of world economics. However, sea water is a corrosive medium. Sea water contains large number of ions, such as Na+, Cl−, Mg2+, SO42−, K+ and CO32−. The salt concentration is about 3.5 wt % in sea water. Therefore, corrosion in sea water is very severe [1]. Marine engineering materials, especially metal structural materials, suffer from different levels of corrosion damage. Thus, measures must be taken to protect the metal materials served in the harsh marine environment [2]. Spraying anti-corrosion coatings on the metal material surface can effectively slow down the corrosion rate [3].
At present, the widely applied anti-corrosion technologies in the marine corrosion field include organic paint, zinc-aluminium alloy, amorphous alloy coating, oxide ceramic coatings [4], etc. Organic paint might age and then spall when it works for a long time under the exposure of sun or in sea water, so its durability needs to be improved [5]. Zinc-aluminium alloy and amorphous alloy coatings exhibit good corrosion resistance in the marine environment, but bad electrical insulation which cannot hinder the transfer of electric charge in the corrosion reaction, thus they are sacrificial anode protection [6]. The oxides such as Al2O3, Al2O3/TiO2 and Al2O3/Cr2O3 showed good corrosion resistance [7] and in previous studies, ceramic coatings were effective to isolate the corrosive medium [8].
Cement is another inorganic material used widely in the marine environment, especially in marine building infrastructure. The main components of cement are dicalcium silicate (C2S), tricalcium silicate (C3S), tricalcium aluminate and tetracalcium aluminoferrite [9]. Earlier studies have revealed that tricalcium aluminate would react with sulfate ion in the sea water to generate swelling salt, causing the volume expansion of concrete and inducing crack propagation [10]. Cement is a kind of gel material with dicalcium silicate and tricalcium silicate as the main composition, which would react with water to generate hydrated calcium silicate gel. Hydrated calcium silicate gel would fill the pores and micro cracks in the structure and improve the permeability resistance. In general, the more hydrated the calcium silicate, the denser the structure. Therefore, the compressive strength of cement stone would be higher. The equal mass of C2S would produce more hydrated calcium silicate than C3S does in the process of hydration. It was found that after two years’ hydration process, the ultimate strength of C2S block was 143.5 MPa but the ultimate strength of C3S block was 113 MPa, the ultimate strength of C2S block is higher by 26% than that of C3S block [11]. Thus, dicalcium silicate may produce more C–S–H gel and improve the density of coating. The melting point of silicate minerals is very high. Plasma spraying uses high-temperature plasma as its heat source; the flame temperature is so high that most ceramic material and metal material can be flame-melted [12]. Plasma-sprayed coatings usually have good bond strength. X. Liu et al. mentioned that the bond strength of dicalcium silicate coatings was about 38.9 ± 3.5 MPa (the thickness of the coating was about 380 μm) [13]. However, almost no study discussed the corrosion resistance of dicalcium silicate coatings in marine environment.
In the current work, dicalcium silicate coatings and alumina coatings were produced by air-plasma-sprayed technology, the phase composition and microstructure of coatings were studied. In addition, immersion test was carried out to evaluate the protection performance of coatings. Potentiodynamic polarization curves and electrochemical impedance spectroscopy (EIS) plots were also analyzed.
2. Materials and Methods
2.1. Feedstock Power and Coating Preparation
Dicalcium silicate (Ca2SiO4) powders were synthesized by solid-state reaction using analytical-grade calcium carbonate and silicon dioxide with an initial CaCO3/SiO2 molar ratio of 2.0. The materials were wet-mixed for 10 h. The typical size of Ca2SiO4 powders was about 30–50 μm. Commercially available alumina powders were used. F4-MB plasma gun was applied to deposit the coatings including NiCr bond layer and oxide layer; 304 stainless steel with the dimensions of 30 mm × 15 mm × 1.25 mm was used as substrate. Prior to spraying, the stainless steel substrate was degreased ultrasonically in ethanol and then grit-blasted with corundum. The detailed plasma spraying parameters are listed in Table 1. The thickness of bond coat is about 15–30 μm, and the Ca2SiO4 and Al2O3 coatings are both 130–150 μm.
2.2. Microstructure and Property Characterization
The crystalline phase compositions of the powders and coatings were analyzed by a powder X-ray diffraction using a Rigaku D/Max2550 diffract meter (Rigaku, Tokyo, Japan) with nickel-filtered Cu Kα radiation (λ = 0.15406 nm). The microstructures of coatings were investigated by scanning electron microscope (SEM) TM3000 (Hitachi, Tokyo, Japan) equipped with energy dispersive spectrometer (EDS). The Image-Pro Plus software (version 6.0.0.) was applied to measure the porosity of coatings according to the Image analysis method. Each data of porosity was based on 10 pieces of coating cross-section SEM images with 1000×. The bond strength is measured according to ASTM C-633 [14]; Instron-5592 tension, pressure universal testing machine (Instron, New York, USA) is used. The substrate is 1Cr 13 stainless steel, and the dimension is φ 25 mm× h 60 mm.
2.3. Corrosion Tests
The corrosion resistance of plasma-sprayed coatings was investigated by immersion test in unstirred 3.5 wt % NaCl aqueous solution at (35 ± 2) °C. After being immersed for 5, 10, 20, 30 days, the coatings were denoted as Al2O3-X and C2S-X (X = 5, 10, 20, 30). Electrochemical corrosion test was also conducted. The electrochemical systems used in the tests were Ametek 1287 & 1260 (Berwyn, PA, USA). Polarization curves were recorded from −0.5 V to 0.6 V vs. open circuit voltage (Eocp) at 0.5 mV/s potential sweep rate. Electrochemical tests were conducted in a three-electrode cell using platinum mesh as counter electrode, a saturated calomel electrode (SCE) as reference electrode and the coating as working electrode. Electrolyte was 3.5 wt % NaCl aqueous solution prepared from analytic reagent sodium chloride and deionized water. Electrochemical impedance spectroscopy (EIS) plots were recorded after immersing the specimens in 3.5 wt % NaCl aqueous solution for about 30 min when the open circuit potentials became almost steady, the recorded frequency range was from 106 Hz to 10−2 Hz, the applied perturbation was 10 mV AC amplitude.
3. Results and Discussion
3.1. Phase Compositions and Microstructures
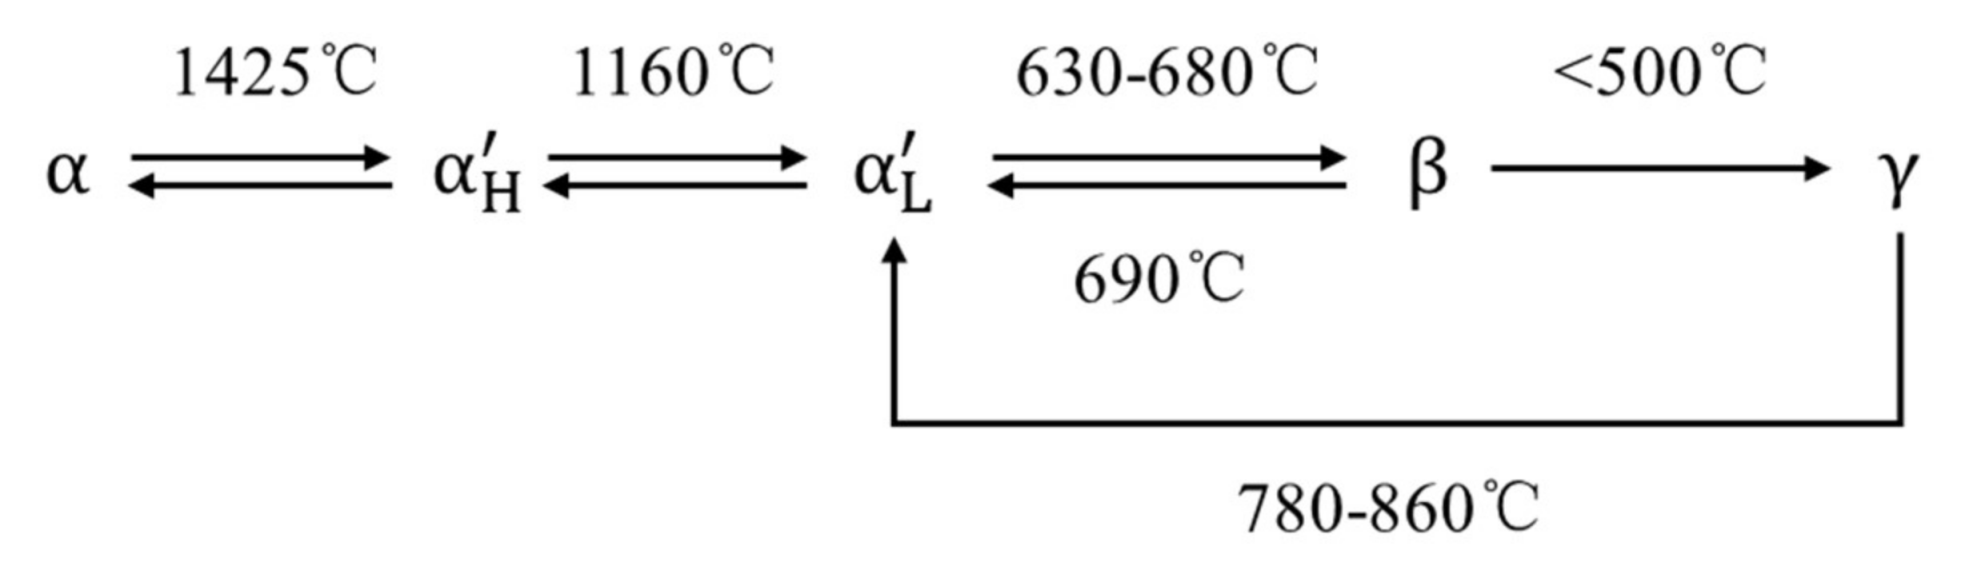
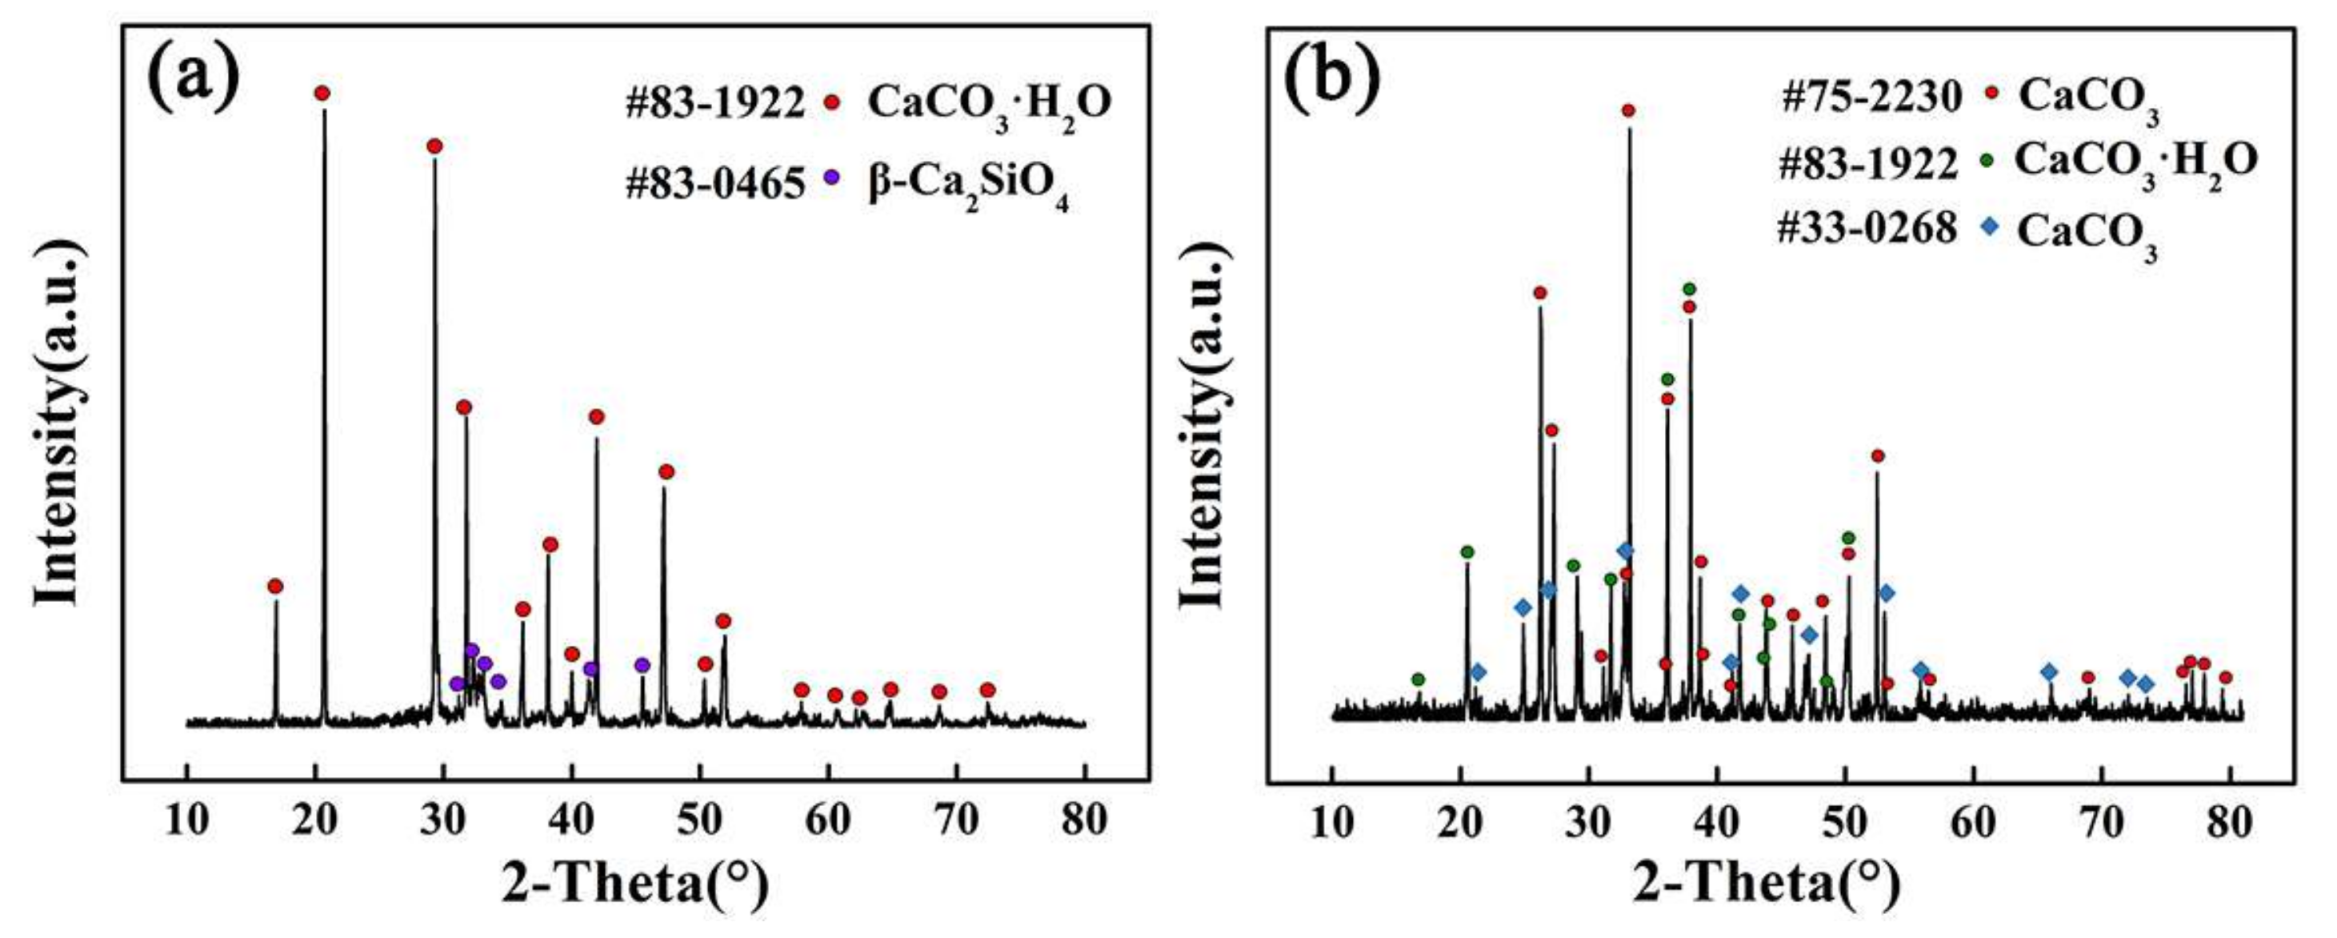
The XRD patterns of the powders and as-sprayed coatings are shown in Figure 1. Ca2SiO4 powders were composed of γ-Ca2SiO4, while the phase in as-sprayed Ca2SiO4 coatings was β-Ca2SiO4 with a part of glassy phase. In Figure 1c, the increase in the background area under the peaks indicated the glassy phase [13]. In the high-temperature plasma flame flow, γ-Ca2SiO4 powders were rapidly melted into droplets, and the droplets hit/impacted the substrate, then quickly deposited on the surface to form coating. β-Ca2SiO4 was generated during the rapid cooling process, some of the droplets did not crystallize in time and were converted into glass phase. The rate of change in heat evolution leads to the formation of different types of polymorphs (α, αH’, αL’, β and γ) of Ca2SiO4 [15], as shown in Figure 2.
γ-Ca2SiO4 is the stable phase at room temperature. It is generally believed that the higher the formation temperature, the higher the hydration rate, so the hydration rate rank of the different phase is α > αH’ > αL’ > β > γ [16]. Previous investigations indicated that γ-Ca2SiO4 almost cannot react with water [17], while β-Ca2SiO4 can react with water to generate gel of hydrated calcium silicate. The alumina powders were α-Al2O3, but as-sprayed coating contained α-Al2O3 and γ-Al2O3. A part of α-Al2O3 transformed into γ-Al2O3 during the plasma spraying process. The phase of Al2O3 coatings produced by plasma spraying mainly existed in γ-Al2O3 phase [18].
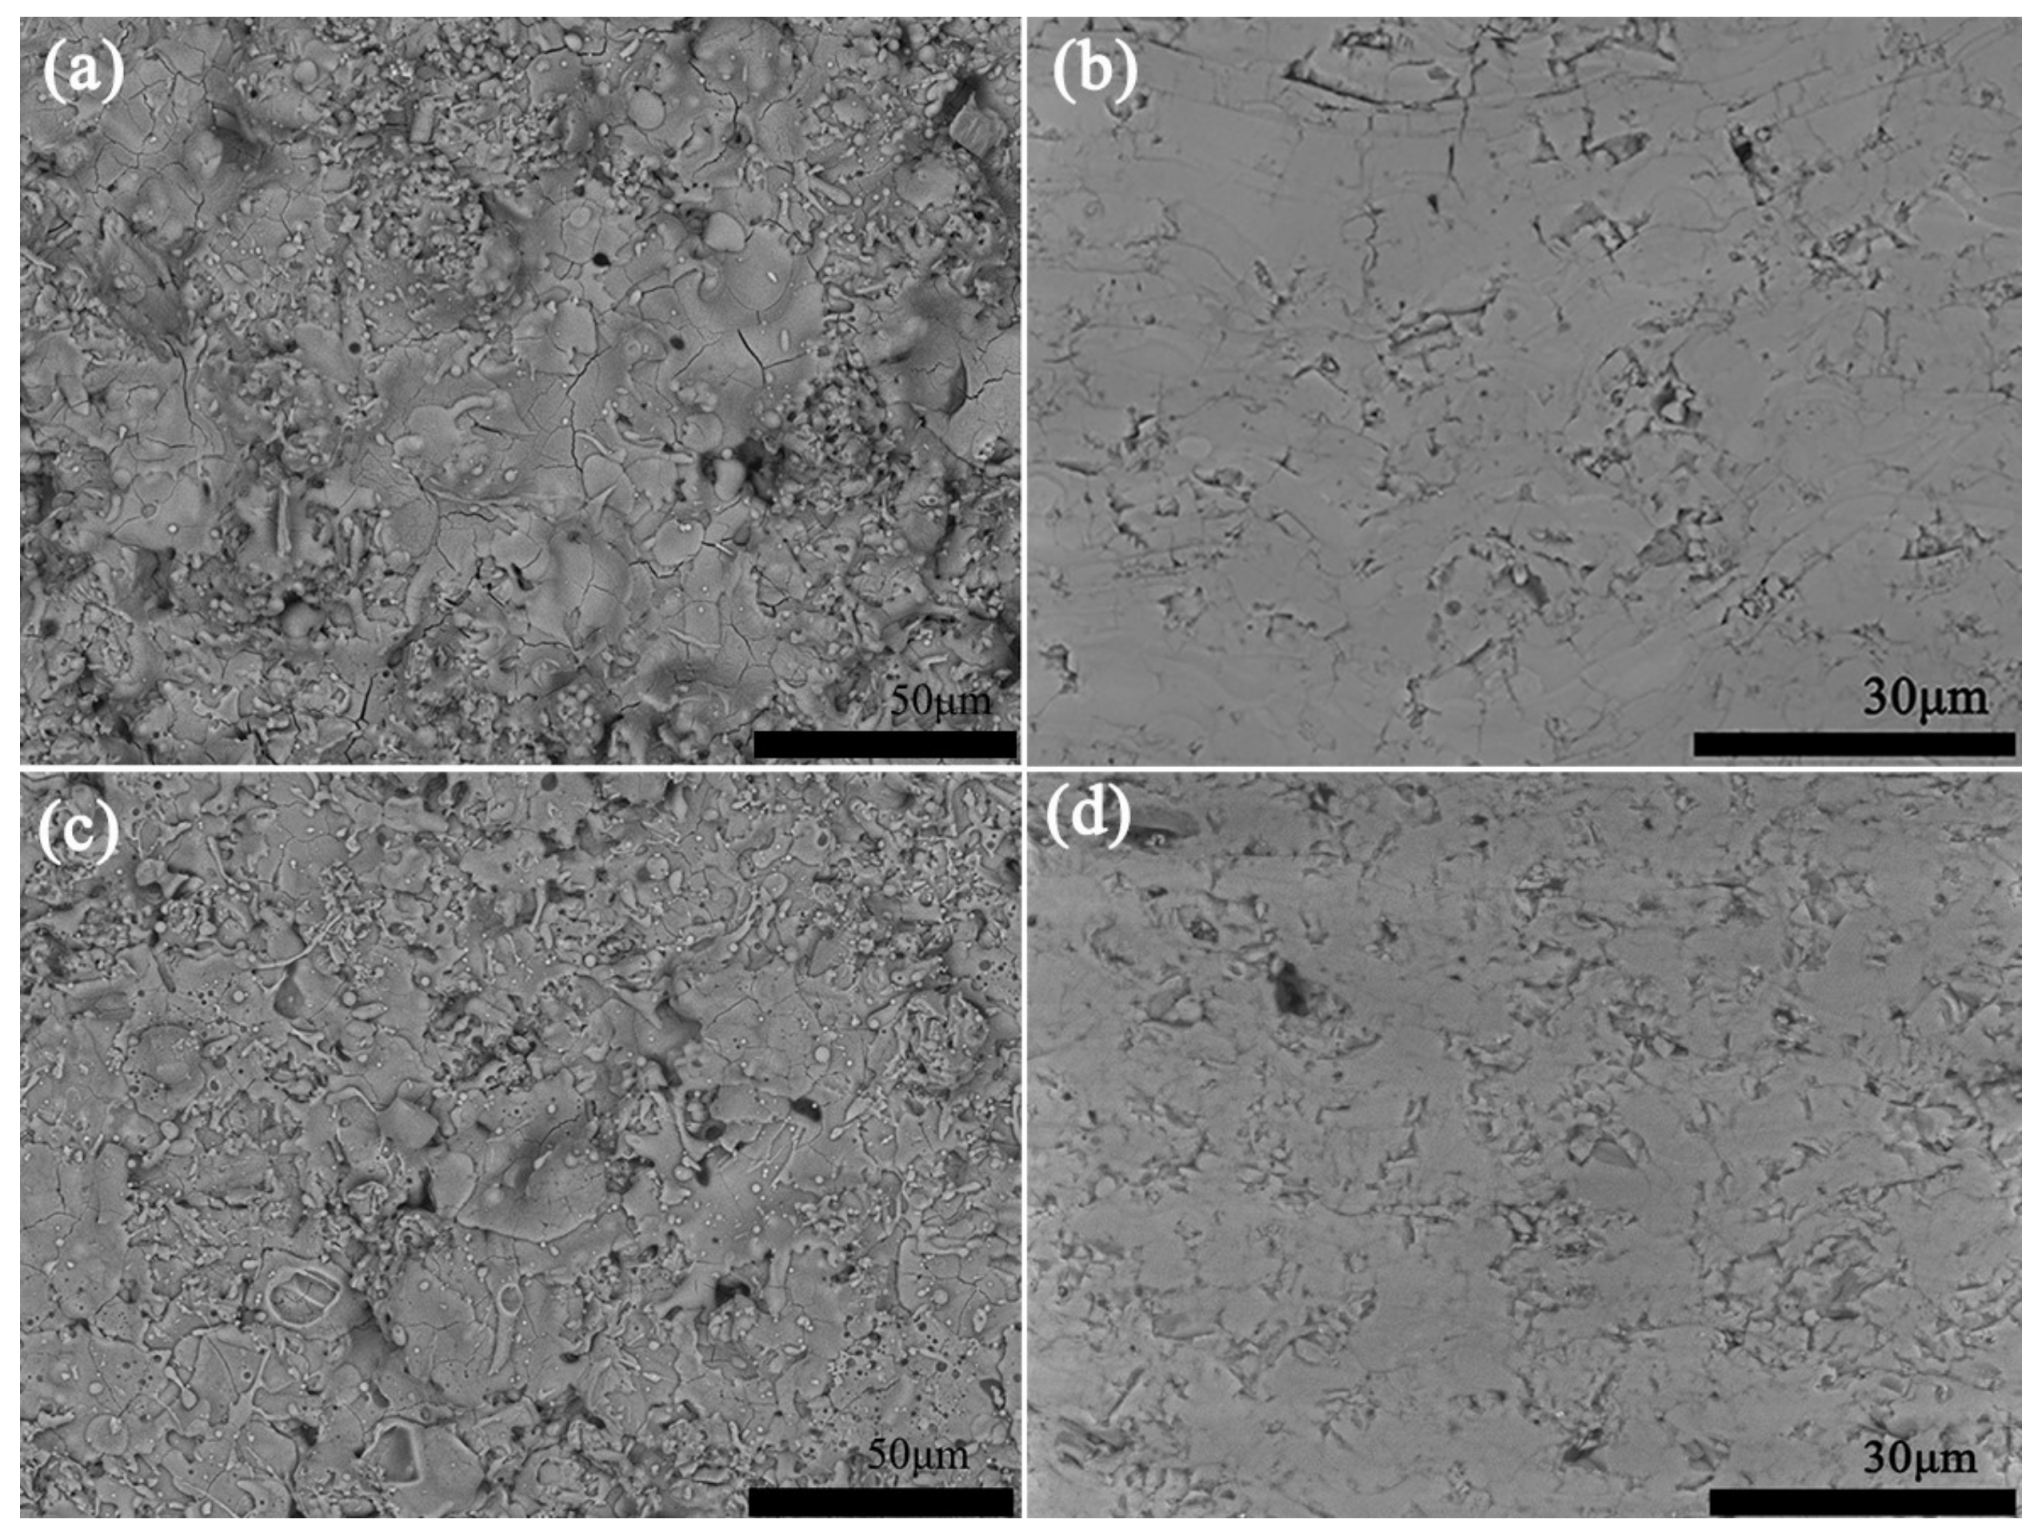
The surface and cross-sectional morphologies of as-sprayed coatings are shown in Figure 3. The surface morphology of coatings revealed that the coating was built up from melted droplets. The cross-sectional view of the coating showed obvious pores and micro cracks. The porosity of Ca2SiO4 coating and Al2O3 coating were 6.50% and 8.85%, respectively. It showed that Ca2SiO4 coating was a little denser than Al2O3 coating. The bond strength of Ca2SiO4 coatings and Al2O3 coating were 35.0 ± 3.5 MPa and 26.0 ± 3.5 MPa, which revealed that the bonding strength between Ca2SiO4 coating and metal substrate was better than that for Al2O3 coating.
3.2. Immersion Test
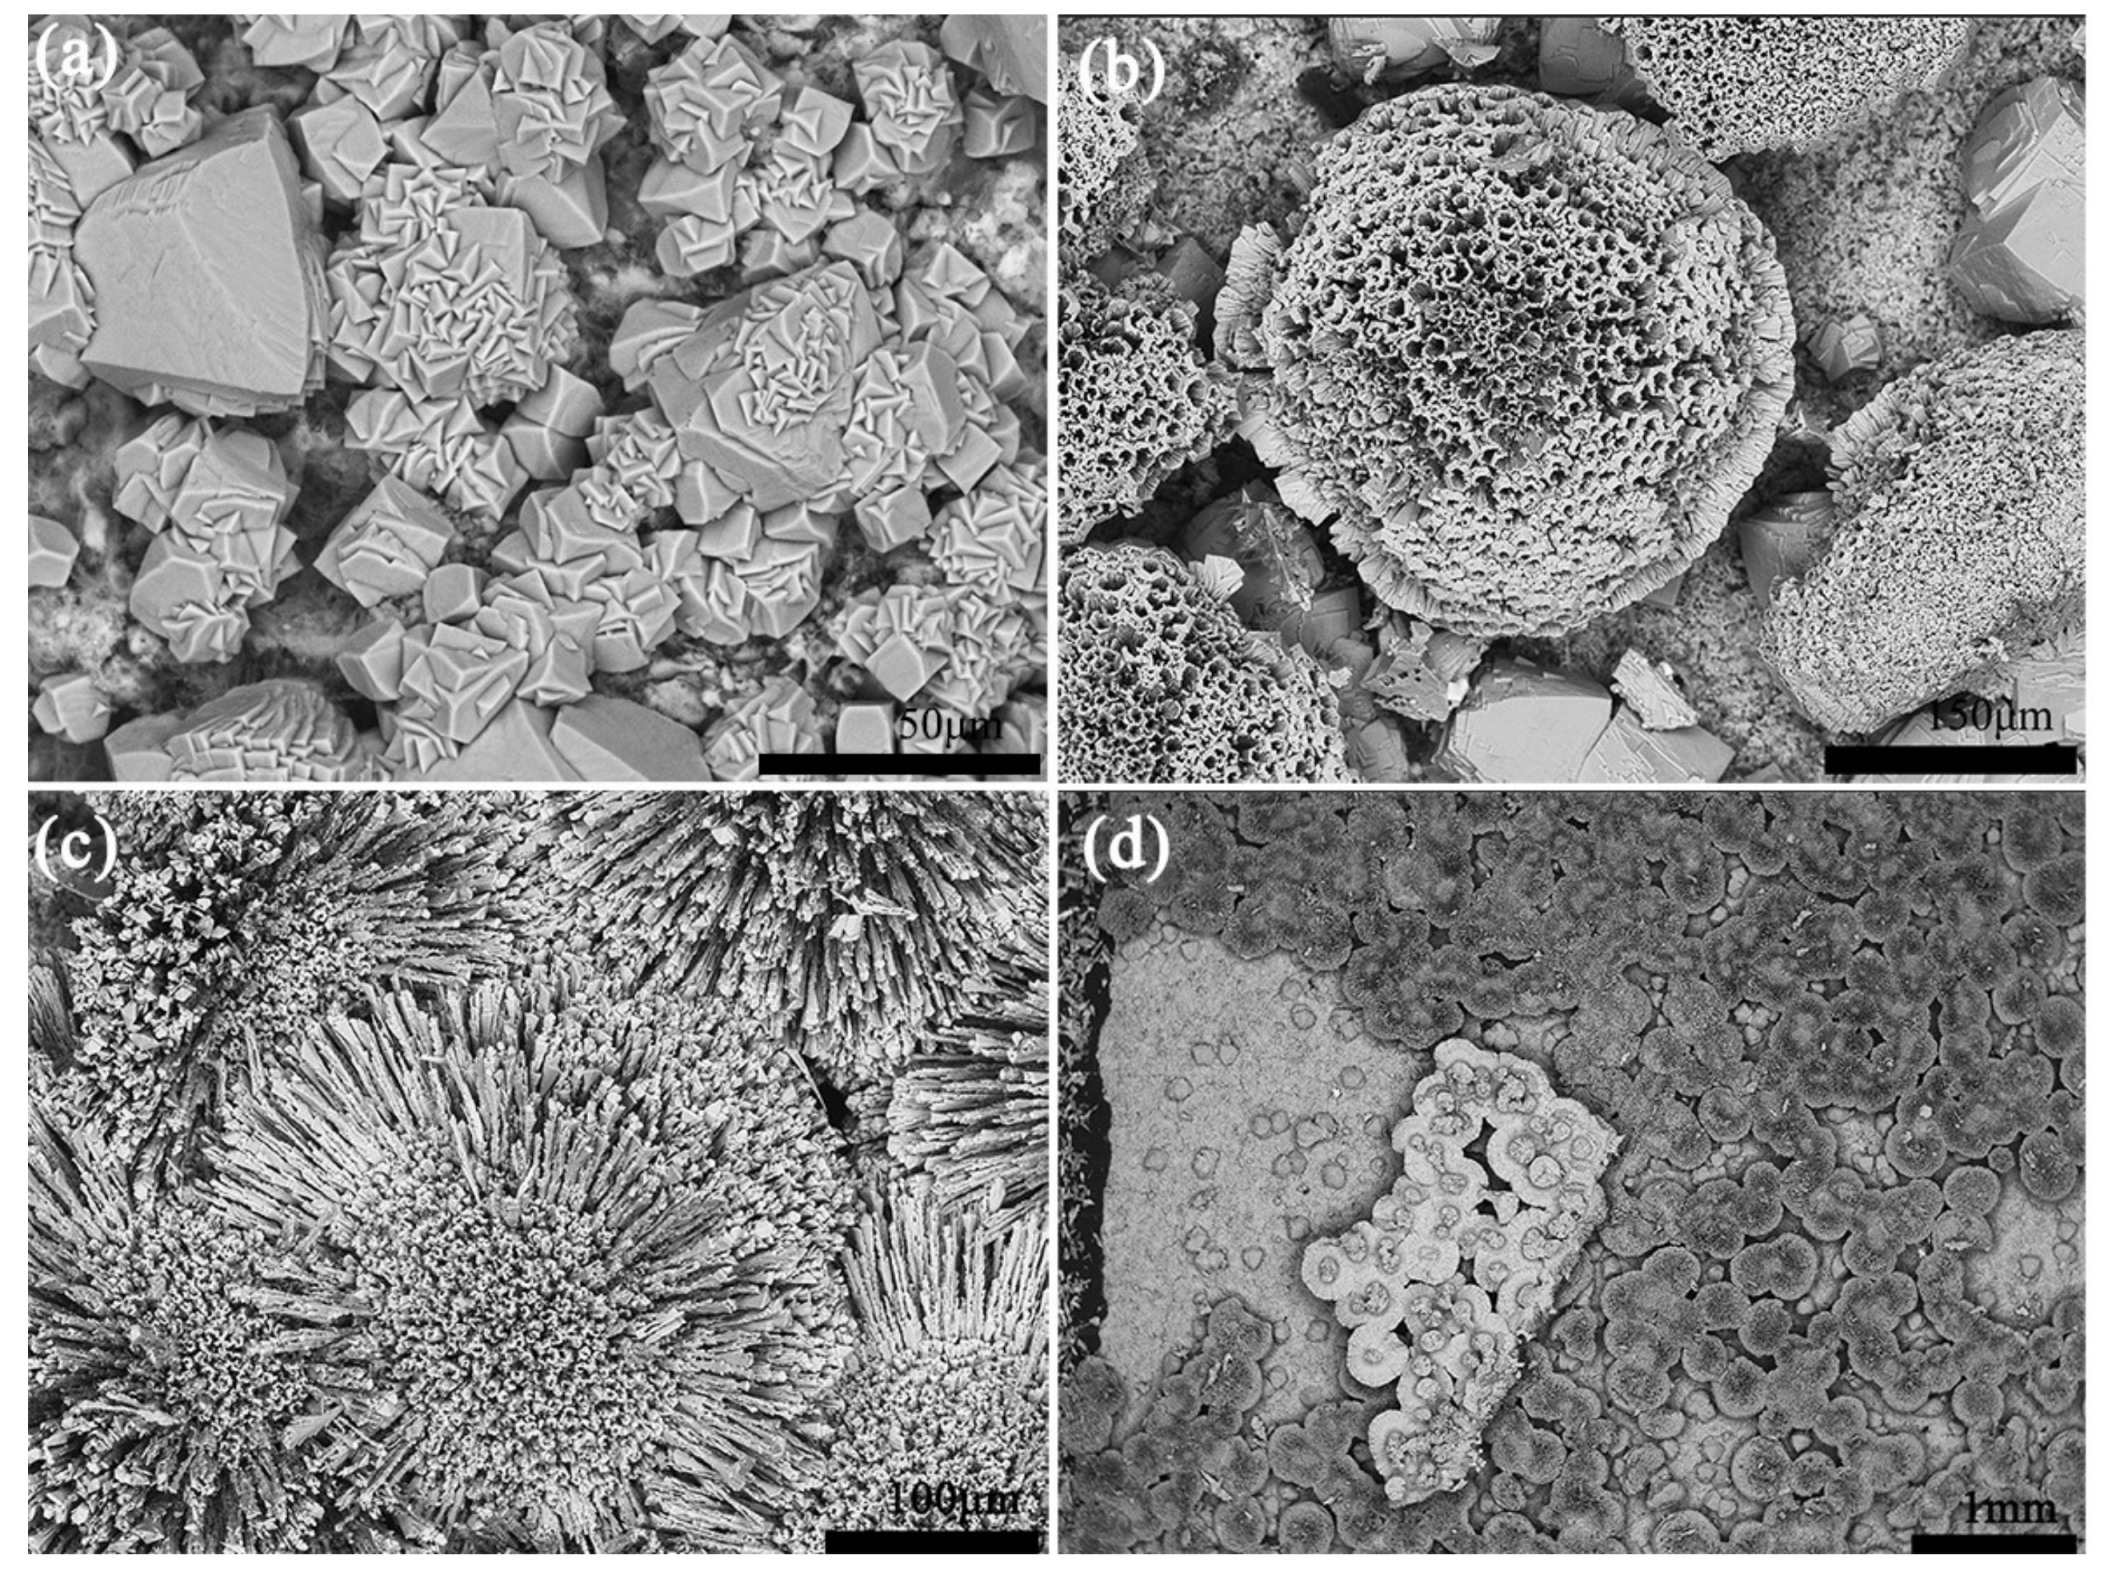
Figure 4 shows the surface morphologies of Ca2SiO4 coating after being immersed in still 3.5 wt % NaCl solution at (35 ± 2) °C for 5, 10, 20 and 30 days.
As shown in Figure 4, after being immersed in 3.5 wt % NaCl solution for 5 days, there were some rhombic solid particles on the surface of Ca2SiO4 coating. XRD patterns in Figure 5a show that the particles are rhombic calcite (CaCO3). More and more calcium carbonate crystals were formed on the surface of Ca2SiO4 coating as the immersed time increased. When immersed for 20 days, chrysanthemum-like or spindle-like [19] aragonite (CaCO3) and spherical vaterite (CaCO3) appeared. After 30 days, calcium carbonate crystals spread all over the coating surface. It was easy for calcium carbonate crystals to fall from the coating surface.
The chemical processes that took place on the surface of Ca2SiO4 during immersion of specimens in 3.5% NaCl solution are as follows [20]:
Ca2SiO4 + nH2O → mCaO·SiO2·xH2O + (2 − m)Ca(OH)2 (n = x + 2 − m)
Ca(OH)2 + CO2 → CaCO3·H2O
or Ca(OH)2 + CO2 → CaCO3 + H2O
And the Na+ and Cl− ions have no effect on the hydration process of Ca2SiO4 coatings.
Han et al. studied the factors affecting the phase and morphology of CaCO3 prepared by a bubbling method. They found that low Ca2+ concentration or sufficient supply of CO2 was in favor of the formation of spherical vaterite [21]. At the beginning of the immersion in 3.5 wt % NaCl solution, Ca2SiO4 coating reacted with water to release Ca(OH)2. High Ca2+ concentration promoted to form rhombic calcite as shown in Figure 5a. As the slow dissolution of CO2 gas, Ca2+ concentration decreased, spherical vaterite formed on the coating surface as shown in Figure 5b. In reference [21], the size of calcium carbonate particle was below 10 μm, but the particle size of calcite and vaterite formed on Ca2SiO4 coating were more than 50 μm. During the immersion, the release of Ca(OH)2 and dissolution of CO2 gas were very slow, and the supersaturation of solution remained at a low level. In addition, supersaturation played an important role on the rate of crystal nucleus formation and crystal growth, and the supersaturation influenced the size and distribution of the formed particles. When the supersaturation was low, the ratio of crystal growth rate and crystal nucleus formation rate is bigger, so the crystal is bigger with relatively complete crystal shape, but the crystallization rate was slow [22]. When the supersaturation of solution was kept low for a long time, the crystal growth was predominant in the solution. Therefore, the size of calcium carbonate particles on Ca2SiO4 coating was larger than that in other studies.
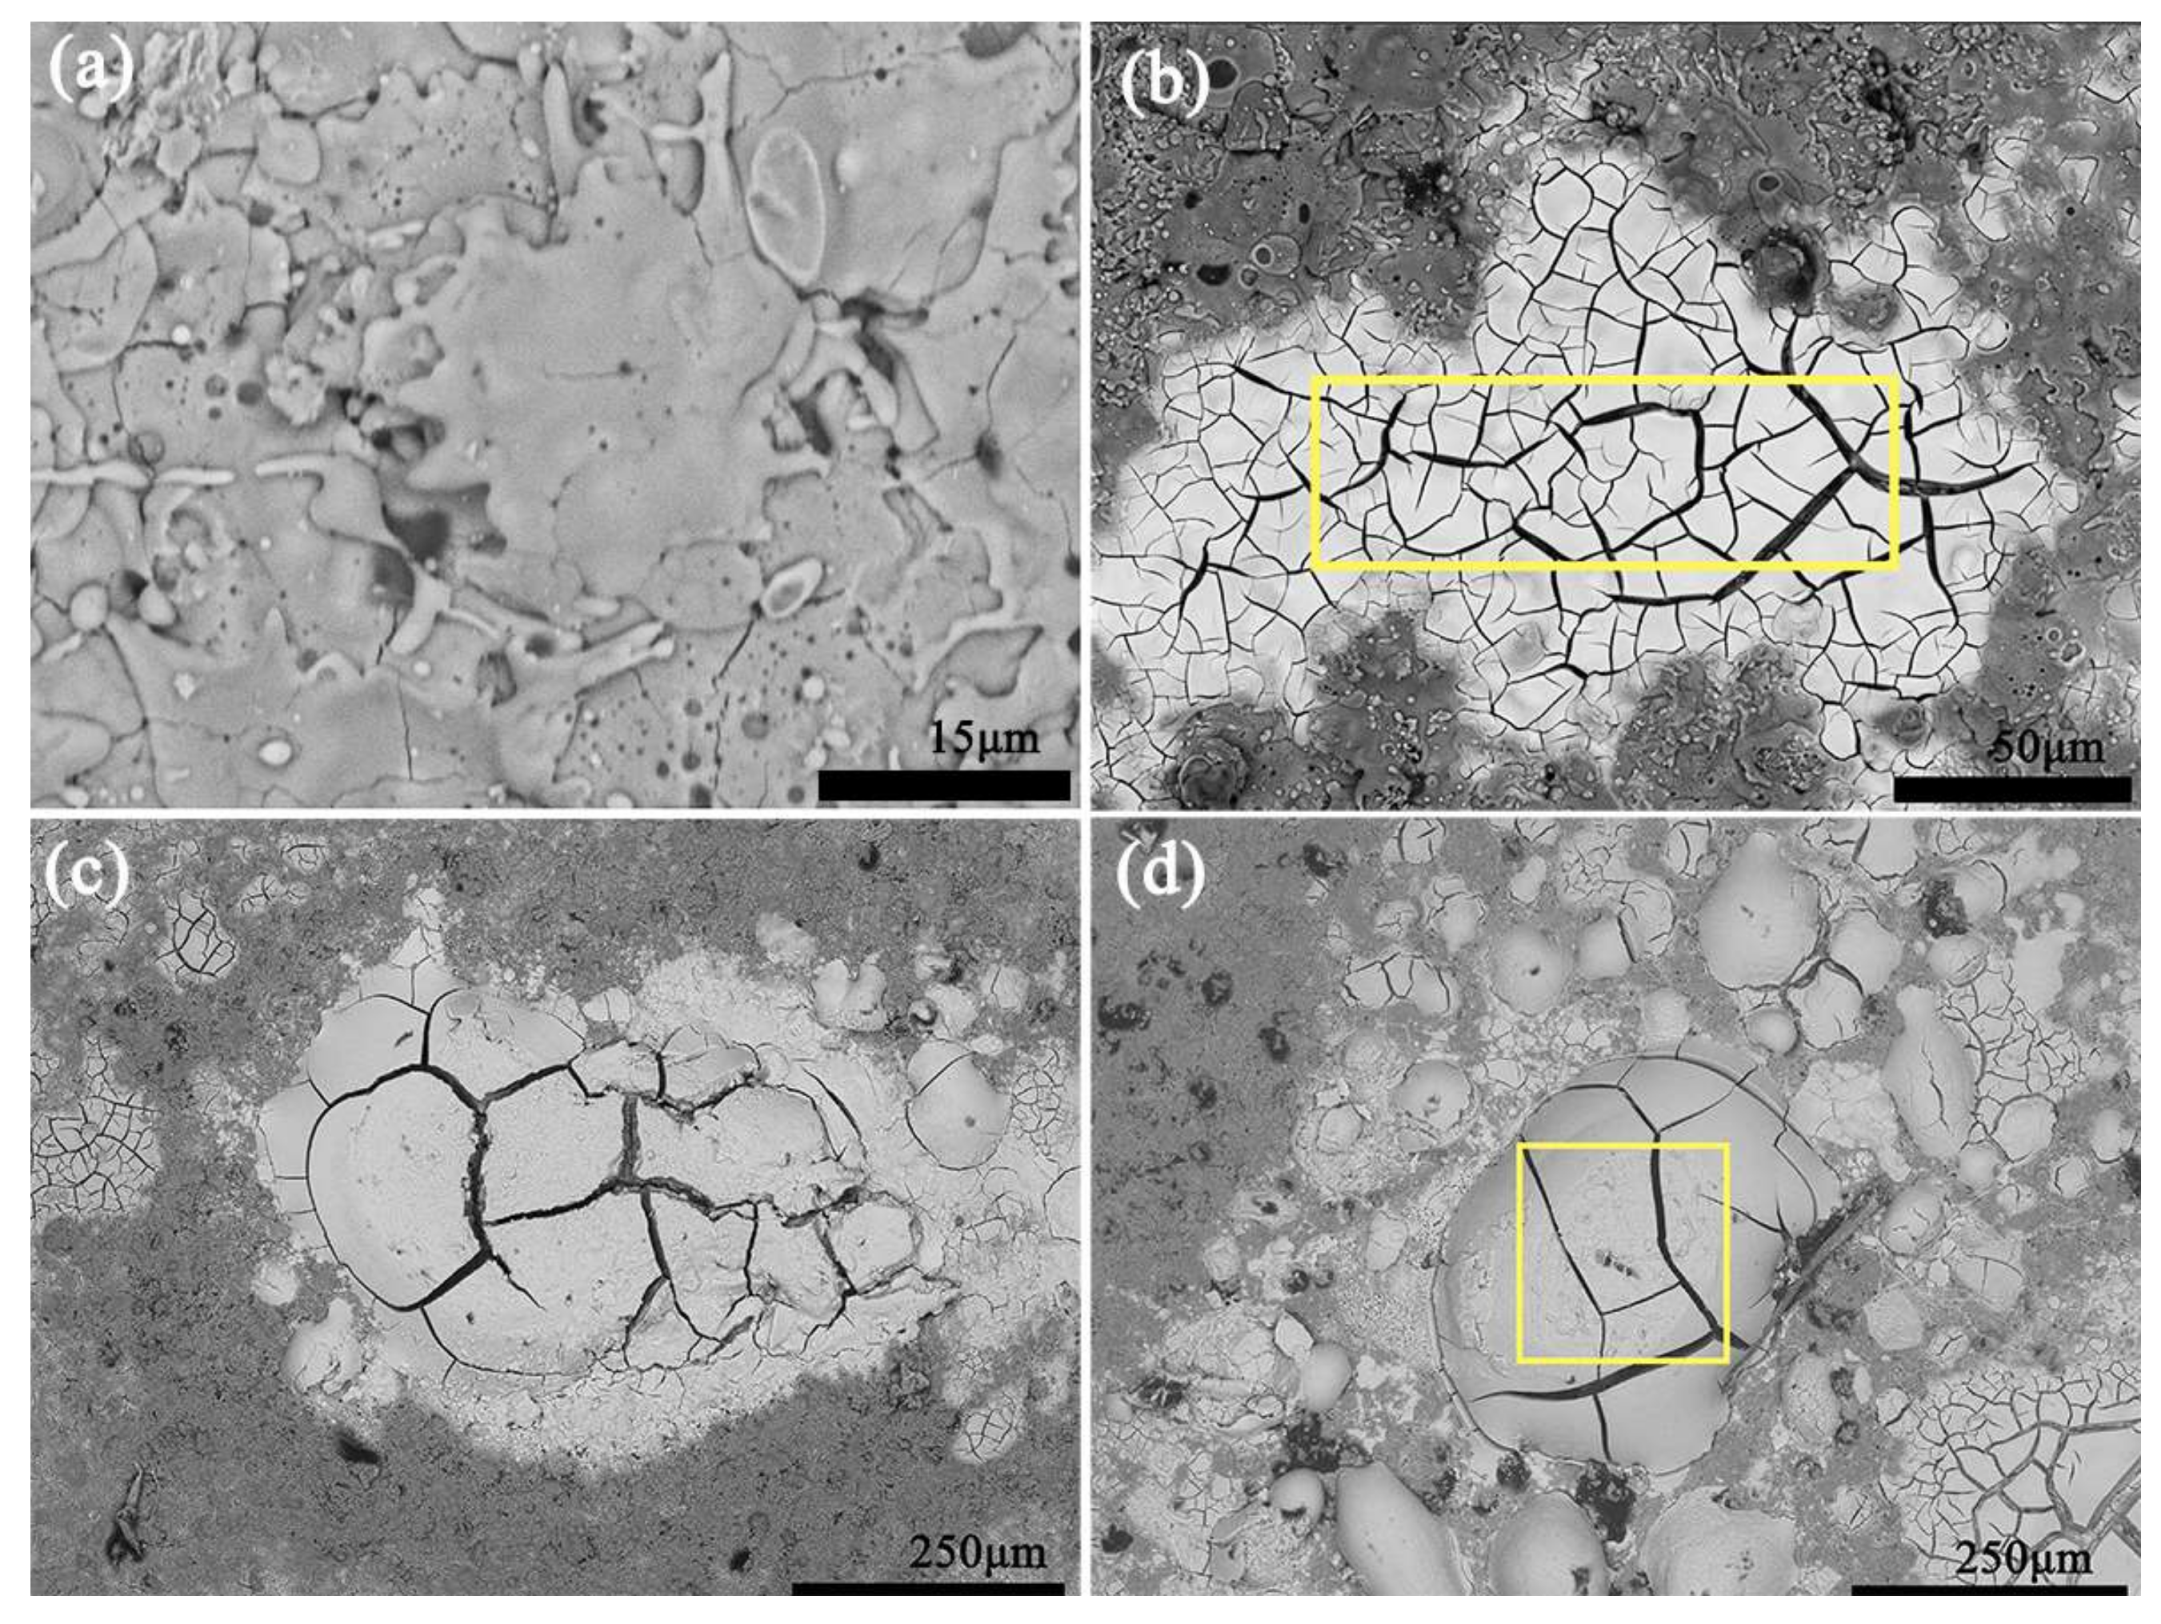
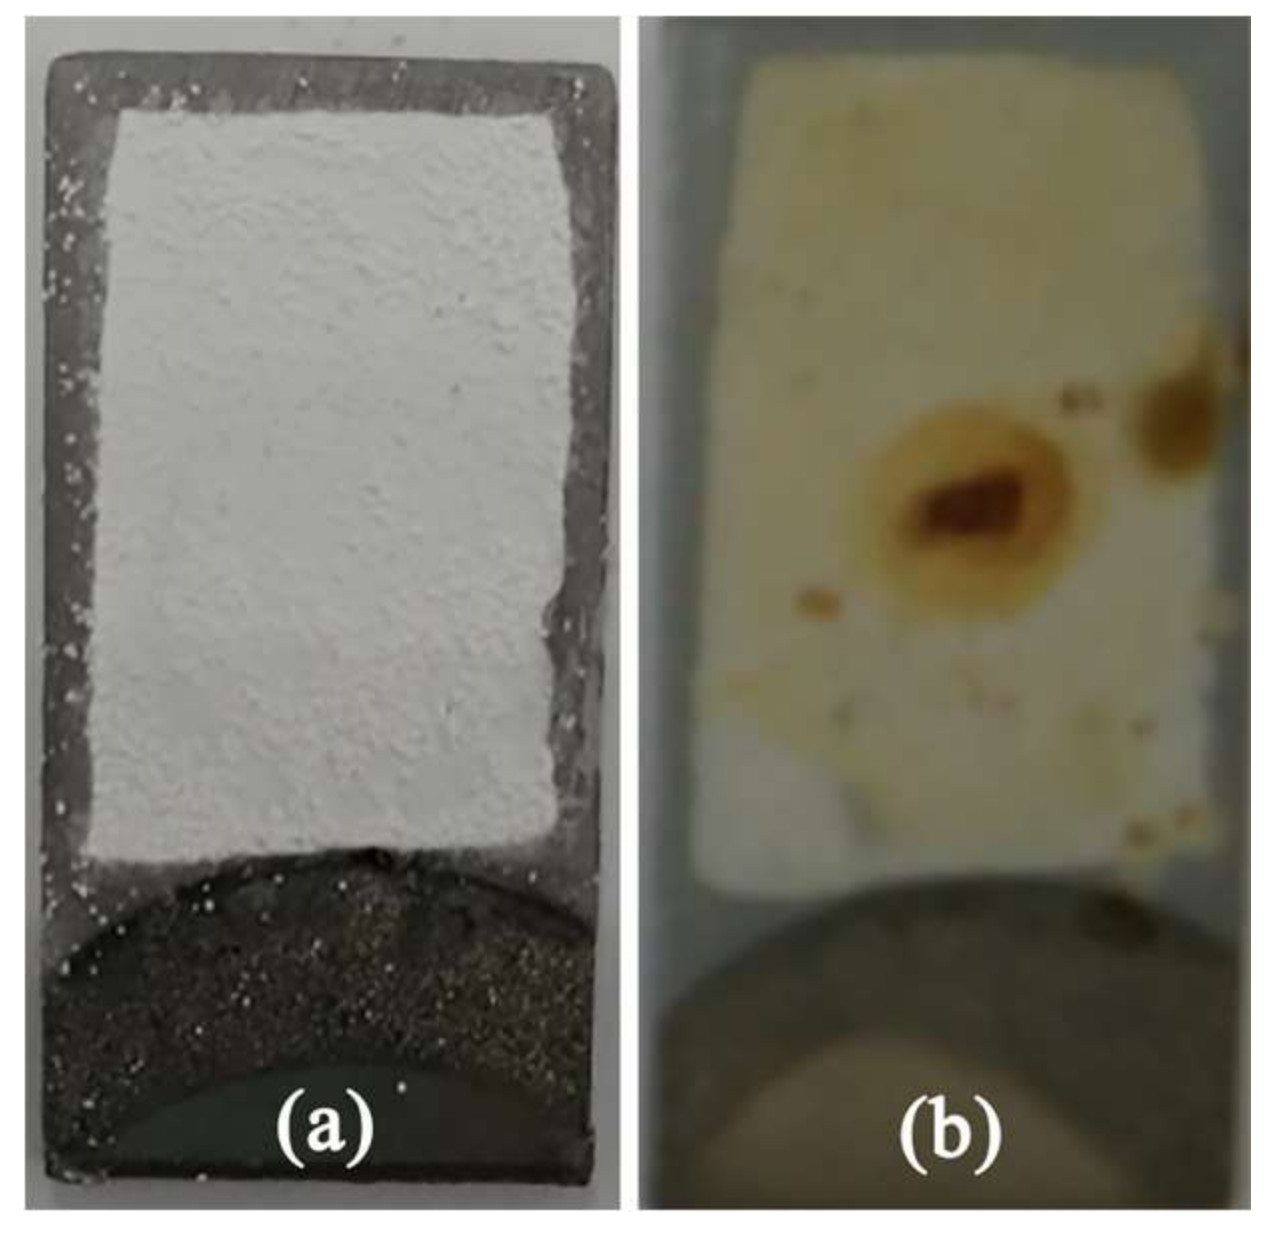
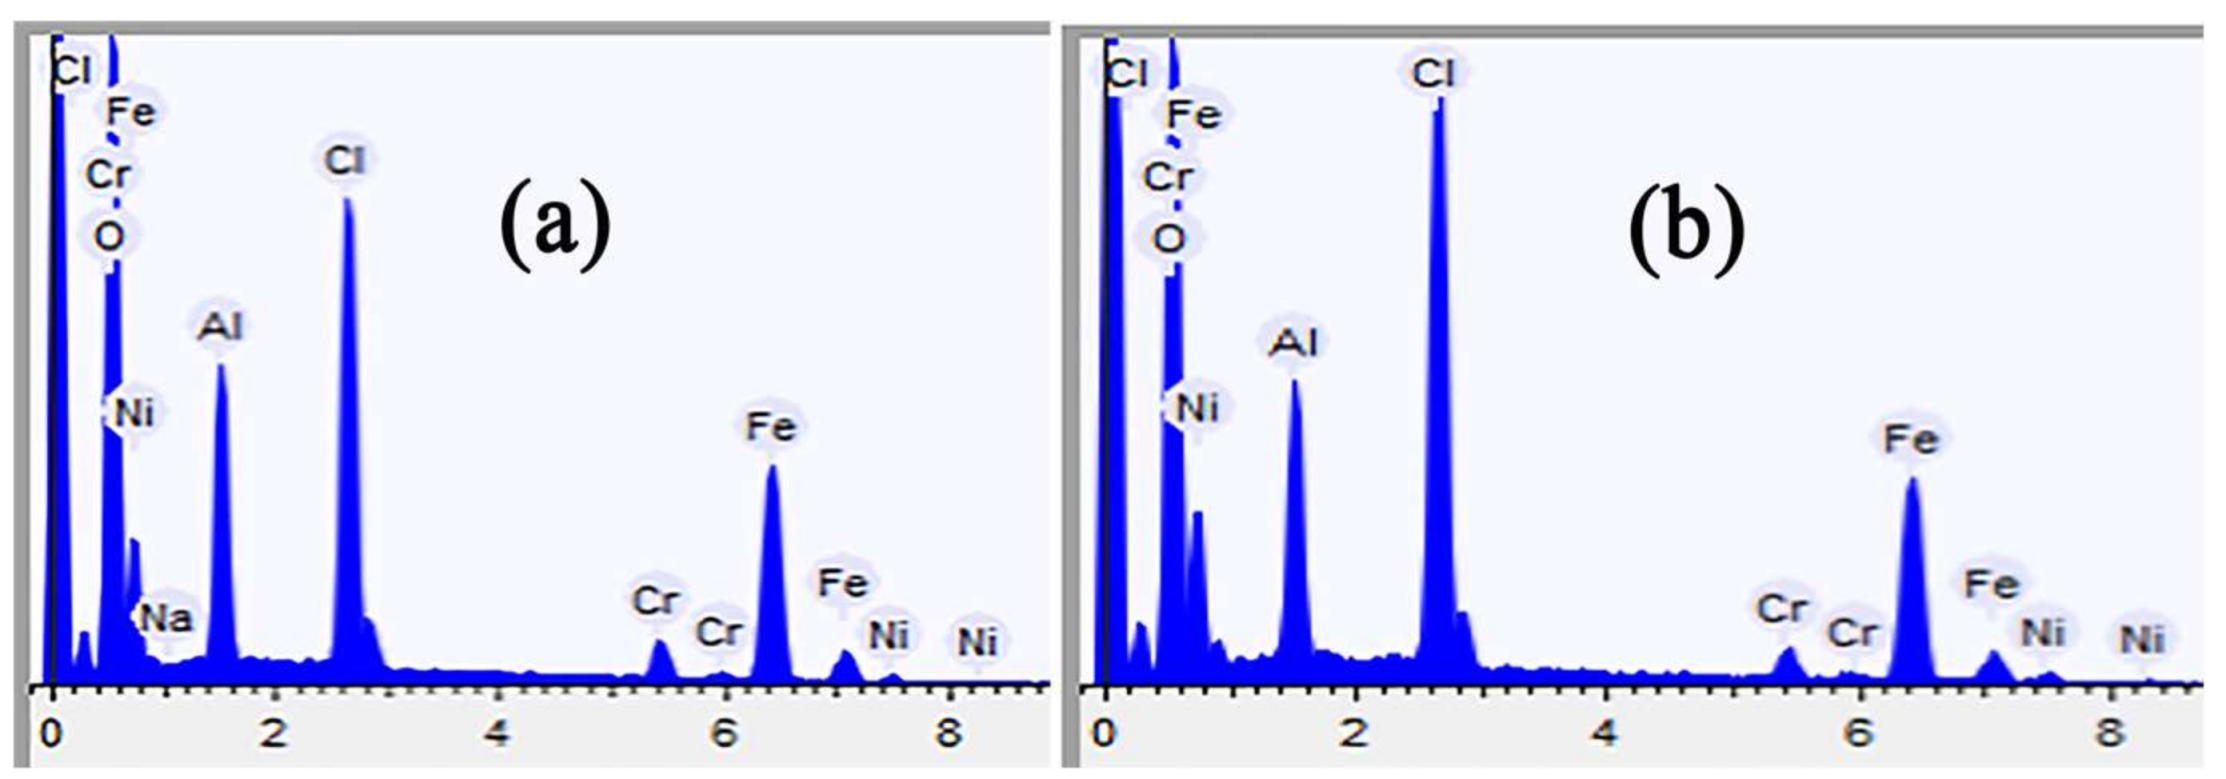
Figure 6 shows the surface morphologies of Al2O3 coating after being immersed in still 3.5 wt % NaCl solution at (35 ± 2) °C for 5, 10, 20 and 30 days. When immersed in 3.5 wt % NaCl solution for 5 days, there were more pores on the Al2O3 coating surface, thus the corrosion medium could permeate into the coating more easily than as-sprayed Al2O3 coating. Rust staining was discovered on the 10th day, and then rust staining became larger. Because of the dissolution of CO2 gas in air, the pH value of the solution was below 7, and the swell was caused by the generation of hydrogen during the corrosion process. Figure 7 shows the surface morphologies of coatings after being immersed 30 days, the Al2O3 coating appeared obvious rusty spot, but there was no rusty spot on Ca2SiO4 coating. Figure 8 shows the EDS analysis of the region marked with a yellow rectangle in Figure 6, the rust staining contains Fe, Ni, Cr and Cl elements. It is indicated that the corrosive medium penetrated into the metal substrate and the substrate suffered from corrosion.
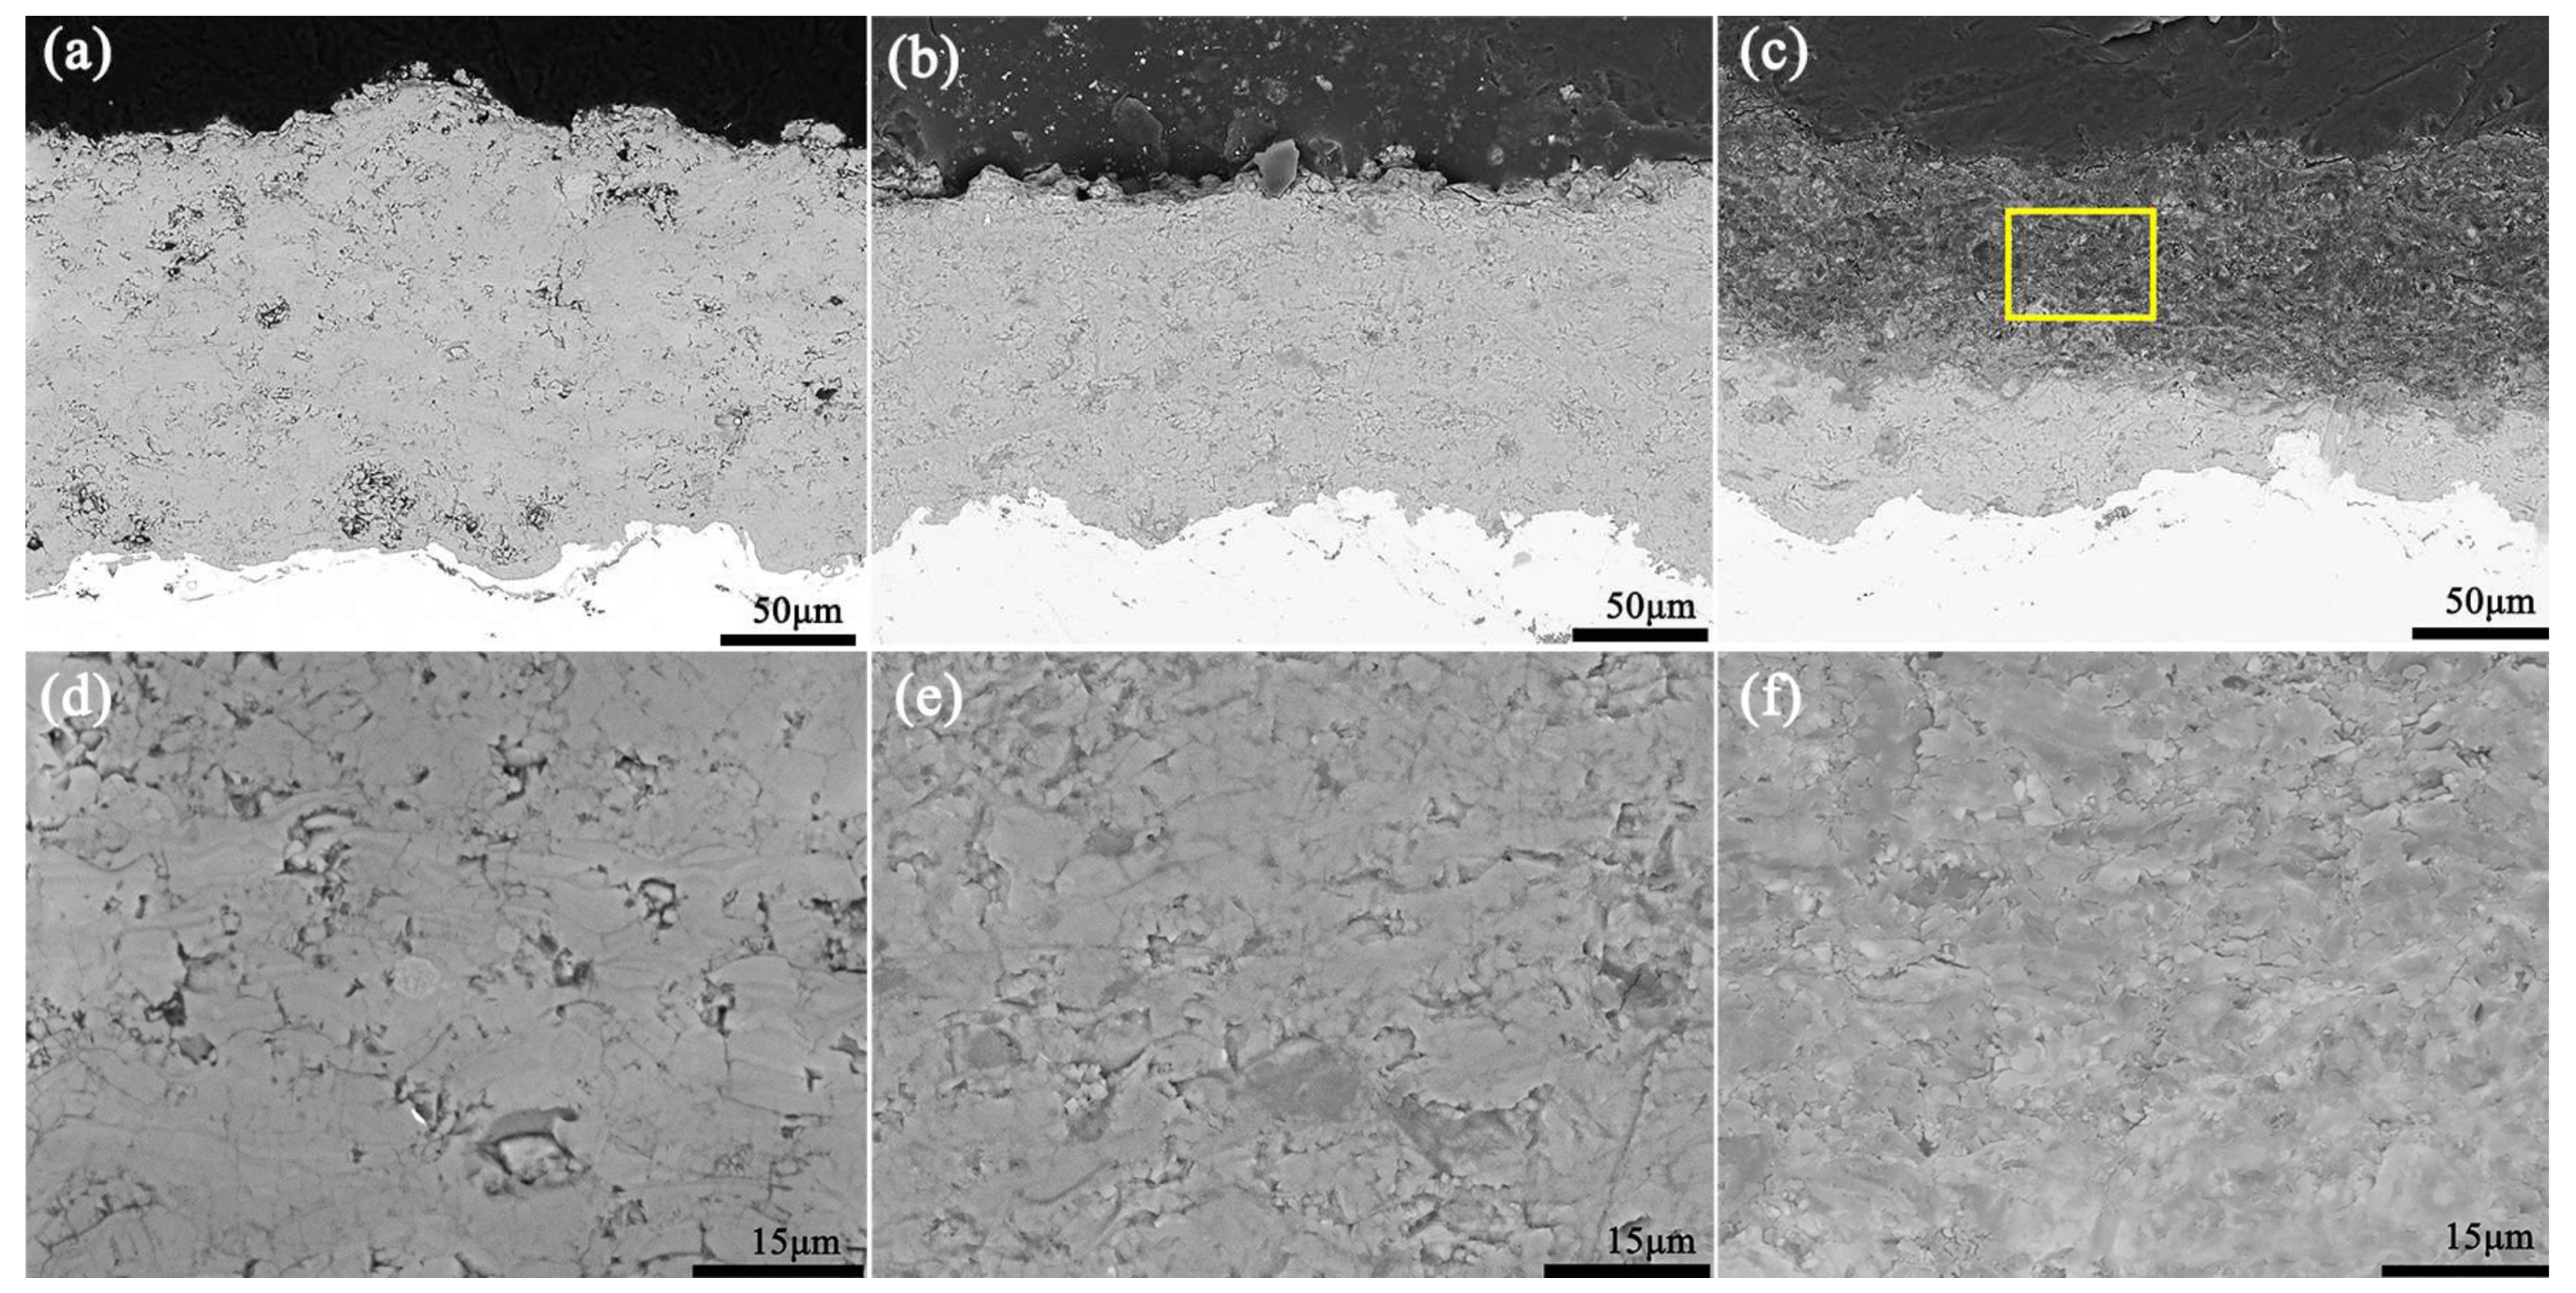
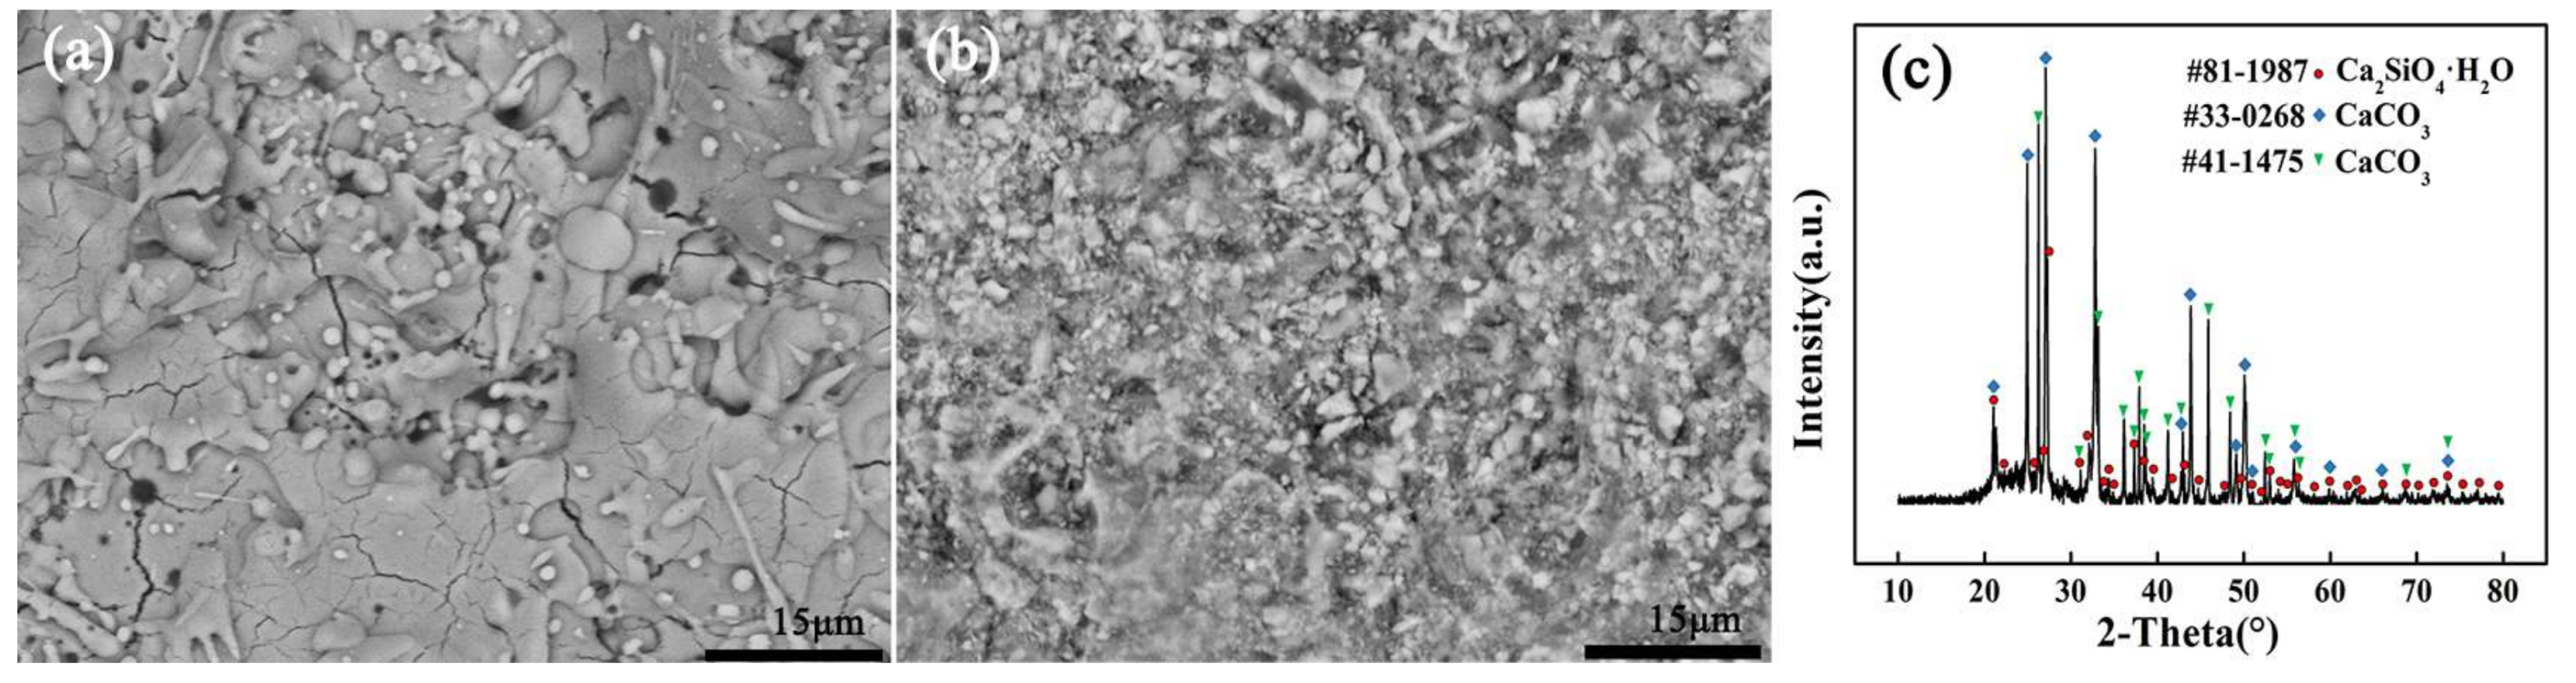
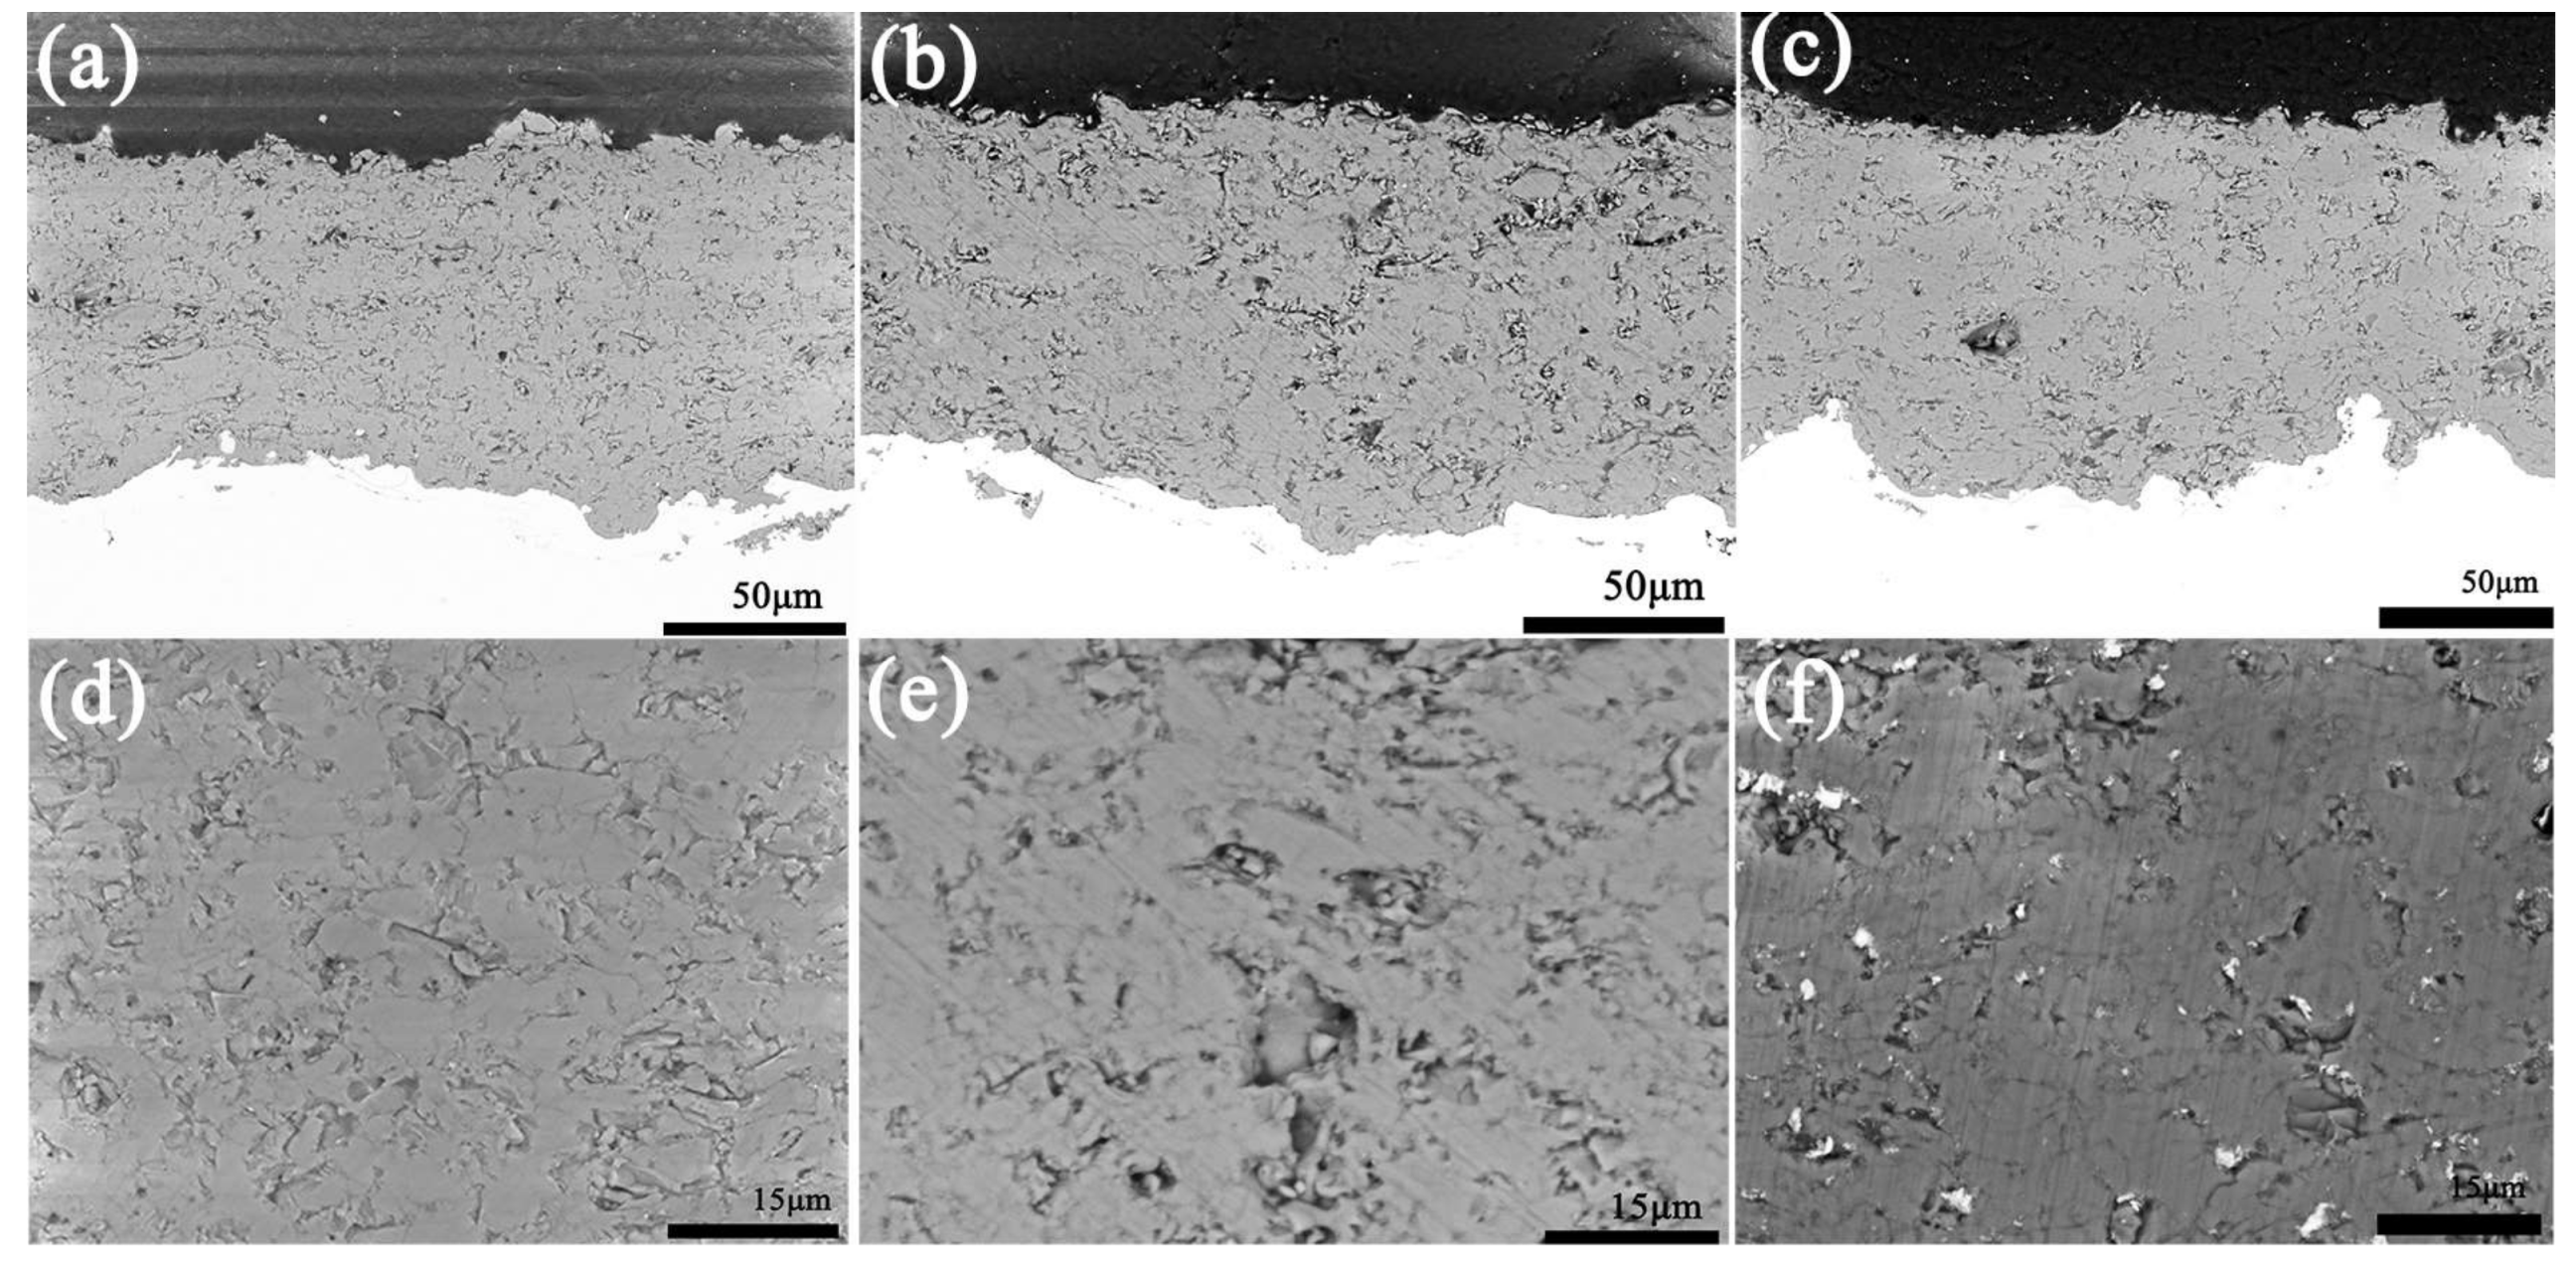
Figure 9 shows the cross-section images of the Ca2SiO4 coating after being immersed for different times. In order to present the hydration area of the Ca2SiO4 coating, the morphology of the yellow box in Figure 9c is shown in Figure 9f. The bottom figures, Figure 9d–f, are the same as the top ones with higher magnification. From Figure 9, the porosity of as-sprayed coating was 6.05%, C2S-10 was 3.05%, and C2S-30 was 1.10%. The porosity of C2S coating was reduced after being immersed. Figure 10 also shows the change of coating surface. It was evident that the pore became smaller and the cracks became less after immersion for 30 days. Figure 10 shows that hydration products C–S–H gel formed during the immersion test, and the pores and micro cracks were filled with C–S–H gel.
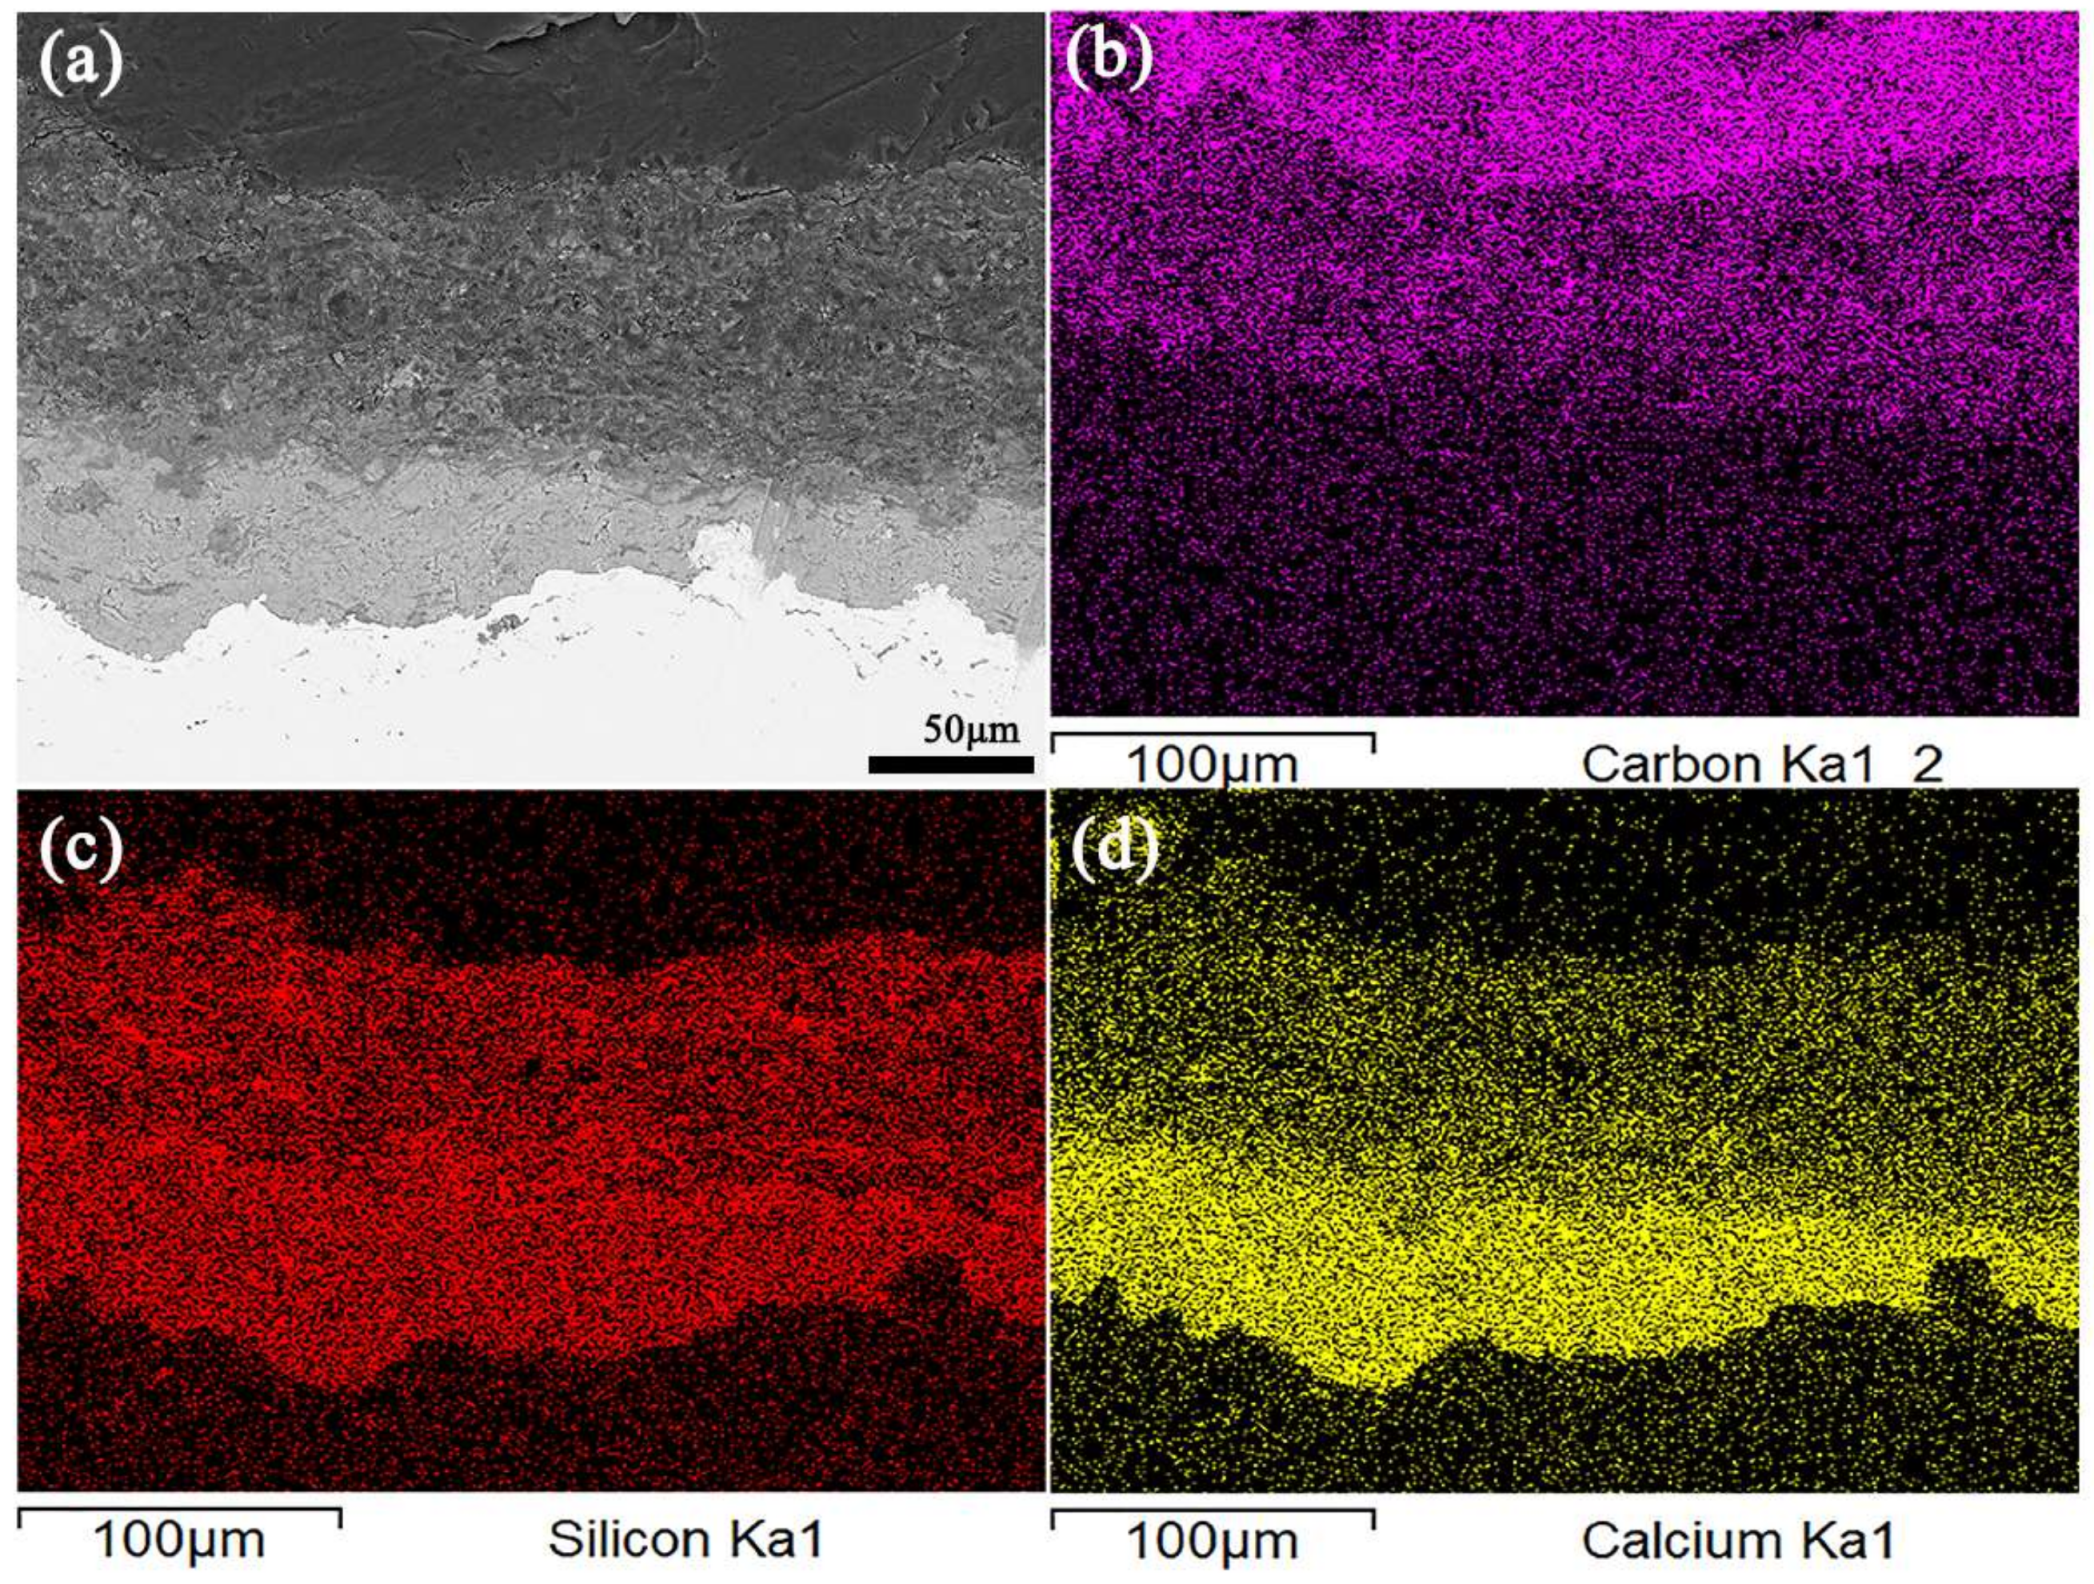
In Figure 11, it is obvious that hydration phenomenon occurred at the top of 80–110 μm thickness of the coating after being immersed for 30 days. The CO2 gas in air dissolved in NaCl solution to form CO32− or HCO3−. They reacted with Ca(OH)2 and CaCO3 crystal was formed at the coating surface. When the corrosion medium containing CO32− or HCO3− penetrated into the internal of the coating, C2S-30 showed carbon element enrichment at the top of 80–110 μm thickness.
As shown in Figure 12, during the immersion, the internal of Al2O3 coatings becomes looser and more porous. The porosity of as-sprayed coatings was 8.85%, which increased to 10.14% after immersion for 10 days and then to 12.36% after 30 days. Corrosion products were observed in Al2O3-30 coatings. The bond strength of Ca2SiO4 coating and Al2O3 coating after being immersed in 3.5 wt % NaCl solution for 12 days were 25.0 ± 3.5 MPa and 20.5 ± 3.5 MPa, respectively. The bond strength of C2S-12 and Al2O3-12 were lower than that in as-sprayed Ca2SiO4 coatings and Al2O3 coating.
From Figure 9 and Figure 12, it is concluded that Ca2SiO4 coating becomes denser, the micro cracks and pores are filled with hydration products, such as C–S–H gel and CaCO3. The dense internal structure is beneficial in isolating the metal substrate from the corrosive medium. Al2O3 coating becomes loose and porous after being immersed for 30 days. Corrosion medium attacked the metal substrate under Al2O3 coating.
3.3. Potentiodynamic Polarization
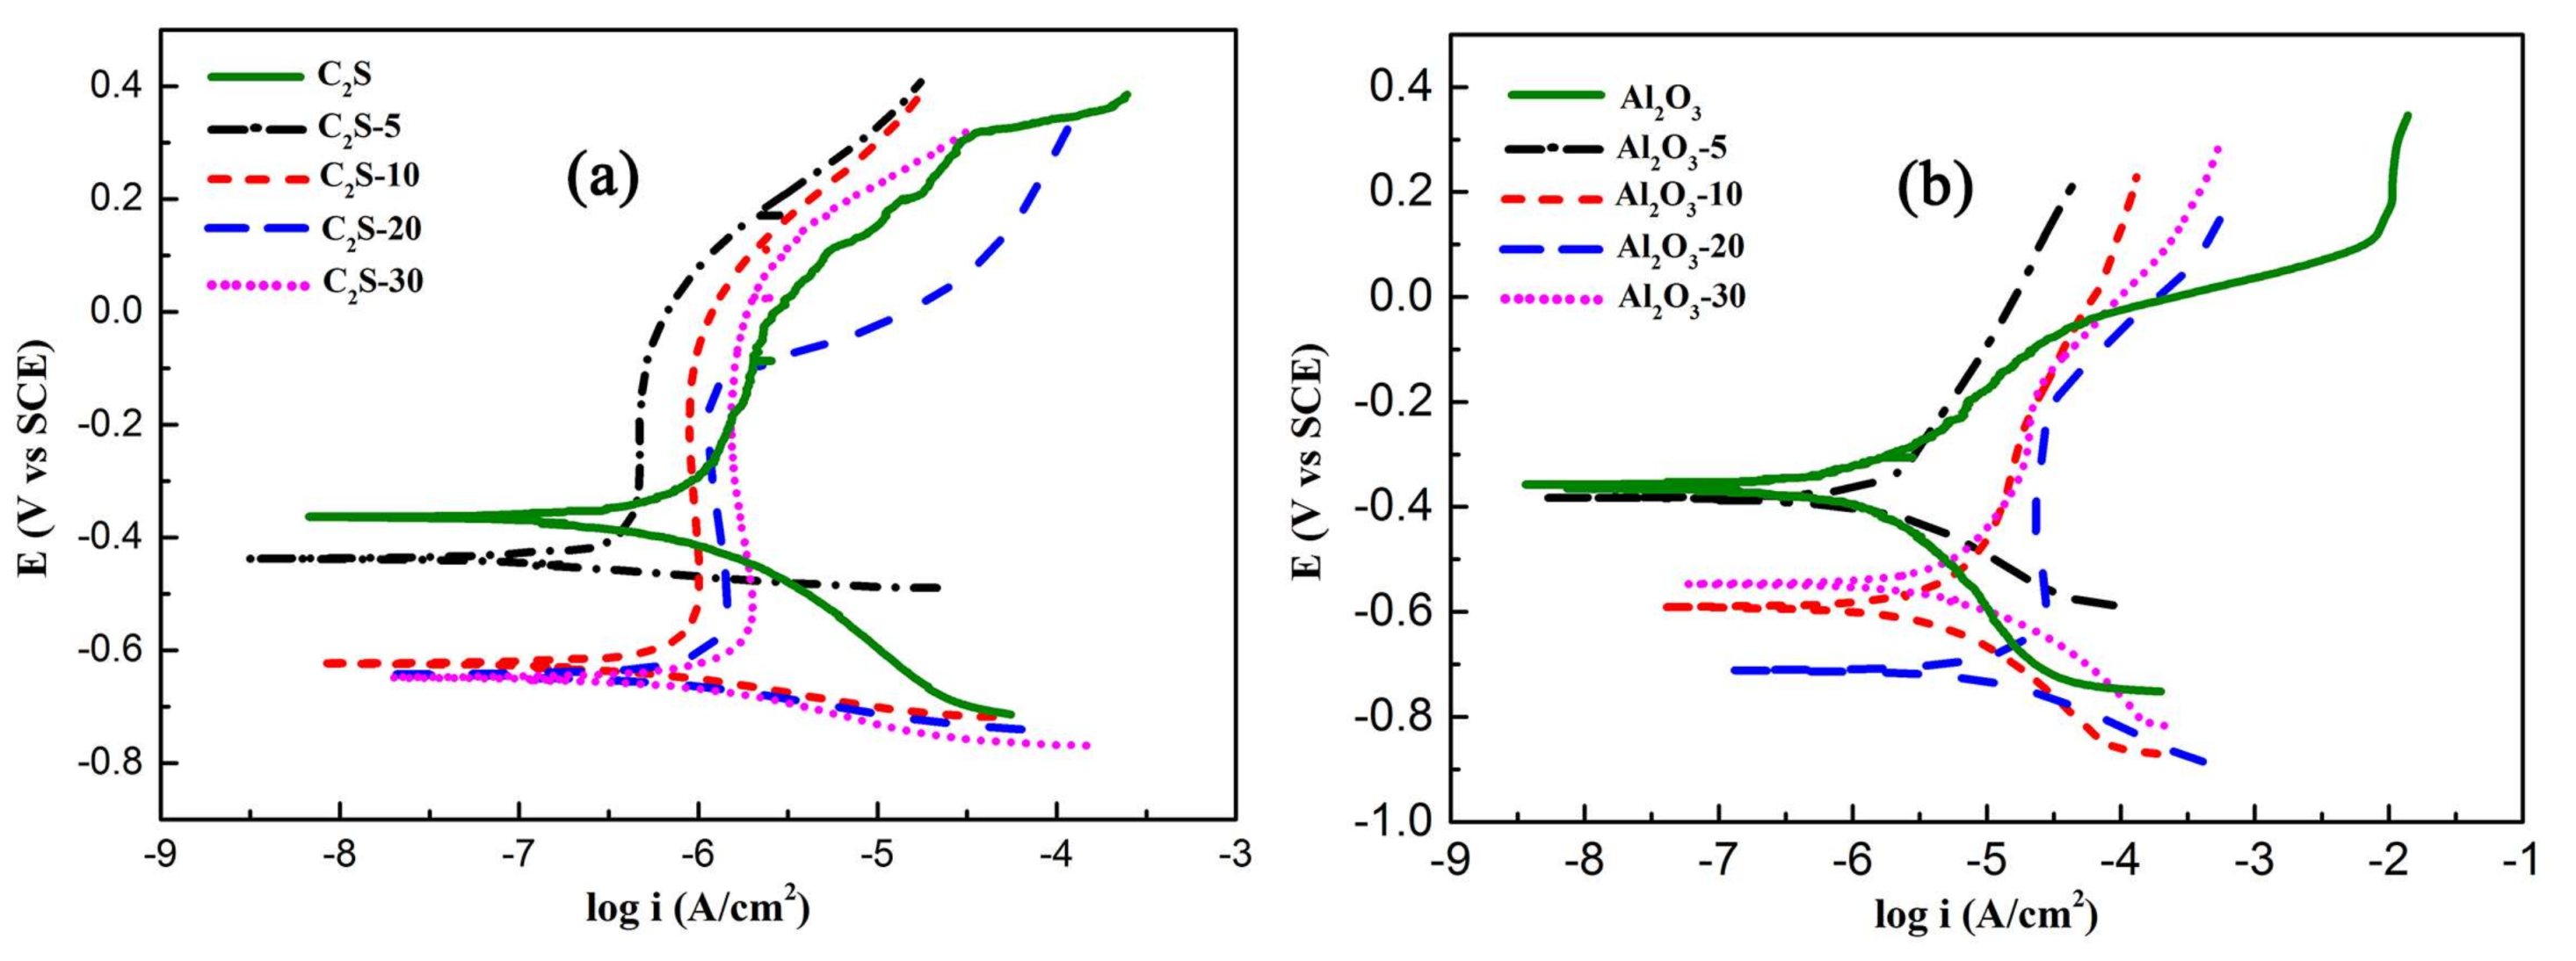
Figure 13 shows the potentiodynamic polarization curves of Ca2SiO4 coatings and Al2O3 coatings after being immersed in still 3.5 wt % NaCl solution at (35 ± 2) °C for 0, 5, 10, 20 and 30 days. The corrosion parameters for the tested electrodes are given in Table 2. Icorr was a key parameter to evaluate the kinetics of the corrosion reaction, which was inversely proportional to the corrosion protection. The polarization resistance (Rp) is calculated as the slope of the E vs. I graph near the Ecorr. The polarization resistance (Rp) value of the electrodes was calculated according to the formula:
The Icorr value of as-sprayed Ca2SiO4 coating was 1.24 μA/cm2, then decreased to 0.227 μA/cm2 after being immersed for 5 days. The Icorr value of C2S-30 was 1.61 μA/cm2. The Rp value of as-sprayed Ca2SiO4 coating was 39.53 kΩ·cm2, after being immersed, Rp value of C2S-5 went up to 81.38 kΩ·cm2, the Rp value of C2S-30 was 23.11 kΩ·cm2. The Icorr value of as-sprayed Al2O3 coating was 0.219 μA/cm2. The Icorr of Al2O3 coating went up sharply after being immersed, the Icorr value of Al2O3-20 was 25.5 μA/cm2, the Icorr value of Al2O3-30 was 9.13 μA/cm2, and it was larger than that of C2S coating. The Rp value of as-sprayed Al2O3 coating was 91.22 kΩ·cm2, after being immersed Rp value of Al2O3-5 went down sharply to 23.08 kΩ·cm2, the Rp value of Al2O3-30 was 6.91 kΩ·cm2.
When immersed for 30 days, the corrosion current density of Ca2SiO4 coatings increased slightly. For Ca2SiO4 coating, at the first 20 days, the corrosive medium penetrated to the metal substrate to promote the formation of passive film, which suppressed the corrosion process, but the passive film did not cover the whole metal surface. With the increasing immersion time, more solution arrived at substrate to induce pitting; therefore, the corrosion resistance of C2S-30 reclined. Polarization curves show the shifting of corrosion potential (Ecorr) towards more negative potential with increasing immersed time, indicating that immersed coatings preferentially inhibit the cathodic process.
From Figure 13a, Ca2SiO4 coatings show obvious passivation phenomenon. Ca2SiO4 coatings released a lot of Ca(OH)2 into NaCl aqueous solution. The solution was alkaline and the pH was above 8.0, although the dissolution of CO2 gas in air may decrease the pH value. The alkaline environment was in favor of the formation of passivation film [23]. Therefore, Ca2SiO4 coating promoted the formation of passivation film and passivation film could protect the metal from corrosion effectively. Only Al2O3-20 showed the passive behavior for Al2O3 coating. The passivation film might form partly. On the other hand, pitting corrosion occurred easily when the Al2O3 coating was loose. So, the corrosion current density was very large, the Rp was very low. For Al2O3-30, the corrosion product possibly blocked up the crack and pores in the coating, the corrosion rate reclined and current became lower; Rp increased to 6.36 kΩ·cm2. From the potentiodynamic polarization curves and corrosion parameters of Ca2SiO4 and Al2O3 coatings, it could be concluded that Ca2SiO4 coating was more corrosion-resistant than Al2O3 coating.
3.4. Electrochemical Impedance Spectroscopy
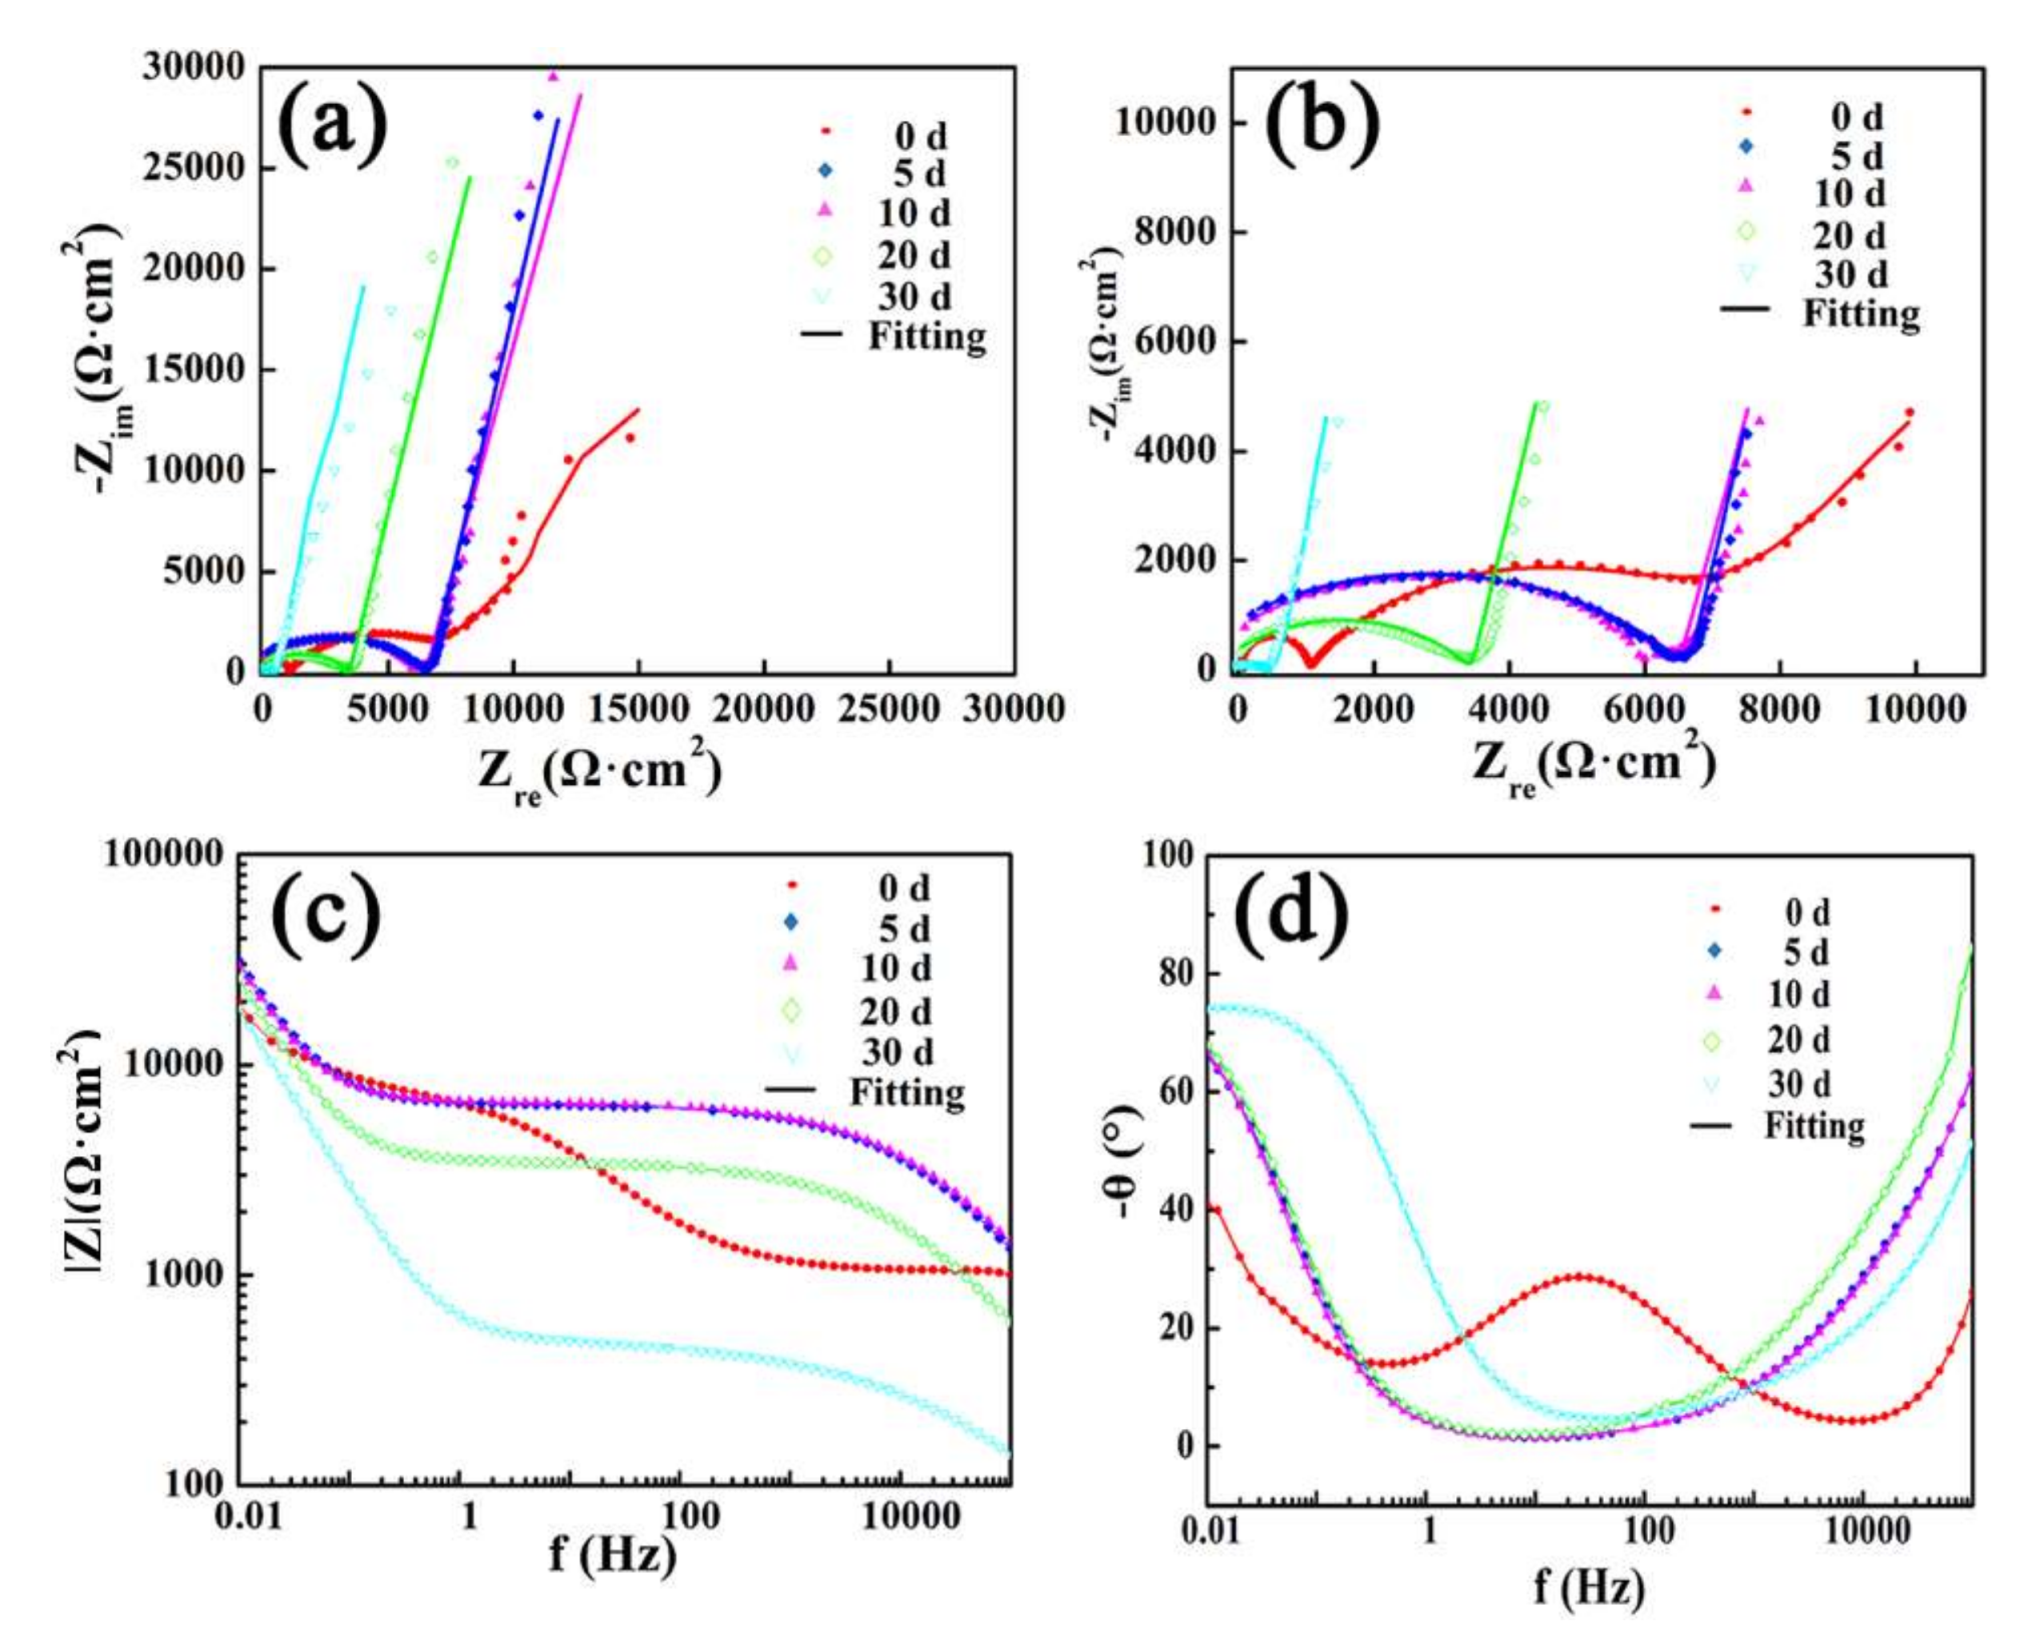
Figure 14 shows the EIS plots of Ca2SiO4 coatings after immersion. There was a depressed semi-circle at the high frequencies, it indicated that a CPE was placed in parallel to a resistor. The diameter of the semi-circle increased at the initial 10 days, then decreased with the increase of immersion time. At low frequencies, there was a line.
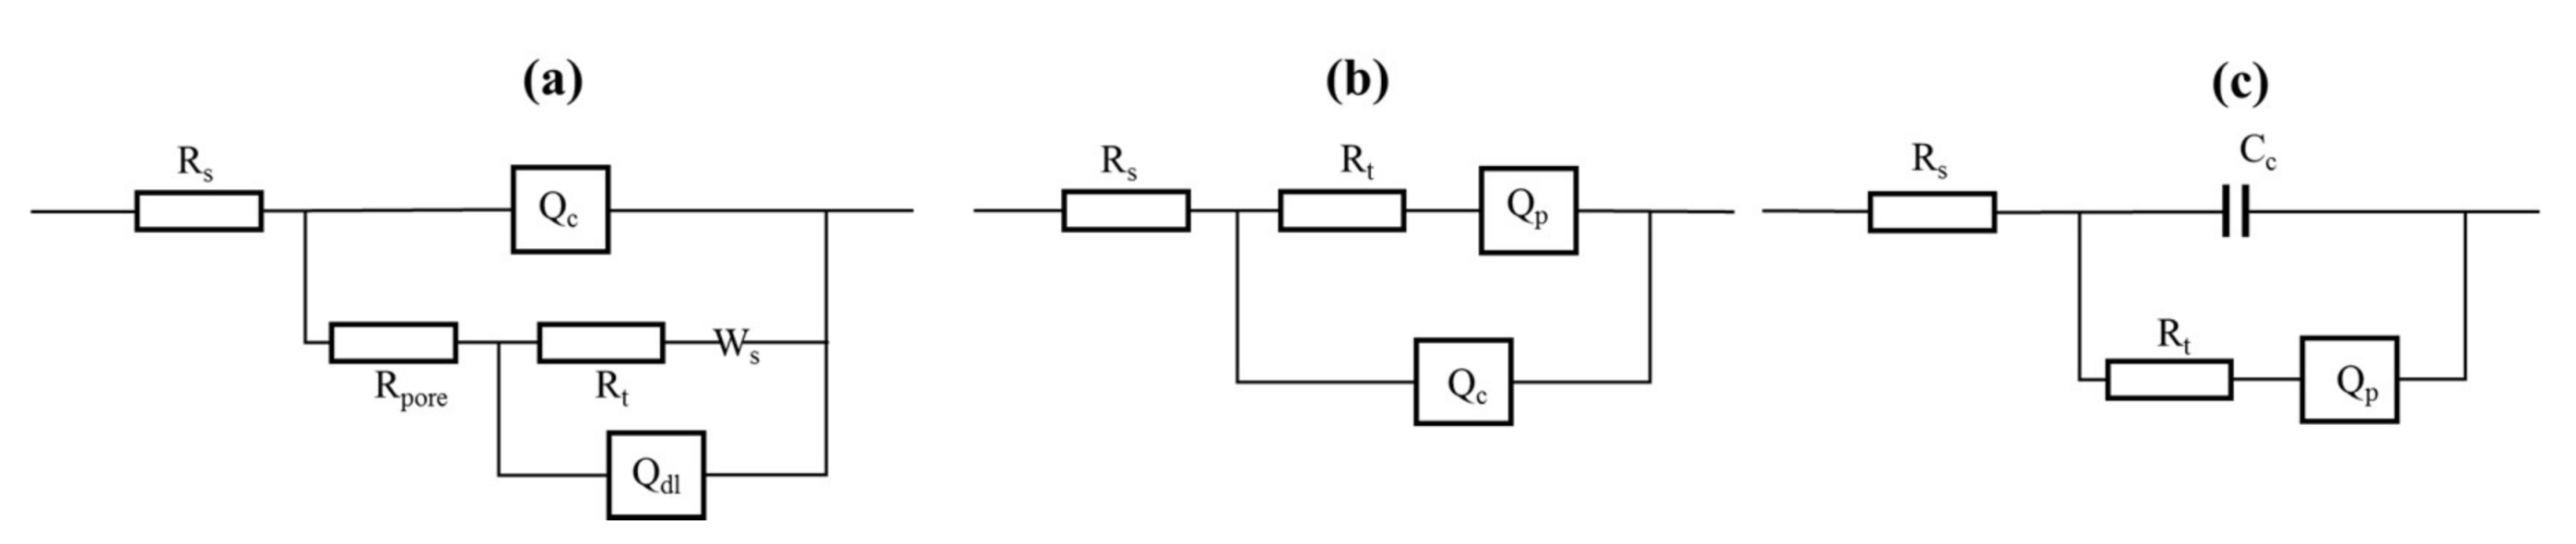
In Figure 14, the points present the actual data recorded by the test system, and the solid lines represent fitting data. Furthermore, the lines fit the actual data very well. The equivalent circuits of Ca2SiO4 coating are given in Figure 15. As shown in Figure 15, Rs is the resistance of solution; Rt is the resistance of the charge transfer. The greater the Rt, the better corrosion-resistance. Rpore indicates the protective ability of coating, the higher porosity and larger pores would cause low Rpore; Qc represents the constant phase element of coating; Qdl is the double-layer capacitance between substrate and coating interface; Qp represents the constant phase element of passive film; a capacitor is more suitable for the actual Ca2SiO4 coating at the last 30 days, and Cc is the capacitance of coating; Ws is a closed-loop diffusion-related element of Warburg impedance, it is used to represent the finite layer diffusion resistance.
For as-sprayed Ca2SiO4 coating, the Nyquist plot could be divided into three parts, two depressed semi-circles at high frequencies and a line at low frequencies. The first small depressed semi-circle was produced as Qc was placed in parallel to Rpore [24], and the second large depressed semi-circle was produced as Qdl was placed in parallel to Rt, the line is produced by Ws. The equivalent circuits for as-sprayed Ca2SiO4 coating are shown in Figure 15a. After immersion, passivation film was formed on the substrate, the equivalent circuit was changed, only one capacitive reactance arc occurred. For immersed Ca2SiO4 coating, as shown in Figure 15b, the high-frequencies capacitive reactance arc presents Rt in parallel with the Qc; and at low frequencies, the plots show the character of passivation film [24]. In Figure 14b, the diameter of the high-frequencies capacitive reactance loop increased at the initial 10 days, then decreased with the increase of immersion time, it indicated that the Rt became larger firstly and decreased as the corrosion medium penetrated to the internal of coatings.
The corrosion parameters of Ca2SiO4 and Al2O3 coatings after being immersed in 3.5 wt % NaCl solution for different times are shown in Table 3. For Ca2SiO4 coating, the Rt value of C2S was 6288 Ω, then it went up after being immersed, Rt value of C2S-5 was 7319 Ω, Rt value of C2S-10 was 7759 Ω, but it finally went down to 420.6 Ω. At the first 10 days, the corrosive medium penetrated to the metal substrate to promote the formation of passive film, which suppressed charge transfer, giving rise to the Rt value. The passive film did not cover the whole metal surface, with the increasing immersion time, more solution arrived at substrate to induce pitting, the value of Rt went down [25]. At the last 30 days, the value of Rt was just 420 Ω, which might mean the resistance of solution in the pit. The electrochemical impedance spectroscopies in Figure 14a are lines with different slopes at low frequencies, which represents the great diffusion resistance of corrosive medium. The larger slope means better capacitive character. The slope is presented by the value of Qp-p. When the value of Qp-p was closer to 1.0, the passivation film was denser and thicker. From Table 3, the value of Qp-p went up and was closer to 1.0 after being immersed; it is concluded that the passivation film is more like a pure capacitance to hinder the pass of electronic, indicating better corrosion resistance [25]. From Figure 14c, it was shown that at 0.01 Hz, the values of impedance modulus increased after immersion, which was consistent with the lines length of EIS at low frequencies in Figure 14a. If the constant phase element is a pure capacitance, its phase angle will be 90°, and in Figure 13d, the phase angle went up and was more and more close to 90°, which presents the good capacitance of passive film. The change of phase angle was consistent with the value of Qp-p.
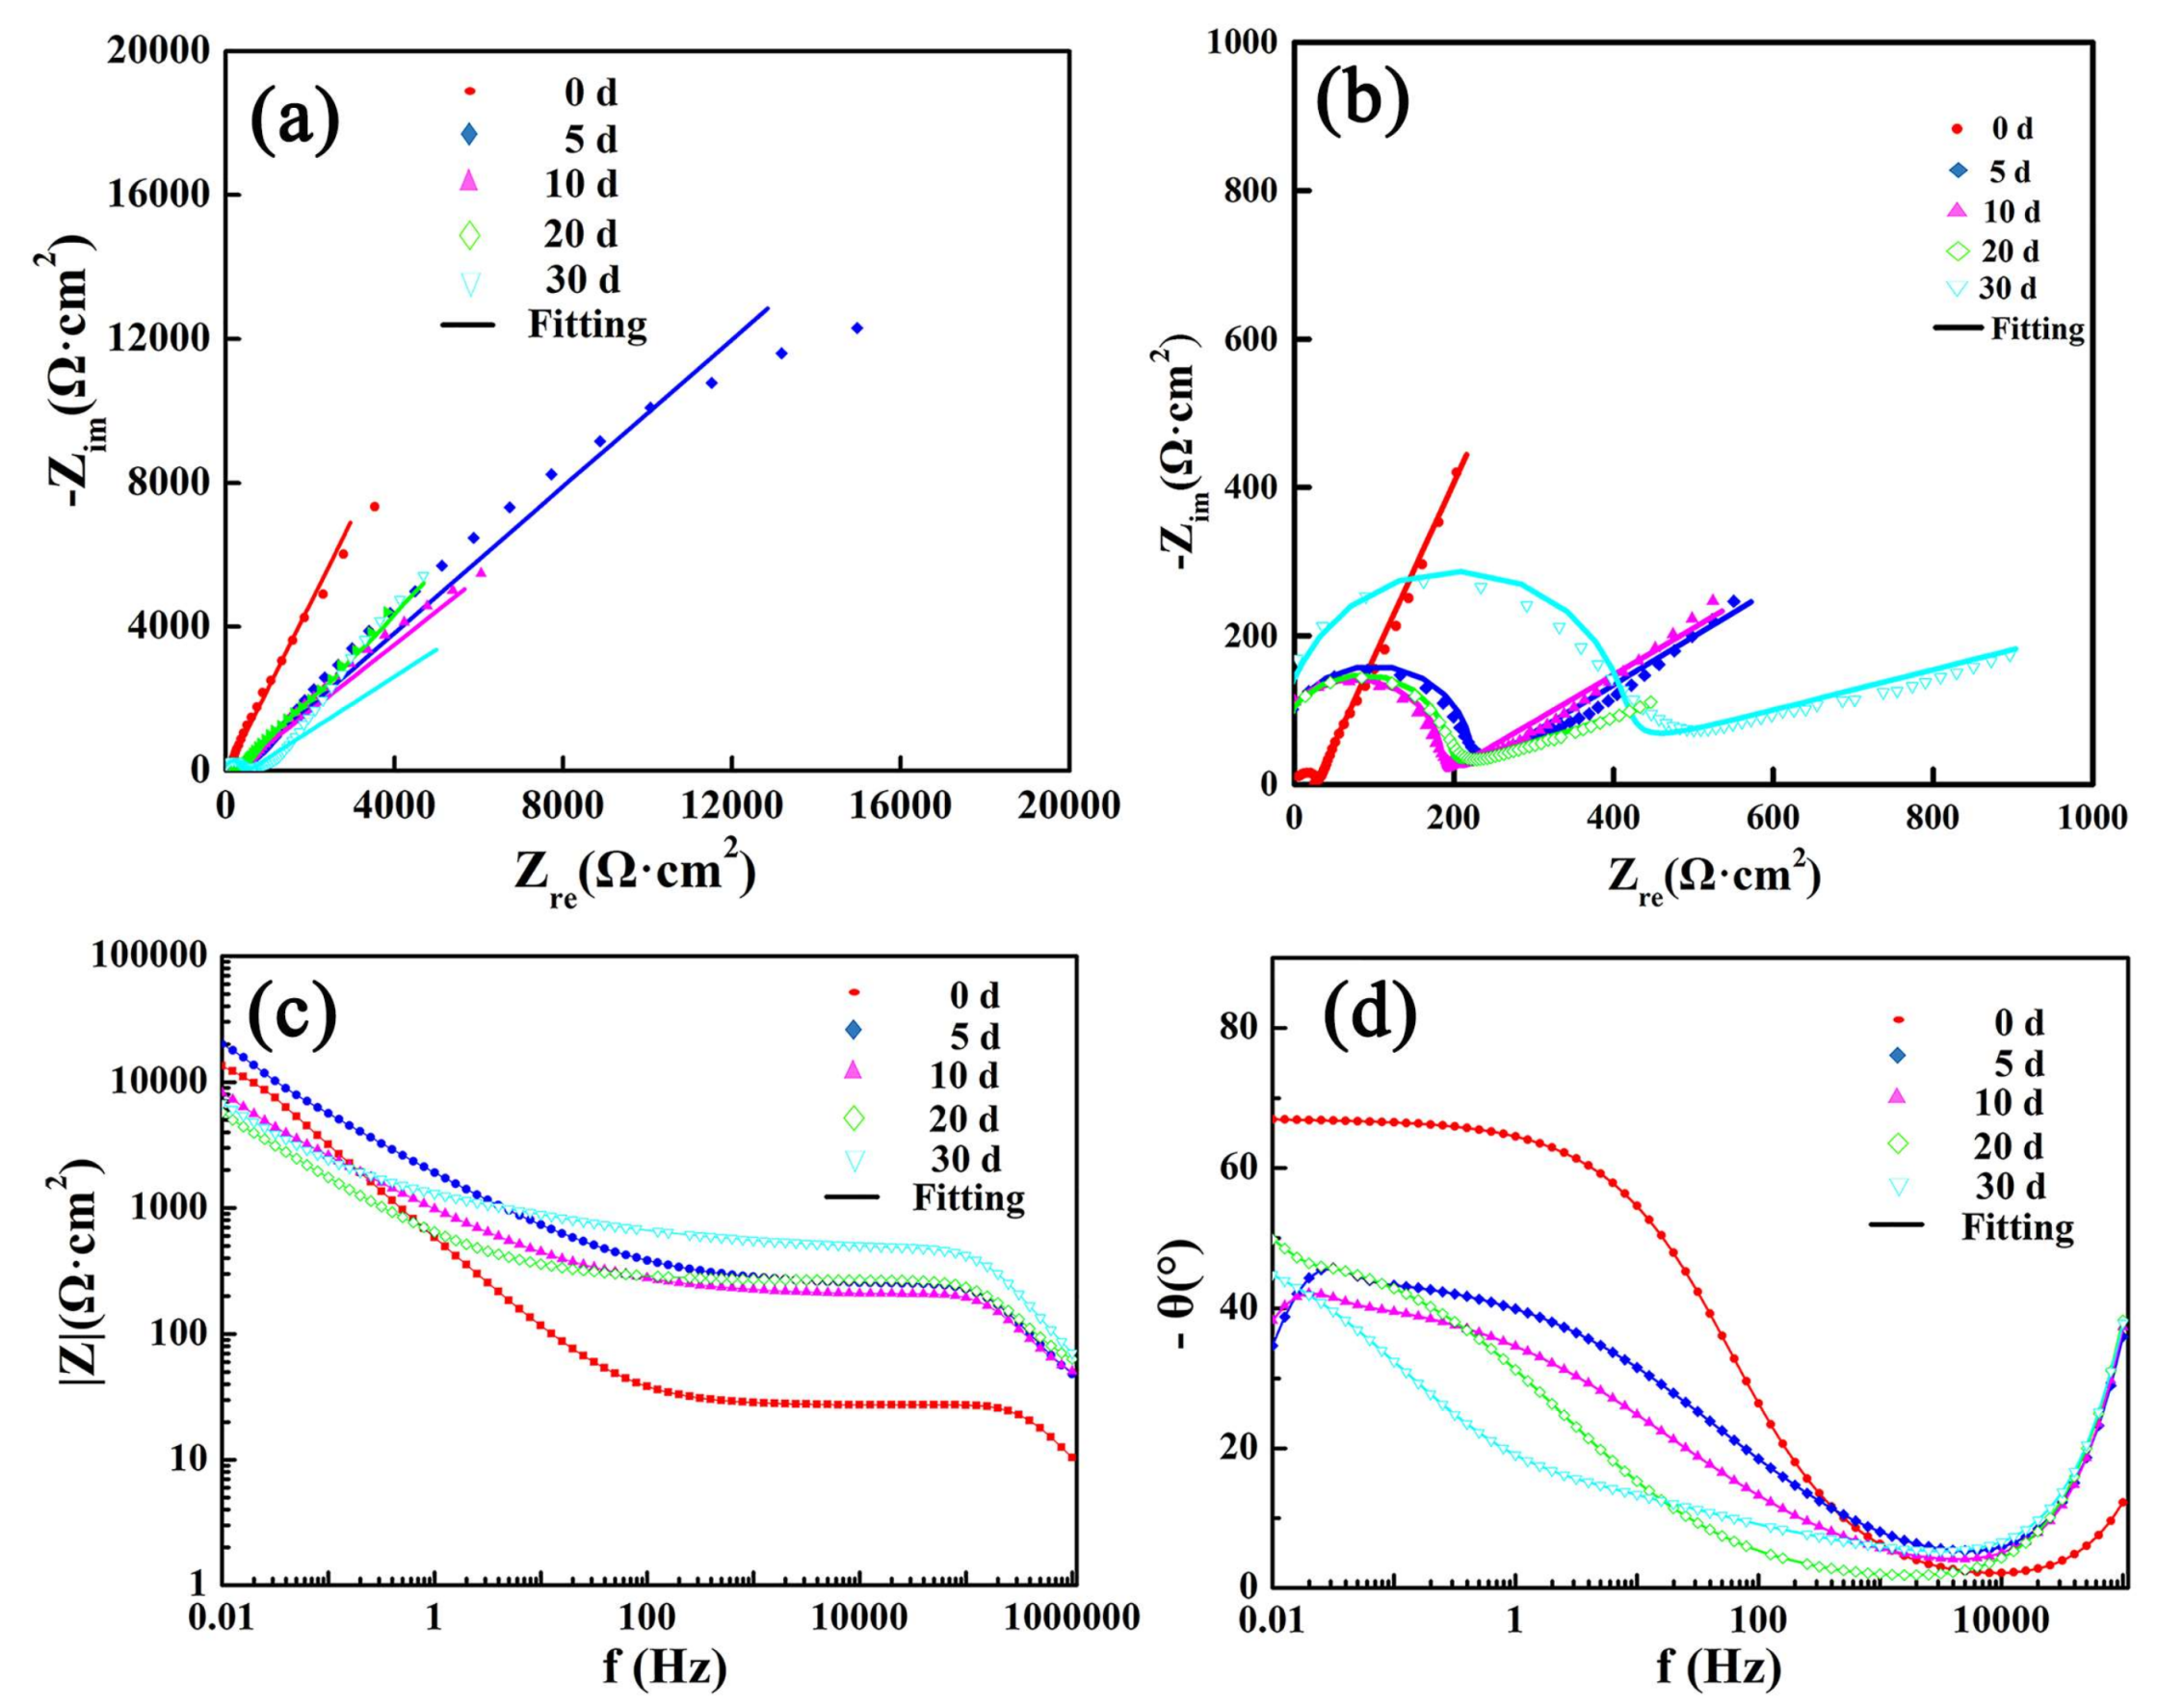
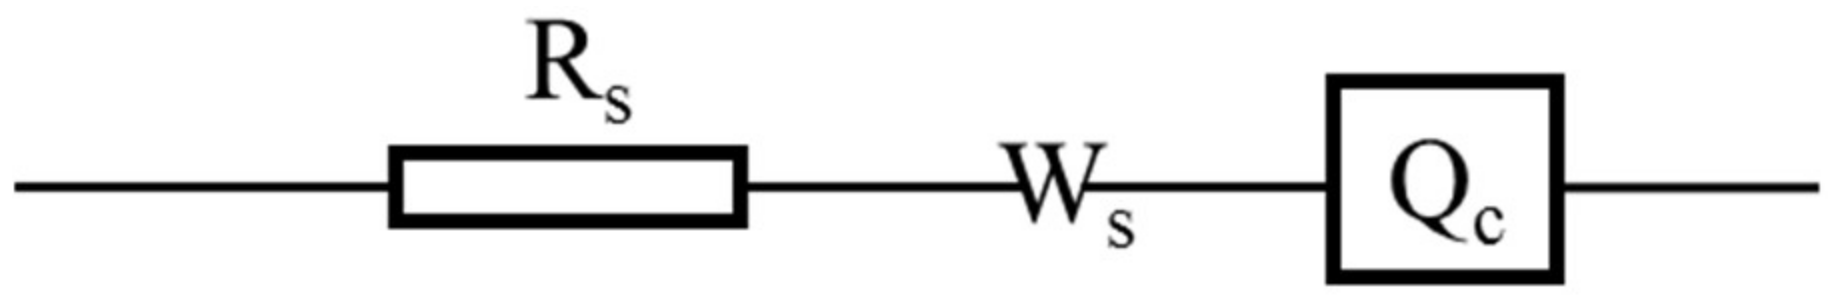
The EIS results of Al2O3 coatings are presented in Figure 16. Figure 17 shows the equivalent circuits of Al2O3 coatings for different time. Qc represents the constant phase element of coating; and Ws is a closed-loop diffusion related element of Warburg impedance. For Al2O3 coating, the high-frequencies capacitive reactance arc represents the resistance of Ws as shown in Figure 17. In Figure 16b, the diameter of the high-frequencies capacitive reactance loop was increased with the immersed time indicating that the resistance of Ws enlarged. The Ws value of as-sprayed Al2O3 coating was 32.45 Ω, and it went up after being immersed. Ws value of Al2O3-5 was 253.4 Ω, Ws value of Al2O3-30 was 414.0 Ω. It might be attributed to the fact that corrosion products blocked the diffusion channel in coatings [26]. In Figure 16b, at low frequencies, Nyquist plots of Al2O3 coatings also present lines indicating the diffusion resistance of corrosive medium. From Table 3, the value of Qc-p went down, the Qc-p value of as-sprayed Al2O3 was 0.726, Qc-p value of Al2O3-5 was 0.506, and it finally went down to 0.411. It was concluded that Al2O3 coating became loose and porous. The protection performance of Al2O3 coating is weakened. In Figure 16d, the phase angle went down with the increasing immersed time, which was consistent with the change of the value of Qc-p.
4. Conclusions
From the results of the above investigation, it is concluded that Ca2SiO4 coating shows a better corrosion resistance than Al2O3 coating. Ca2SiO4 coatings released Ca(OH)2 in NaCl solution to promote the formation of calcium carbonate crystal and passivation film. The crystal structure and grain size of calcium carbonate might be affected by the concentration of Ca2+ and CO32− in the solution, and the low supersaturation of solution made the crystal growth predominant. Therefore, the size of calcium carbonate particles on Ca2SiO4 coating was larger than that in other studies. Passivation film would prevent the corrosive medium from metal substrate, and EIS showed that the passive film became denser and thicker with the increase of immersion time, and the passivation film was like a pure capacitance to hinder the pass of electron, indicating better corrosion resistance. The pores and micro cracks in Ca2SiO4 coatings were filled with hydration products C–S–H gel to make the coating denser. The corrosion current density of Al2O3 coatings went up sharply after being immersed, and the microstructure became looser and porous with obvious rusty spots during the immersion test.
Acknowledgments
This work was supported by the National Natural Science Foundation (NSFC) under Grant No. 51701235. Simultaneously, we are grateful to Shigang Xin and Yuzhi Zhang for providing the support for this work.
Author Contributions
Shunyan Tao, Fang Shao and Yuan Xiao conceived and designed the experiments; Yin Zhuang, Jinxing Ni and Huayu Zhao sprayed the coatings; Yuan Xiao and Fang Shao performed the corrosion experiments and analyzed the data; Yuan Xiao wrote the paper.
Conflicts of Interest
The authors declare no conflict of interest.
References
- Shehadeh, M.; Hassan, I. Study of sacrificial cathodic protection on marine structures in sea and fresh water in relation to flow conditions. Ships Offshore Struct. 2013, 8, 102–110. [Google Scholar] [CrossRef]
- Soares, C.G.; Garbatov, Y.; Zayed, A.; Wang, G. Influence of environmental factors on corrosion of ship structures in marine atmosphere. Corros. Sci. 2009, 51, 2014–2026. [Google Scholar] [CrossRef]
- Huang, J.; Liu, Y.; Yuan, J.; Li, H. Al/Al2O3 composite coating deposited by flame spraying for marine applications: Alumina skeleton enhances anti-corrosion and wear performances. J. Therm. Spray Technol. 2014, 23, 676–683. [Google Scholar] [CrossRef]
- Jiang, Q.; Miao, Q.; Liang, W.P.; Ying, F.; Tong, F.; Xu, Y.; Ren, B.L.; Yao, Z.J.; Zhang, P.Z. Corrosion behavior of arc sprayed Al–Zn–Si–RE coatings on mild steel in 3.5 wt % NaCl solution. Electrochim. Acta 2014, 115, 644–656. [Google Scholar] [CrossRef]
- Grundmeier, G.; Schmidt, W.; Stratmann, M. Corrosion protection by organic coatings: Electrochemical mechanism and novel methods of investigation. Electrochim. Acta 2000, 45, 2515–2533. [Google Scholar] [CrossRef]
- Zhang, C.; Chan, K.C.; Wu, Y.; Liu, L. Pitting initiation in Fe-based amorphous coatings. Acta Mater. 2012, 60, 4152–4159. [Google Scholar] [CrossRef]
- Tian, W.; Wang, Y.; Zhang, T.; Yang, Y. Sliding wear and electrochemical corrosion behavior of plasma sprayed nanocomposite Al2O3–13% TiO2 coatings. Mater. Chem. Phys. 2009, 118, 37–45. [Google Scholar] [CrossRef]
- Goberman, D.; Sohn, Y.H.; Shaw, L.; Jordan, E.; Gell, M. Microstructure development of Al2O3–13 wt % TiO2 plasma sprayed coatings derived from nanocrystalline powders. Acta Mater. 2002, 50, 1141–1152. [Google Scholar] [CrossRef]
- Li, G.; Zhang, A.; Song, Z.; Shi, C.; Wang, Y.; Zhang, J. Study on the resistance to seawater corrosion of the cementitious systems containing ordinary Portland cement or/and calcium aluminate cement. Constr. Build. Mater. 2017, 157, 852–859. [Google Scholar] [CrossRef]
- Al-Amoudi, O.S.B. Attack on plain and blended cements exposed to aggressive sulfate environments. Cement Concrete Comp. 2002, 24, 305–316. [Google Scholar] [CrossRef]
- Taylor, H.F.W. Chemical methods. In Cement Chemistry, 2nd ed.; Thomas Telford: London, UK, 1997; Volume 6, pp. 142–152. [Google Scholar]
- Fauchais, P. Understanding plasma spraying. J. Phys. D Appl. Phys. 2004, 37, R86. [Google Scholar] [CrossRef]
- Liu, X.; Tao, S.; Ding, C. Bioactivity of plasma sprayed dicalcium silicate coatings. Biomaterials 2002, 23, 963–968. [Google Scholar] [CrossRef]
- ASTM C-633 Standard Test Method for Adhesion or Cohesive Strength of Flame-Sprayed Coatings; ASTM International: West Conshohocken, PA, USA, 2008. [CrossRef]
- Maheswaran, S.; Kalaiselvam, S.; Karthikeyan, S.S.; Kokila, C.; Palani, G.S. β-Belite cements (β-dicalcium silicate) obtained from calcined lime sludge and silica fume. Cement Concrete Comp. 2016, 66, 57–65. [Google Scholar] [CrossRef]
- Wang, Q.; Li, F.; Shen, X.; Shi, W.; Li, X.; Guo, Y.; Xiong, S.; Zhu, Q. Relation between reactivity and electronic structure for α´L-, β-and γ-dicalcium silicate: A first-principles study. Cement Concrete Res. 2014, 57, 28–32. [Google Scholar] [CrossRef]
- Bensted, J. δ-dicalcium silicate and its hydraulicity. Cement Concrete Res. 1978, 8, 73–76. [Google Scholar] [CrossRef]
- Sarikaya, O. Effect of some parameters on microstructure and hardness of alumina coatings prepared by the air plasma spraying process. Surf. Coat. Technol. 2005, 190, 388–393. [Google Scholar] [CrossRef]
- Rezagholilou, A.; Papadakis, V.G.; Nikraz, H. Rate of carbonation in cement modified base course material. Constr. Build. Mater. 2017, 150, 646–652. [Google Scholar] [CrossRef]
- Fujii, K.; Kondo, W. Rate and mechanism of hydration of β-dicalcium silicate. J. Am. Ceram. Soc. 1979, 62, 161–167. [Google Scholar] [CrossRef]
- Han, Y.S.; Hadiko, G.; Fuji, M.; Takahashi, M. Factors affecting the phase and morphology of CaCO3 prepared by a bubbling method. J. Eur. Ceram. Soc. 2006, 26, 843–847. [Google Scholar] [CrossRef]
- Hu, Z.; Deng, Y. Supersaturation control in aragonite synthesis using sparingly soluble calcium sulfate as reactants. J. Colloid Interf. Sci. 2003, 266, 359–365. [Google Scholar] [CrossRef]
- Luo, H.; Su, H.; Dong, C.; Li, X. Passivation and electrochemical behavior of 316L stainless steel in chlorinated simulated concrete pore solution. Appl. Surf. Sci. 2017, 400, 38–48. [Google Scholar] [CrossRef]
- Freire, L.; Carmezim, M.J.; Ferreira, M.A.; Montemor, M.F. The passive behaviour of AISI 316 in alkaline media and the effect of pH: A combined electrochemical and analytical study. Electrochim. Acta 2010, 55, 6174–6181. [Google Scholar] [CrossRef]
- Ye, C.Q.; Hu, R.G.; Dong, S.G.; Zhang, X.J.; Hou, R.Q.; Du, R.G.; Lin, C.J.; Pan, J.S. EIS analysis on chloride-induced corrosion behavior of reinforcement steel in simulated carbonated concrete pore solutions. J. Electroanal. Chem. 2013, 688, 275–281. [Google Scholar] [CrossRef]
- Wang, Y.; Tian, W.; Zhang, T.; Yang, Y. Microstructure, spallation and corrosion of plasma sprayed Al2O3–13% TiO2 coatings. Corros. Sci. 2009, 51, 2924–2931. [Google Scholar] [CrossRef]
Figure 1.
XRD patterns of powders (a) Ca2SiO4, (b) Al2O3, and as-sprayed coatings (c) Ca2SiO4 coating, (d) Al2O3 coating.
Figure 1.
XRD patterns of powders (a) Ca2SiO4, (b) Al2O3, and as-sprayed coatings (c) Ca2SiO4 coating, (d) Al2O3 coating.

Figure 2.
The transition temperature of five kinds of dicalcium silicate crystal [15].
Figure 2.
The transition temperature of five kinds of dicalcium silicate crystal [15].

Figure 3.
Surface morphologies of as-sprayed (a) Ca2SiO4 coating, (c) Al2O3 coating, and cross-section morphologies of as-sprayed (b) Ca2SiO4 coating, (d) Al2O3 coating.
Figure 3.
Surface morphologies of as-sprayed (a) Ca2SiO4 coating, (c) Al2O3 coating, and cross-section morphologies of as-sprayed (b) Ca2SiO4 coating, (d) Al2O3 coating.

Figure 4.
The surface morphologies of Ca2SiO4 coatings after being immersed in unstirred 3.5 wt % NaCl solution at (35 ± 2) °C: (a) C2S-5; (b) C2S-10; (c) C2S-20; (d) C2S-30.
Figure 4.
The surface morphologies of Ca2SiO4 coatings after being immersed in unstirred 3.5 wt % NaCl solution at (35 ± 2) °C: (a) C2S-5; (b) C2S-10; (c) C2S-20; (d) C2S-30.

Figure 5.
XRD patterns of Ca2SiO4 coatings after being immersed in 3.5 wt % NaCl aqueous solution: (a) C2S-5; (b) C2S-20.
Figure 5.
XRD patterns of Ca2SiO4 coatings after being immersed in 3.5 wt % NaCl aqueous solution: (a) C2S-5; (b) C2S-20.

Figure 6.
The surface morphologies of Al2O3 coatings after being immersed in unstirred 3.5 wt % NaCl solution at (35 ± 2) °C: (a) Al2O3-5; (b) Al2O3-10; (c) Al2O3-20; (d) Al2O3-30.
Figure 6.
The surface morphologies of Al2O3 coatings after being immersed in unstirred 3.5 wt % NaCl solution at (35 ± 2) °C: (a) Al2O3-5; (b) Al2O3-10; (c) Al2O3-20; (d) Al2O3-30.

Figure 7.
The surface morphologies of coatings after being immersed 30 days in unstirred 3.5 wt % NaCl solution at (35 ± 2) °C: (a) C2S-30; (b) Al2O3-30.
Figure 7.
The surface morphologies of coatings after being immersed 30 days in unstirred 3.5 wt % NaCl solution at (35 ± 2) °C: (a) C2S-30; (b) Al2O3-30.

Figure 8.
EDS analysis of the region marked with a yellow rectangle in Figure 6: (a) Al2O3-10; (b) Al2O3-30.
Figure 8.
EDS analysis of the region marked with a yellow rectangle in Figure 6: (a) Al2O3-10; (b) Al2O3-30.

Figure 9.
The cross-section morphologies of Ca2SiO4 coatings after being immersed in unstirred 3.5 wt % NaCl solution at (35 ± 2) °C: (a,d) as-sprayed C2S; (b,e) C2S-10; (c,f) C2S-30.
Figure 9.
The cross-section morphologies of Ca2SiO4 coatings after being immersed in unstirred 3.5 wt % NaCl solution at (35 ± 2) °C: (a,d) as-sprayed C2S; (b,e) C2S-10; (c,f) C2S-30.

Figure 10.
The surface morphologies of Ca2SiO4 coatings: (a) as-sprayed C2S; (b) C2S-30. (c) The XRD pattern of C2S-30.
Figure 10.
The surface morphologies of Ca2SiO4 coatings: (a) as-sprayed C2S; (b) C2S-30. (c) The XRD pattern of C2S-30.

Figure 11.
EDS analysis of the cross-section of C2S-30: (a) the original image; and the element distribution of (b) Carbon, (c) Silicon, (d) Calcium.
Figure 11.
EDS analysis of the cross-section of C2S-30: (a) the original image; and the element distribution of (b) Carbon, (c) Silicon, (d) Calcium.

Figure 12.
The cross-section morphologies of Al2O3 coatings after immersed in unstirred 3.5 wt % NaCl solution at (35 ± 2) °C: (a,d) as-sprayed Al2O3; (b,e) Al2O3-10; (c,f) Al2O3-30.
Figure 12.
The cross-section morphologies of Al2O3 coatings after immersed in unstirred 3.5 wt % NaCl solution at (35 ± 2) °C: (a,d) as-sprayed Al2O3; (b,e) Al2O3-10; (c,f) Al2O3-30.

Figure 13.
The potentiodynamic polarization curves of Ca2SiO4 coating (a) and Al2O3 coating (b), respectively, after being immersed in still 3.5 wt % NaCl solution at (35 ± 2) °C for 0, 5, 10, 20 and 30 days.
Figure 13.
The potentiodynamic polarization curves of Ca2SiO4 coating (a) and Al2O3 coating (b), respectively, after being immersed in still 3.5 wt % NaCl solution at (35 ± 2) °C for 0, 5, 10, 20 and 30 days.

Figure 14.
The evolutions of (a) Nyquist plots, (b) local amplification of Nyquist plots, (c) the value of impedance modulus, (d) phase angle plots with immersion time for Ca2SiO4 coatings.
Figure 14.
The evolutions of (a) Nyquist plots, (b) local amplification of Nyquist plots, (c) the value of impedance modulus, (d) phase angle plots with immersion time for Ca2SiO4 coatings.

Figure 15.
The equivalent circuits for Ca2SiO4 coatings: (a) as-sprayed C2S; (b) C2S-5; C2S-10, C2S-20; (c) C2S-30.
Figure 15.
The equivalent circuits for Ca2SiO4 coatings: (a) as-sprayed C2S; (b) C2S-5; C2S-10, C2S-20; (c) C2S-30.

Figure 16.
The evolutions of (a) Nyquist plots, (b) local amplification of Nyquist plots, (c) the value of impedance modulus, (d) phase angle plots with immersion time for Al2O3 coatings.
Figure 16.
The evolutions of (a) Nyquist plots, (b) local amplification of Nyquist plots, (c) the value of impedance modulus, (d) phase angle plots with immersion time for Al2O3 coatings.

Figure 17.
The equivalent circuits for Al2O3 coatings.


Table 1.
Plasma-spraying operating parameters.
| Parameters | NiCr | Ca2SiO4 | Al2O3 |
|---|---|---|---|
| Arc current, A | 600 | 650 | 650 |
| Primary plasma gas (Ar), slpm | 57 | 49 | 49 |
| Secondary plasma gas (H2), slpm | 8 | 9 | 9 |
| Carrier gas, slpm | 3.5 | 4.0 | 4.0 |
| Powder feed rate, g/min | 18 | 35 | 35 |
| Spray distance, mm | 120 | 110 | 110 |
Table 2.
Corrosion parameters of Ca2SiO4 and Al2O3 coatings after being immersed in 3.5 wt % NaCl solution for different time.
Table 2.
Corrosion parameters of Ca2SiO4 and Al2O3 coatings after being immersed in 3.5 wt % NaCl solution for different time.
| Samples | Ecorr (V) | Icorr (μA/cm2) | −βc (V) | βa (V) | Rp (kΩ·cm2) |
|---|---|---|---|---|---|
| as-sprayed C2S | −0.37 | 1.24 | 0.161 | 0.376 | 39.53 |
| C2S-5 | −0.44 | 0.227 | 0.048 | 0.370 | 81.38 |
| C2S-10 | −0.62 | 0.739 | 0.071 | 0.797 | 38.36 |
| C2S-20 | −0.64 | 0.999 | 0.067 | 0.688 | 26.57 |
| C2S-30 | −0.65 | 1.61 | 0.094 | 0.957 | 23.11 |
| as-sprayed Al2O3 | −0.36 | 0.219 | 0.100 | 0.086 | 91.22 |
| Al2O3-5 | −0.38 | 2.06 | 0.150 | 0.403 | 23.08 |
| Al2O3-10 | −0.59 | 9.78 | 0.282 | 0.887 | 9.51 |
| Al2O3-20 | −0.71 | 25.5 | 0.158 | 1.186 | 2.38 |
| Al2O3-30 | −0.55 | 9.13 | 0.178 | 0.788 | 6.91 |
Table 3.
Corrosion parameters of Ca2SiO4 and Al2O3 coatings after being immersed in 3.5 wt % NaCl solution for different time.
Table 3.
Corrosion parameters of Ca2SiO4 and Al2O3 coatings after being immersed in 3.5 wt % NaCl solution for different time.
| Time (Days) | Ca2SiO4 | Al2O3 | ||
|---|---|---|---|---|
| Rt (Ω) | Qp-p | Ws-R (Ω) | Qc-p | |
| 0 | 6288 | / | 32.45 | 0.726 |
| 5 | 7319 | 0.865 | 253.4 | 0.501 |
| 10 | 7759 | 0.883 | 239.3 | 0.475 |
| 20 | 4550 | 0.885 | 222 | 0.516 |
| 30 | 420.6 | 0.809 | 414.0 | 0.411 |
© 2018 by the authors. Licensee MDPI, Basel, Switzerland. This article is an open access article distributed under the terms and conditions of the Creative Commons Attribution (CC BY) license (http://creativecommons.org/licenses/by/4.0/).
Share and Cite
MDPI and ACS Style
Xiao, Y.; Shao, F.; Zhuang, Y.; Ni, J.; Zhao, H.; Tao, S. Comparative Study of the Corrosion Resistance of Air-Plasma-Sprayed Ca2SiO4 and Al2O3 Coatings in Salt Water. Coatings 2018, 8, 116. https://doi.org/10.3390/coatings8040116
AMA Style
Xiao Y, Shao F, Zhuang Y, Ni J, Zhao H, Tao S. Comparative Study of the Corrosion Resistance of Air-Plasma-Sprayed Ca2SiO4 and Al2O3 Coatings in Salt Water. Coatings. 2018; 8(4):116. https://doi.org/10.3390/coatings8040116
Chicago/Turabian StyleXiao, Yuan, Fang Shao, Yin Zhuang, Jinxing Ni, Huayu Zhao, and Shunyan Tao. 2018. "Comparative Study of the Corrosion Resistance of Air-Plasma-Sprayed Ca2SiO4 and Al2O3 Coatings in Salt Water" Coatings 8, no. 4: 116. https://doi.org/10.3390/coatings8040116
Note that from the first issue of 2016, this journal uses article numbers instead of page numbers. See further details here.