Article

Investigation of Element Effect on High-Temperature Oxidation of HVOF NiCoCrAlX Coatings

1
Department of Management and Engineering, Linköping University, 581 83 Linköping, Sweden
2
Siemens Industrial Turbomachinery AB, 612 83 Finspång, Sweden
*
Author to whom correspondence should be addressed.
Coatings 2018, 8(4), 129; https://doi.org/10.3390/coatings8040129
Submission received: 14 March 2018 / Revised: 27 March 2018 / Accepted: 1 April 2018 / Published: 3 April 2018
(This article belongs to the Special Issue Thermal Barrier Coatings)

Abstract

:
MCrAlX (M: Ni or Co or both, X: minor elements) coatings have been used widely to protect hot components in gas turbines against oxidation and heat corrosion at high temperatures. Understanding the influence of the X-elements on oxidation behavior is important in the design of durable MCrAlX coatings. In this study, NiCoCrAlX coatings doped with Y + Ru and Ce, respectively, were deposited on an Inconel-792 substrate using high velocity oxygen fuel (HVOF). The samples were subjected to isothermal oxidation tests in laboratory air at 900, 1000, and 1100 °C and a cyclic oxidation test between 100 and 1100 °C with a 1-h dwell time at 1100 °C. It was observed that the coating with Ce showed a much higher oxidation rate than the coating with Y + Ru under both isothermal and cyclic oxidation tests. In addition, the Y + Ru-doped coating showed significantly lower β phase depletion due to interdiffusion between the coating and the substrate, resulting from the addition of Ru. Simulation results using a moving phase boundary model and an established oxidation-diffusion model showed that Ru stabilized β grains, which reduced β-depletion of the coating due to substrate interdiffusion. This paper, combining experiment and simulation results, presents a comprehensive study of the influence of Ce and Ru on oxidation behavior, including an investigation of the microstructure evolution in the coating surface and the coating-substrate interface influenced by oxidation time.

1. Introduction

MCrAlX coatings (M for Ni and/or Co, X for minor elements) are widely used to protect superalloys against high-temperature oxidation and heat corrosion in gas turbine engines, either as overlays or as bond coats for TBCs (Thermal barrier coatings) [1,2,3]. The protection offered by MCrAlX coatings against high-temperature oxidation relies on the performance of a thermally grown oxide (TGO) scale formed at the coating-gas interface [4,5]. A continuous and dense α-Al2O3 of hexagonal, close-packed structures is desired for the scale’s resistance against the diffusion of oxygen ions, as well as high thermal and chemical stabilities. The growth of the alumina scale at the coating surface and substrate interdiffusion depletes the Al-rich β phase in MCrAlX coatings, which serves as an Al reservoir during oxidation. By modifying these two processes, the β phase depletion rate can be reduced; therefore, improved coating oxidation performance can be achieved by doping elements, such as Y [6,7], Hf [8,9], Ta [10], Re [11], and so on.
Compared with isothermal oxidation, cyclic oxidation induces thermal stress on TGO, resulting in TGO spallation [12]. The addition of various reactive elements (Y, Hf, or Ce) to alloys and coatings can remarkably improve TGO spallation resistance during cyclic oxidation by creating an anchor effect [13]. Among all of the reactive elements, Cerium’s (Ce) effect on improving oxidation performance has drawn attention in recent years. It has been reported that the adherence of the oxide film formed on Ni-20Cr alloys is improved by small additions of Ce and Si near the formation of root-shape protrusions, which inhibits the propagation of cracks at the TGO and increases the spallation resistance [14,15]. On the other hand, substrate interdiffusion between the coating and the substrate also depletes the β phase, which is greatly dependent on coating composition, substrate composition, and oxidation temperature [16,17,18]. The reduction of inwards diffusion of the Al from the coating to the substrate may significantly extend the lifetime of MCrAlX coatings. It is has been reported that by depositing a Ru layer between the coating and the substrate, it effectively slows down the inward diffusion of the Al by the formation of a (Ru,Ni)Al layer as diffusion barrier [19]. Moreover, the addition of Ru in Ni-based superalloys is also beneficial because it decreases the precipitation and growth rate of topologically close-packed (TCP) phases, which prevent the degradation of mechanical properties [20].
Overall oxidation resistance is closely related to the coating composition, and a large number of publications have been dedicated to studying the effects of minor additions of alloying elements to the coating composition [10,11,18,21,22,23]. However, no effort has been made to compare the abilities of Ce and other reactive elements (REs), such as Y, to improve cyclic oxidation resistance, and the effect of Ru-doping in the MCrAlX coating on substrate interdiffusion has rarely been discussed. This work covers two parts: (1) a comparative study of high velocity oxygen fuel (HVOF) sprayed coatings using isothermal oxidation and cyclic oxidation tests to analyze the effect of Ce on cyclic oxidation resistance; and (2) a study of the effect of Ru on the stability of the β phase and the Al interdiffusion using both short-range and long-range models to simulate the phase evolution and interdiffusion in the coating of superalloy systems [23,24,25]. This paper aims to better understand the effects of Ru and Ce on the behavior of MCrAlX coatings during high-temperature oxidation.

2. Materials and Experiment

In this study, two NiCoCrAlX powders were tailor-made by the Beijing General Research Institute of Mining (Beijing, China) with a size range of <37 µm for C1 and 30–53 µm for C2. NiCoCrAlX coatings were deposited on an Inconel 792 substrate (composition by wt %: 12.5 Cr, 9 Co, 4.2 W, 4.2 Ta, 4 Ti, 3.4 Al, 1.9 Mo, 0.08 C, 0.03 Zr + B, balanced by Ni), using the JP5000 HVOF spray system (GTV-MF-P-HVOF-K-ARC, GTV Verschleiss-Schutz GmbH, Luckenbach, Germany). The NiCoCrAlX coating thicknesses were measured around 200 μm using ImageJ software (version 1.51) with the coating roughness in the range between 6 and 6.5 µm. Prior to coating deposition, the substrate surfaces were grit blasted. After the deposition, the specimens were subjected to a heat treatment, including solution annealing at 1120 °C for 2 h in a vacuum, followed by aging treatment at 845 °C for 24 h in air and air cooling to room temperature. Such a heat treatment, which is intended to strengthen the IN-792 substrate [26], also increases the bond strength between the coating and the substrate [27]. The chemical composition of the heat-treated MCrAlX coatings was measured on the average 20 μm × 25 μm cross-section area by an energy dispersive spectroscope (EDS, X-Max, Oxford Instruments, Oxford, UK) and a wavelength dispersive spectroscope (WDS, INCA wave, Oxford Instruments, Oxford, UK), as listed in Table 1.
Long-time isothermal oxidation tests were performed on the coated specimens at 900 and 1000 °C—which is close to the service temperature of the MCrAlX coating of a gas turbine component—to simulate oxidation behavior. Cyclic oxidation tests were conducted in laboratory air at 1100 °C to compare with the isothermal oxidation tests and to study the coating’s cyclic oxidation resistance (see Table 2 for details). One cycle of the cyclic oxidation consisted of heating at 1100 °C for 1 h and forced-air cooling to 100 °C in 10 min. After oxidation, the oxidized samples were sectioned, mounted in epoxy, and polished. The surface and the cross-sections of the specimens were examined using a Hitachi SU70 FEG scanning electron microscope (SEM, Hitachi, Tokyo, Japan) for microstructure observation and chemical composition measurement. To better describe the microstructure development, the coating was separated into several zones, including: outer β phase depletion zone (OBDZ), β phase left zone (BLZ), and inner β phase depletion zone (IBDZ), as illustrated in Figure 1. The evolution of different areas were quantified by image analysis software.

3. Simulation

To have a better understanding of the mechanism behind the effect of Ru on the Al diffusion behavior, the experimental work was supplemented with a computational simulation, using a Thermo-Calc software (version 2017b) package with the advanced Ni-base thermodynamic database TCNI8 [28] and corresponding mobility database MONI4 [29]. Firstly, to investigate the influence of Ru addition in MCrAlX coatings, Ru and Al solubility in the constituent β and γ phases and the corresponding phase equilibrium were calculated using Thermo-Calc. Secondly, the Ru effect on the Al diffusion between the localized β and γ grains was investigated by a short-range diffusion calculation using the moving phase boundary model in DICTRA (version 2017b) [30]. Finally, a long-range interdiffusion simulation between the coating and the substrate using an established model [17,23,24] based on DICTRA was performed to demonstrate the aforementioned Ru effect on the Al diffusion. The models are introduced below in Section 3.1 and Section 3.2, respectively.

3.1. Short-Range Diffusion

To study the Ru effect on the Al diffusion between the β and γ phase, a 1D moving phase boundary model, which has been incorporated in DICTRA software [30], was adapted to simulate the short-range diffusion behavior. The model is based on the diffusion-controlled growth under local equilibrium conditions as suggested by Larsson and Reed [31]. A more intimate and comprehensive description can be found in [32]. The assumption for this model includes: (1) planar geometry corresponding to an infinitely wide plate of a certain thickness; (2) a sharp interface with local equilibrium; (3) diffusion controlling the movement of the phase boundary; and (4) zero-flux at the boundary. The utilization of such a model to simulate diffusion in MCrAlX coatings can be useful to investigate: (1) the movement of the interfacial β/γ phase boundary and (2) the local diffusion behavior of the Al between the β and γ phase at short time because since no flux is introduced into the system. The model includes the diffusion process through the interface between the two regions (the γ phase region on the left side and the β phase region on the right side) and phase equilibrium calculation for each region. The region lengths, 5.5 μm for γ and 4.5 μm for β, were measured from the average grain size on the heat-treated samples. A double grit structure was set with a set of non-linear nodes for each region with a geometry factor of 0.9 (linear grid when geometry factor is 1), which gives a distribution of nodes: denser closer to the interface and thinner near the outer region boundaries. The composition of the phases was stored in each node. The composition profile in the γ and β regions was linear, which was taken either from EDS measurement of as-received samples or from equilibrium calculation of corresponding coating composition by Thermo-Calc.

3.2. Long-Range Diffusion

A brief description of the oxidation-diffusion model for the simulation of long-range diffusion is given as follows; a more detailed description can be found in [11,15,19]. The substrate and coating compositions were represented in 1D by a set of non-linearly distributed nodes (dense near the interface, coarse in the substrate), in which the local composition is stored. In this paper, the nominal compositions in Table 1 were used as input data. The simulation of oxidation and diffusion followed an iterative process in which each iteration included: Step 1, Al removal from the coating surface to simulate the Al depletion at coating surface due to the formation of alumina using a MATLAB script (version 2017b); and Step 2, phase equilibrium calculation and substrate interdiffusion simulation using DICTRA software. The obtained compositions were then used as input data for the next loop.

4. Results and Discussion

4.1. Experimental Results Analysis

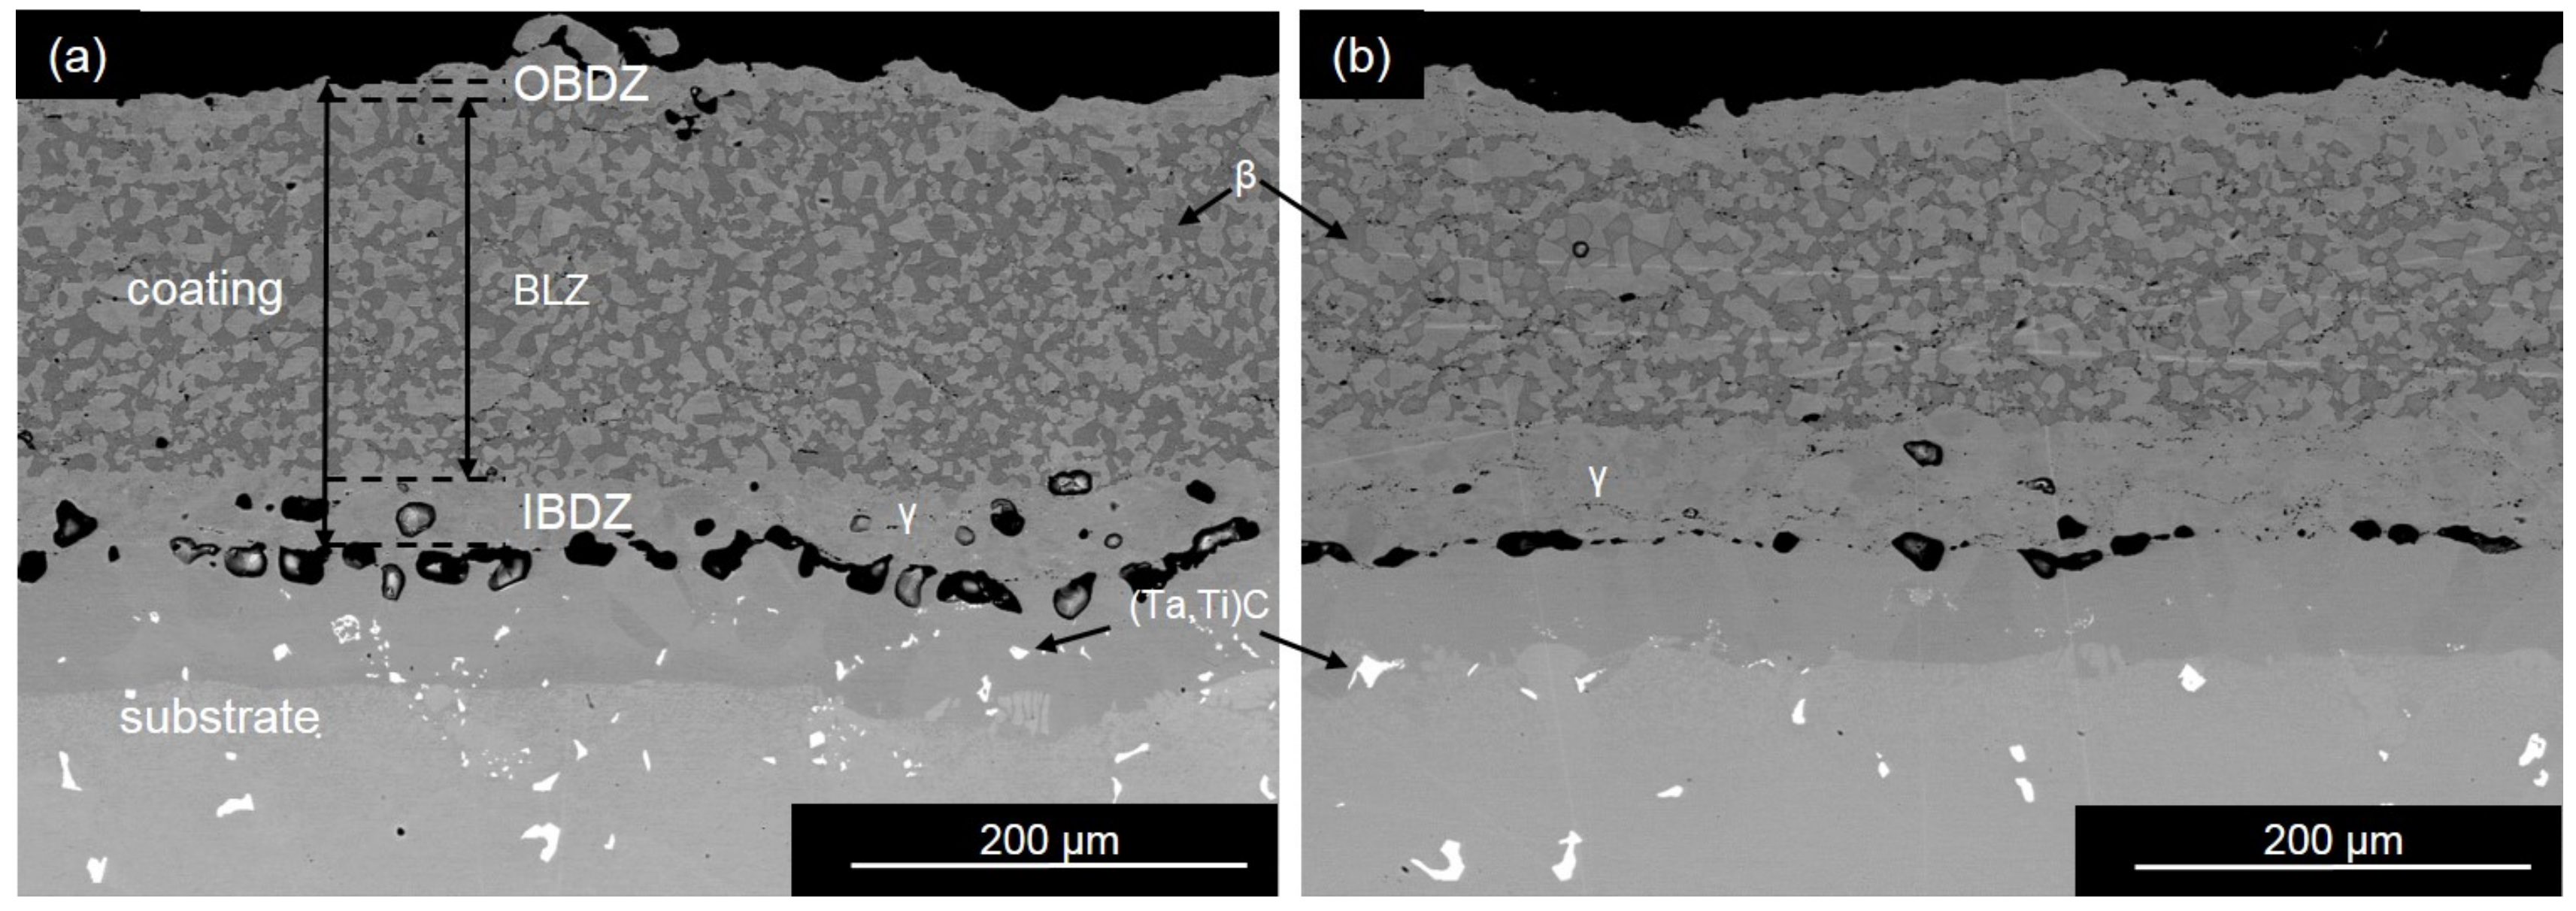
4.1.1. Heat-Treated Coating

The cross-section of heat-treated coatings and EDS mapping results are shown in Figure 2 and Figure 3 for the C1 and C2 coatings, respectively. A characteristic splat-on-splat structure can be seen with pores and cracks marking the splat’s boundaries. After the solution and aging heat treatment, a typical β + γ microstructure formed in the coatings (β phase in dark grey). The EDS mapping results are shown in Figure 2b, Ru has a similar pattern as Al indicating that Ru has a higher solubility in β phase than in γ phase, which is also confirmed by EDS point analysis showing a 4.8 wt % for Ru in β phase, compared with 1.1 wt % for Ru in γ phase. Y and Ce were mainly segregated to the splat’s boundary according to the EDS mapping (Figure 2b and Figure 3b) due to their affinity for oxygen.

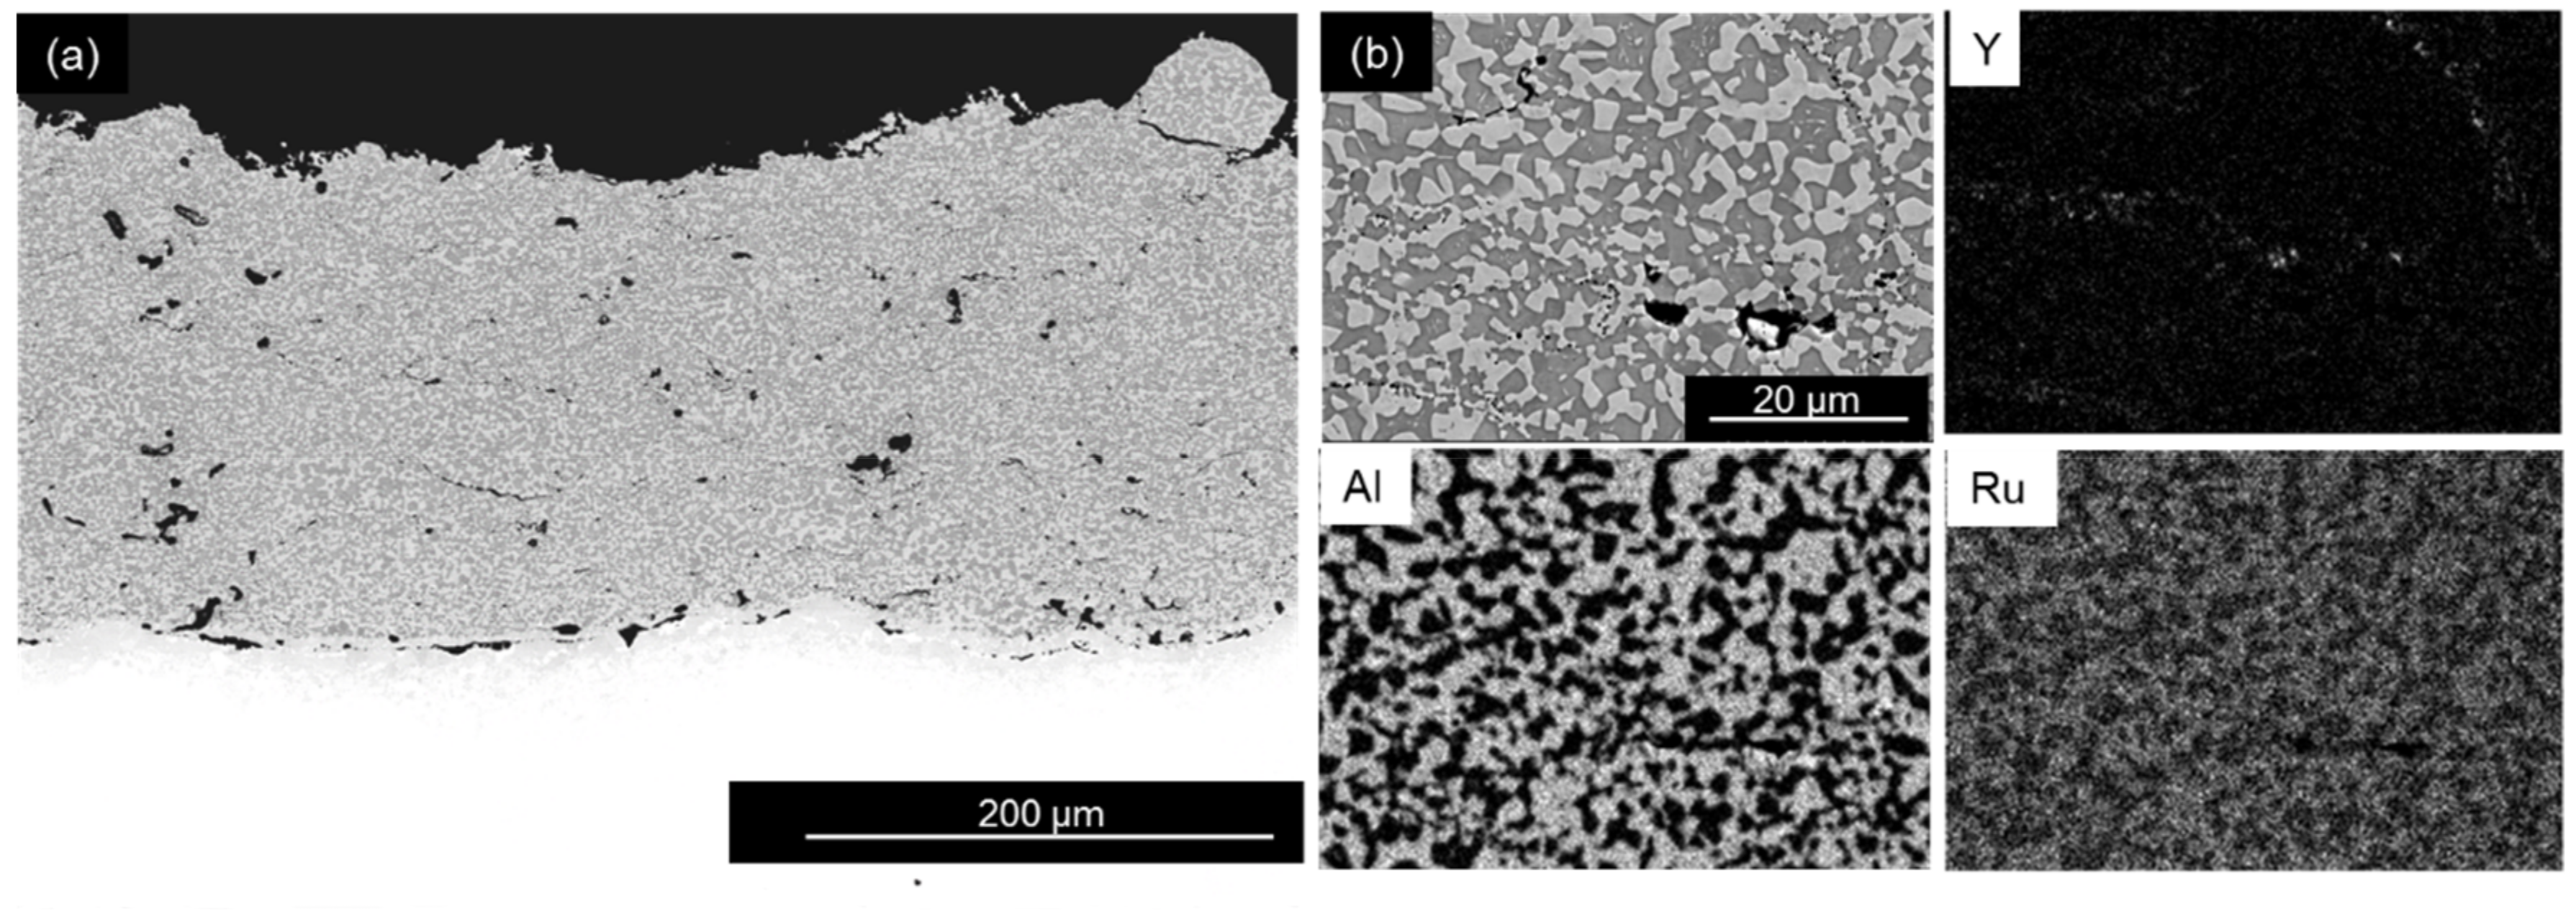
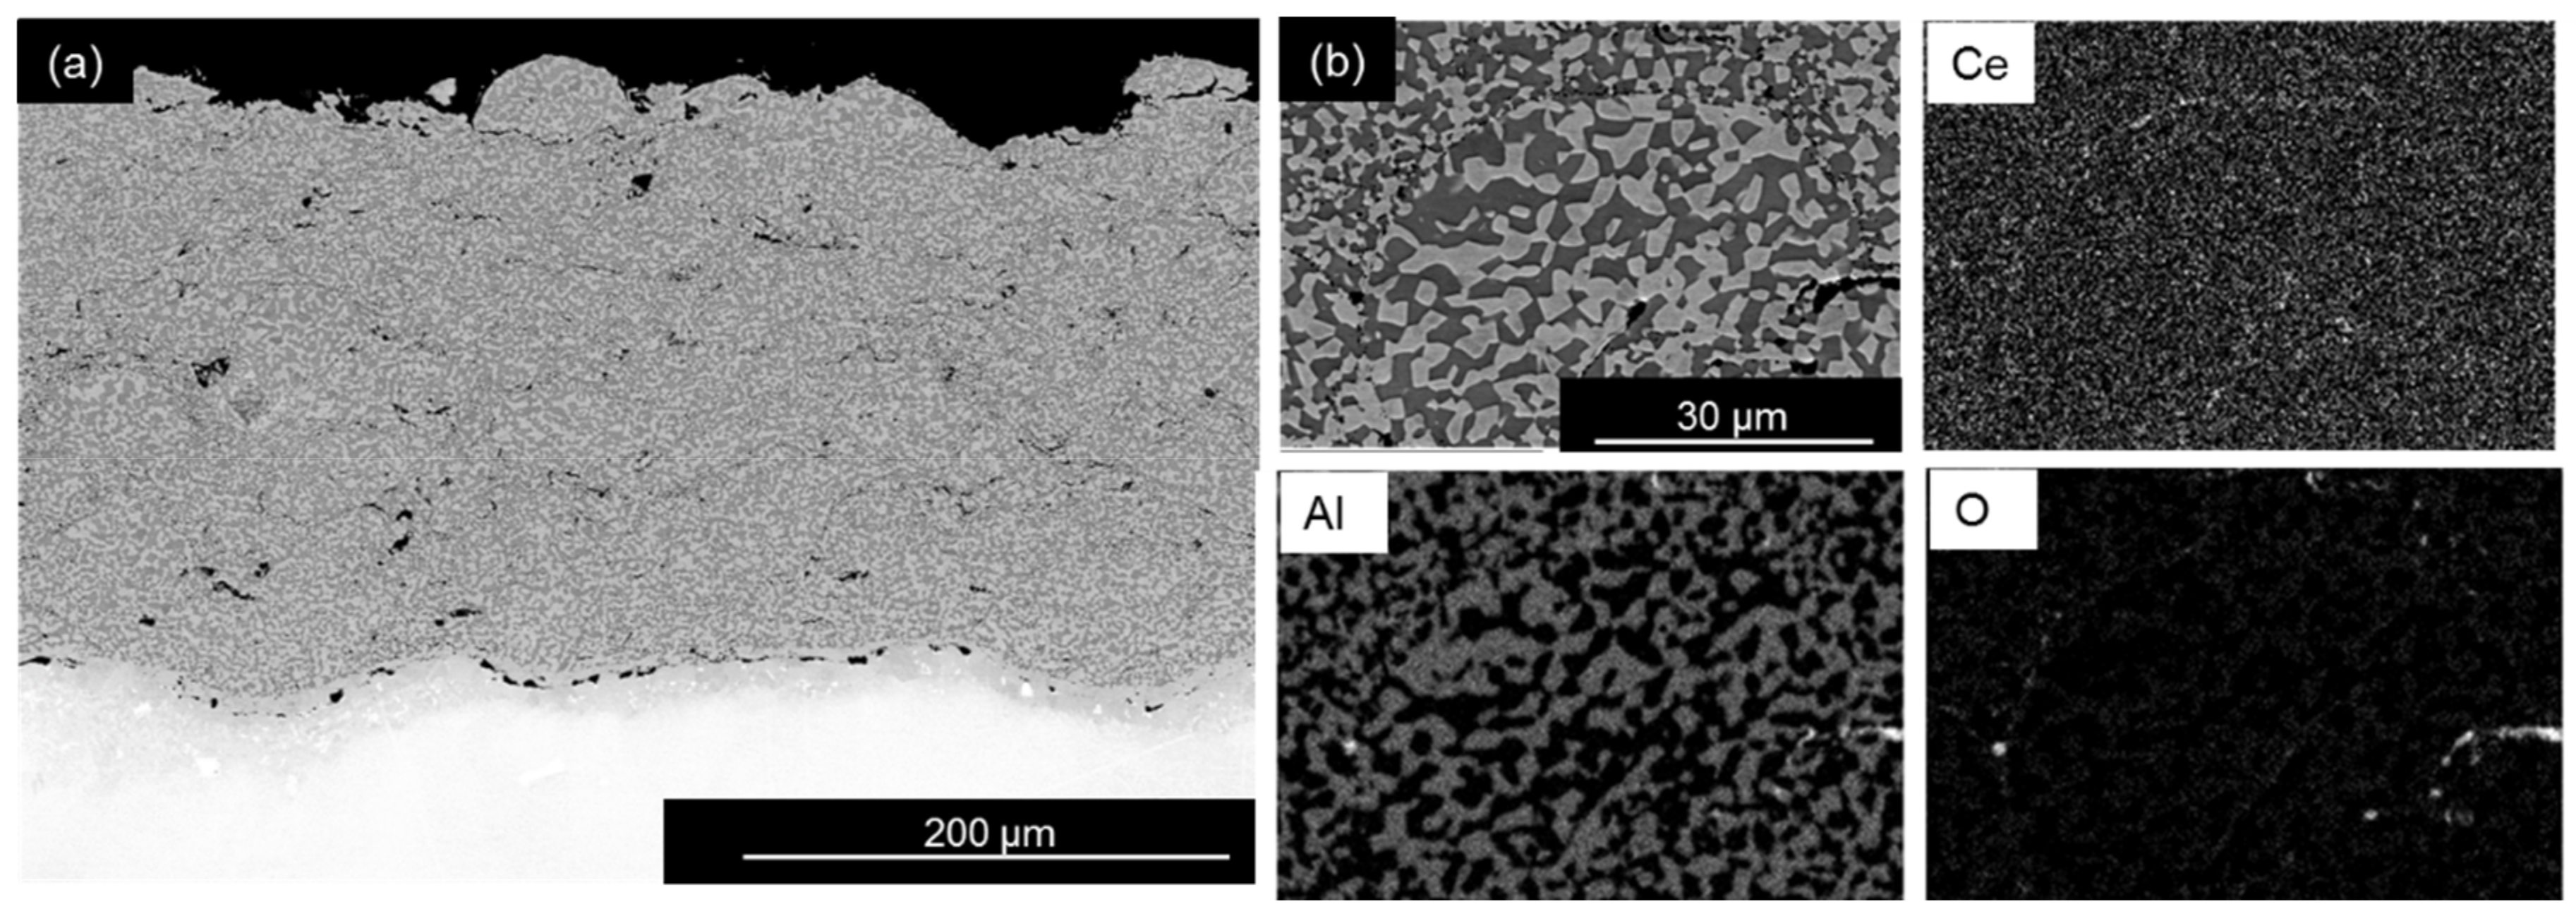
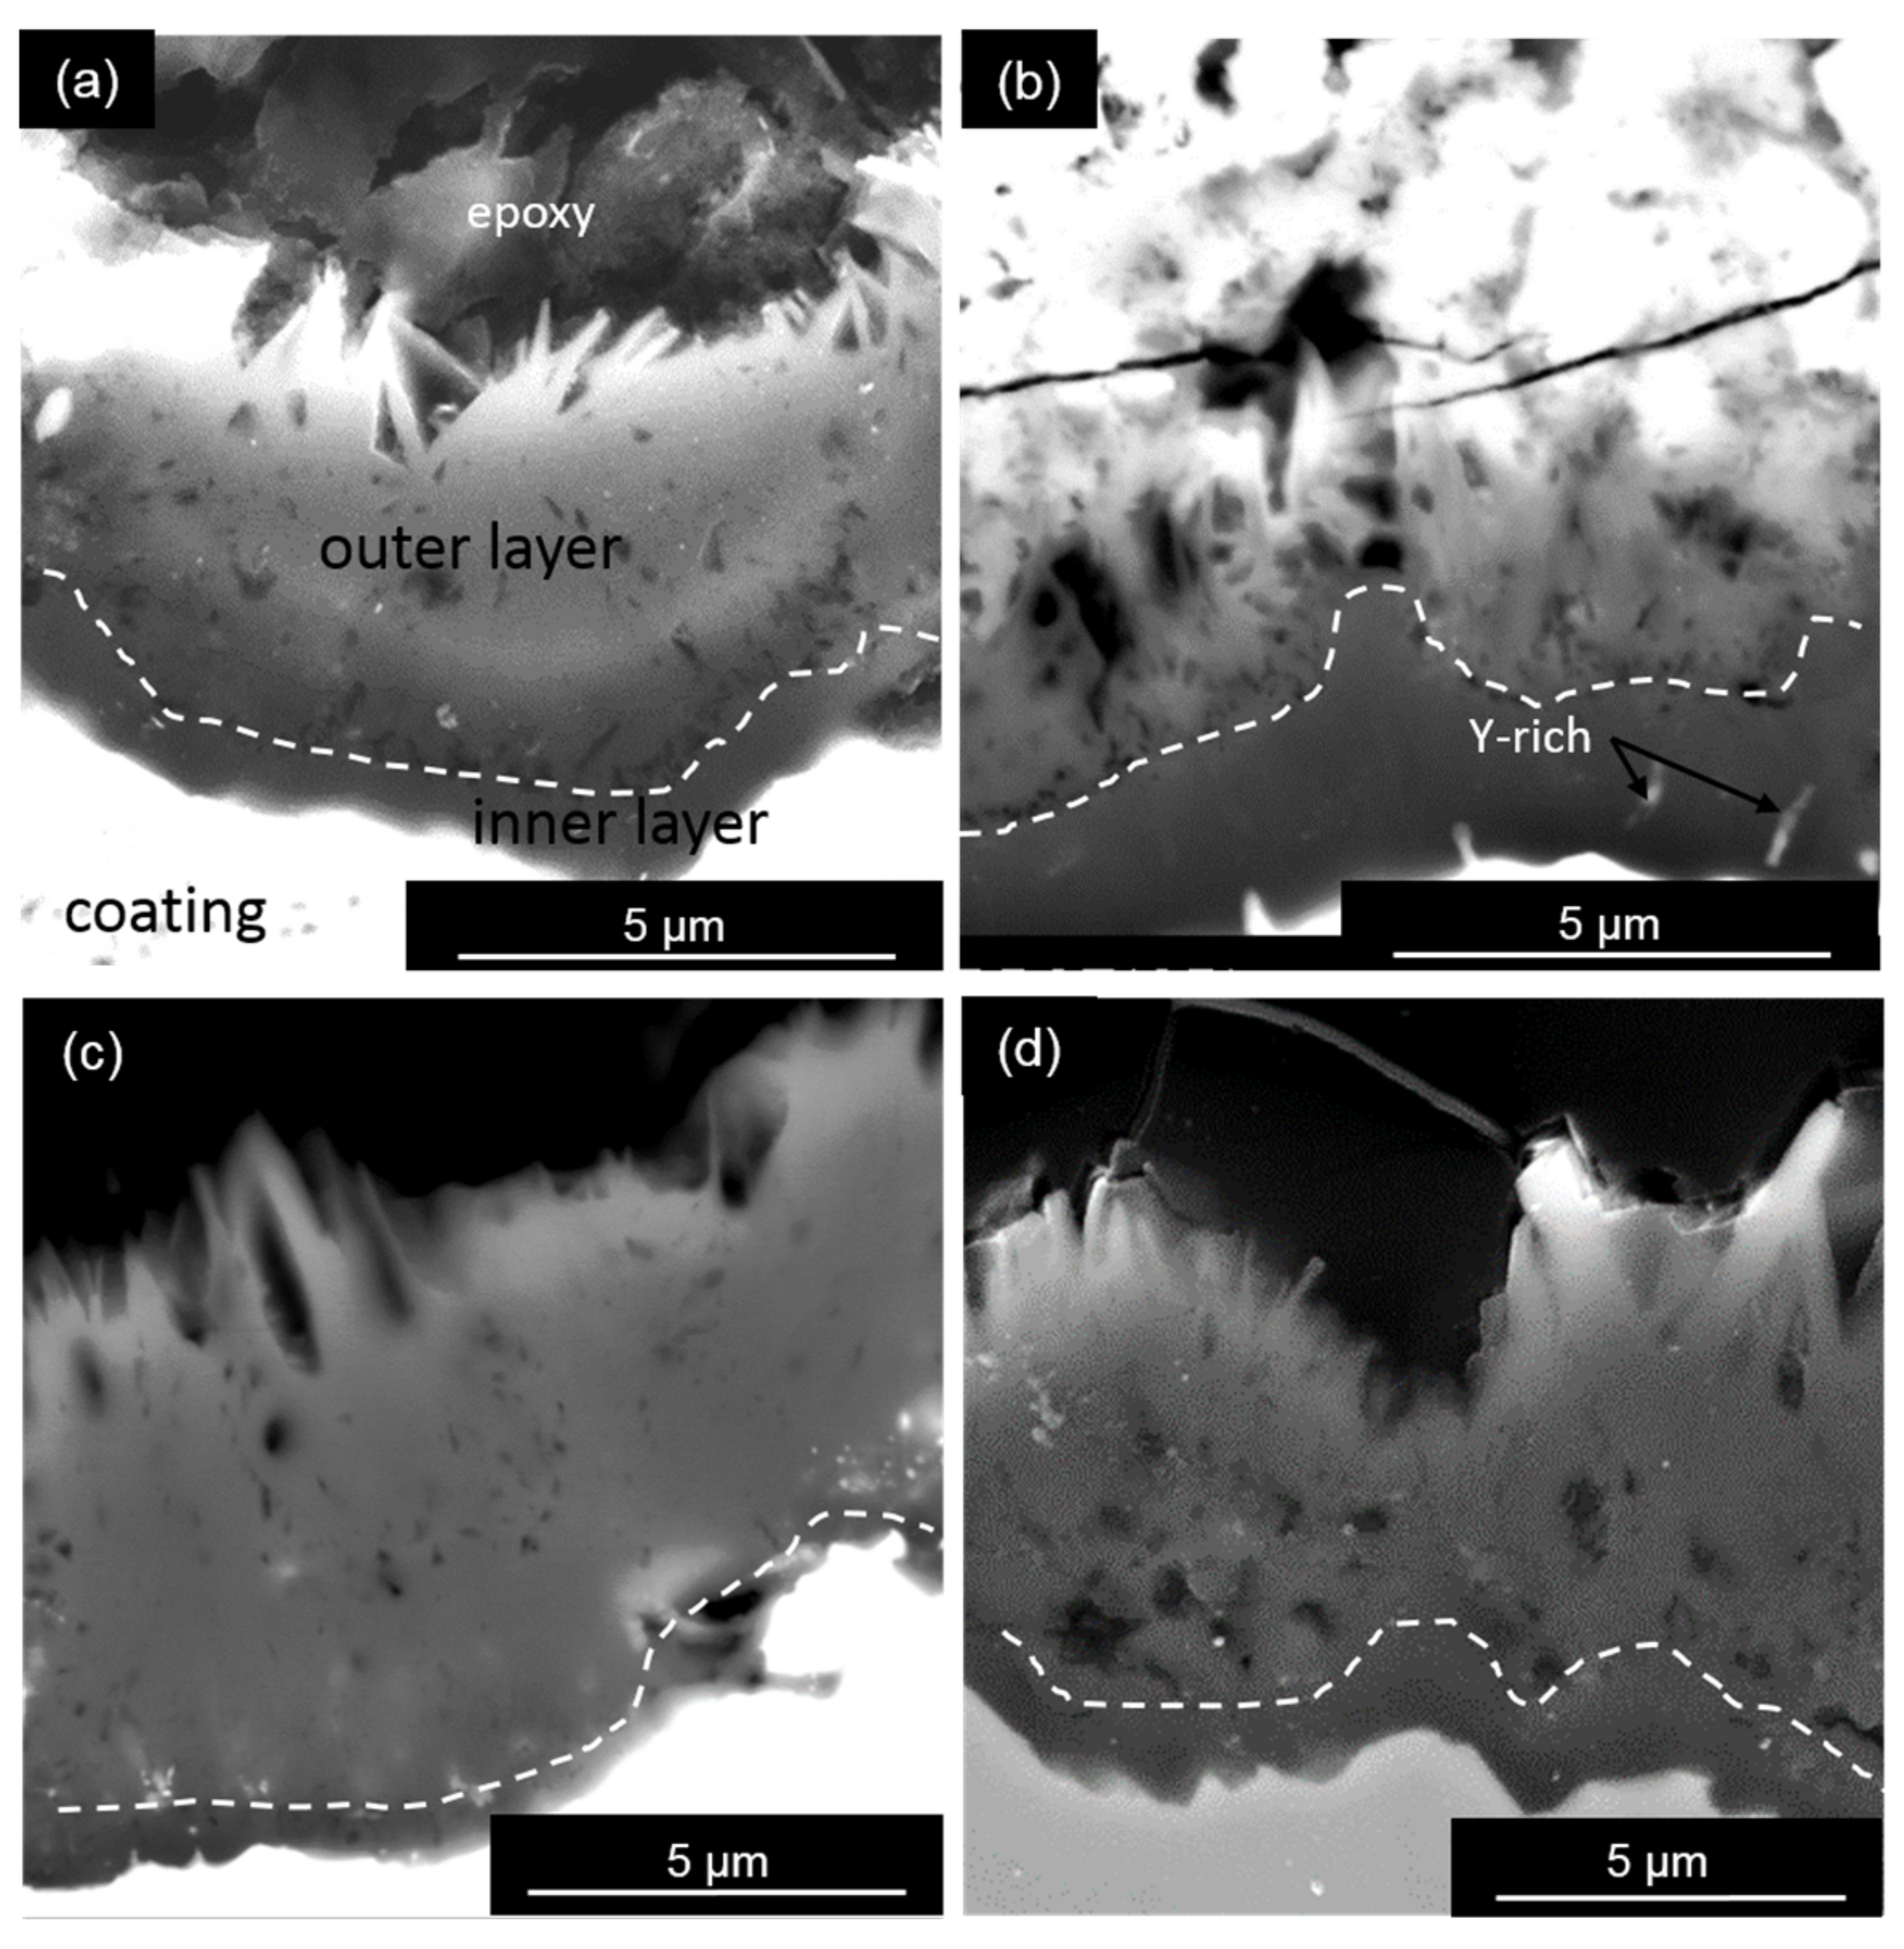
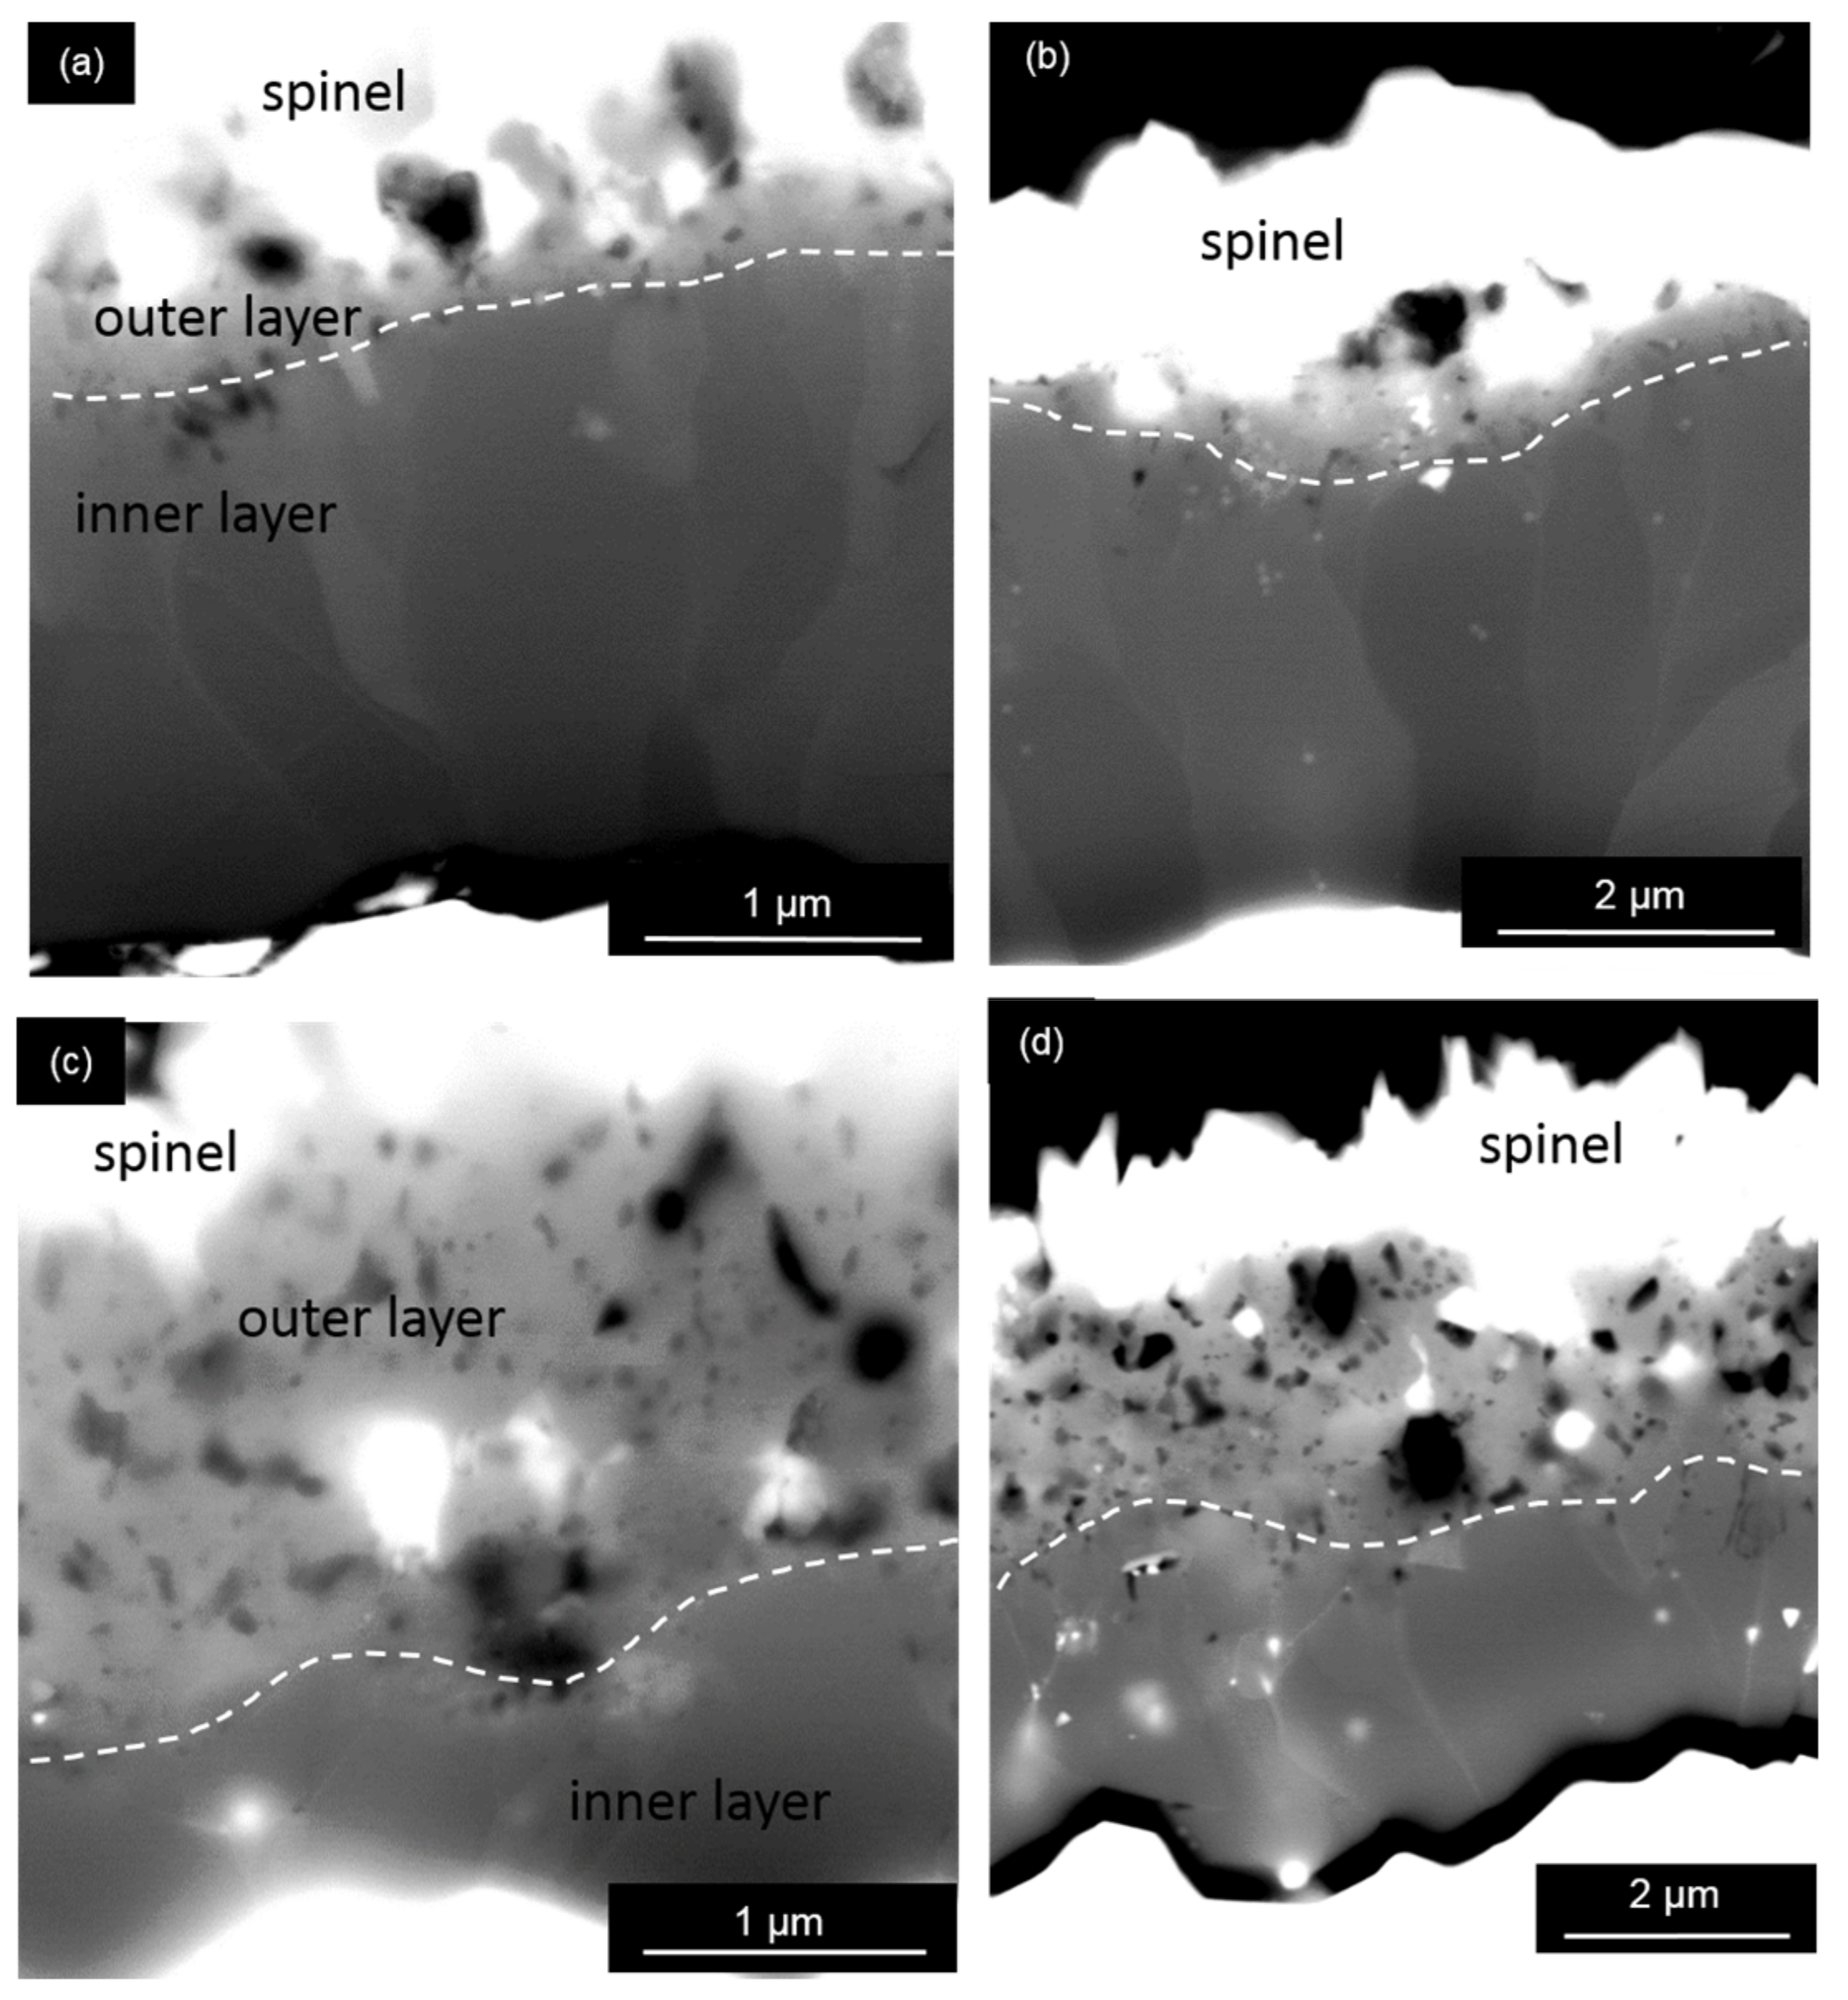
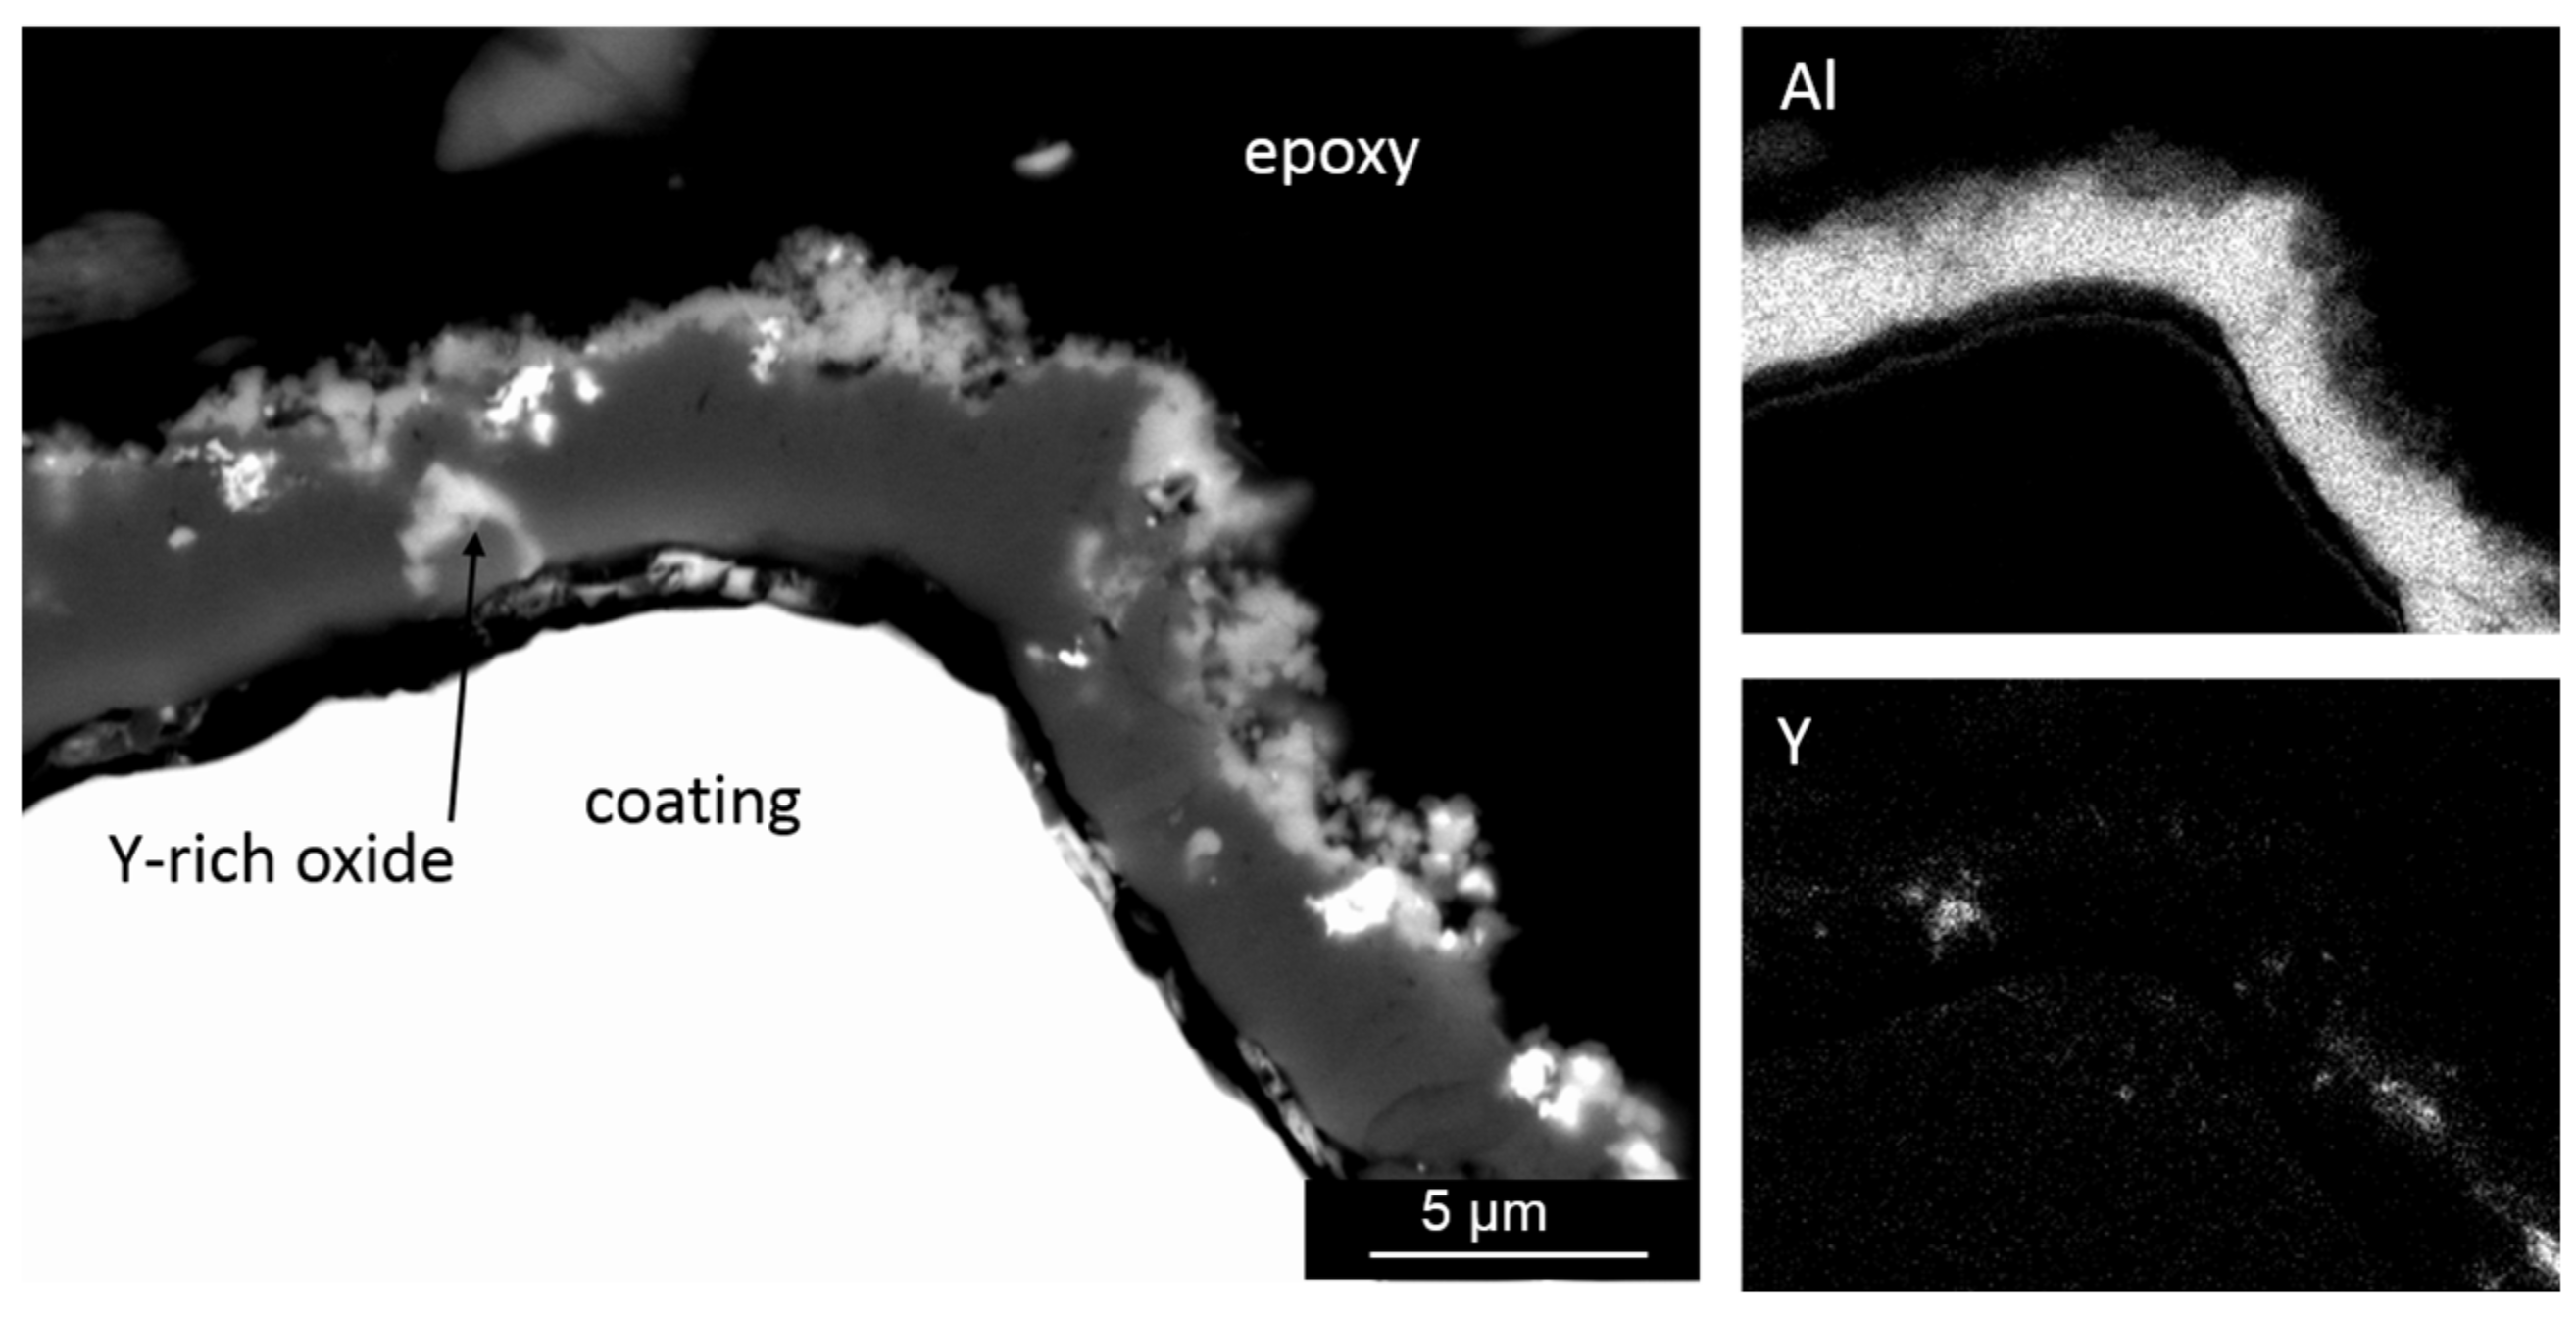
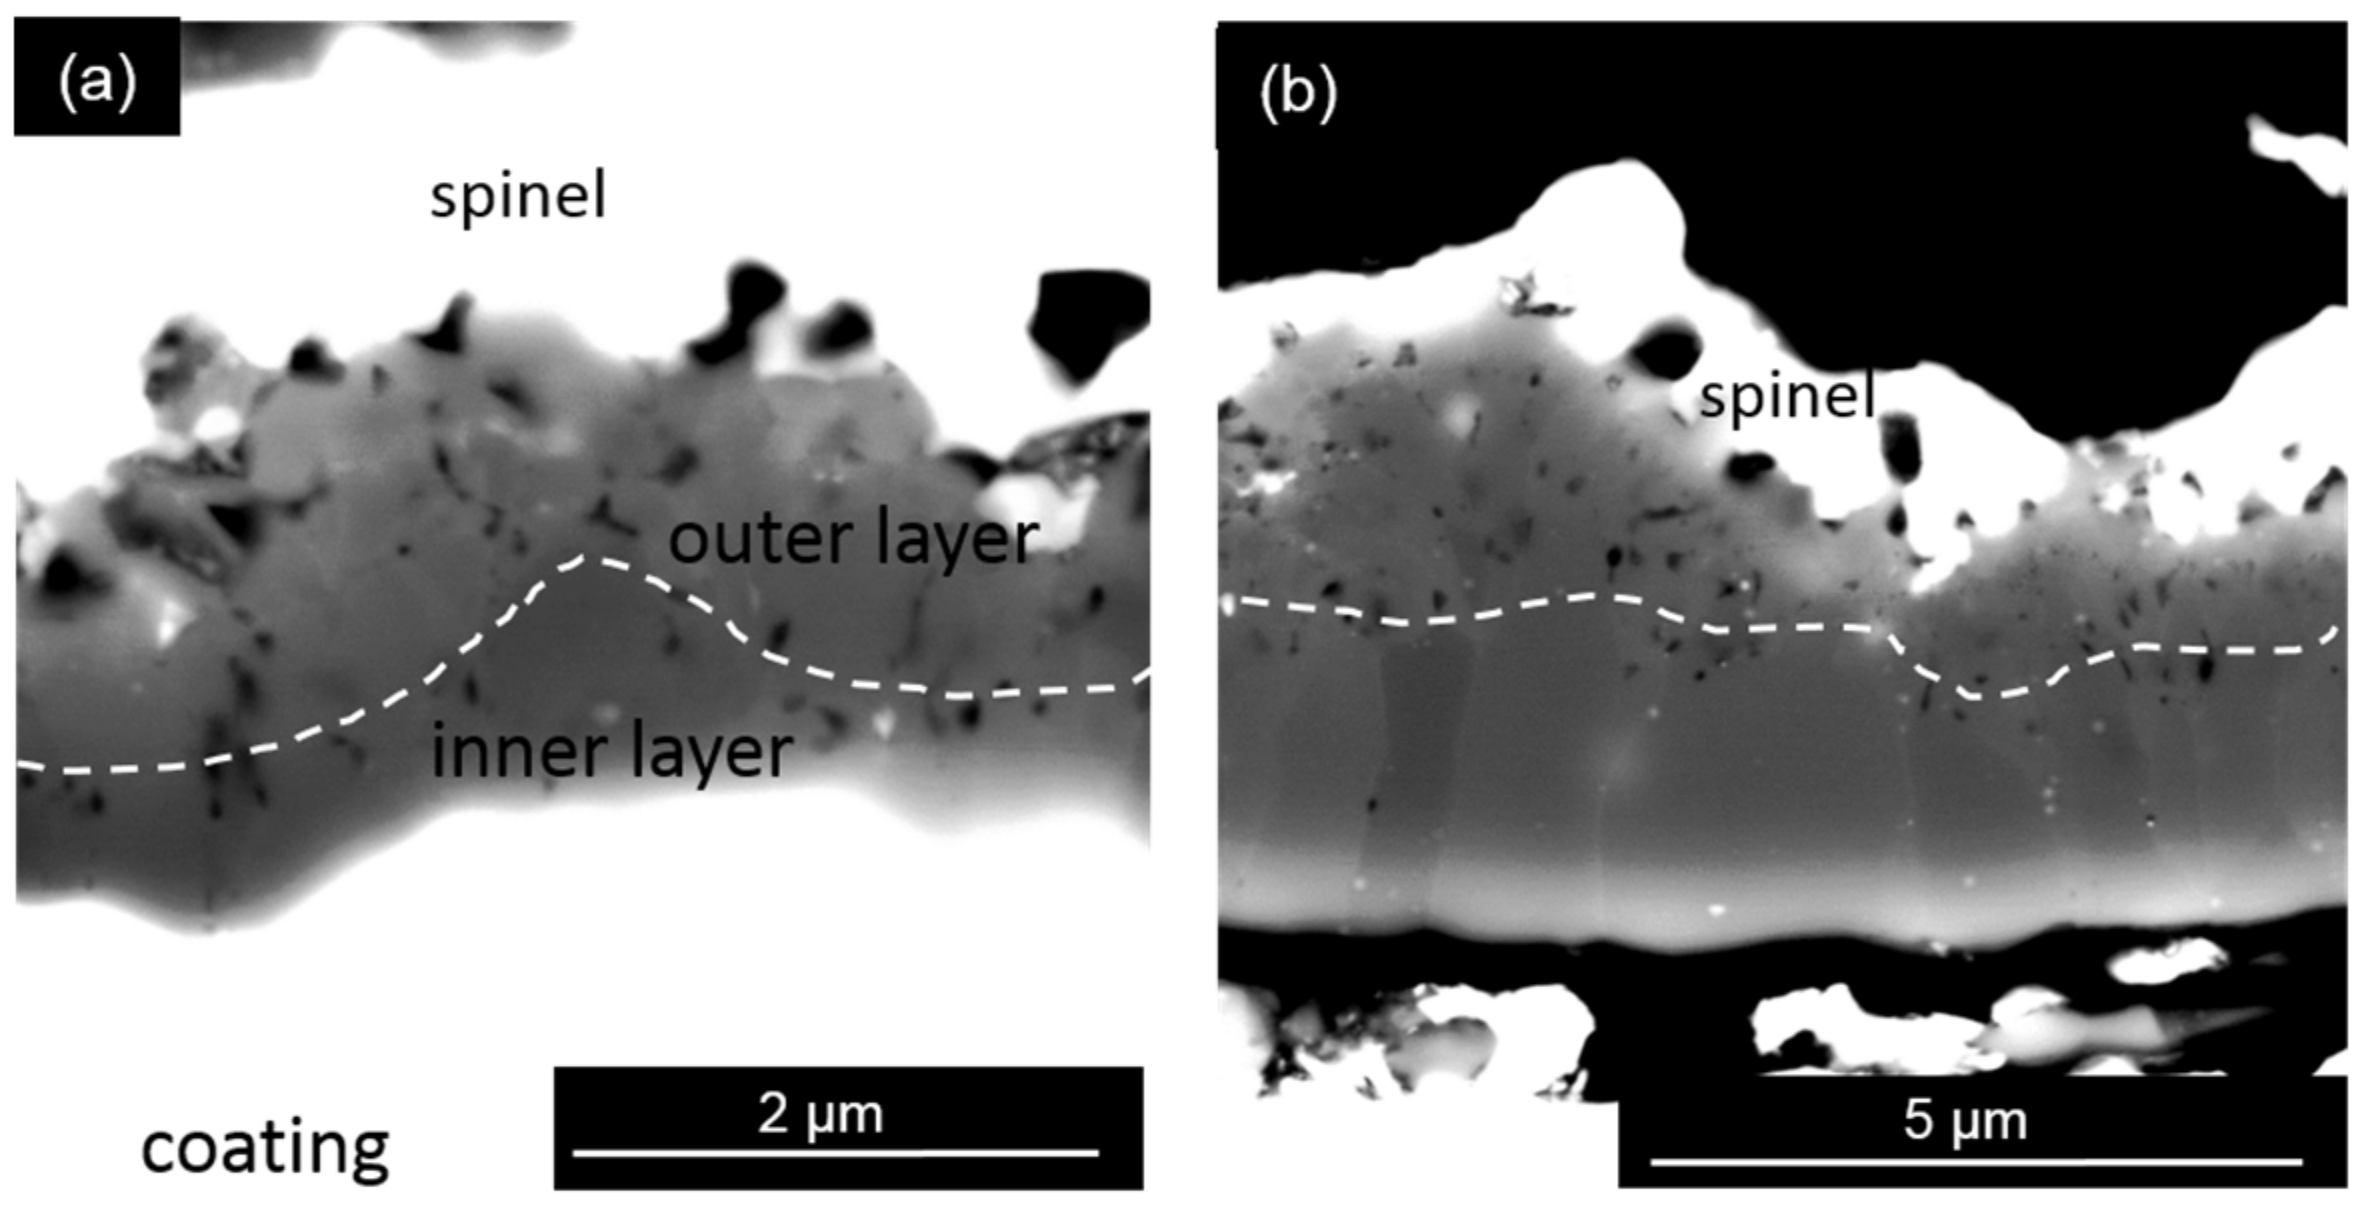
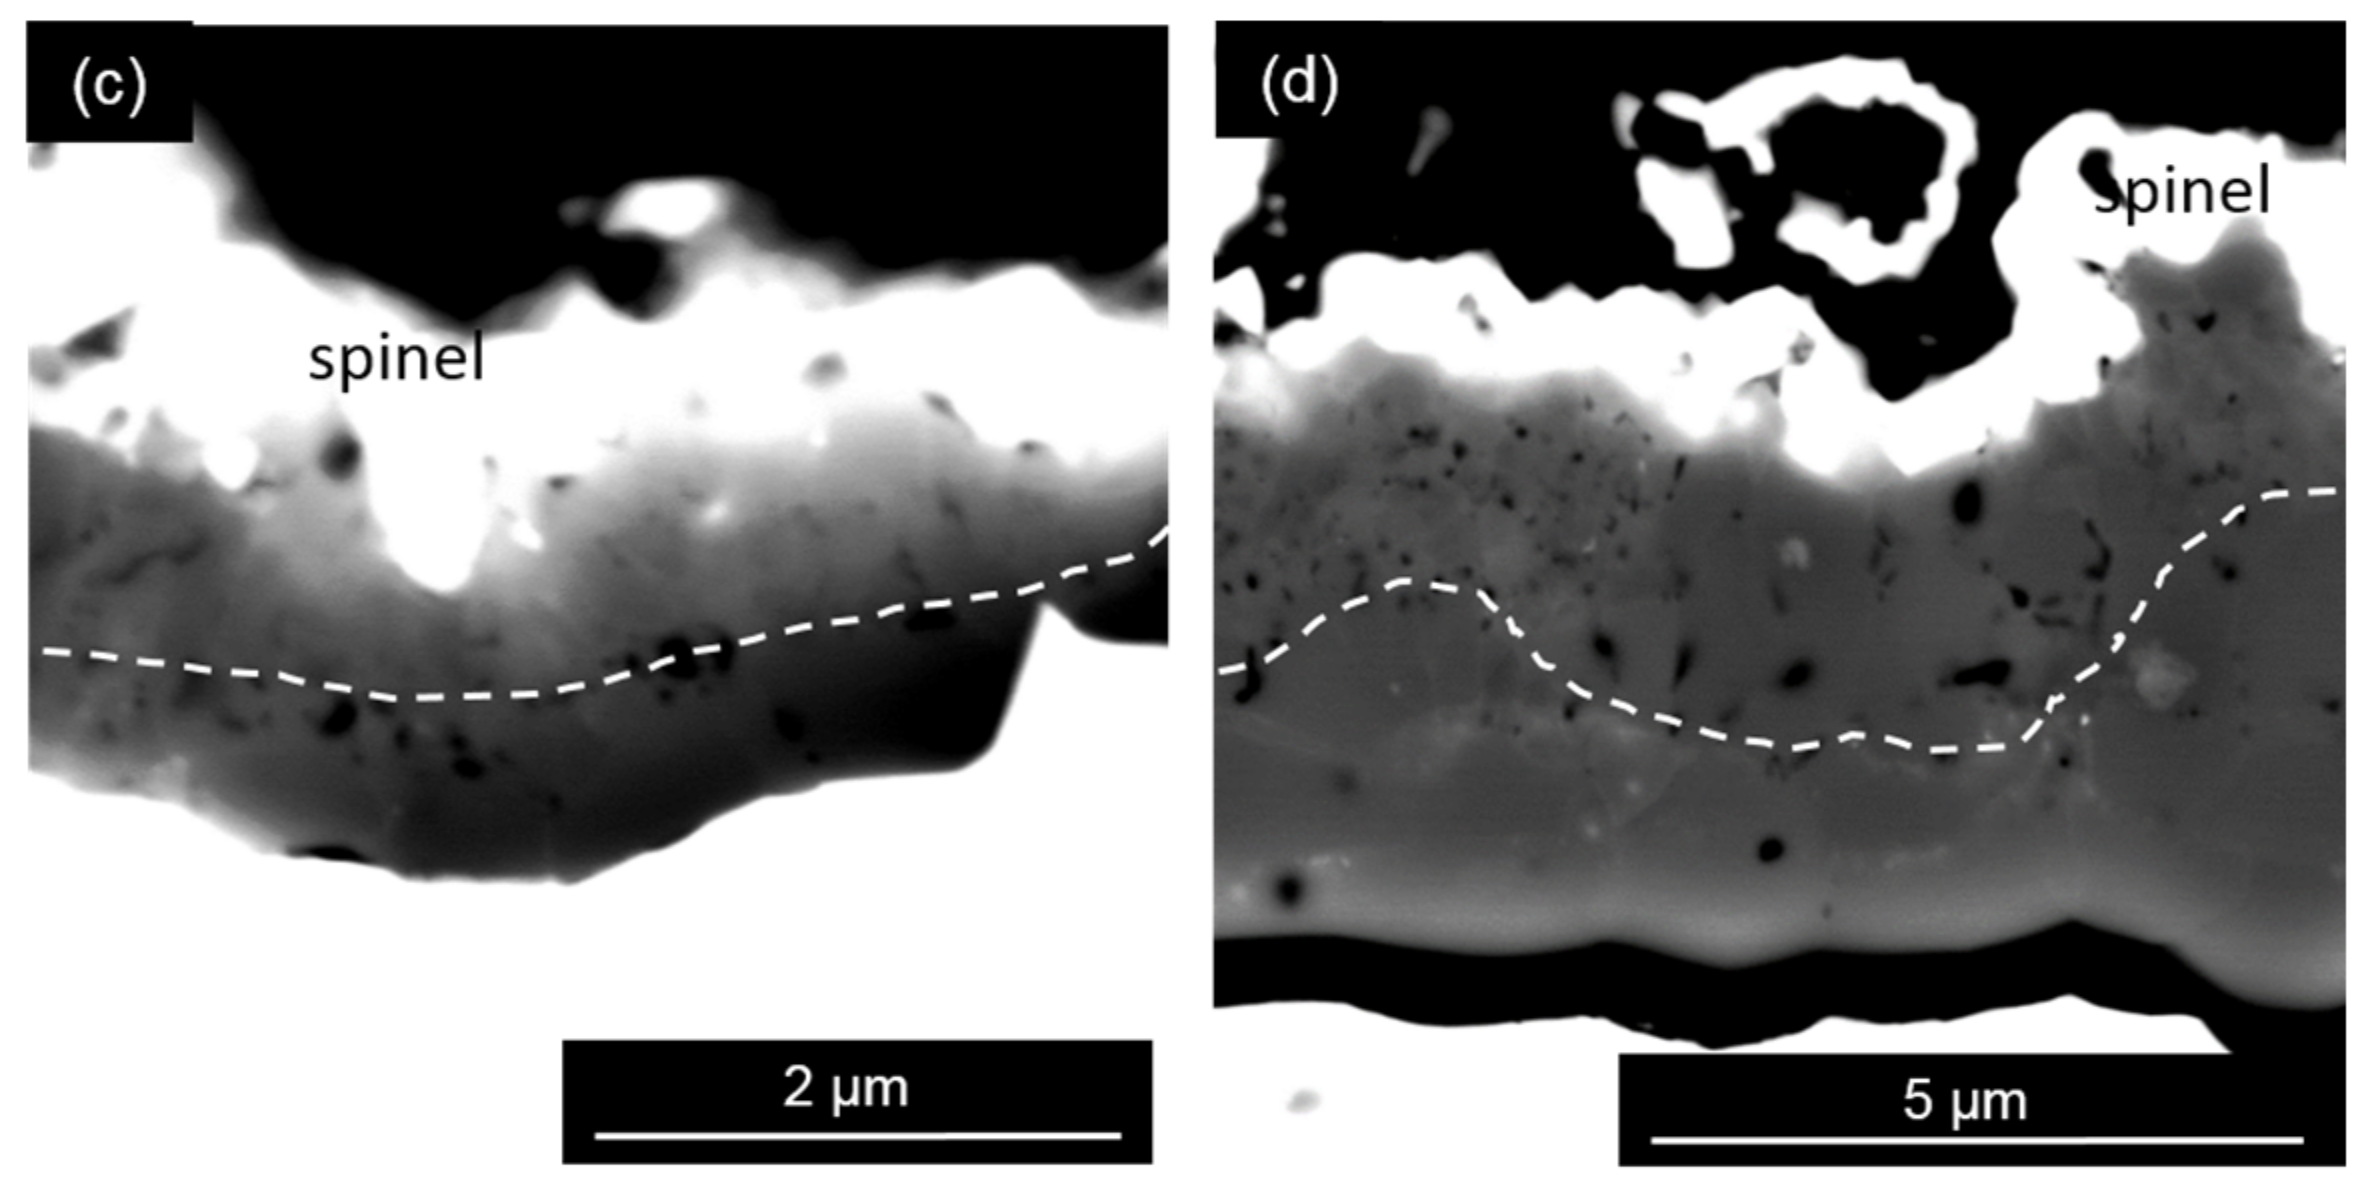
4.1.2. Thermally Grown Oxide Microstructure

The formation and growth of TGO play an important role in its subsequent thickening [33]; therefore, the oxidation behavior of coatings can be evaluated by studying the TGO growth behavior. Figure 4, Figure 5, Figure 6 and Figure 7 show the cross-sectional microstructure of the alumina scale formed on the coating surface at different oxidation temperatures. In general, a two-layer structure of alumina scale was observed, containing an outer porous layer and an inner dense layer. In addition, spinel could also be found covering the alumina scale, as shown in Figure 5, Figure 6 and Figure 7. However, the microstructure of the alumina scale is greatly dependent on the oxidation temperature. In Figure 4a,c, for 900 °C oxidation, a thick outer layer consisted of blade-like alumina and a thin dense inner alumina layer was observed with their boundaries marked by a dashed line. The formation of the blade-like Al2O3 resulted from the fast-outward growth of θ-Al2O3 for a short exposure time at a relatively low temperature (900 °C), which later transformed into α-Al2O3, as suggested by Liu et al. [34]. Because the growth rate of θ-Al2O3 is 10 times faster than α-Al2O3 [35,36], the inner alumina layer grows inward much slower than the outward growth of θ-Al2O3. Eventually, a two-layer structure of alumina scale, consisting of a thick porous outer layer transformed from fast-grown θ-Al2O3 and an inner slow-grown α-Al2O3, was observed. The formation of pores in the outer alumina layer gives evidence for the θ-to-α Al2O3 transformation due to the volume reduction, which is then incorporated in outer layer upon further alumina scale development [37,38]. After the full θ-to-α Al2O3 transformation, the inward diffusion of oxygen through the oxide scales dominates due to the slower Al outward diffusion through the oxides scale in a much more closely packed structure of α-Al2O3, rather than transient Al2O3 [35,36]. Therefore, the main alumina growth mechanism shifted from the outward grown outer layer to the inward growth of inner alumina layer after 5000 h oxidation, as evidenced by the similar outer layer thickness and the obvious thickening of inner layer in Figure 4. The outer layer of two coatings show similar morphology and thickness, indicating similar outward growth behavior. The inner alumina layer of the C1 coating, incorporated with Y-rich oxides (Figure 4b), is thicker than that of the C2 coating for 5000 h oxidation. This is because the Y-rich oxide in the alumina provides a fast diffusion path for the Al, which leads to a faster inward growth rate of the alumina in the C1 coating [22,33,39,40,41]. However, no such effect could be observed on the Ce-doped C2 coating, indicating that the 0.2 wt % Ce addition in the MCrAlX coating does not modify the Al diffusion in the alumina scale.
Figure 5 shows the cross-section of the TGO formed on the C1 and C2 coatings after isothermal oxidation at 1000 °C for different oxidation times, showing that the TGO consisted of spinel, an outer alumina layer, and an inner alumina layer. A thin outer layer and a columnar inner layer alumina scale could be observed on the C1 coating. However, the alumina scale formed on the C2 coating consisted of a thick porous outer layer and an equiaxed inner layer. Upon further oxidation to 5000 h, the thickening of inner layer in the C1 coating dominates the overall growth of the alumina scale after 50 h oxidation, as indicated by the relatively similar outer layer thickness. Figure 6 shows EDS mapping of the alumina scale formed on the C1 coating after 5000 h oxidation at 1000 °C. Y-rich oxides incorporated in the alumina scale can be readily observed. No Ru could be identified in the TGO of the C1 coating by EDS, and no Ce could be identified in the TGO of the C2 coating by EDS. The formation of the columnar structure of the inner alumina layer in the C1 coating resulted from the segregation of the Y-rich oxide at the alumina grain boundaries. The segregation of the Y-rich oxide accelerates the Al grain boundary diffusion, which aids in the formation of the columnar structure [42]. No such influence from the Ce addition in the C2 coating can be observed. In addition, the much thicker porous outer layer on the C2 coating compared to that of the C1 coating indicates that the addition of Y in MCrAlX coatings suppresses the growth of θ-Al2O3 and enhances the fast development of a dense α-Al2O3 layer. However, the addition of Ce in MCrAlX coatings does not show the same positive effects as that of Y. A similar TGO microstructure can be observed on the C1 and C2 coatings after isothermal oxidation at 1100 °C for different oxidation times, as illustrated in Figure 7. It is worth mentioning that the outer alumina layer thickness of the C2 coating reached half of the overall alumina scale thickness at 800 h oxidation, indicating not only the inward growth of the inner alumina layer but also the growth of the outer layer contributing to the overall alumina scale growth in the C2 coating. In contrast, the influence of the outer alumina layer growth on the overall alumina growth is trivial in the C1 coating considering the relatively thin outer layer thickness of the C1 coating without much thickening after 800 h oxidation.

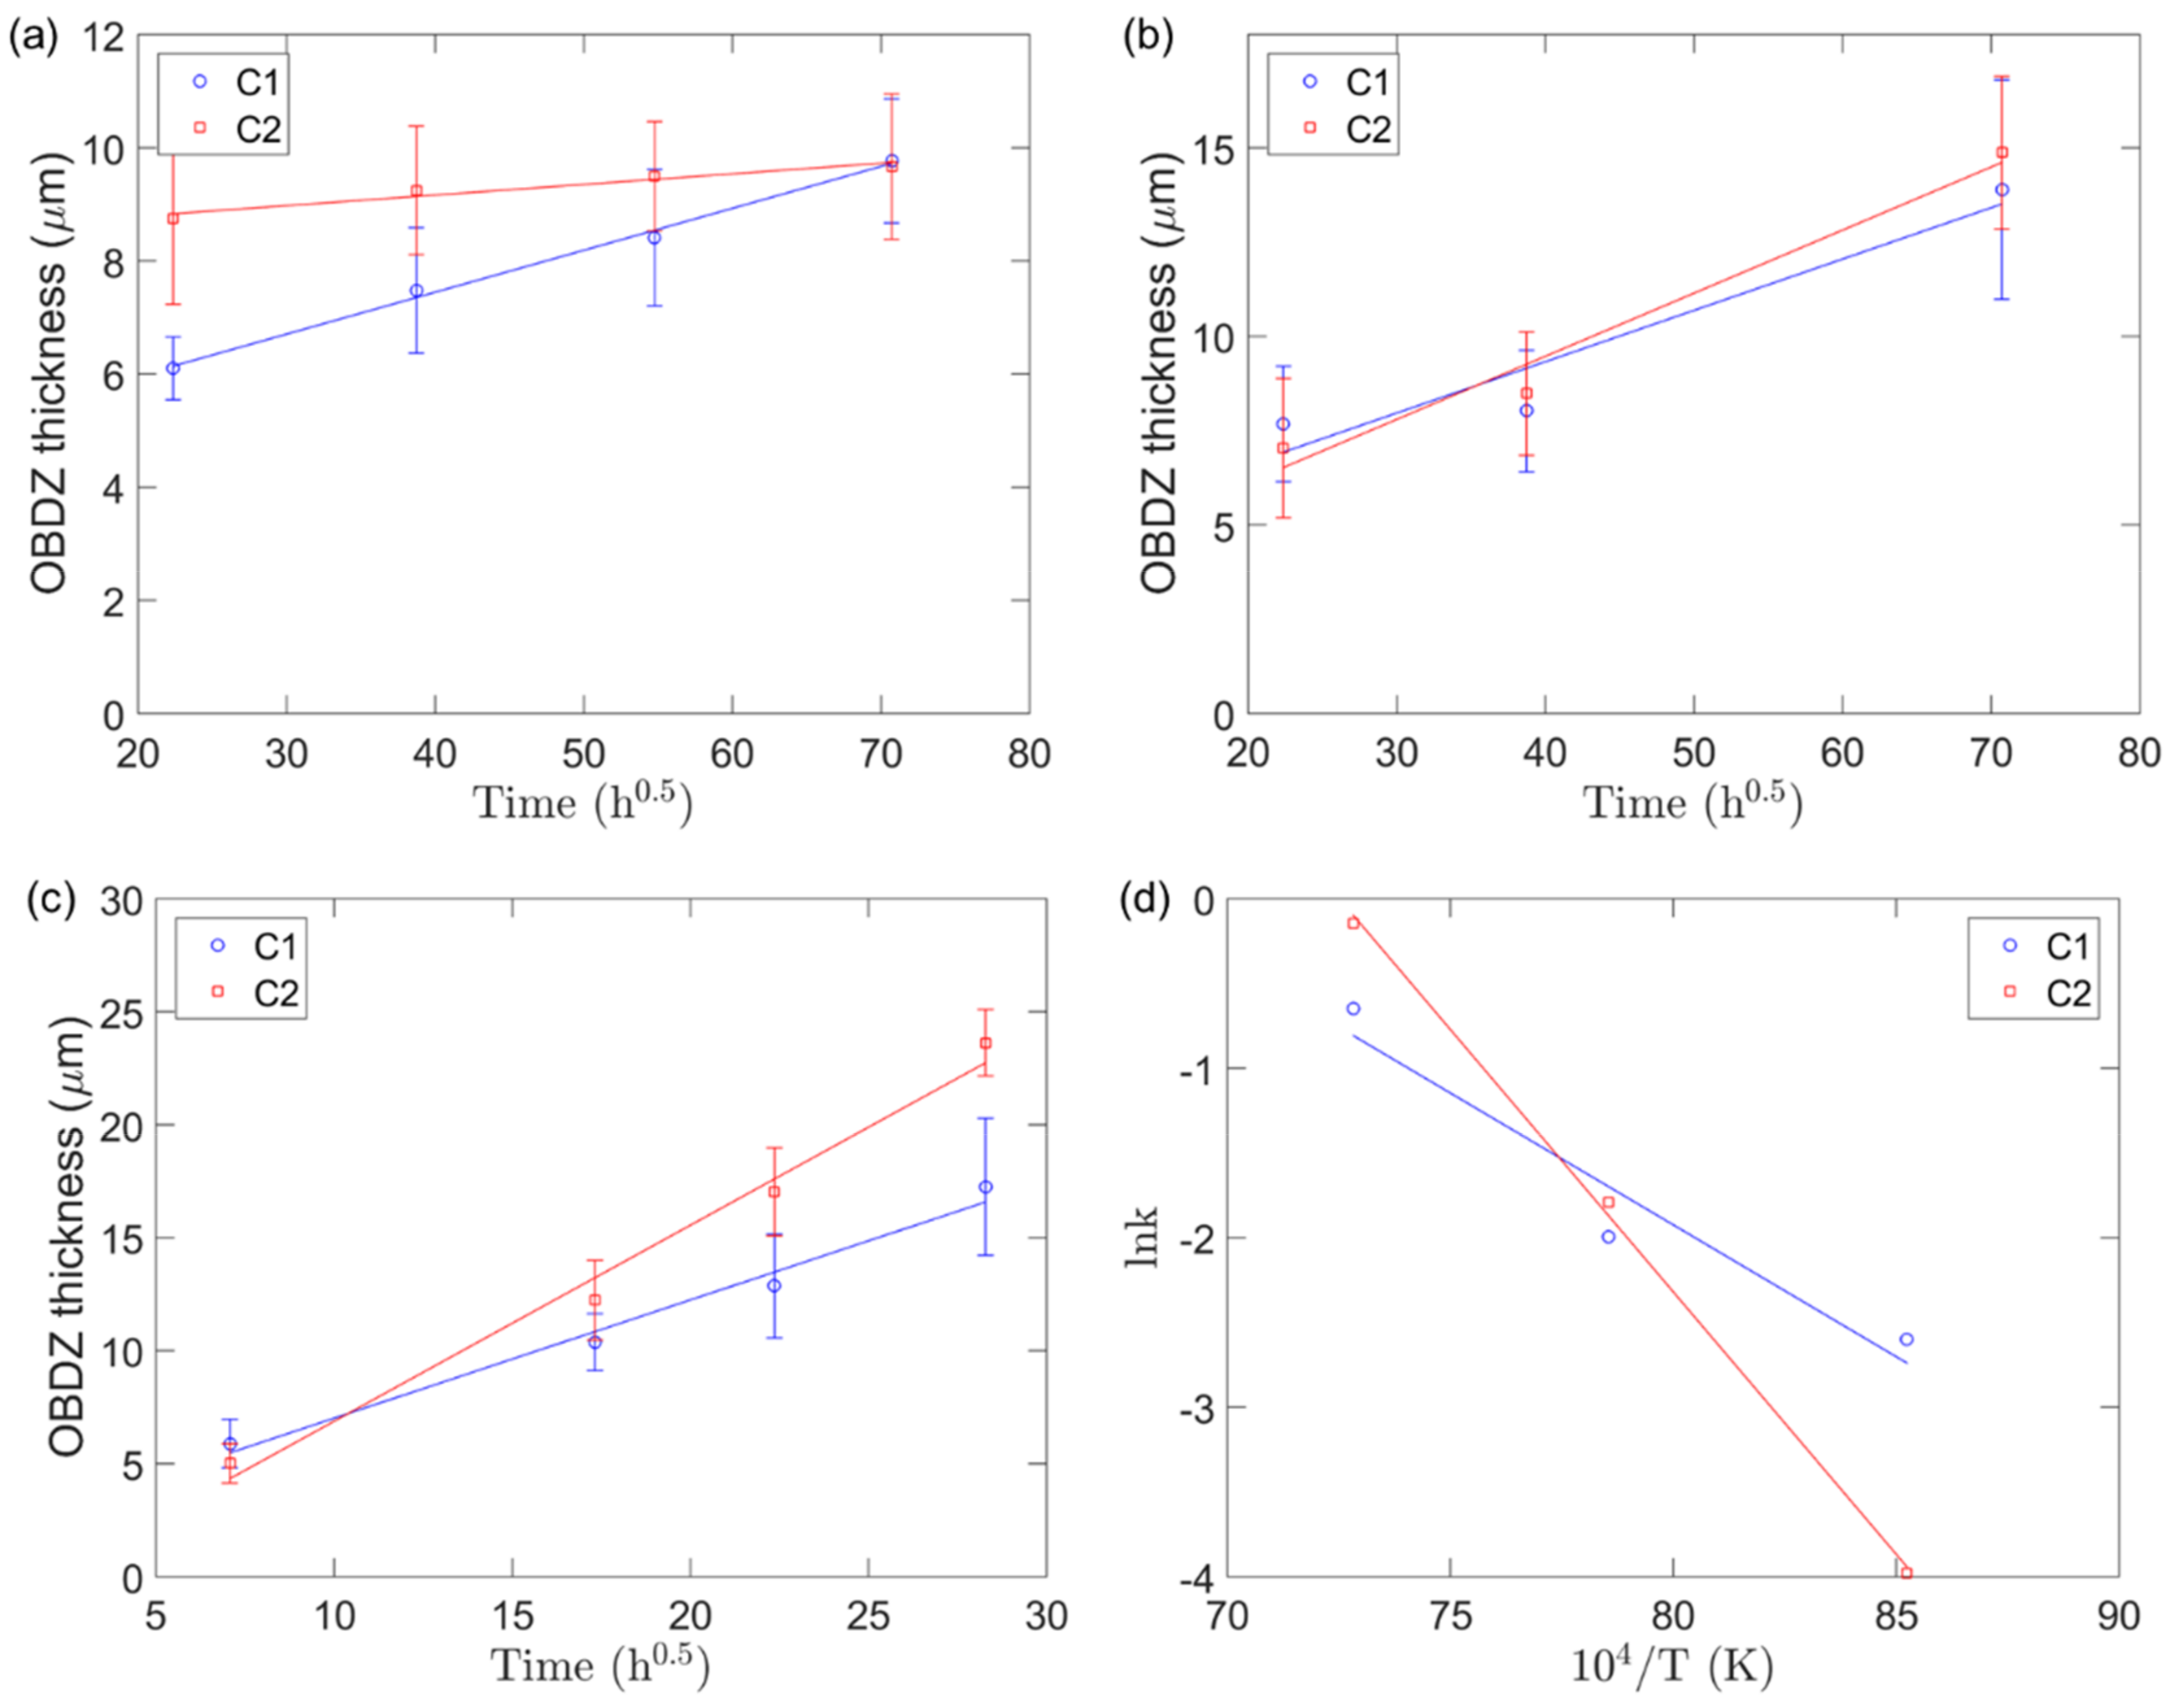
4.1.3. Oxidation Kinetics

The development of the outer β phase depletion zone (OBDZ), which appeared in the coatings below the coating-oxide interface (Figure 1), is directly connected to the loss of the Al due to surface oxidation. The OBDZ growth rate was used to represent the oxidation resistance of the coatings instead of the TGO growth rate. As is recognized, the growth of the OBDZ thickness, which represents the growth of the alumina scale, is assumed to be diffusion-controlled following a parabolic oxidation law:
h = ( k t ) 1 / 2
with k following the Arrhenius relationship:
k = k 0 e Q R T
where h represents the OBDZ thickness, k is the growth rate constant, t denotes oxidation time, Q is the activation energy, T is temperature, and R is the gas constant 8.314 J mol−1·K−1.
Figure 8 shows the evolution of the OBDZ thickness during oxidation versus the square root of oxidation time at different temperatures. As can be seen, the fitting of the regression models shows good correspondence with the experimental data, with coefficients of determination (R2) higher than 0.95. At 900 °C, the OBDZ thickness is quite large at 500 h for the C2 coating, which developed slower compared with that of the C1 coating. It corresponds to the microstructural observation in Figure 4 that the outward growth of the transient alumina on the C2 coating reached a certain thickness in a short time, resulted in a fast Al depletion (thick OBDZ) at 500 h. Once the transient alumina fully transformed into α-Al2O3, the overall growth of the alumina scale shifted to inward growth of the inner alumina layer. Due to the aforementioned Y effect, the inner layer of the C1 coating grew faster than that of the C2 coating, where Ce shows no such effect, leading to a faster overall alumina scale growth rate of the C1 coating. In the case of 1000 °C oxidation (Figure 5), the growth of the inner layer dominates the overall growth of the alumina scale in the C1 coating. However, the growth of the outer porous layer of the C2 coating also contributes to the overall growth of the alumina scale, giving a similar OBDZ growth rate. At 1100 °C, the larger OBDZ thickness growth rate of the C2 coating indicates that both the inner and outer alumina layers contribute to the overall growth rate of the alumina scale, leading to a larger growth rate of the C2 coating than of the C1 coating.
The temperature dependence of the OBDZ thickness growth rate constants were obtained from the slope of straight lines by fitting Equation (1) to the experimentally determined OBDZ thickness growth data in Figure 8a–c. It is apparent that the evolution of the OBDZ thickness of the C1 and C2 coatings follows the Arrhenius type (see Equation (2)) temperature. In Figure 8d the logarithm of the OBDZ rate constants k of the C1 and C2 coatings were plotted versus the inverse of temperature104/T. Both rate constants are in good agreement with this experiment range. It reflects the growth of the Al2O3 scale, since the Al in the OBDZ is mostly consumed through the formation of the alumina scale. From the slope in Figure 8d, the activation energy of OBDZ growth was found to be approximately 311 kJ/mol for the C1 coating. It is noted that the activation energy of the C1 coating is comparable with the activation energy of the α-Al2O3 growth of sputtered NiCrAlY (390 kJ/mol) [39] and that of NiAl (382 kJ/mol) [31]; however, it considerably less than that of the Al lattice diffusion in the Al2O3 (~500 kJ/mol) [40]. Most evidence indicates that the growth of the Al2O3 scale of the C1 coating is dominated by the grain-boundary diffusion of oxygen [39]. Also, the presence of Y may reduce the kinetics of the Al lattice diffusion, which has been reported in reference [41]. However, the activation energy of the C2 coating is 619 kJ/mol, which is even higher than the activation energy of the Al lattice diffusion in the Al2O3. It can be explained that the growth of the outer transient alumina layer has a great impact on the overall growth of the alumina scale in the C2 coating, indicated by the relatively thick outer alumina layer of the C2 coating at different oxidation temperatures. The shifting of the dominant growth mechanisms from the outward growth of the outer layer to inward growth of the inner layer in the C2 coating alters the growth rate of the C2 coating, especially at 900 °C, which causes a deep slope in Figure 8, giving a much higher activation energy of the C2 coating. Thus, the addition of Y suppresses the growth of the outer layer and modifies the overall alumina growth mechanism. In contrast, the addition of Ce does not modify the alumina scale growth, leading to a mutual growth of both the outer and inner alumina layers and therefore a much higher oxidation activation energy.

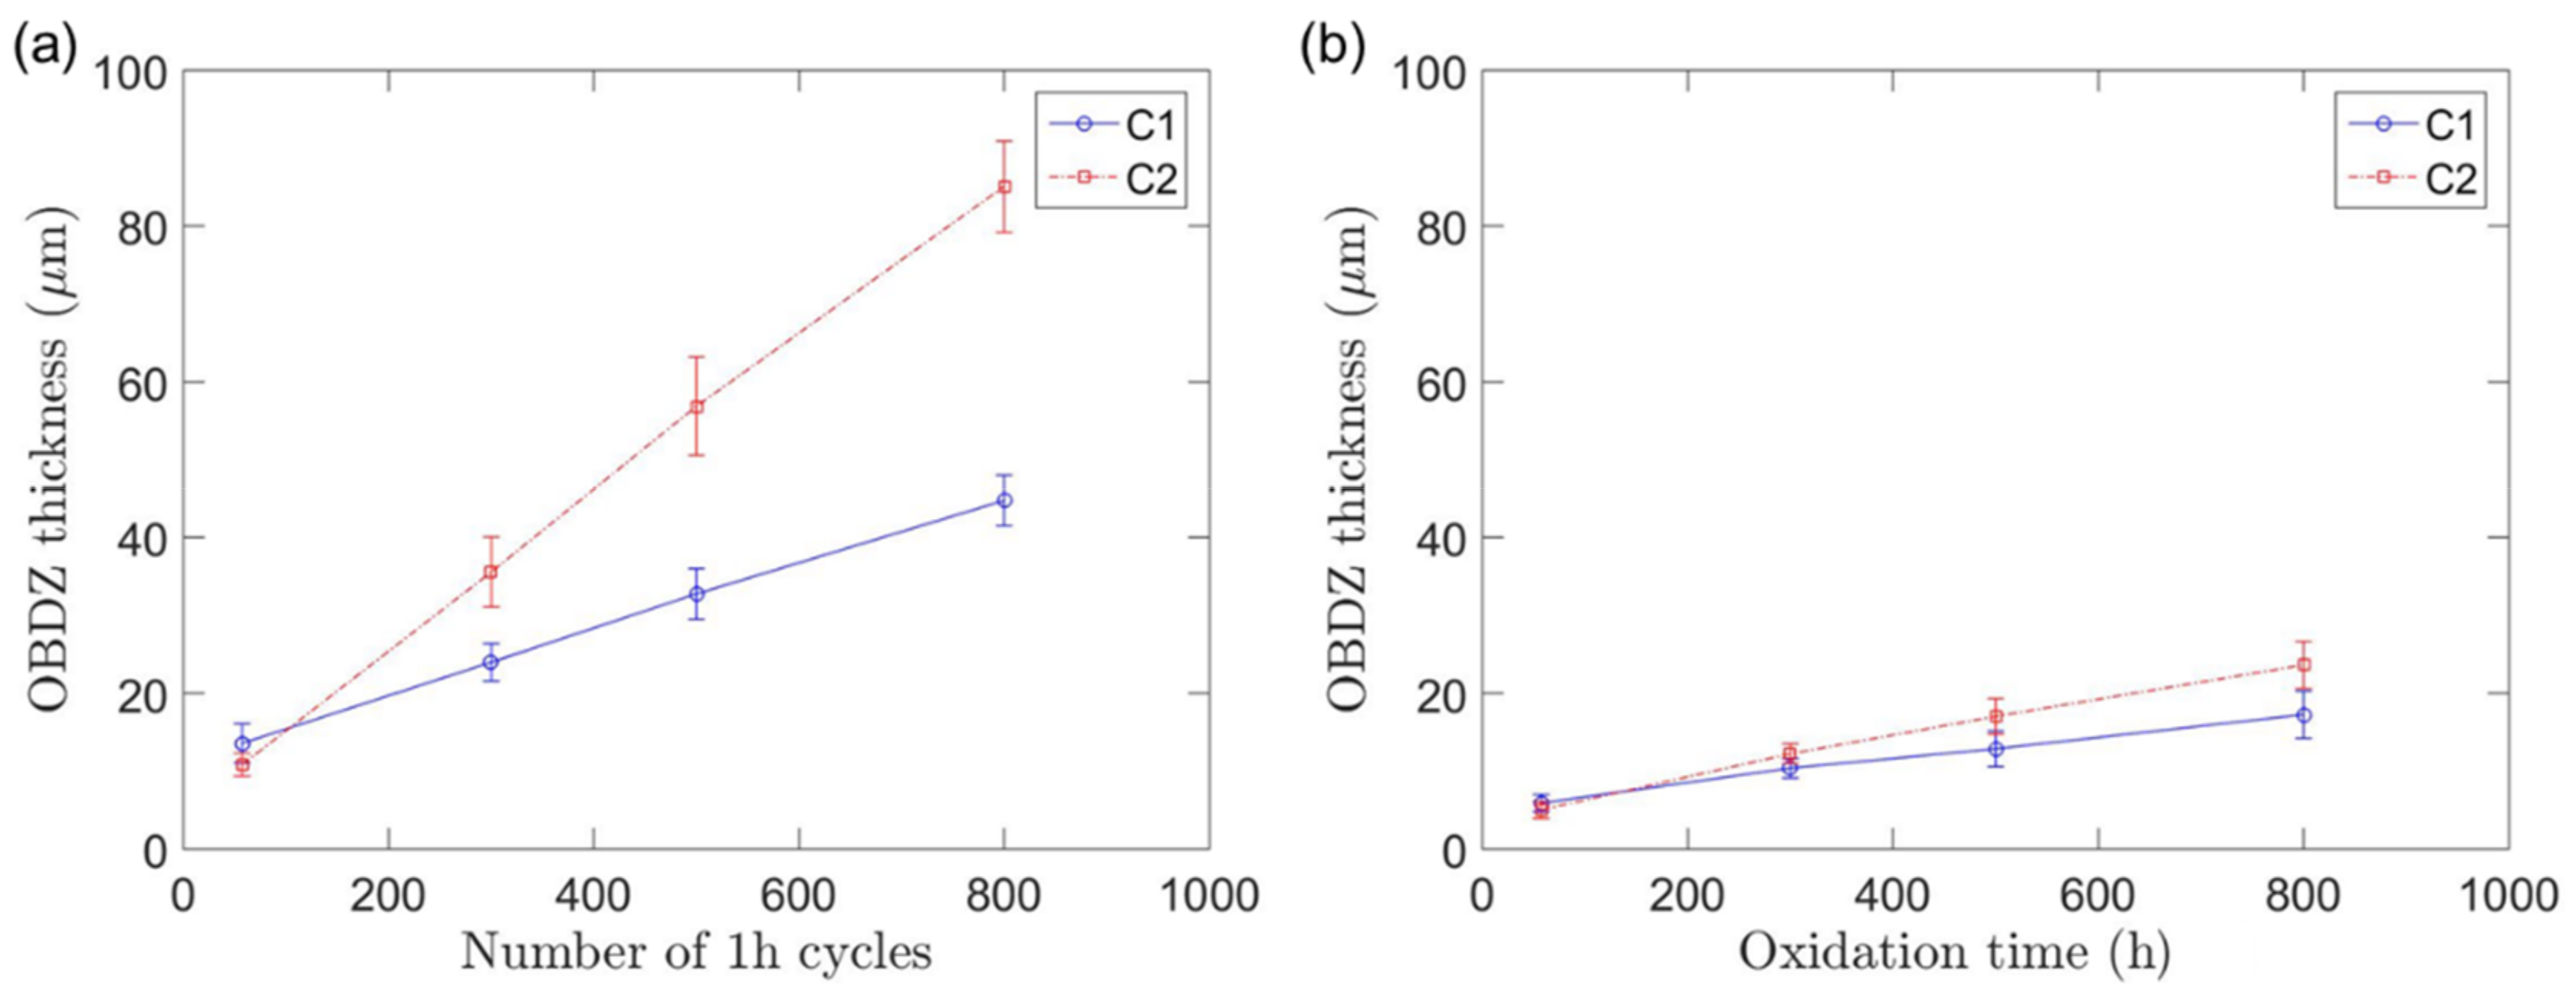
4.1.4. Cyclic Oxidation Resistance

The spallation of the oxide scale will accelerate the consumption of Al, which leads to fast depletion of the β phase in the coating, and thus, a comparison of the OBDZ growth rate between the isothermal and cyclic oxidation tests can be used to evaluate the spallation resistance of the oxide scale. Figure 9a,b show the OBDZ thickness changes of the Y + Ru-doped C1 coating and the Ce-doped C2 coating during cyclic oxidation testing at 1100 °C and isothermal oxidation testing at 1100 °C, respectively. The results were obtained by measuring the thickness evolution of the OBDZ with oxidation time.
From Figure 9, it can be observed that for the C2 coating the OBDZ thickness after 800 cycles in the cyclic oxidation test (85.1 ± 5.9 μm) was 3.6 folders of that after 800 h of the isothermal oxidation test (23.6 ± 1.5 μm). For the C1 coating, the OBDZ thickness difference between the isothermal oxidation (17.2 ± 3.0 μm) and the cyclic oxidation (44.7 ± 3.3 μm) was much smaller. As no obvious TGO spallation was observed under the isothermal oxidation test, the accelerated OBDZ growth rate observed in the cyclic oxidation test for both coatings was mainly related to TGO spallation due to thermal stresses induced by the temperature changes. The much larger OBDZ thickness of the C2 coating, twice of that of the C1 coating, after 800 cycles indicated a poorer spallation resistance of the former. There is no doubt that a significant difference exists between Y + Ru and Ce dopants in improving the scale adhesion. Ogawa et al. [42] observed root-like oxide precipitates in the TGO in coatings containing Ce, which improved the TGO adhesion due to an anchor effect, and the influence was found to become more pronounced when the amount of Ce increased. However, no such root-like oxide precipitates were found in the TGO in the Ce-doped C2 coating. This could be due to a too small amount of Ce addition (0.2 wt %) compared with Ogawa’s work (0.5, 1, 1.5 wt %). Therefore, considering its poor isothermal oxidation and cyclic oxidation resistance, the C2 coating with 0.2 wt % Ce doping could not provide as good oxidation resistance as 0.3 wt % Y-doped C1 coating.

4.2. Simulation Results

Because no Ru can be identified in the TGO layer, and the Ru-oxide formation energy is low (94.25 kJ/mol) compared to that of the Al2O3 (847.25 kJ/mol) at 1000 °C, it is reasonable to assume that Ru has no direct influence on the surface oxidation of the coatings. The beneficial effect of Ru on prolonging the coating lifetime derives from its effect on reducing the loss of the Al to the substrate through interdiffusion, which was observed in the C1 coating. As Figure 1 shows, the inner β phase depletion zone in the C1 coating is much smaller than that in the C2 coating. Results from the different simulations to explore the mechanisms behind the Ru effect are presented below.

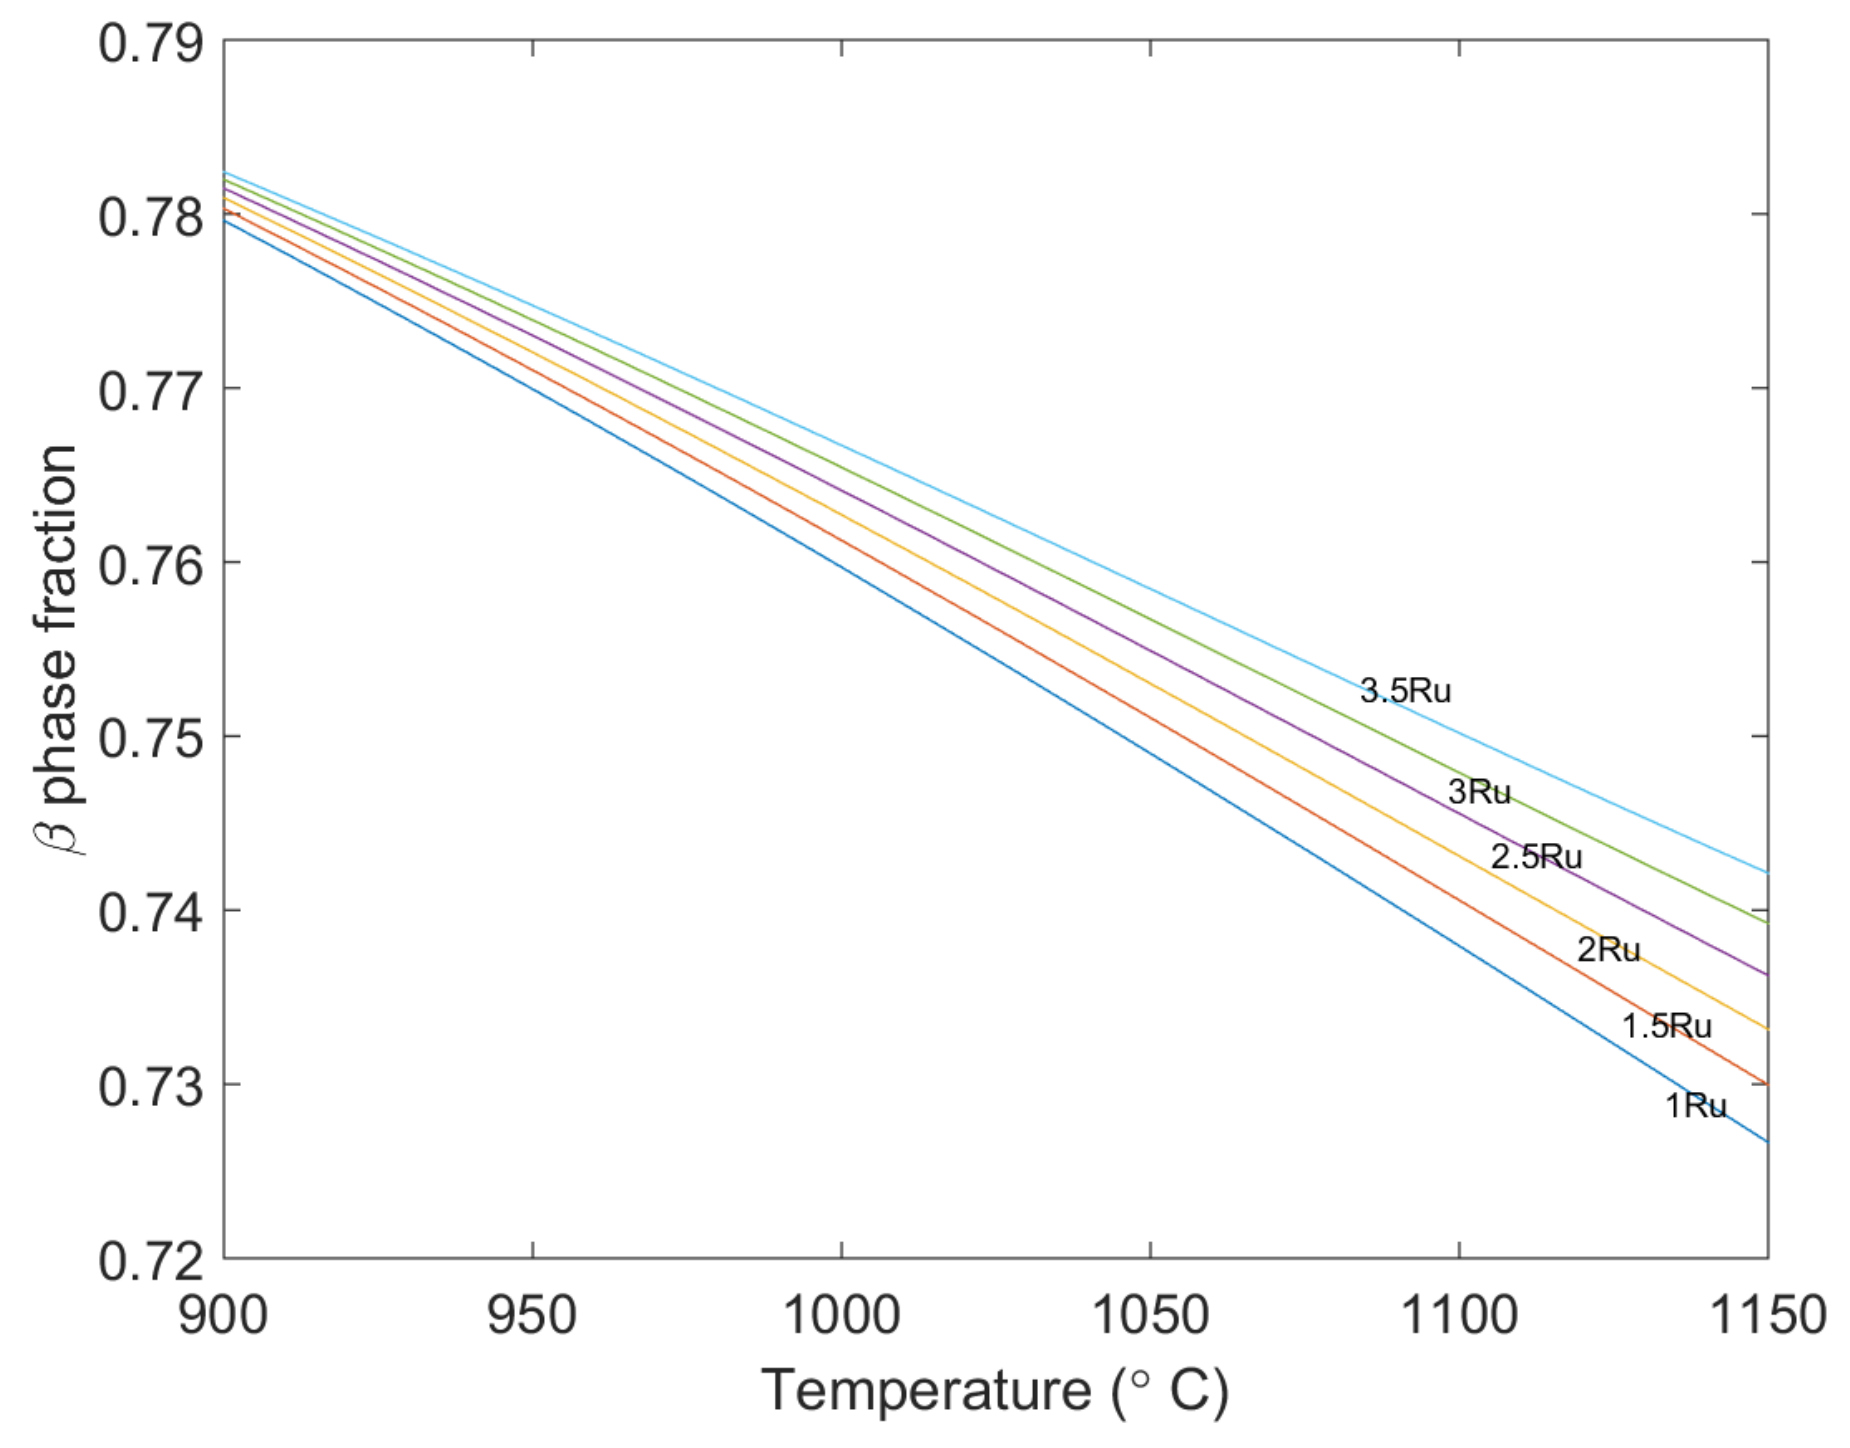
4.2.1. Phase Equilibrium Calculation

Because the simulation is based on the combination of diffusion and phase equilibrium calculation, the effect of Ru on the interdiffusion was further investigated by phase equilibrium calculation using Thermo-Calc, see Figure 10. Several different alloy systems with similar compositions to the C1 coating were chosen: starting with Ni27Co15Cr12.5Al + 1Ru (in wt %) and then increasing Ru to 3.5Ru with a step size of 0.5 wt % of Ru at the expense of Ni. It is clear that the β phase fraction decreased with the decreasing Ru concentration in the alloy, from 74% to 71.5% at 1100 °C, indicating that Ru stabilizes the β phase in the alloy systems. This result is consistent with [23], which claimed that Ru greatly stabilizes the β phase by largely extending the β phase field in the phase diagram.

4.2.2. Short-Range Diffusion

The moving phase boundary model was applied to simulate short-range diffusion through the γ/β phase boundary in the coating for two coating systems, named S1 and S2, under high temperature exposure. The chemical composition of the γ and β phases in S1 and S2, given in Table 3, were based on EDS measurements of the heat-treated coating C1 and C2, respectively. The chemical gradient of other minor elements, such as Si, Mo, and Ta was neglected in order to highlight the influence of Ru on the short-range diffusion between the γ and β phases and to accelerate the simulation speed as well.
Figure 11 shows the interfacial position (phase boundary) movement of the S1 and S2 systems with time for up to 107 s at 1100 °C (Note that the original phase boundary for both S1 and S2 were at 5.5 μm and 800 h is 2.88 × 10⁶ s). It can be seen that the interfacial position of both S1 and S2 changed with time and reached a new equilibrium state after 105 s because there was no interference from outside the system. Comparing S1 and S2, the interfacial position moved by 0.4 µm towards the γ phase region for S1 but 0.8 µm towards the β phase region for S2. This means that the β phase region had the tendency to grow in S1 but to shrink in S2.
Figure 12 shows the calculated Al concentration profiles of the S1 and S2 systems at 0 s and 105 s, the Al concentration profiles at other times were not included, as they were close to the data at 105 s. The γ phase region and β phase region were arranged from left to right in the moving phase boundary model, and the interface was set at a distance of 5.5 µm. The concentration of the Al in β decreased with increasing time in both systems. For the S1 (Figure 12a), the Al concentration in γ increased only by 0.6 wt % along with the decrease of the Al in β, and the expanding of the β phase region indicates only a small amount of the Al diffused from β into γ. For the S2 (Figure 12b), however, the diffusion of the Al from β into γ led to an increase of the Al by 1.8 wt % in the γ phase. According to the Thermo-Calc calculation, the Al diffusivity in the γ phase is 4.9 × 10⁻¹³ m2/s and in the β phase is 9.7 × 10⁻¹⁴ m2/s, for S1 and S2, respectively. Hence, from the analysis above, the Al in the S2 system diffused from β into γ rapidly, which means the inward diffusion of the Al from the coating to the substrate is faster in S2 as the Al diffusivity in the γ phase is higher than in the β phase. Thus, the addition of Ru in the C1 coating stabilizes β and slows down β phase depletion.
The difference of the Al solubility in β phase of the C1 and C2 coating can be explained with the Ru effect. The Al and Ru concentrations in the γ and β phases from the EDS measurements on the C1 and C2 coatings after heat treatment are listed in Table 4. A slightly higher Al concentration was shown for the C2 coating containing Ce. The influence of Ru on the Al solubility in the β phase at various temperatures was also calculated using Thermo-Calc, and the initial composition of the C1 coating was the input. The results shown in Figure 13 are the projection of a three-dimensional diagram with the weight percent of the Al and Ru, namely the solubility of the Al and Ru, in the β phase as x- and y-axes and temperature as z-axis. The temperature was marked selectively in the diagram. The solubility of the Al increased with increasing Ru solubility, from 17.6 wt % at 1200 °C to 18.15 wt % at 1080 °C, and reached 17.94 wt % at the maximum solubility of Ru, 6.56 wt % in β. According to the equilibrium calculation, the increasing enrichment of Ru in the β phase will enlarge the solubility range of the Al in the β phase. Thus, the increasing amount of Ru in the β phase would aid the partition of the Al in β phase.

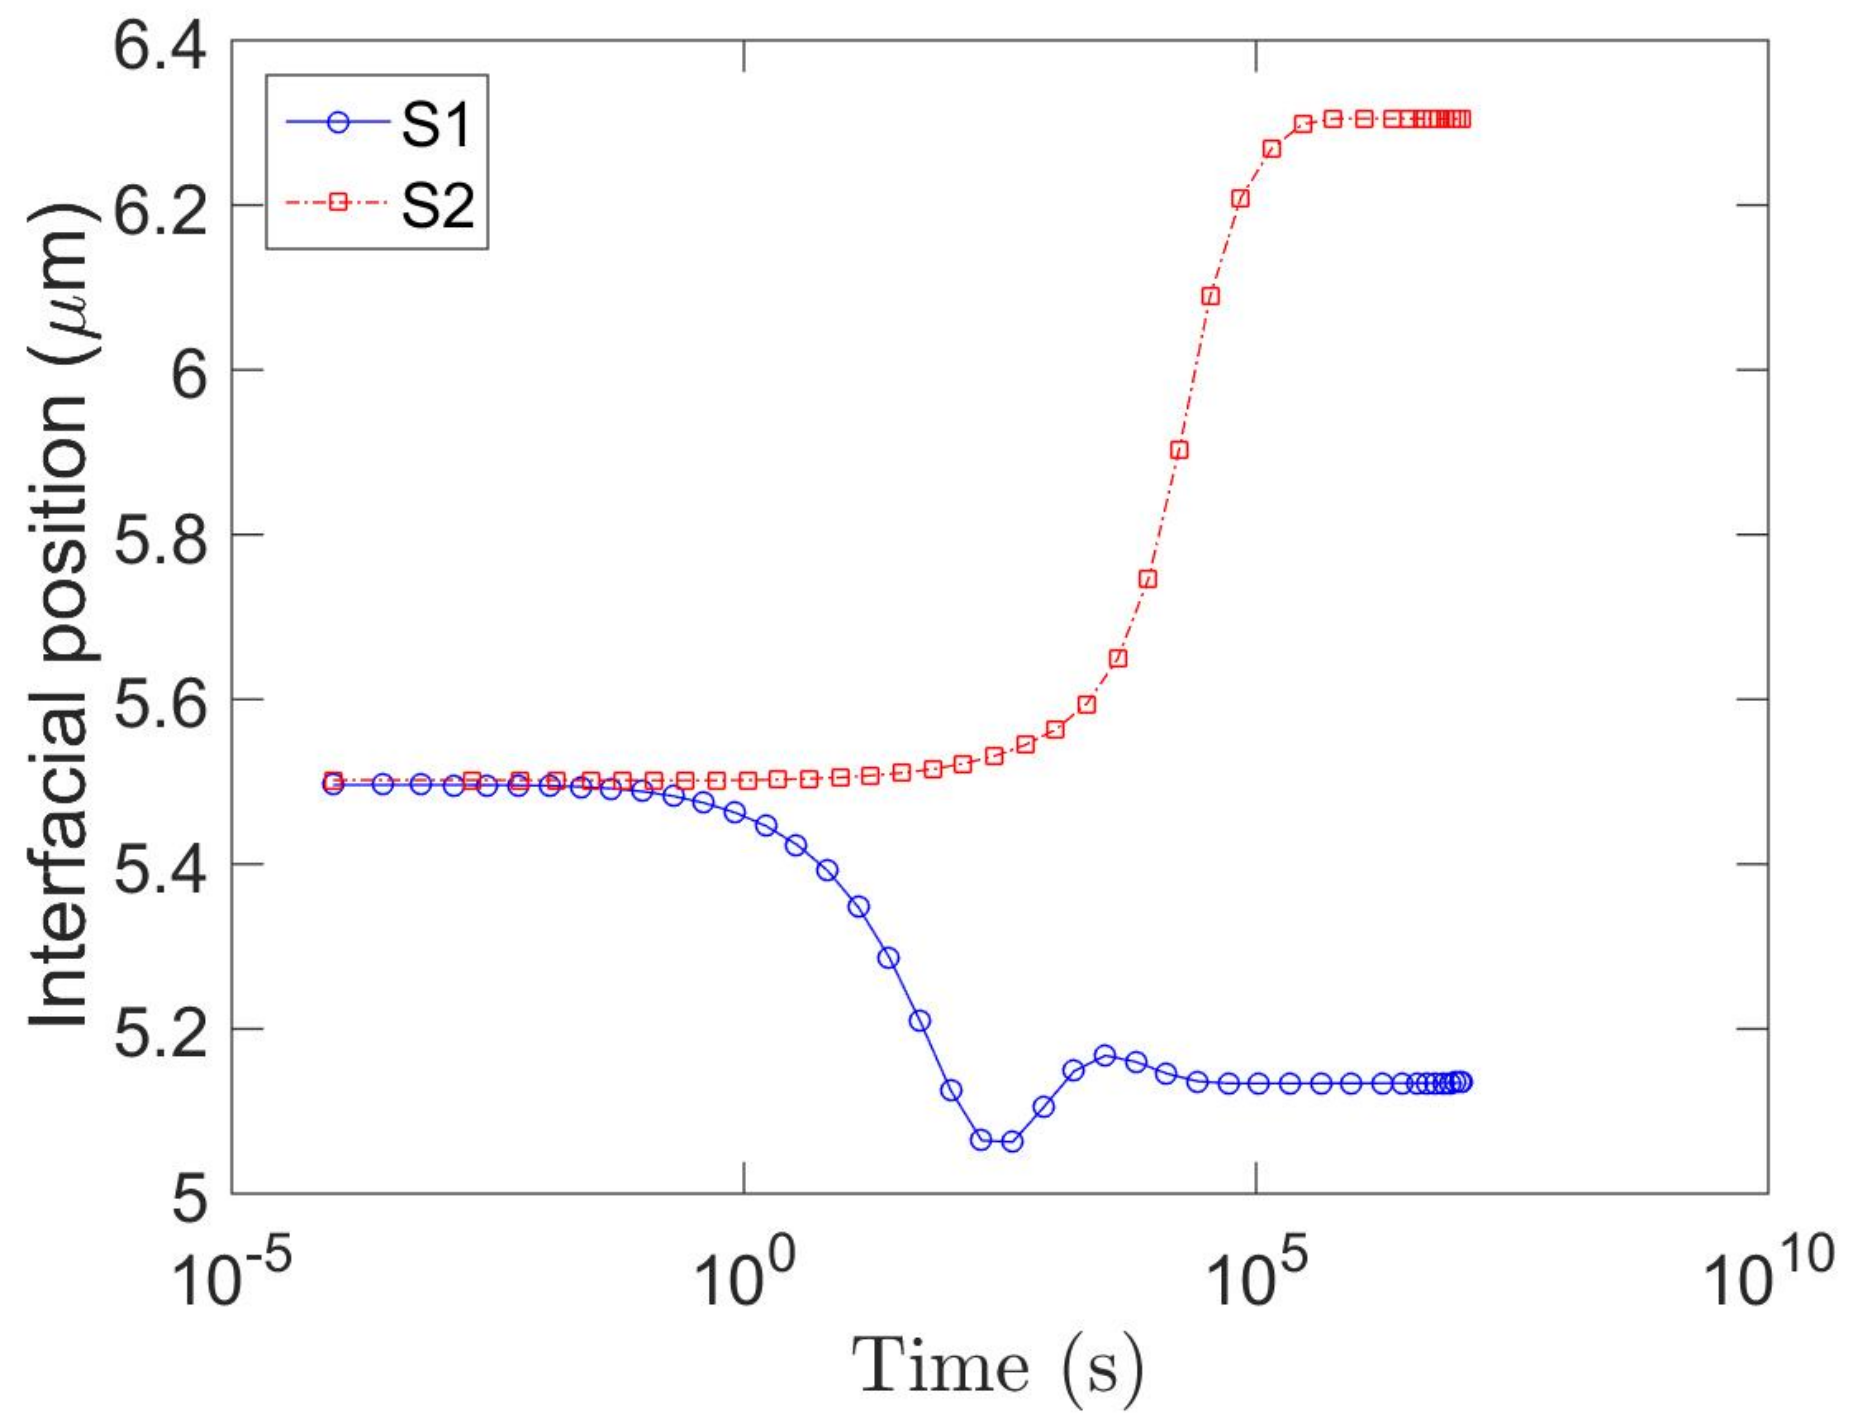
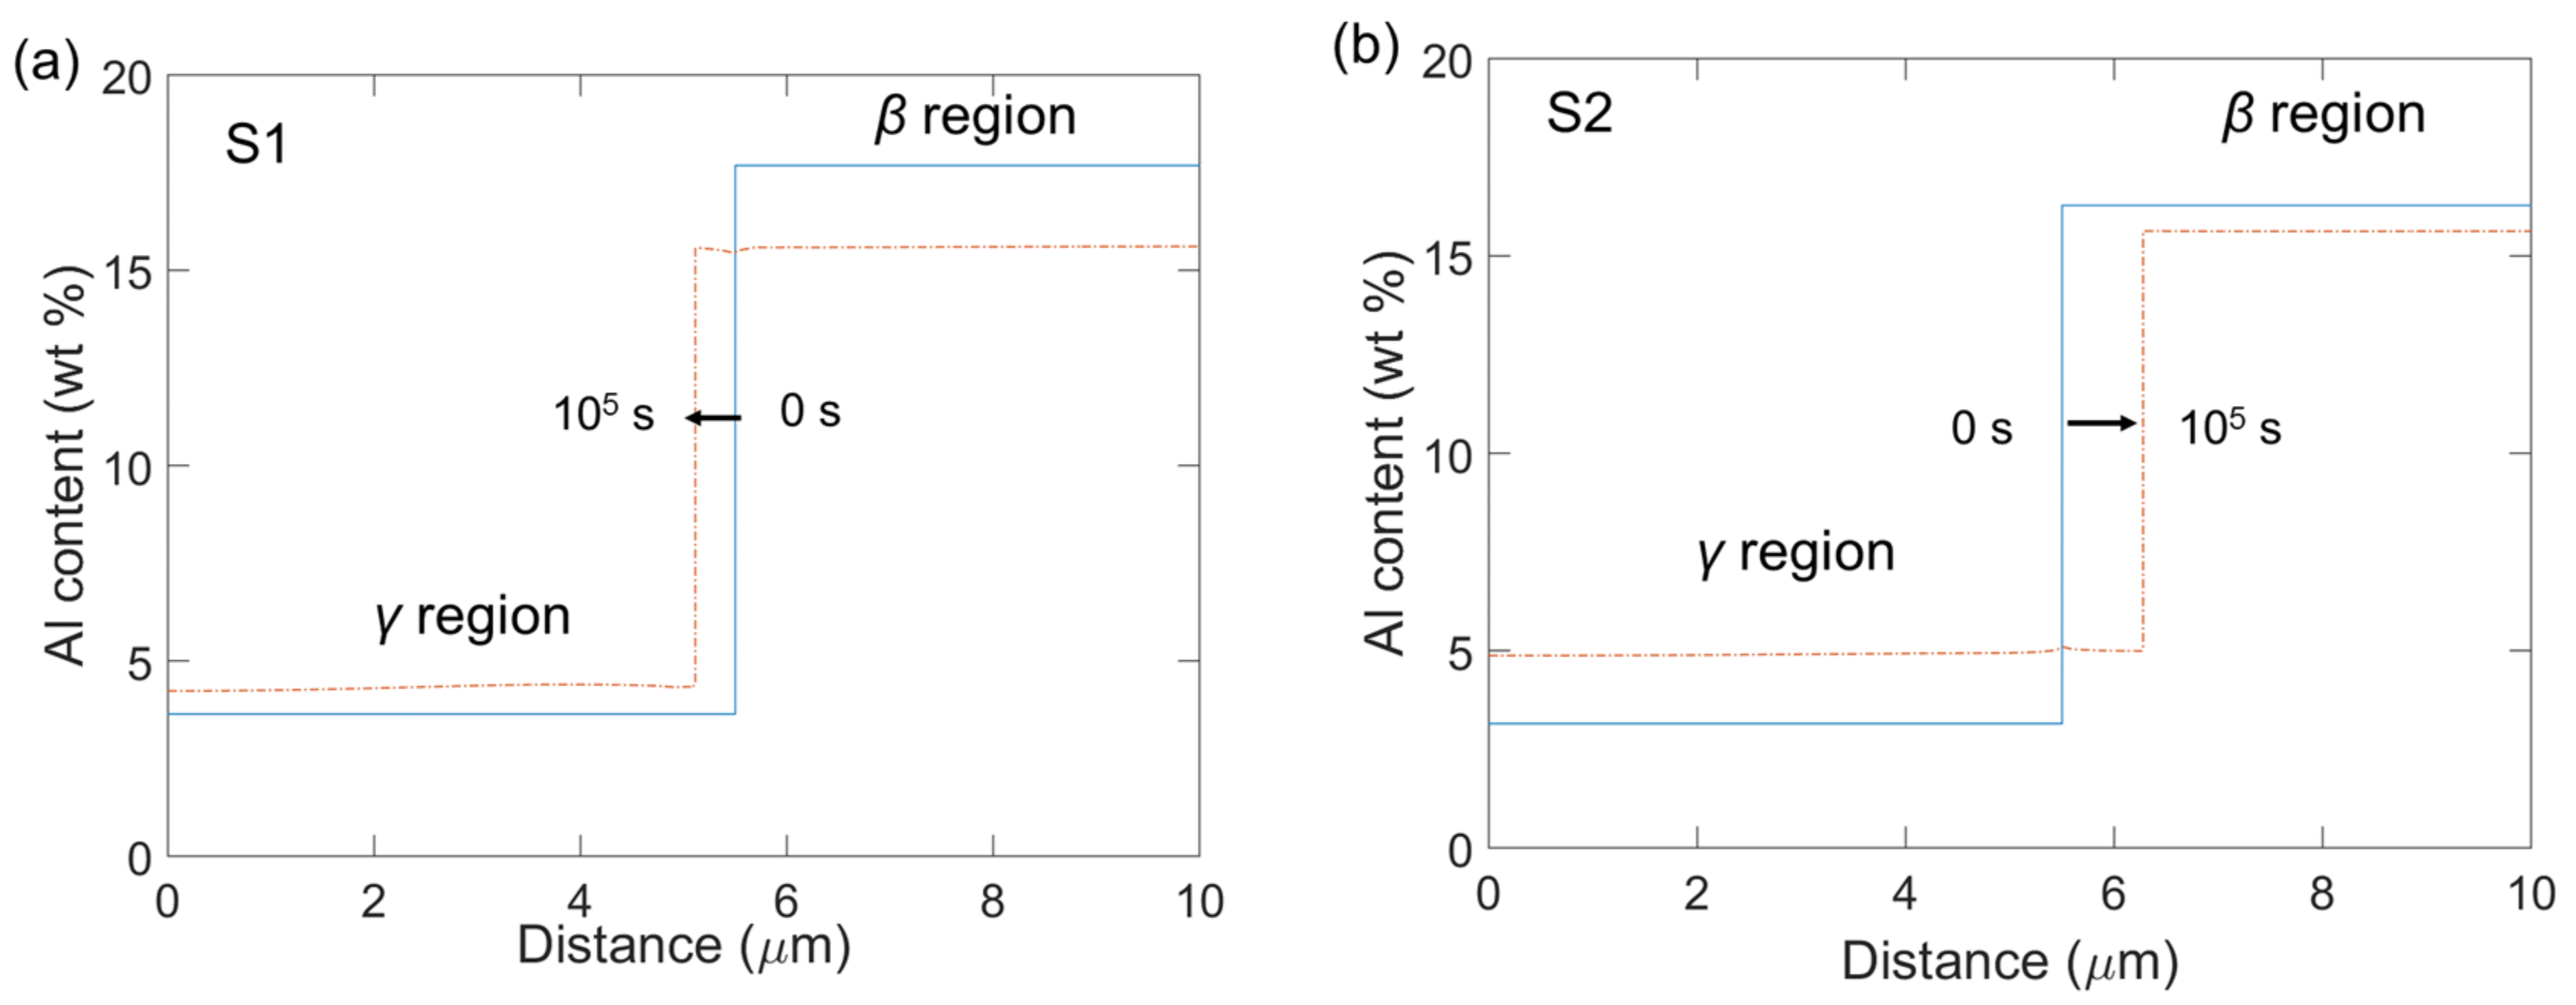
4.2.3. Long-Range Diffusion

Interdiffusion between the coating and substrate can result in β-depletion near the coating-substrate interface on the coating side (Figure 3) as aluminum moves from the coating to the substrate. The β phase depletion rate, controlled by diffusion, is expected to follow Equation (1). To demonstrate the Ru effect on the phase equilibrium and diffusion, which has been mentioned in previous sections, the long-range diffusion between the coating and the substrate were simulated using the oxidation-diffusion model by studying the β phase depletion rate.
Figure 14a shows the simulation results of the β phase depletion for the Y + Ru-doped C1 coating at 1100 °C. Simulation was also performed for the C2 coating but the results are not presented here. Figure 14b shows both the isothermal 1100 °C oxidation test data and simulation data of the IBDZ (inner β-depletion zone, Figure 14a) thickness versus square root of time. The IBDZ growth rates of the C1 and C2 coatings were 1.44 and 2.17 μm/h0.5, respectively, which were consistent with the simulation results (1.52 μm/h0.5 for C1 and 2.05 μm/h0.5 for C2). Thus, both the simulation and experimental analyses showed that the addition of Ru in the C1 coating decreased interdiffusion induced β phase depletion. The DICTRA simulation is based on the coupling phase equilibrium calculation and the solving of Fick’s law on each small-time steps and nodes. The element diffusivity data in oxidation-diffusion model is essential to solving the Fick’s law, which derived from the calculation of the effective diffusivity of each element according to homogenization model 5 in DICTRA. Thus, the long-range diffusion simulation is actually the comprehensive coupling of element effect on both the phase equilibrium and diffusion behavior. Since the simulation results agreed well with the experimental results and the IBDZ growth rate of the C1 coating is lower than that of the C2 coating, the profound effect of Ru on stabilizing the β phase and its effect on decreasing short-range diffusion can be proved by the long-range diffusion simulation. Therefore, the Ru effect on retarding the long-range diffusion of the Al between the coating and the substrate can be inferred.
In summary, the simulations on both short-range and long-range diffusion demonstrated that Ru addition in the NiCoCrAlX coating increased the Al solubility in the β phase, as well as the β phase fraction. Due to a higher diffusivity of the Al in γ phase than in β phase, these two effects contributed to the stabilization of the β phase and the slowdown of the inward diffusion of the Al from the coating to the substrate.

5. Conclusions

Oxidation behavior of NiCoCrAlX coatings with Ce and Y + Ru additions was compared in different test conditions. Conclusions can be drawn as follows:
A two-layer structure alumina scale developed in the TGO of both the Y + Ru-doped coating and Ce-doped coating: an outer porous outward-grown layer, and an inner inward-grown layer. The continued growth of the outer and inner Al2O3 layer depleted the Al from the coatings, and the growth behavior of the two layers differed at different temperatures, which is also dependent on coating composition.
  • Comparison of the activation energy for the OBDZ growth with that for the Al lattice diffusion in Al2O3 indicates that the growth of the alumina scale in the Y + Ru-doped coating is dominated by grain boundary diffusion of oxygen with the positive effect of Y to increase the growth kinetics of the alumina scale. However, the Ce-doped coating shows a different alumina scale growth kinetics.
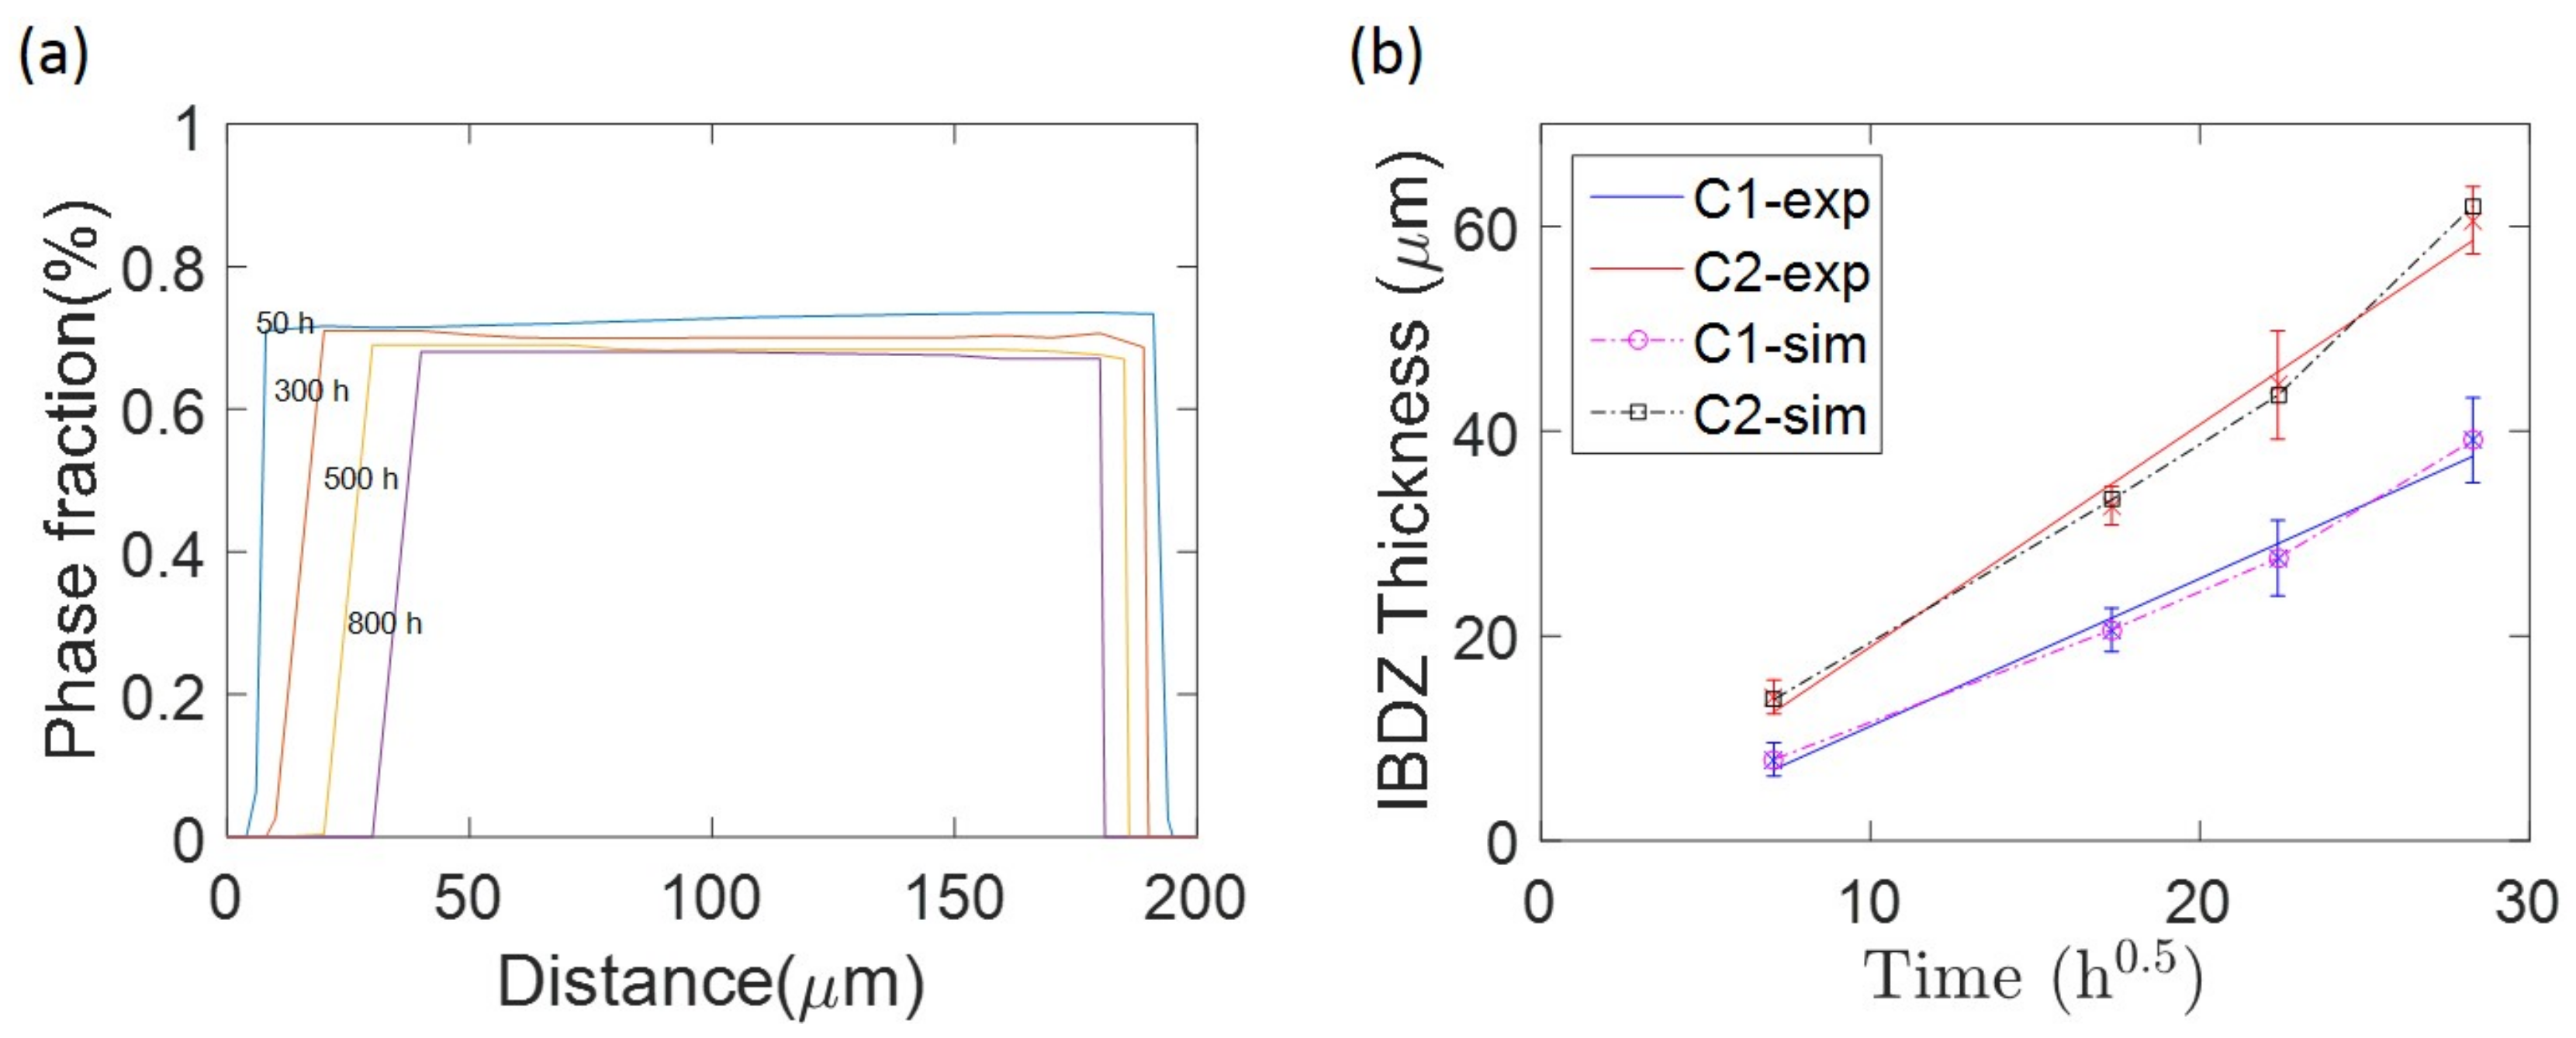
  • In comparison with the Ce-doped coating, the Y + Ru-doped coating showed a lower growth rate of the outer β-depletion zone (beneath the protective scale) in both isothermal 1100 °C and cyclic oxidation tests, indicating a better resistance to oxide growth and a stronger adhesion of the TGO. The spallation of the alumina scale in the Ce-doped coating at 1100 °C accelerated the consumption of the Al in the coating.
  • The addition of Y in MCrAlX coatings plays an important role during coating oxidation, including modifying alumina growth mechanisms, aiding the columnar alumina microstructure formation, and increasing alumina scale adhesion against spallation. However, none of such positive effects can be observed by the addition of 0.2 wt % Ce in the MCrAlX coating. Therefore, it is reasonable to assume that the addition of 0.2 wt % Ce cannot replace the important role of Y in MCrAlX coatings.
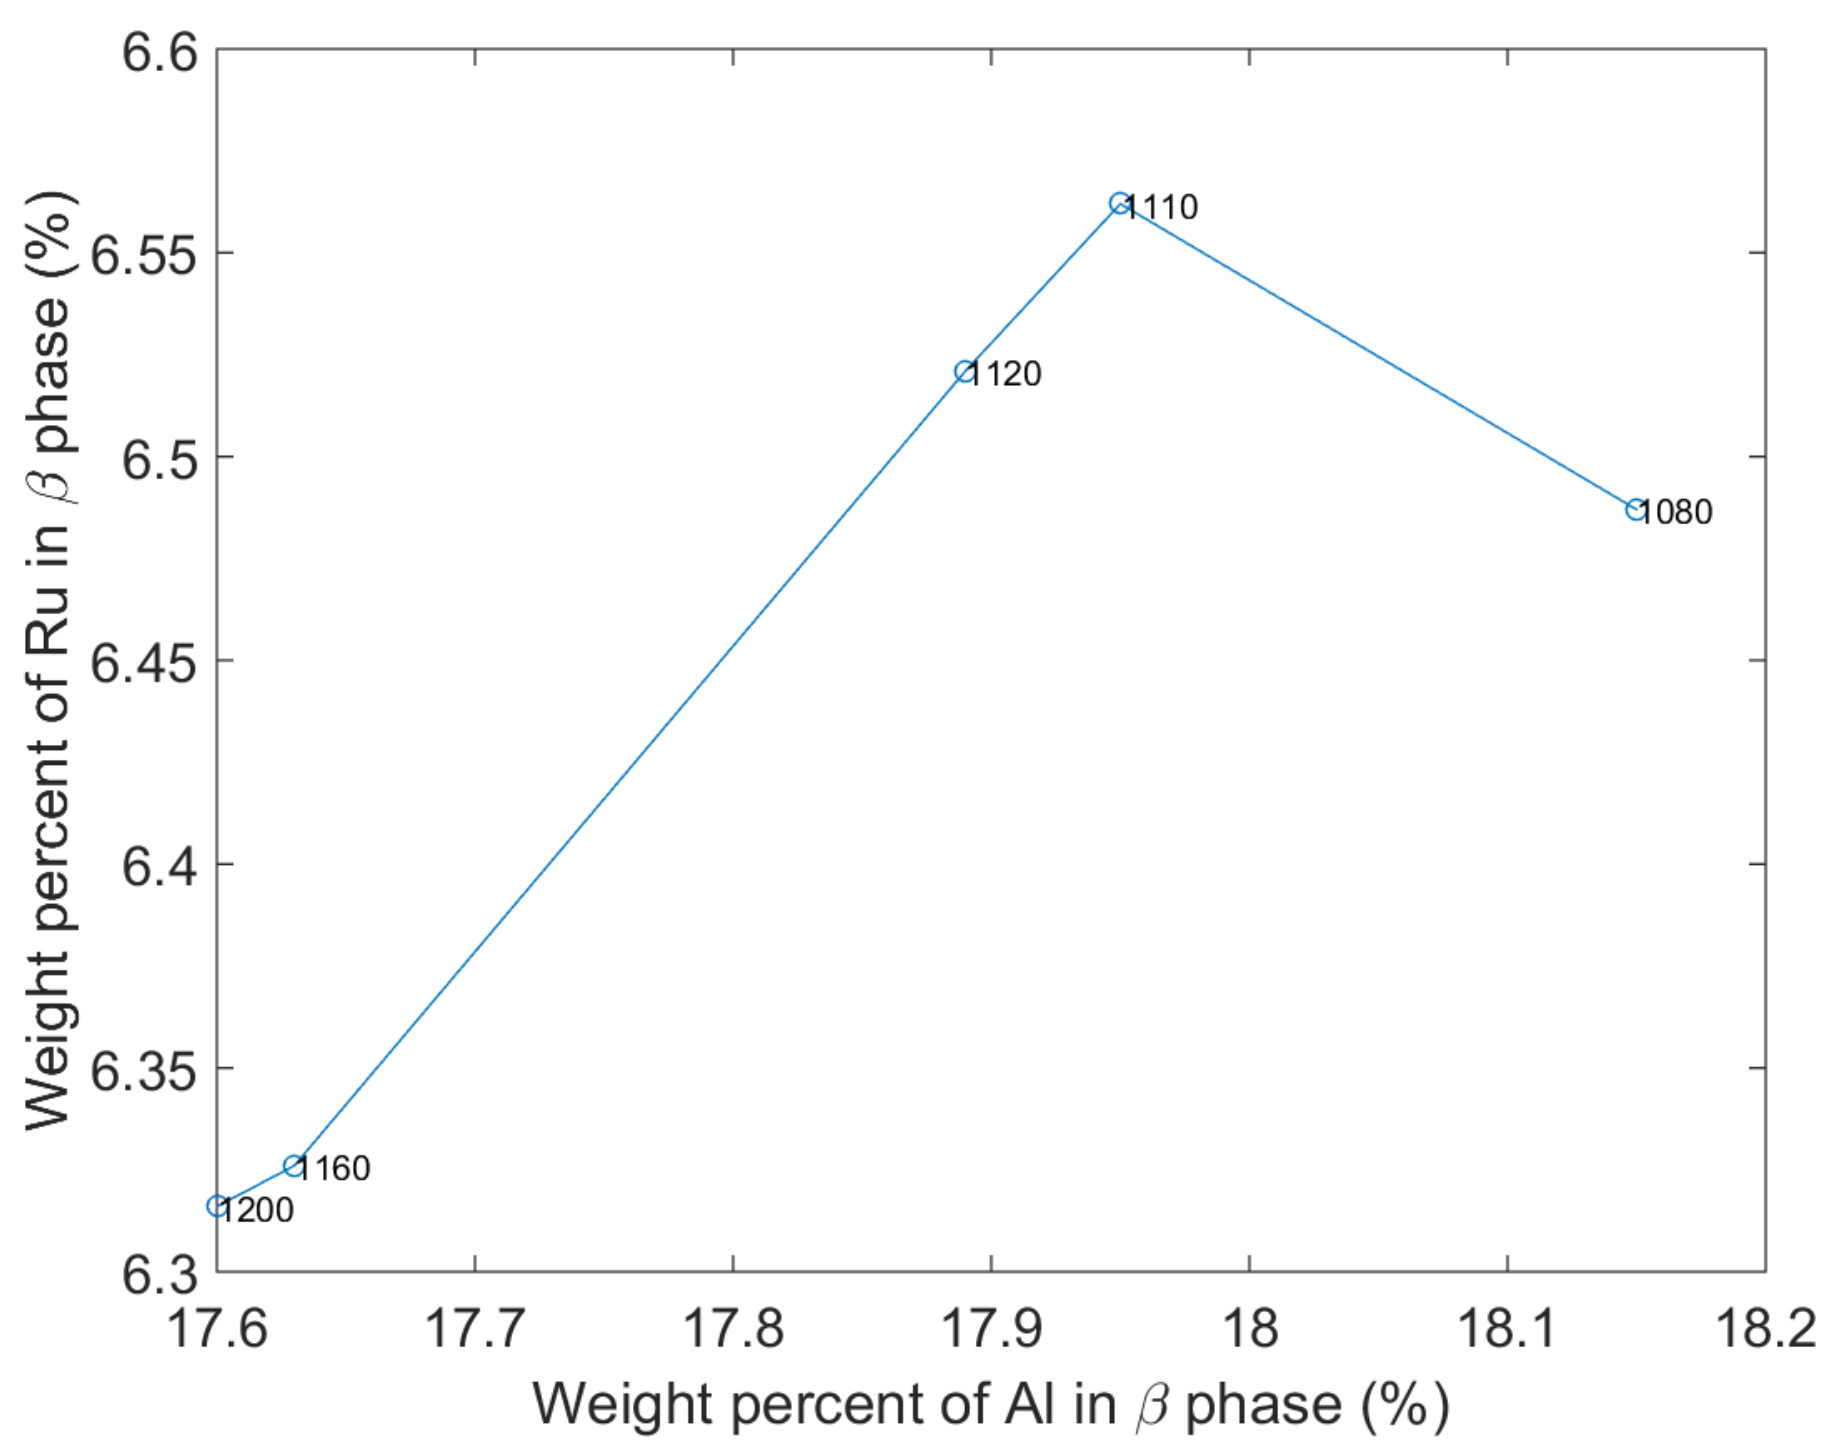
  • The Y + Ru-doped coating exhibited a lower growth rate of inner β-depletion zone (near the coating-substrate interface) induced by interdiffusion. The simulation results show that the addition of Ru increases the solubility of the Al in the β phase and the β phase fraction, which reduces the loss of the Al due to interdiffusion and stabilizes the β phase.
While the addition of about 3.3 wt % Ru in Ru + Y-doped coating seems to significantly increase resistance against substrate interdiffusion, the substitution of Y (0.3 wt %) by a similar amount of Ce (0.2 wt %) greatly decreases the oxidation resistance at the coating surface.

Acknowledgments

The author would like to greatly acknowledge the Siemens Industrial Turbomachinery AB (Finspång, Sweden) for all contributions to this project and the Swedish Energy Agency through the KME consortium—ELFORSK—for their financial support. The project teams at Linköping University are also acknowledged for their support on this research.

Author Contributions

Pimin Zhang and Ru Lin Peng conceived and designed the experiments; Pimin Zhang and Xin-Hai Li performed the experiments; Pimin Zhang analyzed the data; Ru Lin Peng and Sten Johansson contributed reagents/materials/analysis tools; and Pimin Zhang wrote the paper.

Conflicts of Interest

The authors declare no conflict of interest.

References

  1. Brandl, W.; Toma, D.; Krüger, J.; Grabke, H.J.; Matthäus, G. The oxidation behaviour of HVOF thermal-sprayed MCrAlY coatings. Surf. Coat. Technol. 1997, 94–95, 21–26. [Google Scholar] [CrossRef]
  2. Chen, L.C.; Zhang, C.; Yang, Z.G. Effect of pre-oxidation on the hot corrosion of CoNiCrAlYRe alloy. Corros. Sci. 2011, 53, 374–380. [Google Scholar] [CrossRef]
  3. Smeggil, J.G. Some comments on the role of yttrium in protective oxide scale adherence. Mater. Sci. Eng. 1987, 87, 261–265. [Google Scholar] [CrossRef]
  4. Stott, F.H.; Wood, G.C. Growth and adhesion of oxide scales on Al2O3-forming alloys and coatings. Mater. Sci. Eng. 1987, 87, 267–274. [Google Scholar] [CrossRef]
  5. Pint, B.A.; More, K.L.; Wright, I.G. Effect of quaternary additions on the oxidation behavior of Hf-doped NiAl. Oxid. Met. 2003, 59, 257–283. [Google Scholar] [CrossRef]
  6. Guo, H.; Cui, Y.; Peng, H.; Gong, S. Improved cyclic oxidation resistance of electron beam physical vapor deposited nano-oxide dispersed β-NiAl coatings for Hf-containing superalloy. Corros. Sci. 2010, 52, 1440–1446. [Google Scholar] [CrossRef]
  7. Taylor, T.A.; Bettridge, D.F. Development of alloyed and dispersion-strengthened MCrAlY coatings. Surf. Coat. Technol. 1996, 86–87, 9–14. [Google Scholar] [CrossRef]
  8. Czech, N.; Schmitz, F.; Stamm, W. Improvement of MCrAlY coatings by addition of rhenium. Surf. Coat. Technol. 1994, 68–69, 17–21. [Google Scholar] [CrossRef]
  9. Mevrel, R. Cyclic oxidation of high-temperature alloys. Mater. Sci. Technol. 1987, 3, 531–535. [Google Scholar] [CrossRef]
  10. Tanno, M.; Ogawa, K.; Shoji, T. Effect of cerium and silicon additions to MCrAlY on the high-temperature oxidation behavior and bond strength of thermal barrier coatings. Key Eng. Mater. 2004, 261–263, 1061–1066. [Google Scholar] [CrossRef]
  11. Amano, T.; Taguchi, T. Spalling of the surface oxide formed on Ni-(20,40,60,80)Cr alloys with small additions of Ce and Si. J. Alloys Compd. 1993, 193, 20–22. [Google Scholar] [CrossRef]
  12. Itoh, Y.; Tamura, M. Reaction diffusion behaviors for interface between Ni-based super alloys and vacuum plasma sprayed MCrAlY coatings. Eng. Gas Turbines Power 1999, 121, 476–483. [Google Scholar] [CrossRef]
  13. Yuan, K.; Eriksson, R.; Peng, R.L.; Li, X.H.; Johansson, S.; Wang, Y.D. MCrAlY coating design based on oxidation-diffusion modelling. Part I: Microstructural evolution. Surf. Coat. Technol. 2014, 254, 79–96. [Google Scholar] [CrossRef]
  14. Salam, S.; Hou, P.; Zhang, Y.-D.; Wang, H.-F.; Zhang, C.; Yang, Z.-G. Compositional effects on the high-temperature oxidation lifetime of MCrAlY type coating alloys. Corros. Sci. 2015, 95, 143–151. [Google Scholar] [CrossRef]
  15. Wang, Y.; Guo, H.; Peng, H.; Peng, L.; Gong, S. Diffusion barrier behaviors of (Ru,Ni)Al/NiAl coatings on Ni-based superalloy substrate. Intermetallics 2011, 19, 191–195. [Google Scholar] [CrossRef]
  16. Sato, A.; Harada, H.; Yokokawa, T.; Murakumo, T.; Koizumi, Y.; Kobayashi, T.; Imai, H. The effects of ruthenium on the phase stability of fourth generation Ni-base single crystal superalloys. Scr. Mater. 2006, 54, 1679–1684. [Google Scholar] [CrossRef]
  17. Nijdam, T.J.; Sloof, W.G. Effect of reactive element oxide inclusions on the growth kinetics of protective oxide scales. Acta Mater. 2007, 55, 5980–5987. [Google Scholar] [CrossRef]
  18. Luthra, K.L.; Briant, C.L. Mechanism of adhesion of alumina on MCrAlY alloys. Oxid. Met. 1986, 26, 397–416. [Google Scholar] [CrossRef]
  19. Yuan, K.; Peng, R.L.; Li, X.H.; Johansson, S.; Wang, Y.D. Some aspects of elemental behaviour in HVOF MCrAlY coatings in high-temperature oxidation. Surf. Coat. Technol. 2015, 261, 86–101. [Google Scholar] [CrossRef]
  20. Yuan, K.; Eriksson, R.; Peng, R.L.; Li, X.H.; Johansson, S.; Wang, Y.D. Modeling of microstructural evolution and lifetime prediction of MCrAlY coatings on nickel based superalloys during high temperature oxidation. Surf. Coat. Technol. 2013, 232, 204–215. [Google Scholar] [CrossRef]
  21. Eriksson, R.; Yuan, K.; Li, X.; Peng, R.L. MCrAlY coating design based on oxidation–diffusion modelling. Part II: Lifing aspects. Surf. Coat. Technol. 2014, 253, 27–37. [Google Scholar] [CrossRef]
  22. Yang, J.; Zheng, Q.; Zhang, H.; Sun, X.; Guan, H.; Hu, Z. Effects of heat treatments on the microstructure of IN792 alloy. Mater. Sci. Eng. A 2010, 527, 1016–1021. [Google Scholar] [CrossRef]
  23. Saeidi, S.; Voisey, K.T.; McCartney, D.G. The effect of heat treatment on the oxidation behavior of HVOF and VPS CoNiCrAlY coatings. J. Therm. Spray Technol. 2009, 18, 209–216. [Google Scholar] [CrossRef]
  24. TCS Ni-Based Superalloys Database, version 8; Thermo-Calc Software: Solna, Sweden, 2015.
  25. TCS Ni-Alloys Mobility Database, version 4; Thermo-Calc Software: Solna, Sweden, 2015.
  26. Andersson, J.O.; Helander, T.; Hoglund, L.; Shi, P.; Sundman, B. Thermo-Calc & DICTRA computational tools for materials science. Calphad 2002, 26, 273–312. [Google Scholar] [CrossRef]
  27. Larsson, H.; Reed, R.C. On the numerical simulation of diffusion-controlled reactions under local equilibrium conditions. Acta Mater. 2008, 56, 3754–3760. [Google Scholar] [CrossRef]
  28. Larsson, H. A model for 1D multiphase moving phase boundary simulations under local equilibrium conditions. Calphad 2014, 47, 1–8. [Google Scholar] [CrossRef]
  29. Toscano, J.; Vaben, R.; Gil, A.; Subanovic, M.; Naumenko, D.; Singheiser, L.; Quadakkersa, W.J. Parameters affecting TGO growth and adherence on MCrAlY-bond coats for TBC’s. Surf. Coat. Technol. 2006, 201, 3906–3910. [Google Scholar] [CrossRef] [Green Version]
  30. Liu, X.; Huang, L.; Bao, Z.B.; Wei, H.; Sun, X.F.; Guan, H.R.; Hu, Z.Q. Oxidation behavior of graded NiCrAlYRe coatings at 900, 1000 and 1100 °C. Oxid. Met. 2009, 71, 125–142. [Google Scholar] [CrossRef]
  31. Brumm, M.W.; Grabke, H.J. The oxidation behaviour of NiAl-I. Phase transformations in the alumina scale during oxidation of NiAl and NiAl-Cr alloys. Corros. Sci. 1992, 33, 1677–1690. [Google Scholar] [CrossRef]
  32. Rybicki, G.C.; Smialek, J.L. Effect of the theta-alpha-Al2O3 transformation on the oxidation behavior of beta-NiAl + Zr. Oxid. Met. 1989, 31, 275–304. [Google Scholar] [CrossRef]
  33. Doychak, J.; Smialek, J.L.; Barrett, C.A. The oxidation of Ni-rich Ni-Al intermetallics. In Oxidation of High-Temperature Intermetallics, Proceedings of the Workshop on the Oxidation of High-Temperature Intermetallics, Cleveland, OH, USA, 22–23 September 1988; Grobstein, T., Doychak, J.K., Eds.; TMS: Pittsburgh, PA, USA, 1989; pp. 41–55. [Google Scholar]
  34. Pint, B.A. On the Formation of Interfacial and Internal Voids in a-Al2O3 Scales. Oxid. Met. 1997, 48, 24–27. [Google Scholar] [CrossRef]
  35. Brady, M.P.; Pint, B.A.; Tortorelli, P.F.; Wright, I.G.; Hanrahan, R.J., Jr. High-Temperature Oxidation and Corrosion of Metals. In Materials Science and Technology: A Comprehensive Treatment Materials Science and Technology: A Comprehensive Treatment: Corrosion and Environmental Degradation, Volumes I+II, 1; Cahn, R.W., Haasen, P., Kramer, E.J., Eds.; Wiley-VCH Verlag GmbH & Co., KGaA: Weinheim, Germany, 2008; pp. 229–325. [Google Scholar]
  36. Naumenko, D.; Gleeson, B.; Wessel, E.; Singheiser, L.; Quadakkers, W.J. Correlation between the microstructure, growth mechanism, and growth kinetics of alumina scales on a FeCrAlY alloy. Metall. Mater. Trans. A 2007, 38, 2974–2983. [Google Scholar] [CrossRef]
  37. Burtin, P.; Brunelle, J.P.; Pijolat, M.; Soustelle, M. Influence of surface area and additives on the thermal stability of transition alumina catalyst supports. I: Kinetic data. Appl. Catal. 1987, 34, 225–238. [Google Scholar] [CrossRef]
  38. Lelait, L.; Alpérine, S.; Mévrel, R. Alumina scale growth at zirconia-MCrAlY interface: A microstructural study. J. Mater. Sci. 1992, 27, 5–12. [Google Scholar] [CrossRef]
  39. Li, M.; Zhang, Z.; Sun, X.; Li, J.; Yin, F.; Hu, W.; Guan, H.; Hu, Z. Oxidation behavior of sputter-deposited NiCrAlY coating. Surf. Coat. Technol. 2003, 165, 241–247. [Google Scholar] [CrossRef]
  40. Paladino, A.E.; Kingery, W.D. Aluminum ion diffusion in aluminum oxide. J. Chem. Phys. 1962, 37, 957. [Google Scholar] [CrossRef]
  41. Ramanarayanan, T.A.; Raghavan, M.; Petkovic-Luton, R. Metallic yttrium additions to high temperature alloys: Influence on Al2O3 scale properties. Oxid. Met. 1984, 22, 83–100. [Google Scholar] [CrossRef]
  42. Ogawa, K.; Ito, K.; Shoji, T.; Seo, D.W.; Tezuka, H.; Kato, H. Effects of Ce and Si additions to CoNiCrAlY bond coat materials on oxidation behavior and crack propagation of thermal barrier coatings. J. Therm. Spray Technol. 2006, 15, 640–651. [Google Scholar] [CrossRef]
Figure 1. BSE (backscattered-electron) image showing microstructure of the C1 (a) and C2 (b) coating of isothermal 1100 °C specimen after 800 h oxidation.
Coatings 08 00129 g001
Figure 2. BSE image showing the cross-section of heat-treated coating of C1 (a) and energy dispersive spectroscope (EDS) mapping of Y, Al, and Ru in the heat-treated coating (b).
Coatings 08 00129 g002
Figure 3. BSE image showing the cross-section of heat-treated coating of C2 (a) and EDS mapping of Ce, Al, and O in the heat-treated coating (b).
Coatings 08 00129 g003
Figure 4. Cross-section of the thermally grown oxide (TGO) after isothermal oxidation at 900 °C, Y + Ru-doped C1 coating for 500 h (a) and 5000 h (b); Ce-doped C2 coating for 500 h (c) and 5000 h (d). White dashed lines marked the outer/inner Al2O3 layer boundary. (Note that the images are in different magnifications, the white contrast in (b) is due to charging problem).
Coatings 08 00129 g004
Figure 5. Cross-section of the TGO after isothermal oxidation at 1000 °C, Y + Ru-doped C1 coating for 500 h (a) and 5000 h (b); Ce-doped C2 coating for 500 h (c) and 5000 h (d). White dashed lines marked the outer/inner Al2O3 layer boundary. (Note that the images are in different magnifications.).
Coatings 08 00129 g005
Figure 6. EDS mapping on the TGO of the C1 coating after isothermal oxidation at 1000 °C for 5000 h, showing Y-rich particles.
Coatings 08 00129 g006
Figure 7. Cross-section of the TGO after isothermal oxidation at 1100 °C: Y + Ru-doped C1 coating for 50 h (a) and 800 h (b); Ce-doped C2 coating for 50 h (c) and 800 h (d). White dashed lines marked the outer/inner Al2O3 layer boundary. (Note that the images are in different magnifications.).
Coatings 08 00129 g007aCoatings 08 00129 g007b
Figure 8. The outer β phase depletion zone (OBDZ) thickness evolution of the C1 and C2 coatings after isothermal 900 °C (a), 1000 °C (b), and 1100 °C (c) oxidation test. (d) Arrhenius relationship: ln(k) of the C1 and C2 coatings for the isothermal oxidation at 900, 1000, and 1100 °C vs. 104/T.
Coatings 08 00129 g008
Figure 9. The OBDZ thickness of the C1 and C2 coatings after cyclic oxidation testing at 1100 °C (a) and isothermal oxidation testing at 1100 °C (b).
Coatings 08 00129 g009
Figure 10. β phase fraction for different alloy system from 900 to 1150 °C, derived from the equilibrium calculation by Thermo-Calc. The composition of the alloy systems is Ni27Co15Cr12.5Al + 1Ru, 1.5Ru, 2Ru, 2.5Ru, 3Ru, 3.5Ru.
Coatings 08 00129 g010
Figure 11. The movement of γ/β phase region interfacial position from the γ phase region (0–5.5 μm) into the β phase region (5.5–10 μm) at 1100 °C, the original phase boundary was at 5.5 μm.
Coatings 08 00129 g011
Figure 12. Al concentration profile of S1 (a) and S2 (b) at 0 s and 105 s simulation time from the moving phase boundary modelling. Al concentration profiles at other times were not included here for they were close to the data at 105 s. The γ phase region and β phase region were arranged from left to right with the interface at distance = 5.5 µm.
Coatings 08 00129 g012
Figure 13. Projection of three-dimensional diagram with the weight percent of the Al in the β phase—x-axis, Ru in β phase—y-axis and temperature—z-axis. The temperature corresponding to each point has been marked.
Coatings 08 00129 g013
Figure 14. Simulation results of the β phase evolution of Y + Ru-doped C1 coating at 1100 °C (a). IBDZ thickness data of the C1 and C2 coating from the isothermal oxidation test and simulation at 1100 °C plotted versus square root of time (b) (the dotted line and solid line represented simulation results and the isothermal oxidation test data, respectively).
Coatings 08 00129 g014
Table 1. Chemical composition of heat-treated Ni27Co15Cr12.5AlX coatings (in wt %).
MCrAlXX = RuX = CeX = YX = Others
C13.30.30.3 Si, (Mo,Ta) < 0.6
C20.2
Table 2. Conditions of oxidation test.
ConditionTime/Cycle
Isothermal oxidation-900 °C500, 1500, 5000 h
Isothermal oxidation-1000 °C500, 1500, 5000 h
Isothermal oxidation-1100 °C50, 300, 500, 800 h
Cyclic oxidation50, 300, 500, 800 cycles
Table 3. The composition (wt %) of γ and β phase in the S1 and S2 systems for short-range diffusion modelling.
CoatingPhaseNiCoCrAlRu
S1γ36.333.324.73.81.9
β51.517.37.417.56.3
S2γ41.532.4224.1
β56.818.66.817.8
Table 4. Al and Ru concentration (wt %) in γ and β phase from the EDS measurement on samples oxidized at 1100 °C. (Ratio = element concentration in phase/average value).
ElementAverage Content Measured in the Coatingsγβ
wt %Ratiowt %Ratio
Al (in C1)11.53.80.3317.51.52
Al (in C2)124.10.3417.81.48
Ru (in C1)3.71.90.416.31.62

