Article

Approaches for Detecting Madder Lake in Multi-Layered Coating Systems of Historical Bowed String Instruments

1
Laboratorio Arvedi di Diagnostica Non-Invasiva, CISRiC, Università di Pavia, via Bell’Aspa 3, 26100 Cremona, Italy
2
Dipartimento di Fisica, Università di Pavia, Via Bassi 6, 27100 Pavia, Italy
3
Dipartimento di Chimica, Università degli Studi di Torino, via Giuria 7, 10125 Torino, Italy
4
Centro Conservazione e Restauro “La Venaria Reale”, via XX Settembre 18, 10078 Venaria Reale, Italy
5
Civica Scuola di Liuteria, via Noto 4, 20141 Milano, Italy
6
Dipartimento di Musicologia e Beni Culturali, Università di Pavia, Corso Garibaldi 178, 26100 Cremona, Italy
*
Author to whom correspondence should be addressed.
Coatings 2018, 8(5), 171; https://doi.org/10.3390/coatings8050171
Submission received: 19 March 2018 / Revised: 15 April 2018 / Accepted: 28 April 2018 / Published: 3 May 2018
(This article belongs to the Special Issue Varnishes and Surface Treatments of Historical Wooden Artworks)

Abstract

:
Musical instrument coatings are generally made by multi-layered systems of organic and inorganic materials, applied on the wood substrate by the violin makers during the finishing process. This coating has paramount relevance for several aspects: protection from sweat and dirt, increase of specific acoustic features, and especially aesthetic effects. In fact, the colour of historical bowed string instruments represents a very peculiar characteristic of each workshop. Among the various colourants, lakes are the most challenging to detect because of their sensibility to the alteration processes. In this work, non-invasive and micro-invasive procedures were applied to a set of mock-ups mimicking historical coatings systems prior and after artificial ageing, in order to highlight the overall information that can be recovered for the detection of madder lake in historical bowed instruments. A set of techniques, including colourimetry, visible and UV-light imaging, stereomicroscopy, Fibre Optics Diffuse Reflectance spectroscopy (FORS), X-ray Fluorescence spectroscopy (XRF), Scanning Electron Microscopy coupled with Energy-Dispersive X-ray microprobe (SEM-EDX), and Fourier-Transform Infrared spectroscopy (FTIR) were used in order to evaluate the pros and cons in the detection of organic and inorganic component of madder lake at low concentration levels.

1. Introduction

In the last decades, scientific studies of historical musical instruments have provided relevant information about the materials used by the Masters of the past and their construction procedures. In particular, the development of non-invasive and micro-invasive analytical methods have given impetus to the instrumental detection of the materials employed in the “finishing process”, consisting in coating systems made by superimposed layers of organic and inorganic materials [1,2].
The aesthetic appearance of the coatings is determined by the optical features of the materials used in the finishing layers, and by the colourants in particular. It is known that, even in the past, the selection of colouring materials has represented a very peculiar characteristic of each workshop [3] and therefore the characterization of the colourants is of paramount relevance for a proper identification of the artwork, sometimes reflecting the crucial influence on the commercial value.
Red and orange inorganic pigments such as iron-earth, vermilion or orpiment, were often identified in historical musical instruments [4,5,6]. The detection of these pigments is normally achieved by non-invasive spectroscopic investigations [7,8,9], or by micro-analytical techniques—such as micro-Raman spectroscopy or scanning electron microscopy coupled with energy dispersive X-ray analysis—performed on small flakes [10,11]. The identification of lakes is definitely more challenging mainly because natural organic dyes are normally fugitive and occur as minor components of the inorganic substrate. For these reasons, a different analytical approach is often required. The topic has been considered for paintings [12,13,14,15,16] and textiles, and novel approaches for detecting the dyes have been reported in a recent work [17]. As for lakes in finishing layers applied on wood, only a recent paper discusses a multi-technique characterization of three reference madder lakes containing different metal cations [18], which were brushed on wooden panels in order to obtain three-layered systems.
Organic natural dyes that can be found in historical lakes were obtained as aqueous extracts from plants or insects, and the lake was formed by co-precipitating the dyes with various metal salts (called “mordants”)—among which potash alum (KAl(SO4)2·12H2O) is the most popular—or by adding to the extract a powdered inert solid [19]. Therefore, lake pigments were historically obtained by absorption or complexation of an organic dye, such as madder or cochineal, on an inorganic insoluble substrate.
It is very well known that the term madder is used collectively for a variety of flowering plant species belonging to the genus Rubia. These plants were economically important sources of red anthraquinone compounds among which alizarin and purpurin—which originates from pseudo-purpurin by decarboxylation—are considered key-compounds for madder identification in a variety of artifacts [20]. The use of madder declined after the commercial introduction of the synthetic alizarin in 1871, which rapidly replaced the natural product in the textile industry, whereas natural madder continued to be used—in parallel to the synthetic product—for the production of artists’ pigments [21].
The direct detection of lake pigments in historical musical instruments is very rare [1], although they use of lakes is indicated in technical documents. One description of the possible application of lakes comes from Michelman [22]: he specifically reported the use of madder extracts to generate lake pigments of different colours by reaction with metallic rosinates (containing either Al3+, Zn2+ or Fe2+) dissolved in the varnish. Nevertheless, also madder lakes prepared according to other recipes can be used to colour the varnish, if lake particles are prepared as very small particles which enable the varnish to dry with complete transparency [23].
In order to highlight the specific issues related to the detection of madder lake in musical instruments—and particularly in bowed string ones—various approaches for the detection of the lake in coating systems mimicking those that can be found in historical bowed string instruments are tested in this work. Various combinations of layers were prepared on maple wood in order to obtain different coating systems; moreover, two concentrations of the lake and of the priming agent (casein) were considered. The mock-ups were subjected to artificial ageing in a solar-box, investigating the performances of the considered set of analytical techniques in detecting the organic and inorganic component of madder lake in historical instruments, even if moderate or severe weathering has occurred.

2. Materials and Methods

2.1. Preparation of the Mock-Ups

Eight different multi-layered model coating systems were prepared on maple (Acer pseudoplatanus L., 1753) slabs (5 cm × 5 cm with 1 cm of thickness) according to some documented historical recipes [24]. The maple wood substrate porosity was sealed with two layers of ammonium caseinate (AC), which was employed both as a filler and as a primer. To this aim, two different concentration of casein (Kremer Pigmente, Aichstetten, Germany, cod. 63200) in deionised water mixed with ammonia (30% solution, 1 mL in 50 g of casein and water) were selected: 10% of casein for the first layer applied directly on the wood (AC10%) and 15% of casein (AC15%) for a second one. A linseed oil-colophony varnish (OCV) was prepared by mixing 75:25 linseed oil (Kremer Pigmente, cod. 73054) and colophony (Kremer Pigmente, cod. 60300) according to literature [25] recommendation. Madder lake (ML) pigment was purchased as a commercial pigment (handmade madder lake Fantuzzi Colori Vegetali) which was prepared by treating an aqueous madder extract with potash alum and sodium hydroxide. The lake was dispersed in AC (1% and 4% of madder lake) and in OCV (7% and 20% of madder lake) with the aim of preparing coating systems by layering different combinations of the coloured/uncoloured AC and OCV. It is worth noting that the different concentration levels of the lake dispersed in AC (1%–4%) and OCV (7%–20%) are a consequence of the practical possibility of obtaining suitable materials that can functionally act as a coloured primer (AC) or as a coloured varnish (OCV). Coloured AC and OCV were manually applied with a brush in two or three superimposed coats in order to give different thicknesses of pigmented layers. The sequence of the layers over the maple wood in mock-ups is summarized in Table 1.

2.2. Exposure to Artificial Solar Radiation

Mock-ups were exposed to artificial daylight in an ageing chamber Heraeus Suntest CPS (Hanau, Germany) equipped with a filtered Xenon lamp (Coated quartz glass simulating a 3 mm thick window glass, cutting wavelengths <300 nm) with an average irradiation of 750 W/m2. The air-venting system of the chamber kept the internal temperature at about 50 °C. The mock-ups were progressively aged up to 24, 48, 72, 140, 240 and 520 h with the simulated solar irradiation in order to evaluate the response over time of the coating systems.

2.3. Analytical Techniques

The multi-analytical approach has involved several non-invasive and micro-invasive techniques. A photographic shoot was set up with a Nikon D4 full-frame digital camera (Minato, Tokyo, Japan) equipped with a 50 mm f/1.4 Nikkor objective. Visible light images (f/11, ISO 100) were obtained using a Softbox LED lamp, while UV-induced fluorescence ones (30 s exposure time, f/11, ISO 400) were collected by illuminating the samples with two Philips TL-D 36W BBL IPP low-pressure Hg tubes (emission peak at 365 nm). Surface details were observed by an Olympus SZX10 stereomicroscope (Tokyo, Japan) equipped with an Olympus DP73 camera and a Schott KL1500 illuminator. Colourimetric measurements were carried out with a Konica Minolta CM-2600d portable spectrophotometer (Chiyoda, Tokyo, Japan), determining the L*, a* and b* and the L* C* h* coordinates of the CIELAB and CIELCH spaces, and the global chromatic variations, expressed as ΔE* CIE2000 according to the UNI EN 15886 protocol [26]. Diffuse reflectance spectra were recorded by Fiber Optics Reflectance Spectroscopy (FORS) with an Ocean Optics (Largo, FL, USA) HR2000+ES spectrophotometer equipped with an Ocean Optics HL2000 halogen lamp. The instrument was equipped with a bundle of optical fibres (400 μm in diameter each), mounted on a 45°/0° geometry probe, with illumination fibres placed on both side of the collection direction. The best spectral resolution of the instrument was about 1 nm; it was calculated as FWHM (Full Width at Half Maximum) by considering the specific features of the monochromator and of the detector. Spectra were referenced against a Labsphere Spectralon diffuse reflectance targets white tile and recorded between 450 and 800 nm. X-ray Fluorescence Spectroscopy (XRF) was carried out using an ELIO portable X-ray fluorescence spectrometer produced by XGLab (Milan, Italy), with an analytical spot diameter of 1.3 mm. The X-ray source worked with a Rh anode. X-ray fluorescence spectra were collected on 2048 acquisition channels by fixing the tube voltage at 40 kV, the current at 80 mA, and the measuring time at 480 s. Even though a full semi-quantitative analysis was not possible, the use of the same geometry, voltage, and current conditions for different point of analyses allowed for reasonable qualitative comparisons. Data were processed using the ELIO 1.6.0.29 software. Micro-samples of the finishing layers were collected using a scalpel, embedded into epoxy resin (Epofix Struers and Epofix Hardener with ratio 15:2) and cut as cross-sections; the sections were then polished with silicon carbide fine sandpaper (500–4000 mesh) and observed using an Olympus BX51TF polarised light optical microscope equipped with visible (Olympus TH4-200) and UV (Olympus U-RFL-T) illuminants. Imaging at higher magnifications and micro-analyses were performed by an FE-SEM Tescan Mira 3XMU-series SEM-EDX (Brno, Czech Republic), set with an accelerating voltage of 15–20 kV in high vacuum and equipped with a Bruker Quantax 200 Energy-Dispersive X-ray spectrometer (Billerica, MA, USA). Different Infrared Spectroscopy methods were performed on the mock-ups to obtain a complete IR spectroscopic data set: µFTIR with a High Pressure Diamond Optics (Tucson, AZ, USA) diamond anvil cell (DAC) and micro-ATR-FTIR to investigate single grains of ML while macro-ATR to analyse larger surfaces. Some microsamples, manually collected with a scalpel on the finishing layers, were pressed and flattened in the DAC and then analysed in transmission mode with a Bruker Vertex 70 coupled with a Bruker Hyperion 3000 infrared microscope equipped with an Infrared Associates MCT detector (Stuart, FL, USA). Data were processed by the EZ Omnic 7.3 and Opus 7.2 software.

3. Results

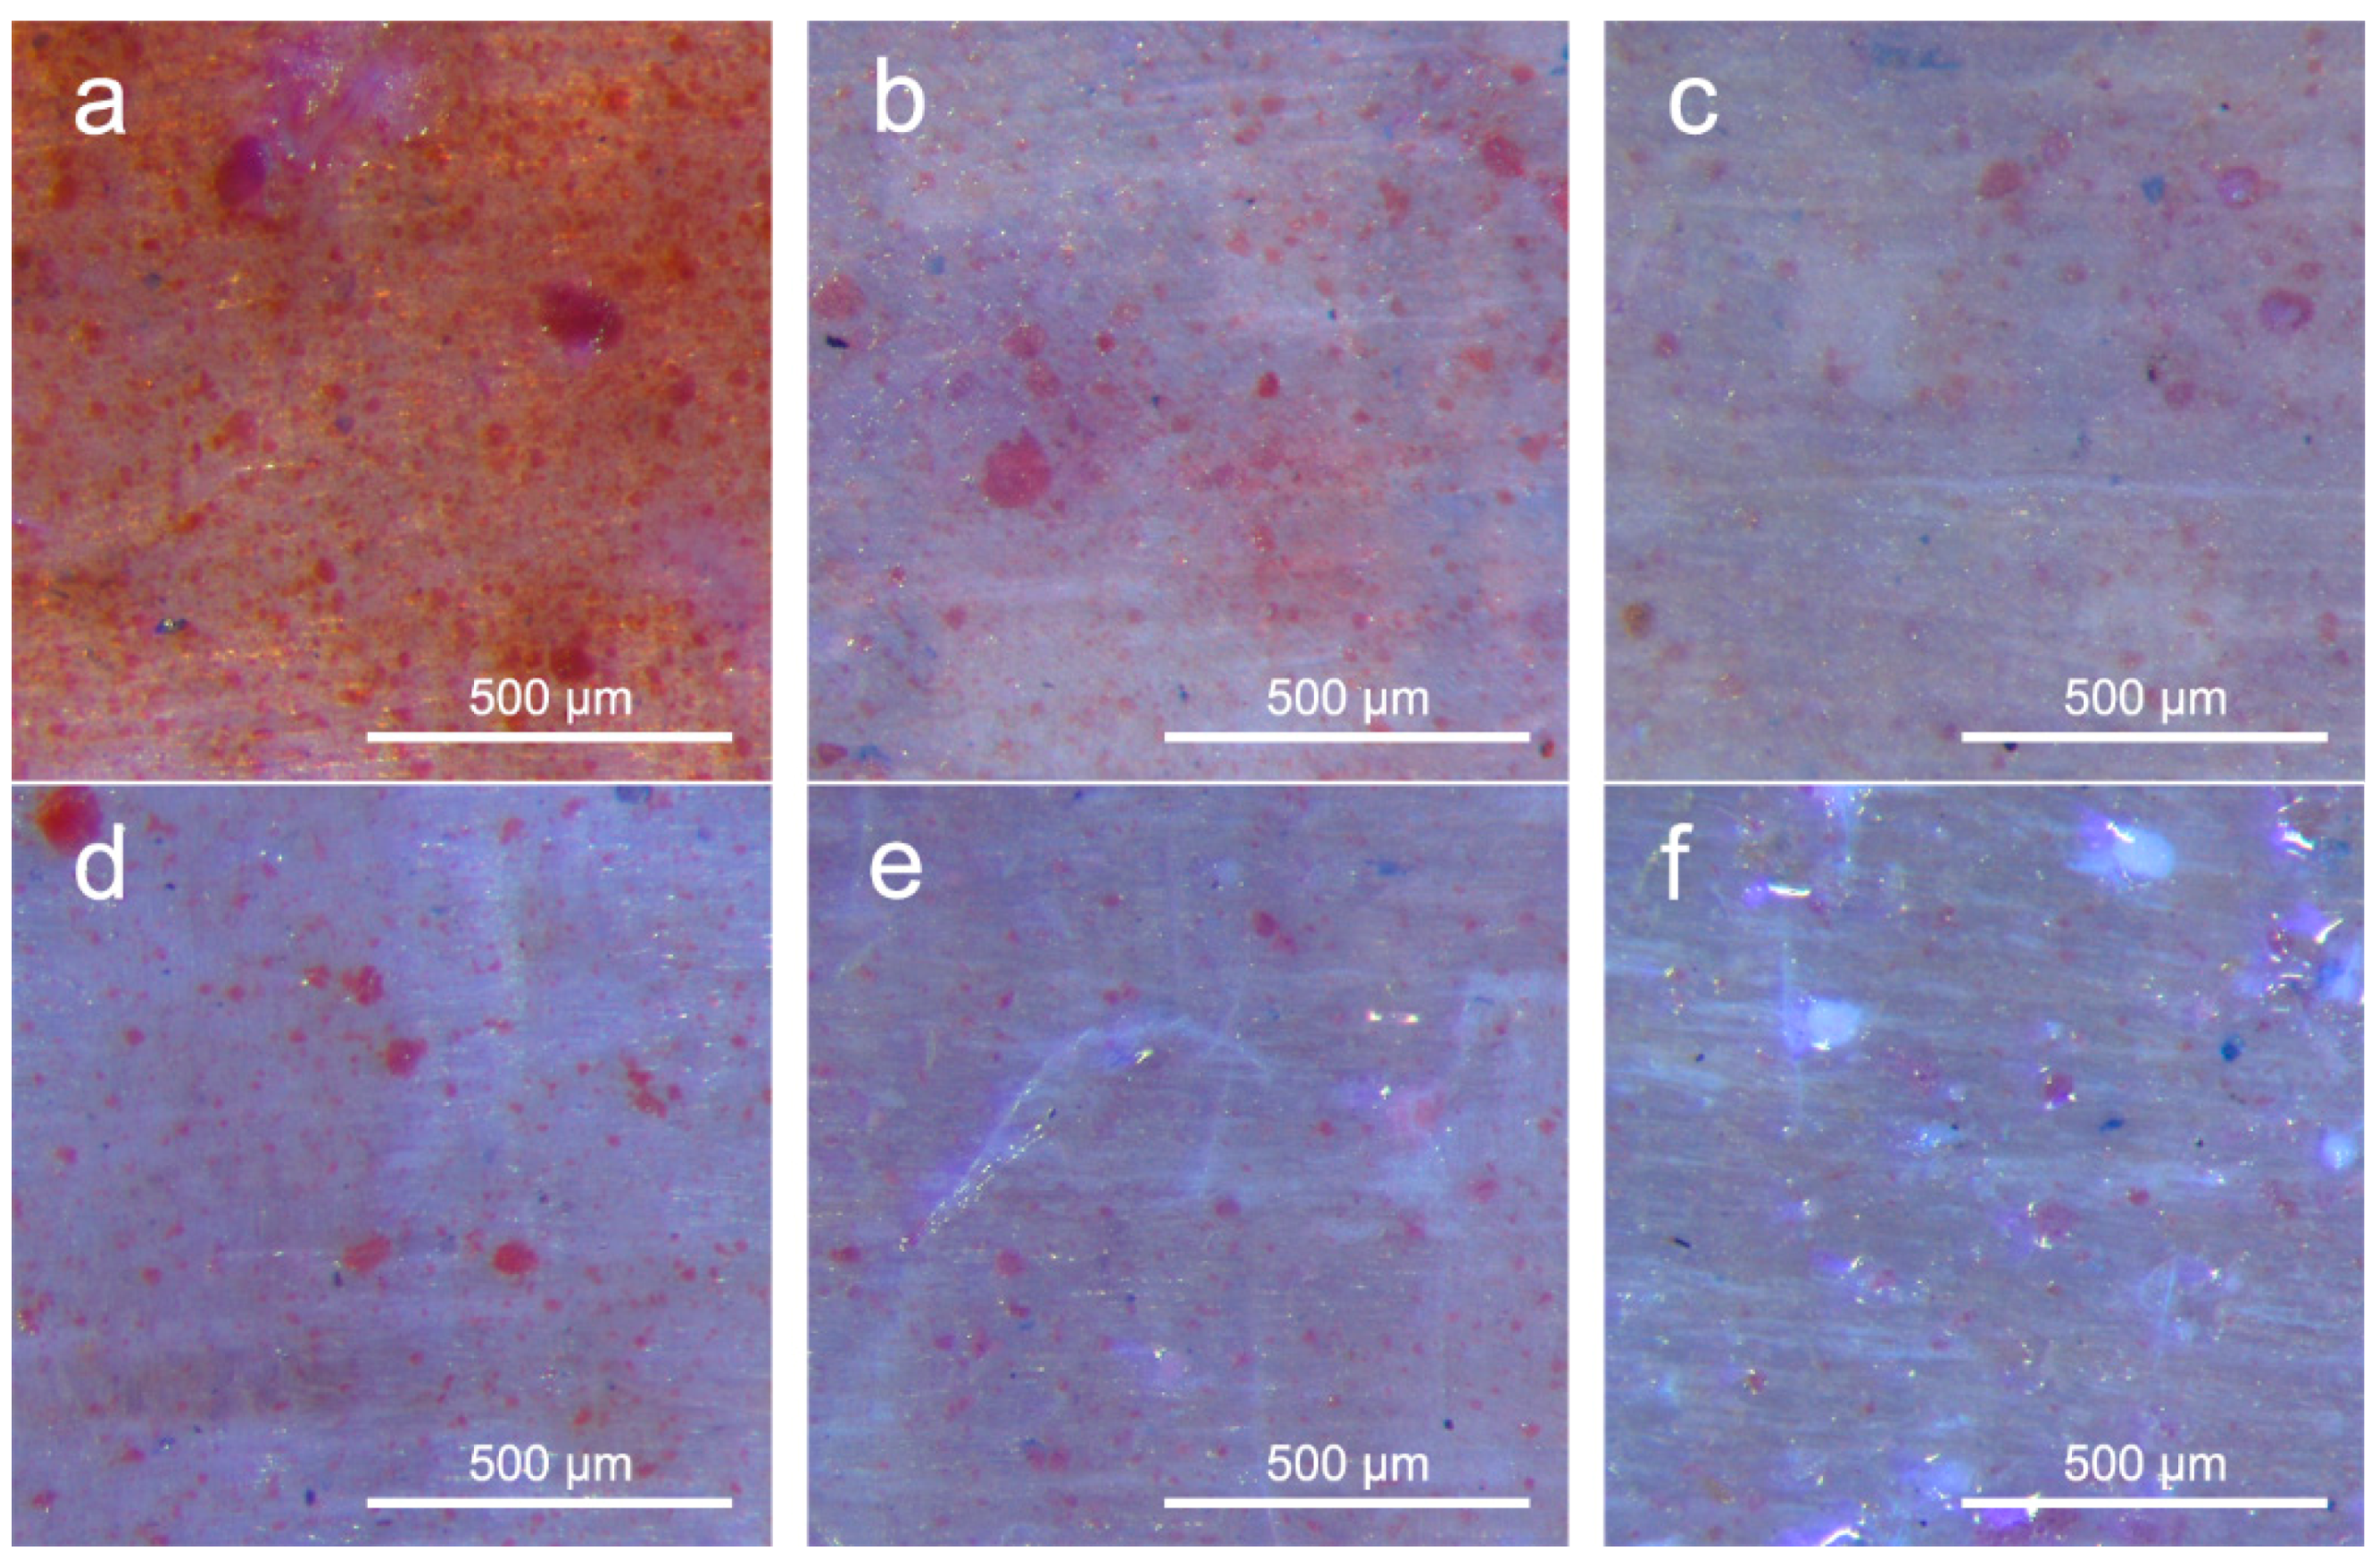
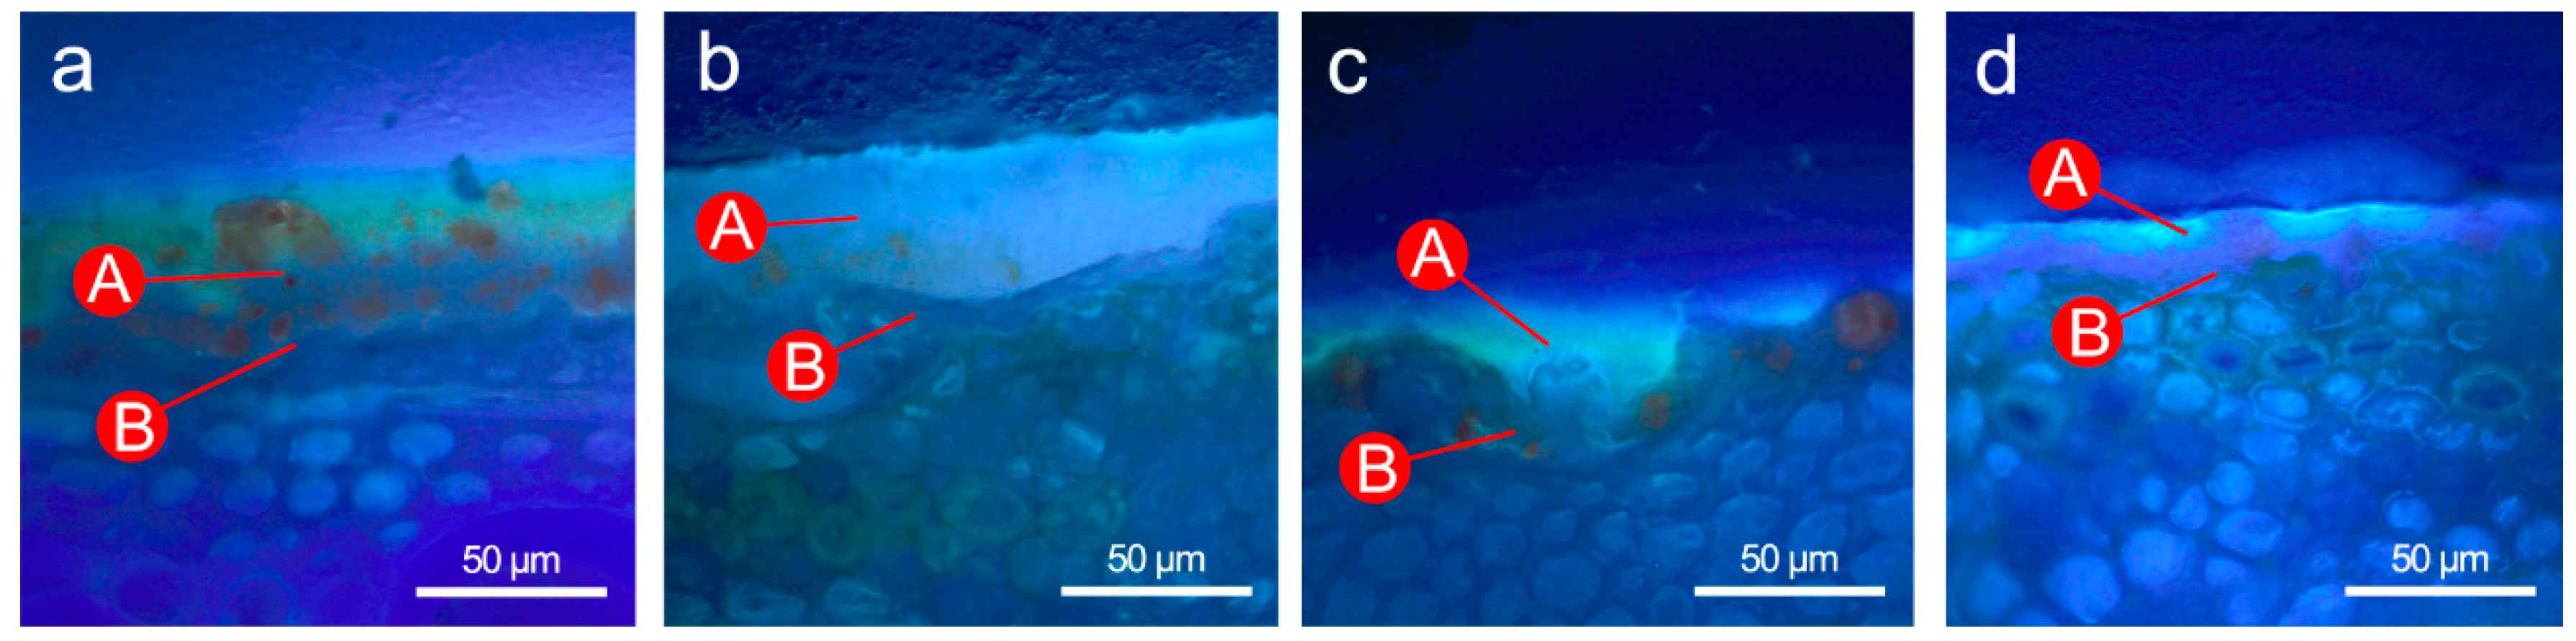
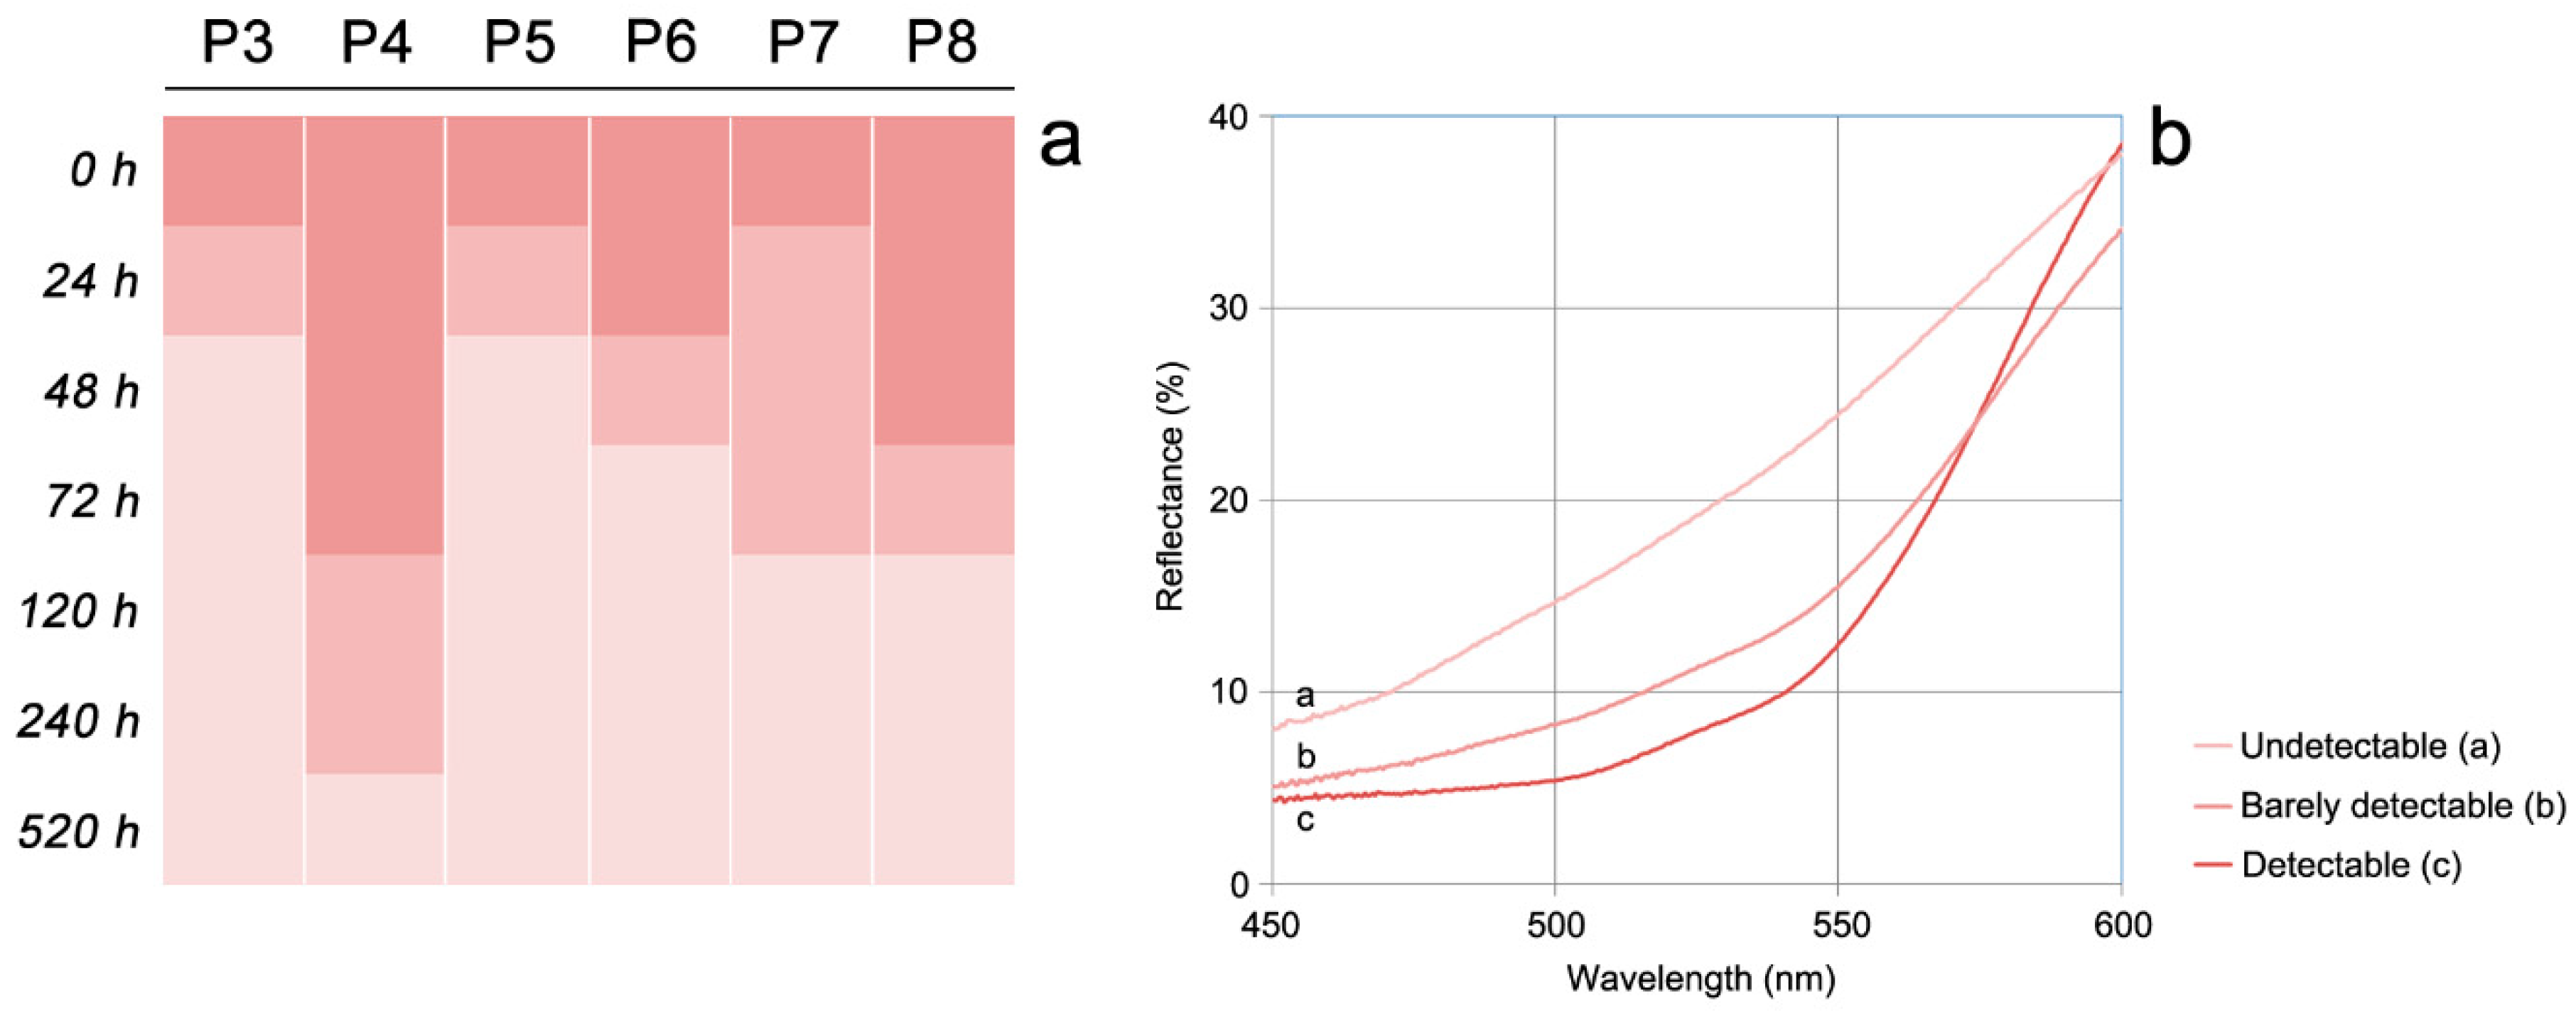
3.1. Visible and UV Light Imaging

The mock-ups were investigated under visible and UV light, in order to document the surface conditions and to evaluate the effect of the distribution of the lake in the different samples on the UV response. An overall view of the samples under visible and UV-light illumination before and after artificial solar radiation exposure (t = 0 h, t = 240 h and t = 520 h respectively) is reported in Figure 1. For each mock-up, the various portions related to the different number of coats are highlighted.
As shown in Figure 1, UV-induced fluorescence results from the blend of characteristic UV fluorescence of different materials constituting the coating systems. As expected, in the unexposed samples, both the yellow-whitish fluorescence of the OCV and the characteristic blue fluorescence of proteins are visible in all the samples. Moreover, the orange-red fluorescence of the lake, mainly due to the high quantum yield of the purpurin-Al3+ complex [27], is clearly visible in all the samples before artificial solar radiation exposition. The orange fluorescence of madder lake is visible both when grains are dispersed in the varnish (Samples P3 and P4) and when they are in the AC primer under the transparent varnish layer (Samples P7 and P8). The orange fluorescence of the lake is progressively lost during the solar radiation exposure and is no longer visible for t = 520 h. The blue fluorescence of the proteinaceous layer is also quenched, and by t = 520 h only the light-yellow fluorescence of the aged linseed oil is visible.
Stereoscopic images of two different P4 and P7 surfaces observed under UV illumination is reported in Figure 2. Madder grains are clearly visible in the pigmented OCV (Sample P4, Figure 2a) and in the pigmented AC layer under the transparent OCV (sample P7, Figure 2d). Sporadic grains of ML are still visible after 240 h of solar radiation exposure (Figure 2b,e), while after 520 h they have been completely quenched (Figure 2c,f).
A microscopic observation of the cross section allowed us to identify the different subsequent layers applied on the wooden substrate: P3 represent mock-ups with ML dispersed in the OCV (Figure 3a: t = 0 h; Figure 3b: t = 520 h). The outer OCV (layer A, ~40 µm of thickness) shows a yellow UV fluorescence at t = 0 h (Figure 3a) with a well distinguishable fine dispersion of ML particles. Furthermore, the AC primer (layer B, ~10 µm of thickness) is visible on the wooden substrate. By considering the sample after artificial ageing (Figure 3b), only few ML particles are still visible in the lower part of the pigmented layer, while most of those dispersed in the varnish are no longer recognizable. A similar behavior was noticed in the samples with ML dispersed in AC (P5, P6, P7 and P8). In P8 (Figure 3c: t = 0 h; Figure 3d: t= 520 h) two different layers are clearly observable: the external uncoloured OCV (layer A, ~15 µm of thickness) with the characteristic yellowish UV fluorescence and the coloured primer (layer B, ~20 µm of thickness) with a blue UV fluorescence. The ML grains are no longer identifiable after 520h of artificial ageing (Figure 3d), even if the AC layer containing madder produces a uniform reddish UV fluorescence.

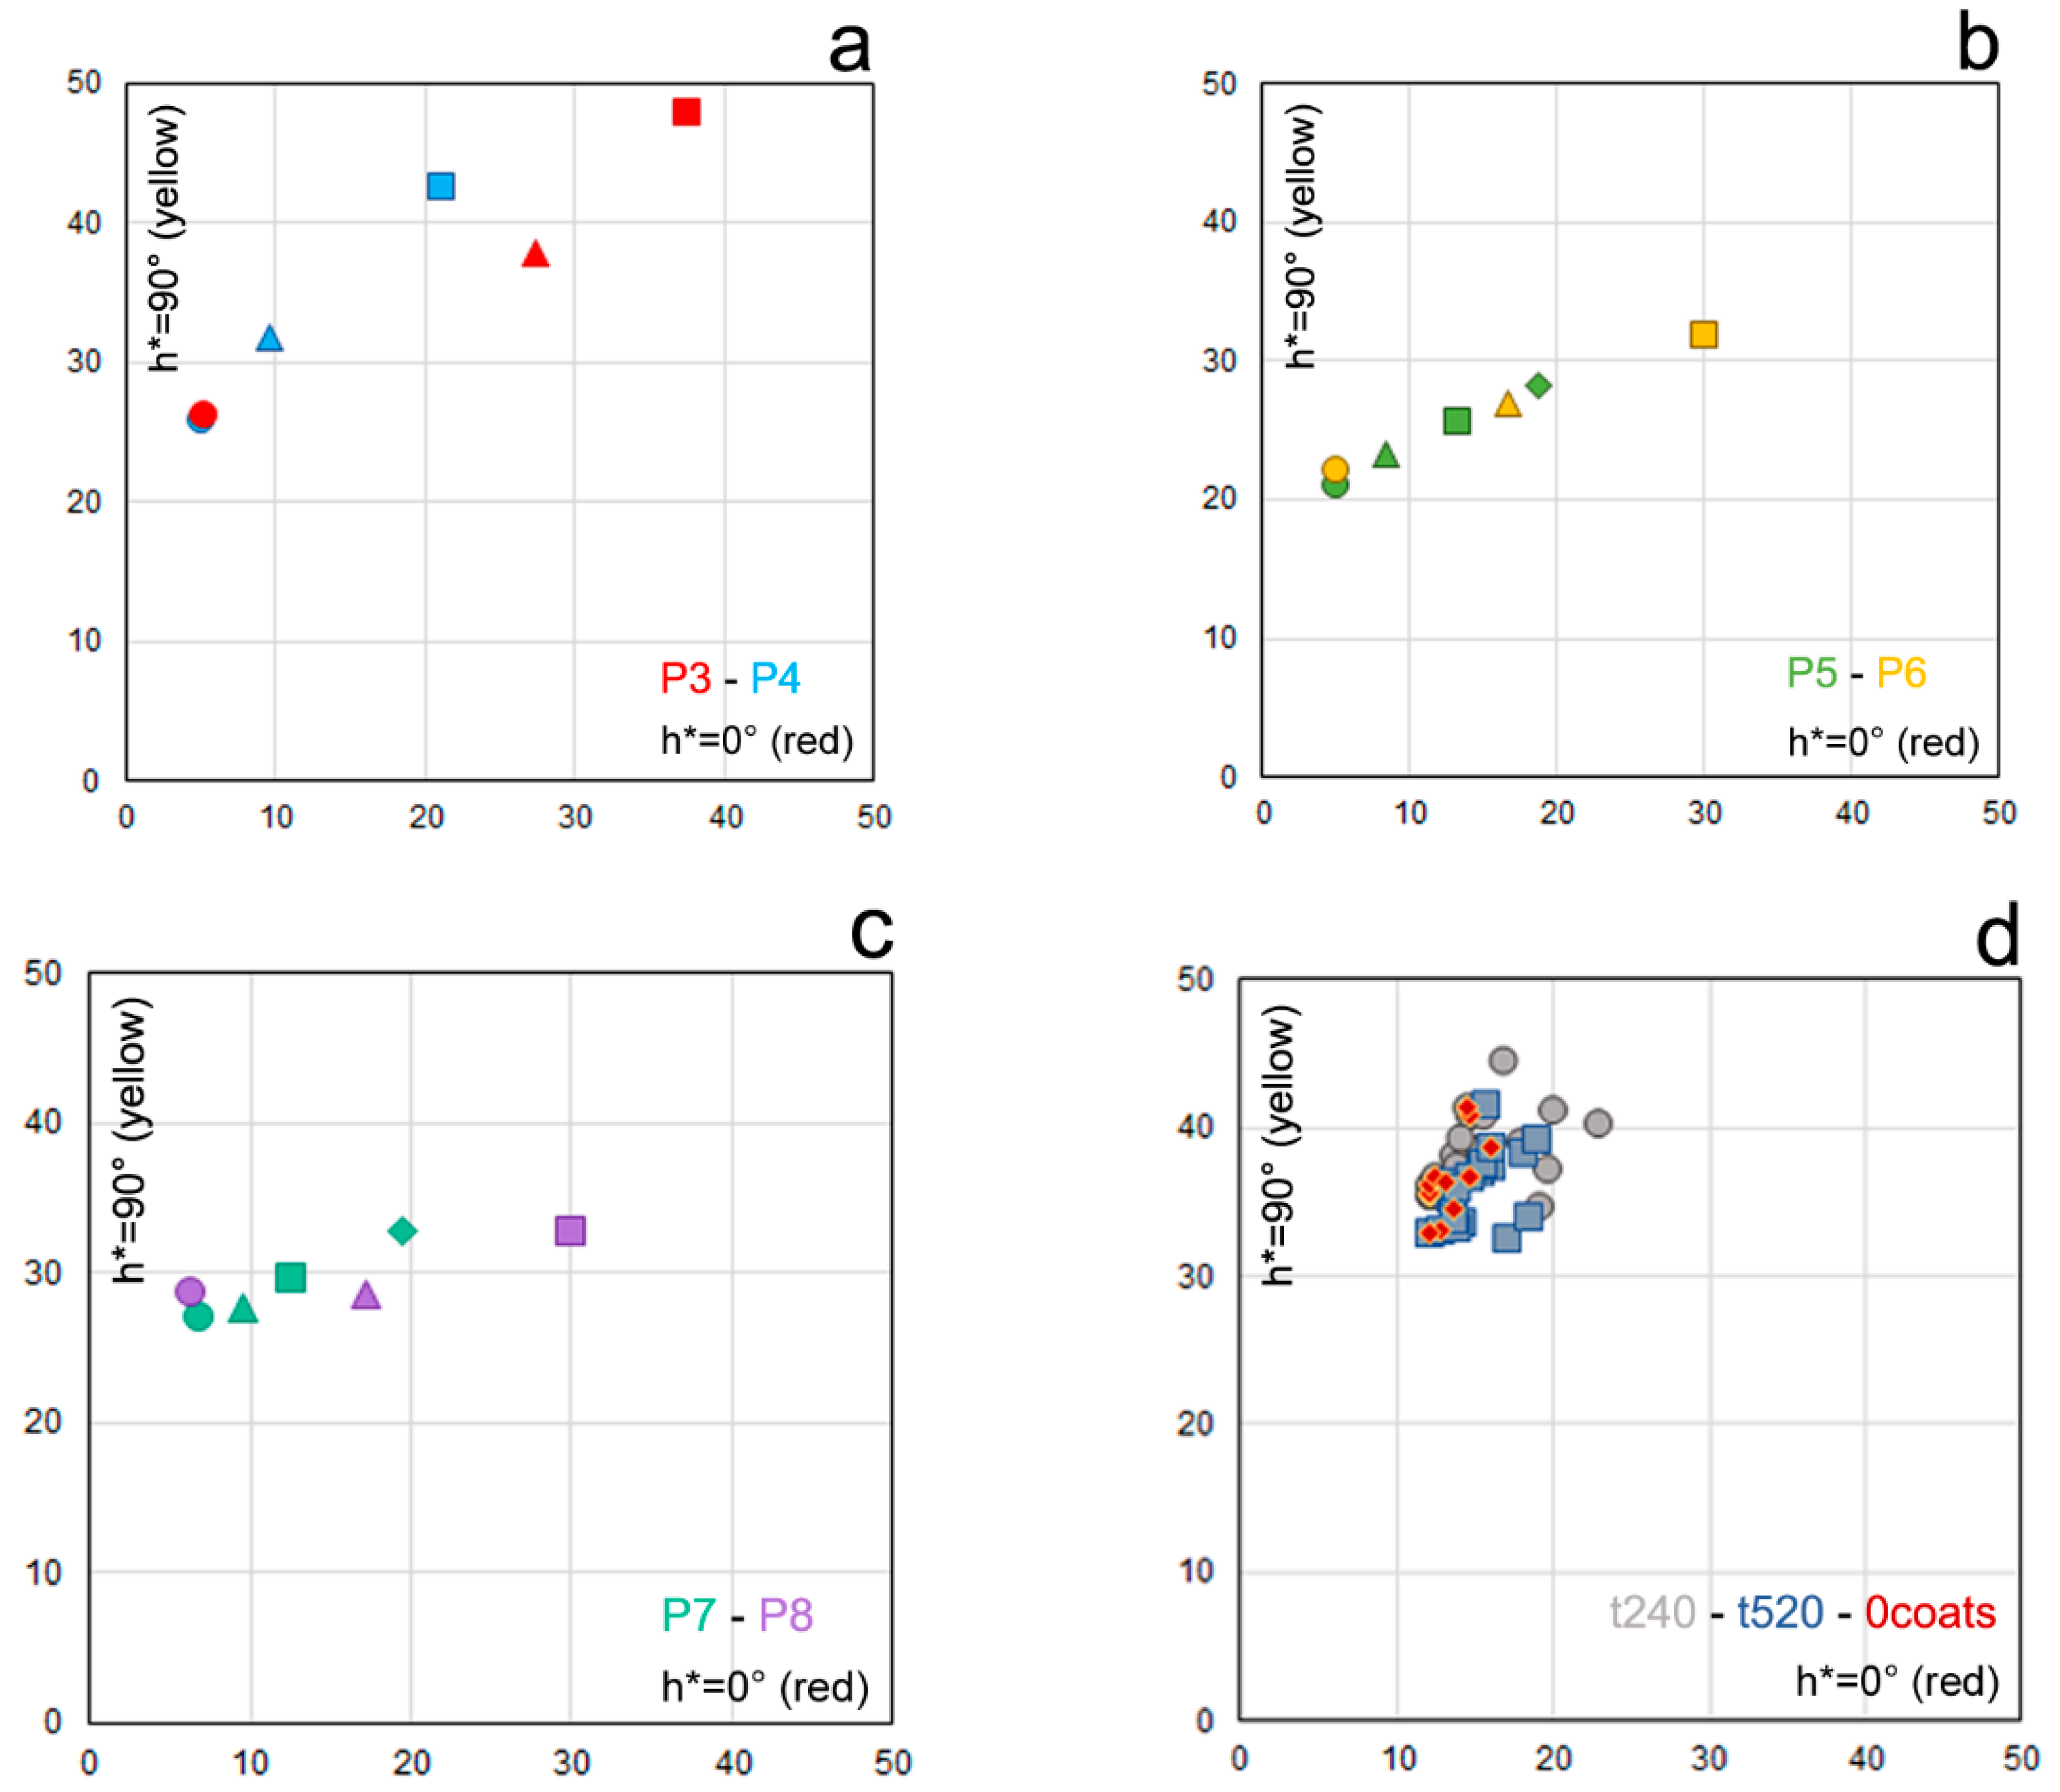
3.2. Colourimetric Characterization of the Mock-Ups

Colourimetric analysis were collected to offer a description of the colours, with the aim to compare the data in relation to the different coats applied on mock-ups and to the artificial solar illumination exposition. The entire set of the mock-ups observed by the naked eye is shown in Figure 1. The colourimetric data set (for the CIELCH colour space) and colour changes as ∆E (CIE2000) are reported in Table S1 (supplementary material). Moreover, Figure 4 show the data plotted in the C* h* polar reference system, where C* is the chroma (graphically, the distance from the pole) and h* is the hue (graphically represented by the angle from the reference direction); each graph is focused on one among the three different position of the coloured layer in the sequence of the considered coating systems (see Table 1 for details). C* and h* values before the exposure to artificial ageing are reported in Figure 4a–c; Figure 4d shows the data set for the exposed samples (t = 240 h and t = 520 h).
Instead of merely considering cumulative formulas (such as ΔE) for colour variations—which are reported in Table S2—trends for L*, C* and h* will be discussed separately, as they are related to the different factors (materials employed to disperse the pigment and pigment concentration, transparency of the resulting coloured layers, photo-fading of the lake) that determine the overall colour of the mock-ups.
Information that can be recovered from the colourimetric data for unexposed mock-ups is related to colour changes induced by increasing the number of coloured coats of the coating system. Two factors shall be considered: the position of the coloured layer in the sequence of the system and the concentration of the lake. By considering the variation in the L* value (Table S1, supplementary material), it is evident that all the coating systems lead to lower values (i.e., darker colour) by increasing the number of coloured coatings. As concerns C* and h*, different situations are encountered for each coating systems. In P3 and P4, where the lake is dispersed in the outer OCV layer, the increase of the number of coloured coats yields a shift of the hue from reddish-yellow toward a more reddish hue in sample P3 (lake concentration 7%). The same trend for C* is encountered in P4, where the concentration of the lake is significantly higher (20%). In this sample, however, the hue turns definitely towards red by brushing the first coloured coat, whereas the second coat only determines a dramatic increase in the C* value, without changing significantly the hue, possibly because the originally yellow colour of the substrate has been completely masked by the first coat of coloured varnish.
Despite the fact that the lake concentration is definitely lower in samples P5, P6, P7 and P8 (1% and 4% in AC) when compared to samples P3 and P4 (7% and 20% in OCV), the efficacy of the coloured AC layer in turning the yellow colour of the wood towards red is comparable to that of coloured OCV. As an example, we can compare the final colour for systems P3 and P8. These two coating systems are both formed by three layers, with ML 7% in OCV vanish (7% lake concentration) or in AC (ML 4%). For these systems, the significant colour difference (ΔE = 14) is mostly due to the redder hue of sample P8 (C* = 44, h* = 47) with respect to sample P3 (C* = 47, h* = 63).
Data for aged samples—and direct observation of the samples under visible light (Figure 1)—indicate the dramatic discolouration of the lake. Besides for a pure lake the photofading of the organic dye produces an increase in the lightness and a consequent decrease in redness [28,29], in the here considered coating systems the colour changes towards the same yellowish hues that are encountered for the aged uncoloured systems, as shown in Figure 4d. In particular, the uncoloured systems (shown as full coloured circles in Figure 4a–c) shift towards darker and more saturated colours (L* value decreases and C* value increases) upon irradiation, while h* value slightly decreases, therefore shifting towards reddish hues.

3.3. FORS Analyses

Diffuse reflectance spectra in the UV-Vis-NIR spectral range for madder were extensively discussed both for paintings and for textiles [12,30]. Madder lakes prepared on aluminum substrate normally show a characteristic absorption pattern in the visible region, with a strong band between 450 and 600 nm, structured into two main sub-bands centered at about 500 and 540 nm. A shoulder at about 480 nm may be detectable as well. The colour of the ML is due to the sharp increase in reflectance at about 600 nm into the NIR. Out of the visible range, another intense absorption band occurs below 350 nm, therefore a reflectance peak can appear at about 400 nm. All these spectral features were considered in order to detect ML in all the considered coatings systems, monitoring the decay of the diagnostic features after different times of accelerated ageing. Attention was focused on the two absorption peaks in the visible region, which represent the most distinctive spectral features of ML dispersed in different binding media, whereas reflectance features are strongly influenced by the system. Due to the weakness of ML signals, FORS measurements were performed only on the areas with the highest number of coloured coats (Table 1 and Figure 1 for details). Three situations were identified: (i) the bands were clearly detectable, (ii) the bands were not detectable, and (iii) the distinctive spectral features of the ML were only barely detectable. By considering these three situations, the entire set of FORS results is represented in Figure 5.

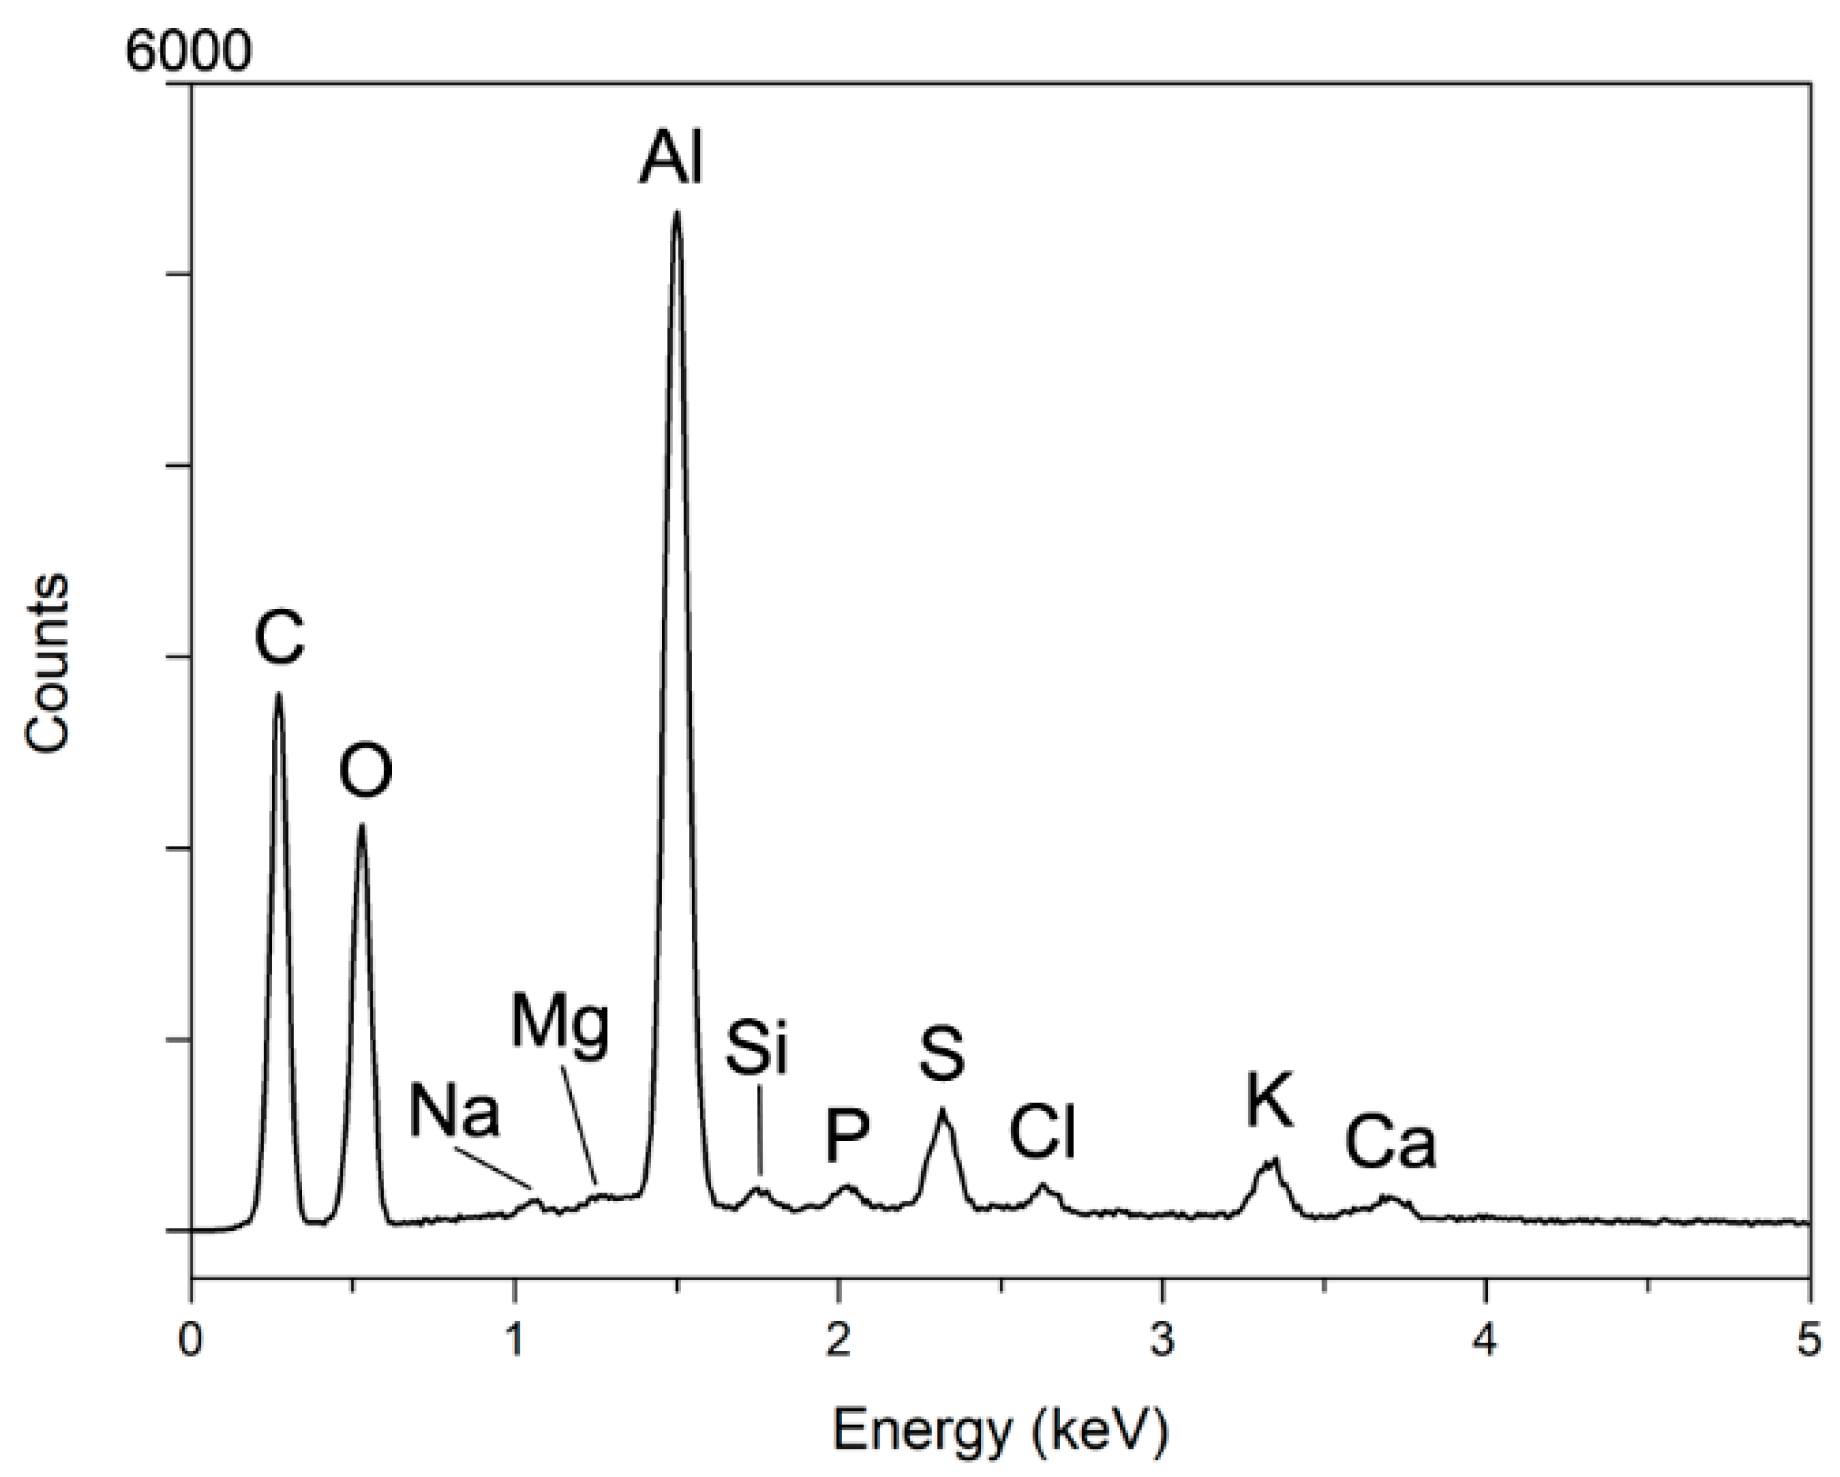
3.4. XRF and EDX Analyses

For the here considered mock-ups—which contain an alum-based lake—the concentration of light elements such as Al and S could be underestimated with respect to their actual concentration, since their secondary radiations have low penetrating power and are severely attenuated by air and/or by the matrix. Therefore, signals are in some cases detectable, but peaks heights and peaks areas are strongly reduced [31,32]. No variations in elemental concentration are expected for different exposure time under artificial solar exposure, since the fading of the pigment is strictly linked to the molecular alteration of the organic dye. This means that XRF spectroscopy, although limited by instrumental setups and matrix effects, may represent the easiest tool to detect elements that could be considered markers for the lake pigment, even altered or totally faded.
In this study, rough estimates of Al, S and K signals linked to the lake dispersions are anyway presented in Figure 6a,b. Preliminary XRF measurements performed on the maple slabs and on pure AC and OCV highlighted detectable signals of K in maple, and of S and K in AC. This explains (at least partially) that S and K signals were detected in all the considered mock-ups. Conversely, Al signals were detected only in the samples where ML has been dispersed in concentration higher than 4% or by many overlapped coats. As a result, although signals are partially ascribable to binders and/or wood substrates, it is observable that higher counts of Al, S, and K are related to increasing concentrations of ML. This feature is particularly evident in P4_2 in which two coatings of ML (20% concentration in OCV) were applied. In the mock-ups where the lake is spread in the AC layer under the OCV (e.g., P8_2), low energy secondary emissions, such as those of Al, are partially absorbed by the matrix. Despite this limitation, the characteristic peaks of Al, S, and K are still detectable in the sample.
EDX analysis carried out on the cross-sections by focusing the electron beam onto the ML grains dispersed in OCV or in AC allowed to recover more information about the elemental composition of the mordant. Concentrations, expressed as elemental wt %, indicate 60%–65% of Al, 10%–15% of S, and 5%–10% of K (Figure 7), which are characteristic for madder lakes produced with alum. In addition, signals of Na, Mg, Si, P, Cl and Ca were detected, as expected for lakes obtained from natural raw materials [33].

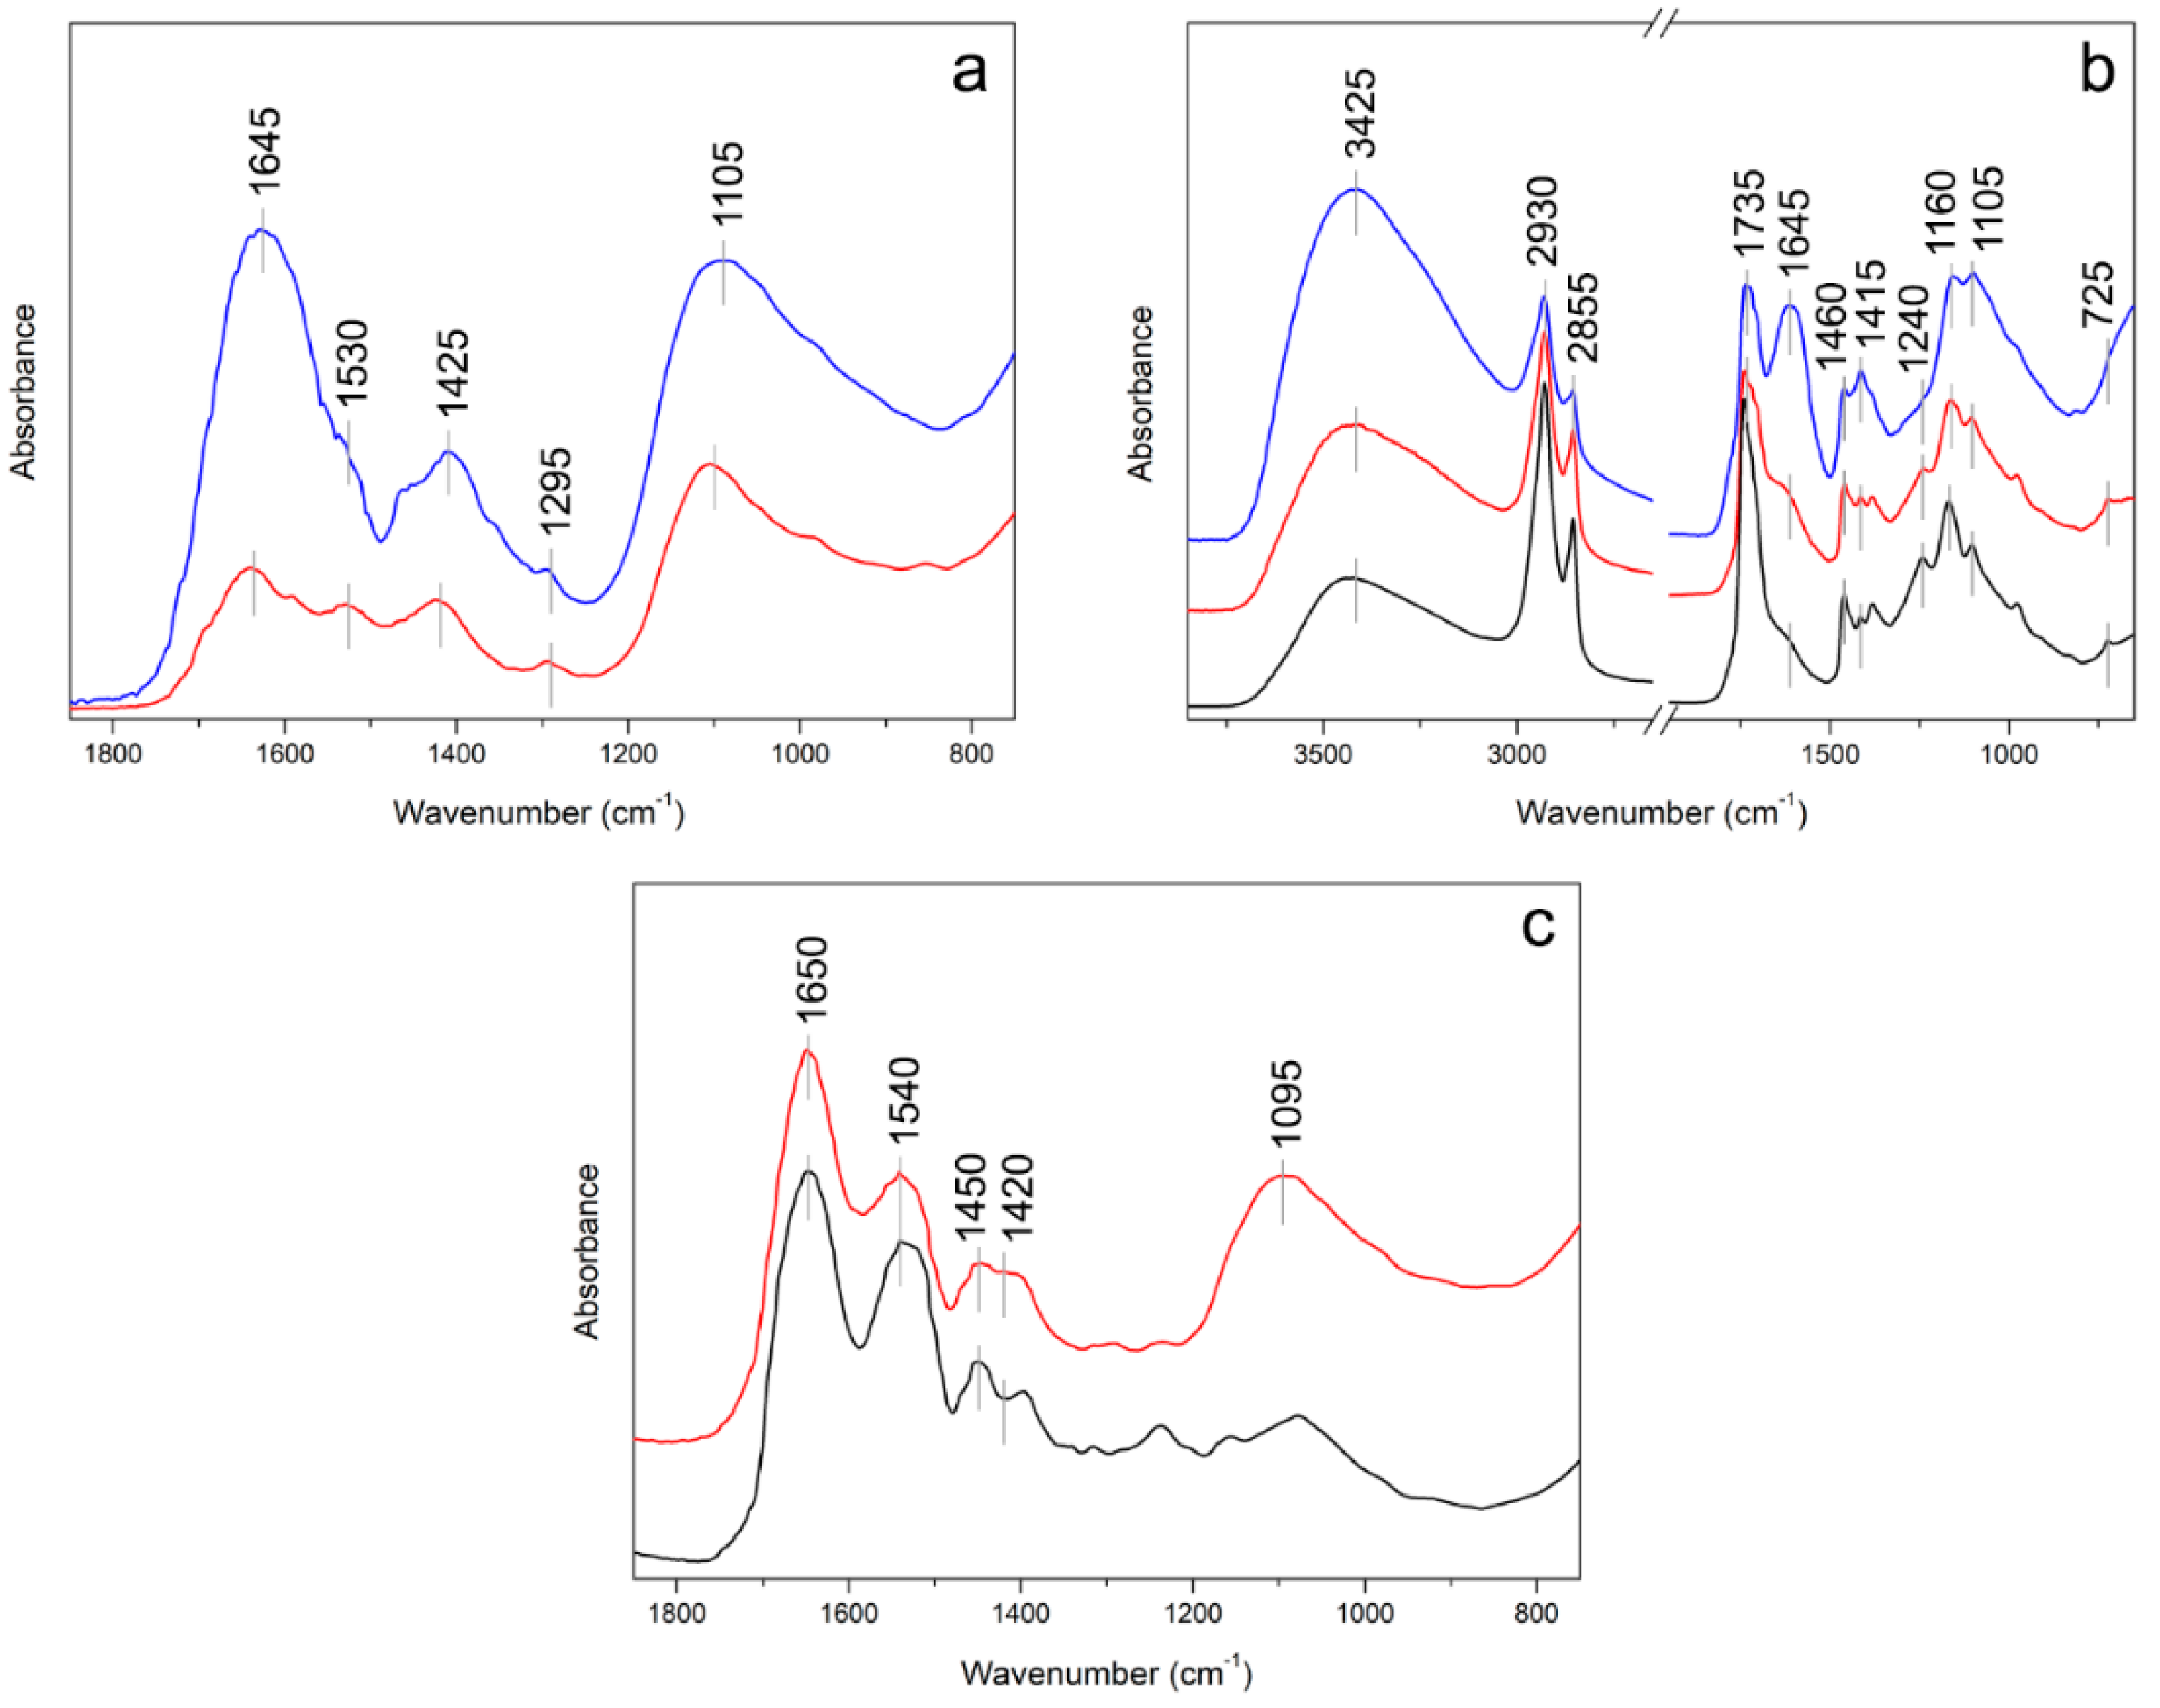
3.5. Infrared Spectroscopy

The multi-layered coloured mock-ups were investigated by µFTIR techniques with the purpose of identifying the presence of the lake in complex mono-pigment coating systems (the results are summarised Table 2). Several spectra of pure ML powder and binders were previously collected through different analytical infrared modalities in order to evaluate and compare the characteristic signals of the lake pigment dispersed in different binders and progressively artificially aged. The reference spectrum of ML was collected in transmission mode using a DAC.
As expected, characteristic signals generally attributed to the lake pigment were identified (Figure 8a): bands for the hydroxyl stretching (νOH) at 3400 cm−1, carbonyl groups (νC=O, 1645 cm−1), aromatic rings (νC=C, 1530 cm−1) and aliphatic chains (δC–H2, 1425 cm−1), as well as the strong peak of sulfates (νS–O, at 1105 cm−1) are clearly identifiable [34,35]. As shown in Figure 8a, the aged ML (t = 520 h) shows a strong increase of the band at 1645 cm−1, probably due to the presence of degradation products such as benzoic acid, phthalic anhydride and dimethyl phthalate [36].
On the other hand, different spectral results occur when the ML grains are embedded in an organic binder and applied on the wooden mock-ups. The results obtained in transmission mode using a DAC and described below were confirmed in micro- and macro-ATR non-invasive modes and allowed us to identify—if present—the ML dispersed in the two different binders without any pretreatment of the samples.
The signals of ML are largely covered by the characteristic bands of the binder (OCV or AC). Nevertheless, a decisive contribution of the lake is still identifiable in the fingerprint region, where a variation in the relative intensities between the νC–O absorption bands of the medium is visible. The µFTIR analyses performed on the OCV showed intense characteristic bands of hydroxyl stretching (νOH at 3425 cm−1), aliphatic chains (νasCH2 at 2930 cm−1 and νsCH2 2855 cm−1; δCH at 1460 and 1415 cm−1), carbonyl groups (νC=O at 1735 cm−1), and carbon–oxygen bonds (νC–O at 1240, 1160 and 1105 cm−1), typically attributed to an oil-resin varnish [34]. The presence of ML, which signals are superimposable with the characteristic bands at 1650, 1420 and 1105 cm−1, leads to a strong increase in these marker bands, as can be observe in Figure 8b. In the same way, the identification of these bands was confirmed also for the aged materials. The OCV spectra after 240 h and 520 h of ageing preserved their characteristic absorptions despite the disappearance of some bands (νC–O band at 1240 cm−1 and in-plane δasCH2 band at 725 cm−1) [37]. In any case, the marker bands contribution of ML is clearly recognizable (Figure 8c). Considering the AC binder, the analysis of the dispersed lake particles highlights the characteristic bands of a proteinaceous materials with signals of primary amides (νC=O at 1650 cm−1), secondary amides (νNH at 3080 cm−1; out-of-phase combination of νCN and δNH 1540 cm−1), and tertiary amides (in-phase combination of νC–N and δN–H at 1450 cm−1). Focusing on the characteristic bands of the ML, the strong signal at 1095 cm−1 attributed to the sulfate vibration band is predominant, with a slight increase at 1420 cm−1 due to in-plane δsCH2 absorption [38] (Figure 8c).

4. Discussion

The overall set of the collected data has produced several analytical results that can be discussed. Colourimetric data indicate that the use of ML to impart red hue to the coating systems of historical bowed instruments is more efficient if the pigment is spread in the proteinaceous layer underneath an uncoloured varnish layer, as the same red hues are obtained using a lower quantity of the pigment. Moreover, the lake spread under a varnish layer is less prone to fade, as it has been highlighted by the FORS data. Even if the selective FORS signals of the dye are maintained for longer time of exposure under artificial solar light in samples where the lake (20% concentration) is spread in OCV, signals are maintained up to 72 h for a definitely lower concentration of lake (1%) when it is spread in the proteinaceous layer under the OCV. It was demonstrated for coloured textiles dyed with madder (alum mordant) that even invisible changes of the colour may result in a significant lowering of the initial concentration of the dyes [39]. Therefore, the visible photo-fading of the lake indicates that the concentration of the pristine dye has decreased dramatically. Many factors may play a role in the photo-fading of the colouring materials of fine historical musical instruments [40] and in particular of organic natural lakes dispersed in the finishing layers, such as the thickness of the painted layer and the average grain size of the pigment [41]. The small grain size of the pigment—which is characteristic for transparent coloured varnishes—will lead to a poor stability of the lake upon light exposure, whereas more permanent colours are obtained if the lake is spread underneath the varnish.
As for diagnostic information that can be employed for detecting ML in coating systems, we may consider at first the direct inspection of the surface through a microscope under UV-light (Figure 2) which has demonstrated the possibility of detecting the orange fluorescent emission of ML grains even after that the system has been severely weathered (t = 240 h). The technique seems to be more efficient than the inspection of cross sections (Figure 3), as the sporadic particles that still fluoresce in the weathered system may not be included in the micro-samples detached from the coating system and employed for the preparation of cross sections.
Inspection by FORS is able to detect the signal of ML when it is spread in the outer OCV varnish or in the proteinaceous layer under the varnish, although the specific signals of the lake are not detected in weathered systems, where the main chromophores no longer exist at detectable concentration. It shall be also considered that other colouring agents possibly employed in addition to ML in historical instruments, such as coloured resins dissolved in the varnish [22], may interfere with the detection of the ML features by FORS.
Although Al signals in XRF spectra (in addition to S and K signals) cannot be considered conclusive for the detection of ML, high signals of Al may hold a clue to identify the presence of an alum-based lake in the coating system of historical instruments. Nevertheless, further information is needed for a reliable identification of the pigment, since XRF signals for Al—and for S and K as well—can also be ascribed to other materials used in the finishing treatments (such as aluminosilicates for Al, binders and the wooden substrate for S and K) or to contaminants that accumulate on the surface when the instrument is regularly played [42]. More conclusive information may derive from EDX analysis on cross sections, since the spectral pattern that we detected for the lake grains in the here considered mock-ups has been already identified as characteristic for alum-based lakes [33]. Obviously, this information is related to the inorganic substrate, and no information on the nature of the dyes can be obtained by elemental X-ray techniques.
On the other hand, FTIR spectroscopy gives information on both the organic and the inorganic component of the lake. Besides detecting the signals of sulfates—which originate from the alum employed here to obtain the pigment—detectable modifications of the spectral features of the dispersing agent (AC or OCV) arise when the ML is present. The diagnostic spectral features of the system in the IR spectral range are retained even after the complete discolouration of the pigment and were detected both on micro-samples analyzed in transmission mode and through a non-invasive approach with macro- and micro-FTIR-ATR. The formation of characteristic degradation products (e.g., benzoic acid, phthalic anhydride and dimethyl phthalate) [36] makes sometimes possible to identify ML, despite an intense solar-light ageing, thanks to the contribution of some bands also present in the spectrum of the unaged ML. Nevertheless, this was made possible by a careful selection of the materials used for the mock-ups preparation. As for other spectroscopic techniques involved in this work, the detection of ML marker bands is closely linked to the presence of overlapping signals that could compromise the correct observation and interpretation of the spectra. The use of further spectroscopic techniques—and particularly of Raman spectroscopy—will be considered in addition to the techniques already considered in the present work, in order to possibly provide an even more accurate identification of madder lake in historical musical instruments, as suggested in papers dealing with other historical materials [43].

5. Conclusions

In this work, various approaches for the detection of madder lake in model coating systems mimicking those that can be found in historical bowed string instruments were tested. Both non- and micro-invasive methods were used, highlighting the pros and cons of each one. Low concentration of lake pigment in heterogeneous matrices, together with the photo-chemical dye alteration and the low sensitivity of some analytical techniques, point out many limitations in madder lake identification, which is still a challenging task. Nevertheless, we demonstrated on mock-ups that a number of clues—which can be recovered non-invasively by combining stereomicroscopy, elemental analysis, and spectroscopic techniques in the visible and IR spectral range—may lead to the identification of some characteristic features of madder lake. Whether it is dispersed in different binders or spread in the outer varnish or in the priming layer underneath, the madder lake could be identified thanks to the complementarity of different analytical results, highlighting that, in many cases, the non-invasive approach may be sufficient for its identification. These new results will be very helpful for more complex stratigraphy and should be considered a starting point for madder lake characterization in real case studies concerning historical musical instruments.

Supplementary Materials

The following material is available online at https://www.mdpi.com/2079-6412/8/5/171/s1, Table S1: Colourimetric coordinates in the CIELCH space for the coloured mock-ups, Table S2: ΔE values (CIE2000) after artificial ageing for 520 h.

Author Contributions

M.G., G.F. and M.M. conceived and designed the research; G.F., T.R. and A.P. performed the analyses; M.G., G.F., T.R. and A.P. analyzed the data; C.C. provided the materials for the preparation of mock-ups and prepared them; M.G., G.F., T.R., M.M. and M.L. wrote the paper.

Funding

This research received no external funding.

Acknowledgments

Fantuzzi Colori Vegetali is acknowledged for providing the madder lake.

Conflicts of Interest

The authors declare no conflict of interest.

References

  1. Echard, J.P.; Lavedrine, B. Review on the characterisation of ancient stringed musical instruments varnishes and implementation of an analytical strategy. J. Cult. Herit. 2008, 9, 420–429. [Google Scholar] [CrossRef]
  2. Invernizzi, C.; Fichera, G.V.; Licchelli, M.; Malagodi, M. A non-invasive stratigraphic study by reflection FT-IR spectroscopy and UV-induced fluorescence technique: The case of historical violins. Microchem. J. 2018, 138, 273–281. [Google Scholar] [CrossRef]
  3. Fiocco, G.; Rovetta, T.; Gulmini, M.; Piccirillo, A.; Licchelli, M.; Malagodi, M. Spectroscopic analysis to characterize finishing treatments of ancient bowed string instruments. Appl. Spectrosc. 2017, 71, 2477–2487. [Google Scholar] [CrossRef] [PubMed]
  4. Tai, B.H. Stradivari’s Varnish: A review of scientific findings—Part I. J. Violin Soc. Am. 2007, 21, 119–144. [Google Scholar]
  5. Tai, B.H. Stradivari’s Varnish: A review of scientific findings—Part II. J. Violin Soc. Am. 2009, 22, 1–31. [Google Scholar]
  6. Bucur, V. The varnish. In Handbook of Materials for String Musical Instruments, 1st ed.; Springer International Publishing: Basel, Switzerland, 2016; pp. 373–453. [Google Scholar]
  7. Rovetta, T.; Invernizzi, C.; Licchelli, M.; Cacciatori, F.; Malagodi, M. The elemental composition of Stradivari’s musical instruments: New results through non-invasive EDXRF analysis. X-Ray Spectrom. 2018, 47, 159–170. [Google Scholar] [CrossRef]
  8. Fichera, G.V.; Rovetta, T.; Fiocco, G.; Alberti, G.; Invernizzi, C.; Licchelli, M.; Malagodi, M. Elemental analysis as statistical preliminary study of historical musical instruments. Microchem. J. 2018, 137, 309–317. [Google Scholar] [CrossRef]
  9. Invernizzi, C.; Daveri, A.; Rovetta, T.; Vagnini, M.; Licchelli, M.; Cacciatori, F.; Malagodi, M. A multi-analytical non-invasive approach to violin materials: The case of Antonio Stradivari “Hellier” (1679). Microchem. J. 2016, 124, 743–750. [Google Scholar] [CrossRef]
  10. Echard, J.P.; Bertrand, L.; von Bohlen, A.; Le Hô, A.S.; Paris, C.; Bellot-Gurlet, L.; Soulier, B.; Lattuati-Derieux, A.; Thao, S.; Robinet, L.; et al. The nature of the extraordinary finish of Stradivari’s instruments. Angew. Chem. 2010, 49, 197–201. [Google Scholar] [CrossRef] [PubMed]
  11. Caruso, F.; Martino, D.F.C.; Saverwyns, S.; Van Bos, M.; Burgio, L.; Di Stefano, C.; Peschke, G.; Caponetti, E. Micro-analytical identification of the components of varnishes from South Italian historical musical instruments by PLM, ESEM-EDX, microFTIR, GC–MS, and Py–GC–MS. Microchem. J. 2014, 116, 31–40. [Google Scholar] [CrossRef]
  12. Gulmini, M.; Idone, A.; Diana, E.; Gastaldi, D.; Vaudanc, D.; Aceto, M. Identification of dyestuffs in historical textiles: Strong and weak points of a non-invasive approach. Dyes Pigment. 2013, 98, 136–145. [Google Scholar] [CrossRef]
  13. Casadio, F.; Leona, M.; Lombardi, J.R.; Van Duyne, R. Identification of organic colorants in fibers, paints, and glazes by surface enhanced Raman spectroscopy. Acc. Chem. Res. 2010, 43, 782–791. [Google Scholar] [CrossRef] [PubMed]
  14. Melo, M.J.; Claro, A. Bright light: Microspectrofluorimetry for the characterization of lake pigments and dyes in works of art. Acc. Chem. Res. 2010, 43, 857–866. [Google Scholar] [CrossRef] [PubMed]
  15. Idone, A.; Aceto, M.; Diana, E.; Appolonia, L.; Gulmini, M. Surface-enhanced Raman scattering for the analysis of red lake pigments in painting layers mounted in cross sections. J. Raman Spectrosc. 2014, 45, 1127–1132. [Google Scholar] [CrossRef]
  16. Bisulca, C.; Picollo, M.; Bacci, M.; Kunzelman, D. UV-Vis-NIR reflectance spectroscopy of red lakes in paintings. In Proceedings of the 9th International Conference of NDT of Art, Jerusalem, Israel, 25–30 May 2008. [Google Scholar]
  17. Meyer, M.; Huthwelker, T.; Borca, C.N.; Meßlinger, K.; Bieber, M.; Finka, R.H.; Späth, A. In-situ spectroscopic analysis of the traditional dyeing pigment Turkey red inside textile matrix. J. Instrum. 2018, 13, C03007. [Google Scholar] [CrossRef]
  18. Campanella, B.; Grifoni, E.; Hidalgob, M.; Legnaioli, S.; Lorenzetti, G.; Pagnotta, S.; Poggialini, F.; Ripoll-Seguer, L.; Palleschi, V. Multi-technique characterization of madder lakes: A comparison between non- and micro-destructive methods. J. Cult. Herit. 2018, in press. [Google Scholar] [CrossRef]
  19. Daniels, V.; Devièse, T.; Hacke, M.; Higgitt, C. Technological insights into madder pigment production in antiquity. Br. Mus. Tech. Res. Bull. 2014, 8, 13–28. [Google Scholar]
  20. Blackburn, R.S. Natural dyes in madder (Rubia spp.) and their extraction and analysis in historical textiles. Color. Technol. 2017, 133, 449–462. [Google Scholar] [CrossRef]
  21. Schweppe, H.; Winter, J. Madder and alizarin. In Artists’ Pigments: A Handbook of Their History and Characteristics, 1st ed.; Fitzhugh, E.W., Ed.; National Gallery of Art: Washington, DC, USA; Archetype Publications: London, UK, 1997; Volume 3, pp. 109–142. [Google Scholar]
  22. Michelman, J. Violin Varnish: A Plausible Re-Creation of the Varnish Used by the Italian Violin Makers Between the Years 1550 and 1750, A.D, 1st ed.; Joseph Michelman: Cincinnati, OH, USA, 1946; pp. 58–154. [Google Scholar]
  23. Barlow, C.Y.; Woodhouse, J. Of old wood and varnish: Peering into the can of worms. Catgut. Acoust. Soc. J. Ser. II 1989, 1, 2–9. [Google Scholar]
  24. Tirat, S.; Degano, I.; Echard, J.P.; Lattuati-Derieux, A.; Lluveras-Tenorio, A.; Marie, A.; Serfaty, S.; Le Huerou, J.Y. Historical linseed oil/colophony varnishes formulations: Study of their molecular composition with micro-chemical chromatographic techniques. Microchem. J. 2016, 126, 200–213. [Google Scholar] [CrossRef]
  25. Weththimuni, M.L.; Canevari, C.; Legnani, A.; Licchelli, M.; Malagodi, M.; Ricca, M.; Zeffiro, A. Experimental characterization of oil-colophony varnishes: A preliminary study. Int. J. Conserv. Sci. 2016, 7, 813–826. [Google Scholar]
  26. UNI EN 15886. Conservation of Cultural Property—Test Methods-Colour Measurement of Surfaces; Czech Office for Standards, Metrology and Testing: Praha, Czech Republic, 2010. [Google Scholar]
  27. Claro, A.; Melo, M.J.; Schäfer, S.; Seixas de Melo, J.S.; Pina, F.; van den Berg, K.J.; Burnstock, A. The use of microspectrofluorimetry for the characterization of lake pigments. Talanta 2008, 74, 922–929. [Google Scholar] [CrossRef] [PubMed]
  28. Farke, M.; Binetti, M.; Hahn, O. Light damage to selected organic materials in display cases: A study of different light sources. Stud. Conserv. 2016, 61, 83–93. [Google Scholar] [CrossRef]
  29. Saunders, D.; Kirby, J. Light-induced colour changes in red and yellow lake pigments. In National Gallery Technical Bulletin, 1st ed.; Roy, A., Ed.; National Gallery Publications Limited: London, UK, 1994; Volume 15, pp. 79–97. [Google Scholar]
  30. Clementi, C.; Doherty, B.; Gentili, P.L.; Miliani, C.; Romani, A.; Brunetti, B.G.; Sgamellotti, A. Vibrational and electronic properties of painting lakes. Appl. Phys. A 2008, 92, 25–33. [Google Scholar] [CrossRef]
  31. Mantler, M.; Willis, J.P.; Lachance, G.R.; Vrebos, B.A.R.; Mauser, K.E.; Kawahara, N.; Rousseau, R.M.; Brouwer, P.N. Quantitative analysis in Handbook of Practical X-ray Fluorescence Analysis, 1st ed.; Beckhoff, B., Kanngießer, B., Langhoff, N., Wedell, R., Wolff, H., Eds.; Springer: Berlin, Germany, 2006; pp. 309–410. [Google Scholar]
  32. Glinsman, L.D. The practical application of air-path X-ray fluorescence spectrometry in the analysis of museum objects. Stud. Conserv. 2005, 50, 3–17. [Google Scholar] [CrossRef]
  33. Kirby, J.; Spring, M.; Higgitt, M. The technology of red lake pigment manufacture: Study of the dyestuff substrate. In National Gallery Technical Bulletin, 1st ed.; Roy, A., Ed.; National Gallery Company Limited: London, UK, 2005; Volume 26, pp. 71–87. [Google Scholar]
  34. Derrick, M.R.; Stulik, D.; Landry, J.M. Infrared Spectroscopy in Conservation Science. Scientific Tools for Conservation, 1st ed.; The Getty Conservation Institute: Los Angeles, CA, USA, 1999; pp. 182–185. [Google Scholar]
  35. Koperska, M.; Łojewski, T.; Łojewska, J. Vibrational spectroscopy to study degradation of natural dyes. Assessment of oxygen-free cassette for safe exposition of artefacts. Anal. Bioanal. Chem. 2011, 399, 3271–3283. [Google Scholar] [CrossRef] [PubMed]
  36. Ahn, C.; Obenborf, S.K. Dyes on archaeological textiles: Analyzing alizarin and its degradation products. Text. Res. J. 2004, 74, 949–954. [Google Scholar] [CrossRef]
  37. Azémard, C.; Vieillescazes, C.; Ménager, M. Effect of photodegradation on the identification of natural varnishes by FT-IR spectroscopy. Microchem. J. 2014, 112, 137–149. [Google Scholar] [CrossRef]
  38. Invernizzi, C.; Daveri, A.; Vagnini, M.; Malagodi, M. Non-invasive identification of organic materials in historical stringed musical instruments by reflection infrared spectroscopy: A methodological approach. Anal. Bioanal. Chem. 2017, 409, 3281–3288. [Google Scholar] [CrossRef] [PubMed]
  39. Degani, L.; Gulmini, M.; Piccablotto, G.; Iacomussi, P.; Gastaldi, D.; Dal Bello, F.; Chiantore, O. Stability of natural dyes under light emitting diode lamps. J. Cult. Herit. 2017, 26, 12–21. [Google Scholar] [CrossRef]
  40. Fichera, G.V.; Albano, M.; Fiocco, G.; Invernizzi, C.; Licchelli, M.; Malagodi, M.; Rovetta, T. Innovative monitoring plan for the preventive conservation of historical musical instruments. Stud. Conserv. 2017, accepted. [Google Scholar]
  41. Crews, P.C. The fading rates of some natural dyes. Stud. Conserv. 1987, 32, 65–72. [Google Scholar]
  42. Echard, J.P. In situ multi-element analyses by Energy-Dispersive X-ray Fluorescence on varnishes of historical violins. Spectrochim. Acta B 2004, 59, 1663–1667. [Google Scholar] [CrossRef]
  43. Bruni, S.; De Luca, E.; Guglielmi, V.; Pozzi, F. Identification of natural dyes on laboratory-dyed wool and ancient wool, silk, and cotton fibers using attenuated total reflection (ATR) Fourier transform infrared (FT-IR) spectroscopy and Fourier transform Raman spectroscopy. Appl. Spectrosc. 2011, 65, 1017–1023. [Google Scholar] [CrossRef] [PubMed]
Figure 1. The considered mock-ups. Each of the six sets of images shows the same sample after increasing exposure times (namely t = 0 h, t = 240 h and t = 520 h). For the same exposure time, the sample is shown in visible (left) and UV (right) light illumination. Horizontal red lines separate areas where different subsequent coats of the lake-containing layer were applied.
Coatings 08 00171 g001
Figure 2. ML grains observed through the stereomicroscope under UV-light illumination: P4 at (a) t = 0 h, (b) t = 240 h, and (c) t = 520 h; P7 at (d) t = 0 h, (e) t = 240 h. and (f) t = 520 h. All areas refer to three coats of the lake-containing layer (OCV or AC).
Coatings 08 00171 g002
Figure 3. Cross sections observed through the optical microscope under UV illumination: P3 at (a) t = 0 h and (b) at t = 520 h; P8 at (c) t = 0 h and (d) at t = 520 h. The letter A indicates the outer OCV layer and B indicates the AC primer layer under the outer OCV coat.
Coatings 08 00171 g003
Figure 4. Colour coordinates in the C* h* plane (polar reference system): Unaged samples of (a) P3 and P4, (b) P5 and P6, and (c) P7 and P8. Circles refer to uncoloured coating systems, triangles to 1 coat, squares to 2 coats and diamonds to 3 coats. (d) Aged samples; circles refer to t = 240 h, squares to t = 520 h, red marks are referred to aged uncoloured samples.
Coatings 08 00171 g004
Figure 5. (a) Overview of the results obtained by FORS for mock-ups exposed to artificial solar radiation. The darkest colour indicates that madder signals are clearly detectable while the lightest colour indicates that madder signals are undetectable. The colour between these two situations indicates that the madder signals are barely detectable in the FORS spectra. (b) Examples of spectra for these three situations—focused on the most selective spectral range for the detection of ML—are reported in the right part of the picture.
Coatings 08 00171 g005
Figure 6. (a) Rough estimates of Al, S ad K signals expressed as the area under the Ka peaks; (b) elemental percentage of the mock-ups area values with respect to the area values detected from a pellet of pure ML.
Coatings 08 00171 g006
Figure 7. Energy dispersive X-ray spectroscopy analysis performed on a micrometer particle of ML dispersed in the varnish layer of P4 sample.
Coatings 08 00171 g007
Figure 8. µFTIR-transmission analyses performed on some micro-samples: (a) ML grains at t = 0 (red) and t = 520 h (blue); (b) OCV without ML at t = 0 h (black), ML embedded in the OCV at t = 0 h (red) and at t = 520 h (blue); (c) AC at t = 0 h (black) and ML grain embedded in AC at t = 0 h (red).
Coatings 08 00171 g008
Table 1. Details for the various coating systems prepared on the maple slabs. AC = ammonium caseinate; ML = madder lake; OCV = oil-colophony varnish. The number of coatings refers to the maximum number of subsequent coats of the lake-containing material (AC or OCV).
Model CodeNumber of CoatsSequence of the Layers on the Maple Wood
P1AC10%
P2AC10%
AC15%
P32AC10%
AC15%
ML (7%) in OCV
P42AC10%
AC15%
ML (20%) in OCV
P53AC10%
ML (1%) in AC15%
P62AC10%
ML (4%) in AC15%
P73AC10%
ML (1%) in AC15%
OCV
P82AC10%
ML (4%) in AC15%
OCV
Table 2. Characteristic IR signals of ML detected at t = 0 h and at t = 520 h (s: strong; m: medium; w: weak; sh: shoulder).
Suggested AssignmentIR Bands for t = 0 h (cm−1)IR Bands for t = 520 h (cm−1)Ref.
νO–H3400s3395s[34,35]
νC=O1695sh1695sh[34]
νC=O, νC=C1640m1651s[35]
νC=C1590sh[34,35]
νC=C1530w1530sh[34,35]
δC–H21425m1425m[34,35]
δC–O1295w1300w[34]
νS–O1105s1105s[34,35]

