Effects of Coating Film Parameters on Thermal and Stress Distributions of Glass-Based Phosphor-Converted Color Wheels


1
Department of Mechanical Engineering, Cheng Shiu University, Kaohsiung 83347, Taiwan
2
Department of Mechanical Engineering, National Kaohsiung University of Science and Technology, Kaohsiung 80778, Taiwan
3
Department of Mechanical and Electro-Mechanical Engineering, National Sun Yat-sen University, Kaohsiung 804, Taiwan
4
Department of Electrical Engineering, Cheng Shiu University, Kaohsiung 83347, Taiwan
*
Authors to whom correspondence should be addressed.
Coatings 2018, 8(5), 188; https://doi.org/10.3390/coatings8050188
Submission received: 28 April 2018
/
Revised: 14 May 2018
/
Accepted: 14 May 2018
/
Published: 17 May 2018
(This article belongs to the Special Issue Selected Papers from IEEE ICASI 2018)
Abstract
:To protect the environment, the use of mercury tubes has been prohibited in Europe since 2000. As an alternative, phosphor-doped silicone resin wheels have been used to convert blue-ray laser diodes. However, high-temperature photonic decay and cracking on the lens surface significantly degrade transmission. Recent research has explored the possibility of replacing the silicone encapsulant material of the phosphor layer with glass. In this study, the thermal effects of a glass-based phosphor-converted color wheel (GP wheel) and a silicone-based phosphor-converted color wheel (SP wheel) were investigated using various parameters and geometries. A thermal-structural coupling finite element (FE) model of the color wheels was employed to simulate the thermal and stress distributions. To construct the FE model, experiments were conducted and the inverse engineering approach was employed to extract the optical-to-heat conversion coefficient and the heat convection coefficient. In addition, an arc-shaped moving input heat flux was used to simulate a moving laser input and reduce the calculation time of the FE model. Based on the numerical and experimental results, the FE model developed can simulate the steady/transient behavior of the resin and the GP wheel. In addition, the results reveal that thermal failures of the SP wheel are very likely to occur under all parameters employed in this study, whereas the maximum temperature of the GP wheel reaches only approximately 40% of the glass transition temperature. The numerical results indicate that the GP wheel may be useful for overcoming all of these thermal disadvantages in a high-power laser-lit projector.
1. Introduction
Projectors are used widely in daily life. For applications such as large-scale projection and mobile projection, high power efficiency and power output are required. However, environmental protection has necessitated the restriction or complete ban of hazardous substances in electrical and electronic equipment, halting the development of traditional mercury lamps. Laser projectors have become competitive alternatives to mercury lamp projectors due to their optical advantages, which include high power efficiency, high power output, long lifetime, brightness, and low degree of environmental pollution. At this point, however, high-power lasers are too expensive for commercial applications and take up considerable space in projectors. Consequently, a projector with three independent laser sources to acquire three primary colors has many drawbacks. To build a functional laser projector with a single-color laser source, the phosphor-converted color wheel (PC wheel) was developed to convert a laser of one primary color, for example blue, into two other primary colors. The behavior of the PC wheel is crucial in high-power laser projectors.
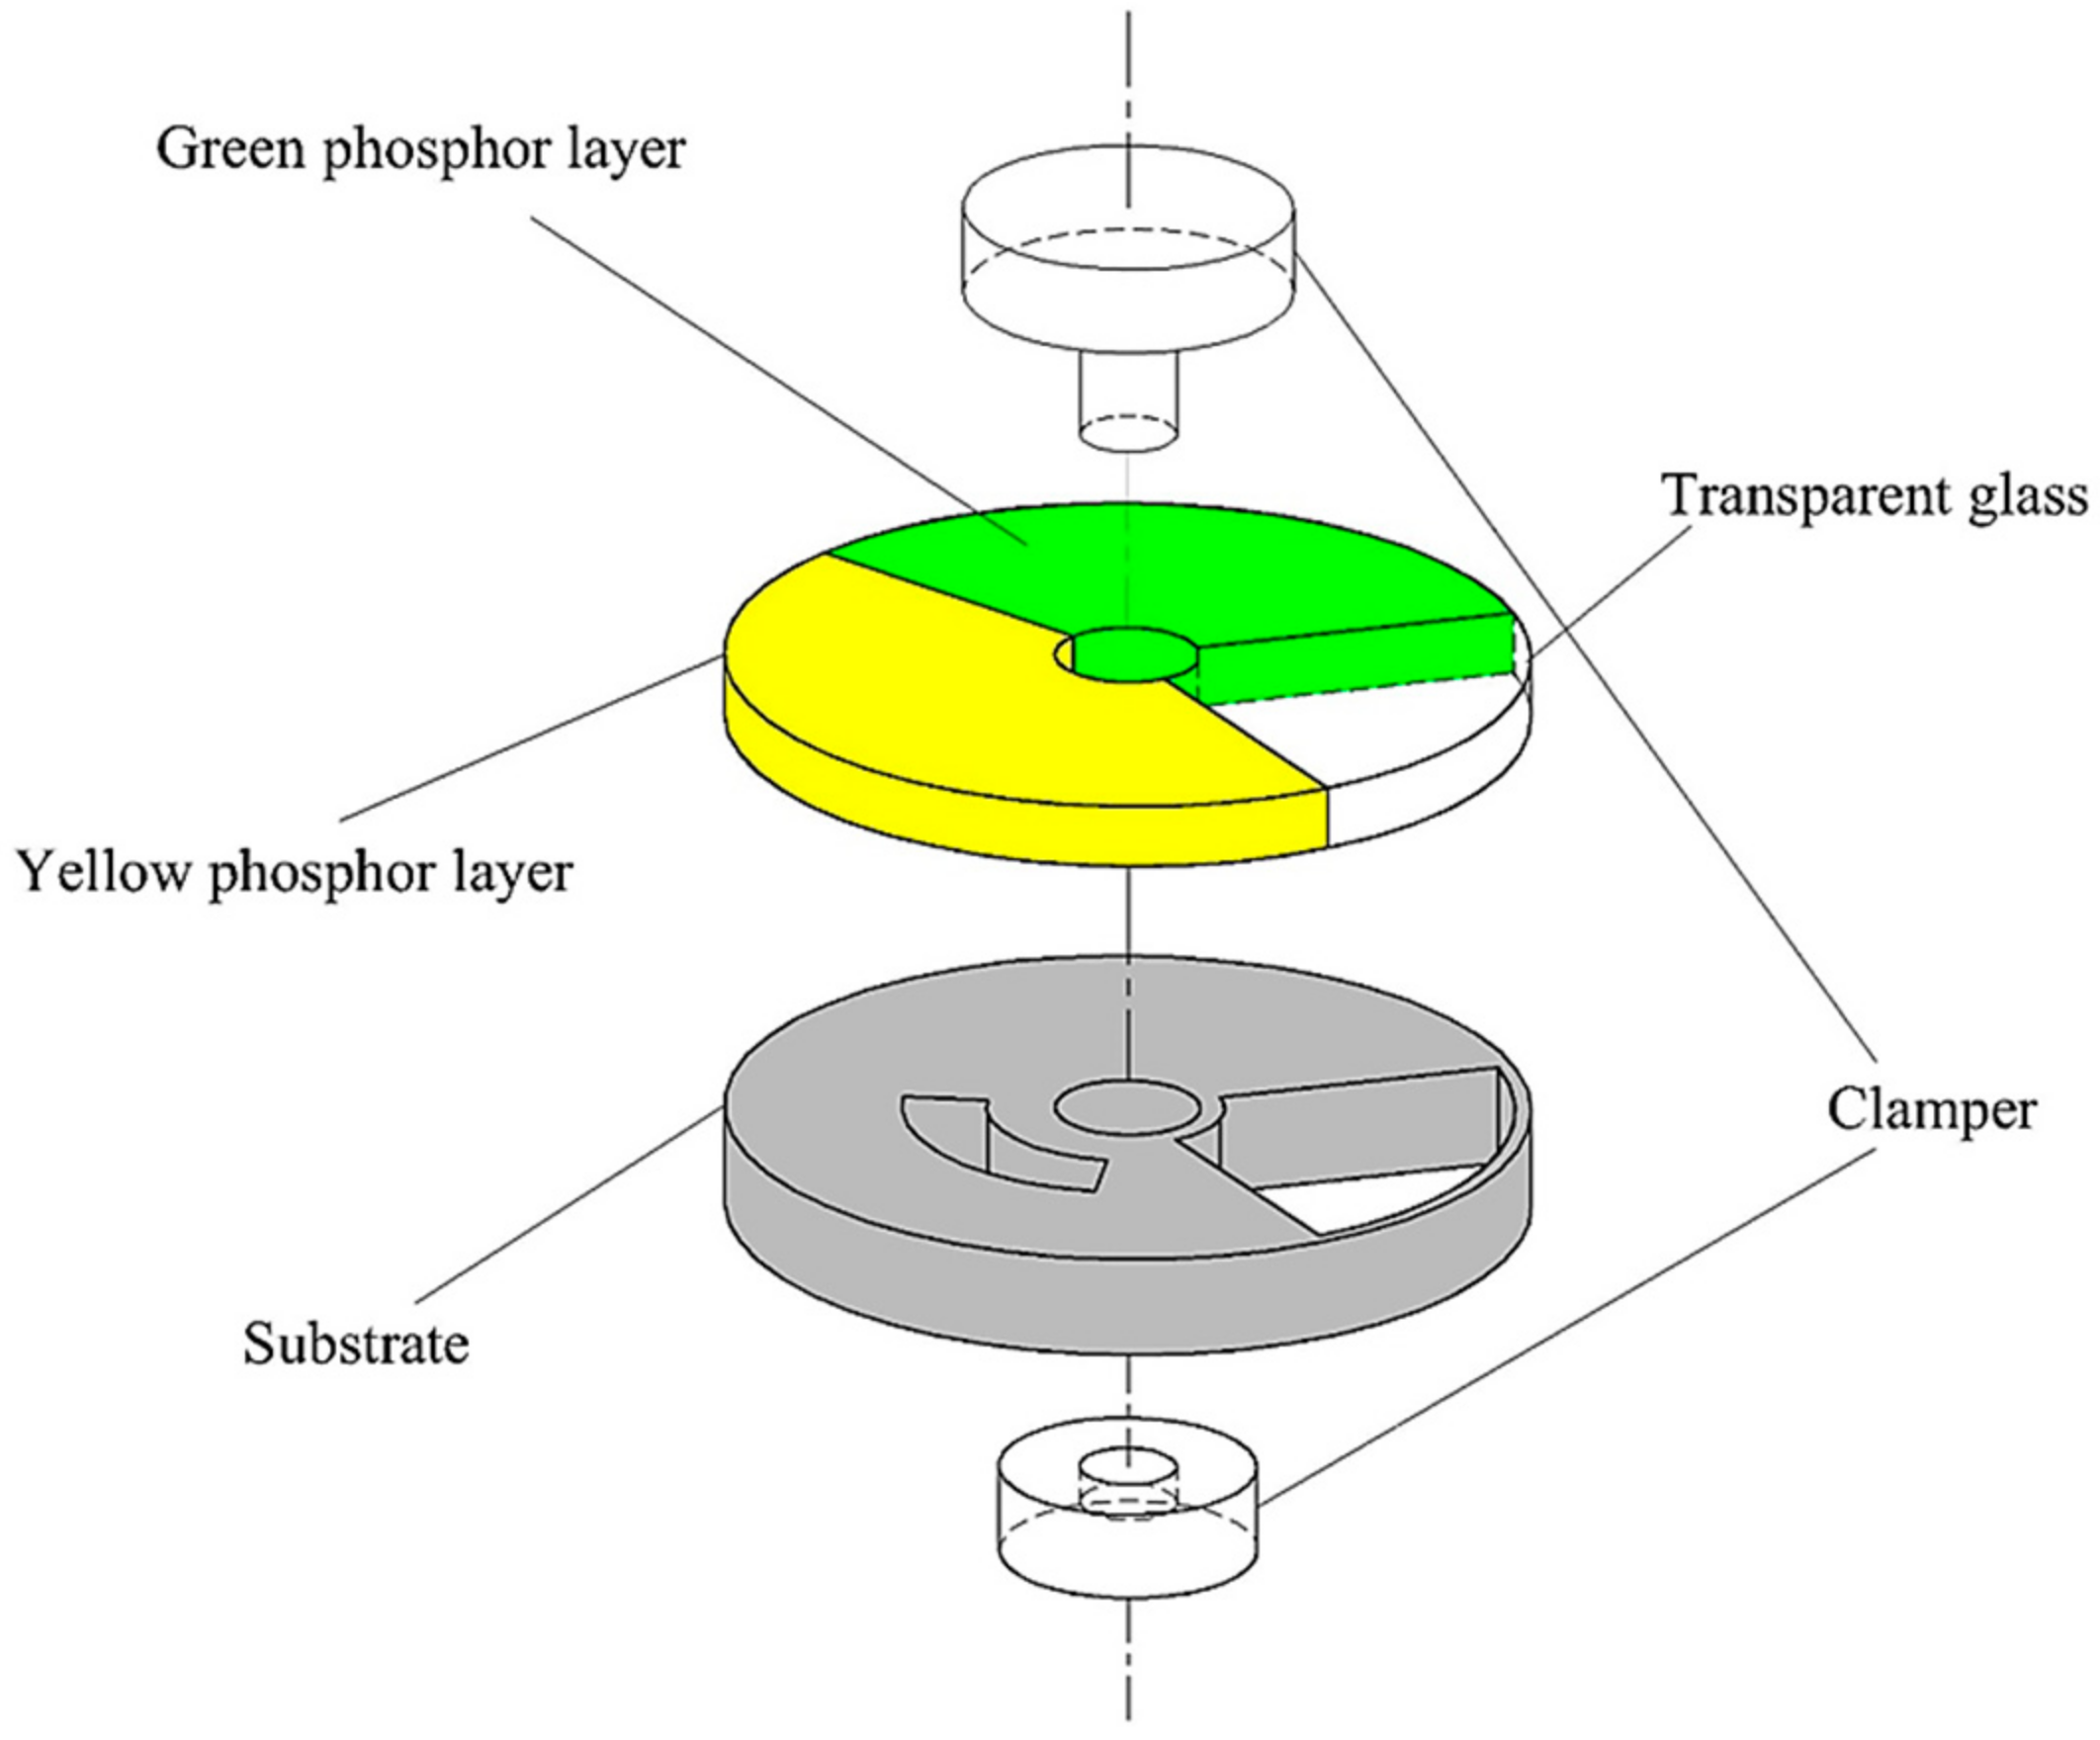
Figure 1 shows the basic elements of a PC wheel. Its function is to convert a laser of one primary color (blue in this study) into two other primary colors (green and yellow). A standard PC wheel has five main components to help achieve this goal: a substrate, phosphor-converted layers of two different colors, high-transparency glass, and a motor-connected clamper. When the PC wheel is operating, it is rotated by a motor so that the blue laser can pass through the phosphor layers and through anti-reflection (AR) glass.
Silicone is currently the most commonly used material to encapsulate phosphor layers. However, silicone does not remain resistant to large amounts of heat over long operation times. As the projector power increases, the excess heat generated during light conversion increases as well. Under these circumstances, a silicone-based phosphor-converted color wheel (SP wheel) is very likely to fail, so silicone must be replaced with an alternative encapsulating material to increase the lifetime of a PC wheel under high power input. To meet the optical requirements of a projector, the encapsulant must be highly transparent, highly heat resistant, sufficiently thermally conductive, and highly resistant to the fatigue load resulting from periodic temperature gradients.
The yellow and green phosphors used in this study were yttrium aluminum garnet (YAG:Ce) and lutetium aluminum garnet (LuAG:Ce), respectively; the scintillation properties and manufacturing methods of these garnets were investigated by Chewpraditkul et al. [1] and Comanzo et al. [2]. The target optical laser power input in this study was approximately 120 W, exceeding that of traditional projectors. Therefore, the aging and yellowing effects of the silicone phosphor layer in the projection system were more significant. Barton [3] performed several investigations into the degradation of silicone encapsulants. The results showed that under blue and UV illumination at elevated temperatures, a rapid loss of output light and severe degradation of the encapsulant occurred. Fu et al. [4] and McIntosh et al. [5] provided information on the degradation and scattering of different silicone light-emitting diodes (LEDs) under several different exposures. Their findings indicated that scattering due to moisture should be considered within the silicone encapsulant, and that aging leads to attenuation of the light field. Tsai et al. [6] analyzed different types of LEDs with and without YAG:Ce and indicated that the concentration of phosphors in the encapsulant increases as the phosphor layer ages with increasing temperature; this phenomenon leads to severe lumen loss during the color-conversion process.
Glass-based and silicone-based phosphor layers are fabricated very differently. Wang et al. [7] and Pareek et al. [8] established a relatively low-temperature procedure to maintain the optical properties of YAG:Ce/LuAG:Ce and reduce the air bubbles that grow within the layers during manufacturing, which can lower the color-conversion efficiency. They suggested YAG:Ce and LuAG:Ce concentrations of 40 wt.% and 35 wt.%, respectively, to optimize the efficiency of optical color conversion. Chang et al. [9] and Cheng et al. [10] indicated that glass is a competitive encapsulant and showed that glass-based phosphor-converted white-emitting diodes exhibit higher thermal stability and optical characteristics at 250 °С than silicone. In 2012, Tsai [11] investigated the thermal stress in silicone-based and glass-based phosphors in blue LEDs fabricated using different sealing methods. The results of that study showed that glass-based phosphor (GP) layers are more resistant to cracking. In 2014, El-Daher et al. [12] used a finite element (FE) model to simulate the mechanical properties of GP layers with different concentrations. However, they only investigated the steady-state behaviors of GP wheels, whereas acquiring a more complete view of the system requires making several adjustments to the parameters as well as running practical experiments. In this article, we investigate a glass-based phosphor-converted color wheel under a high optical laser input power of approximately 120 W. The effects of coating film parameters on thermal and stress distributions in the GP wheel are examined through several experiments and a series of finite element method (FEM) simulations, which are modeled using MSC.Mental and solved using MSC.Marc.
The remainder of this paper is structured as follows: Section 2 addresses the associated theories and the finite element model. Section 3 applies inverse engineering techniques to obtain the parameters of the FE model and then presents and discusses the simulation results. Finally, Section 4 draws some conclusions from the experimental and simulation results and discusses future work.
2. Associated Theories and Finite Element Model
2.1. Heat Absorption Coefficients
The input laser excites the atoms of the projected substance. Energy loss can occur during this process in the form of light and thermal energy emission through interatomic collisions. The loss of thermal energy indicates that a certain portion of the input laser power is transformed from optical energy to heat, and this heat creates a temperature gradient on the PC wheel. To calculate the rate of heat generation, two coefficients are defined in this paper: the heat absorption coefficients of the phosphor (αp) and the substrate (αs).
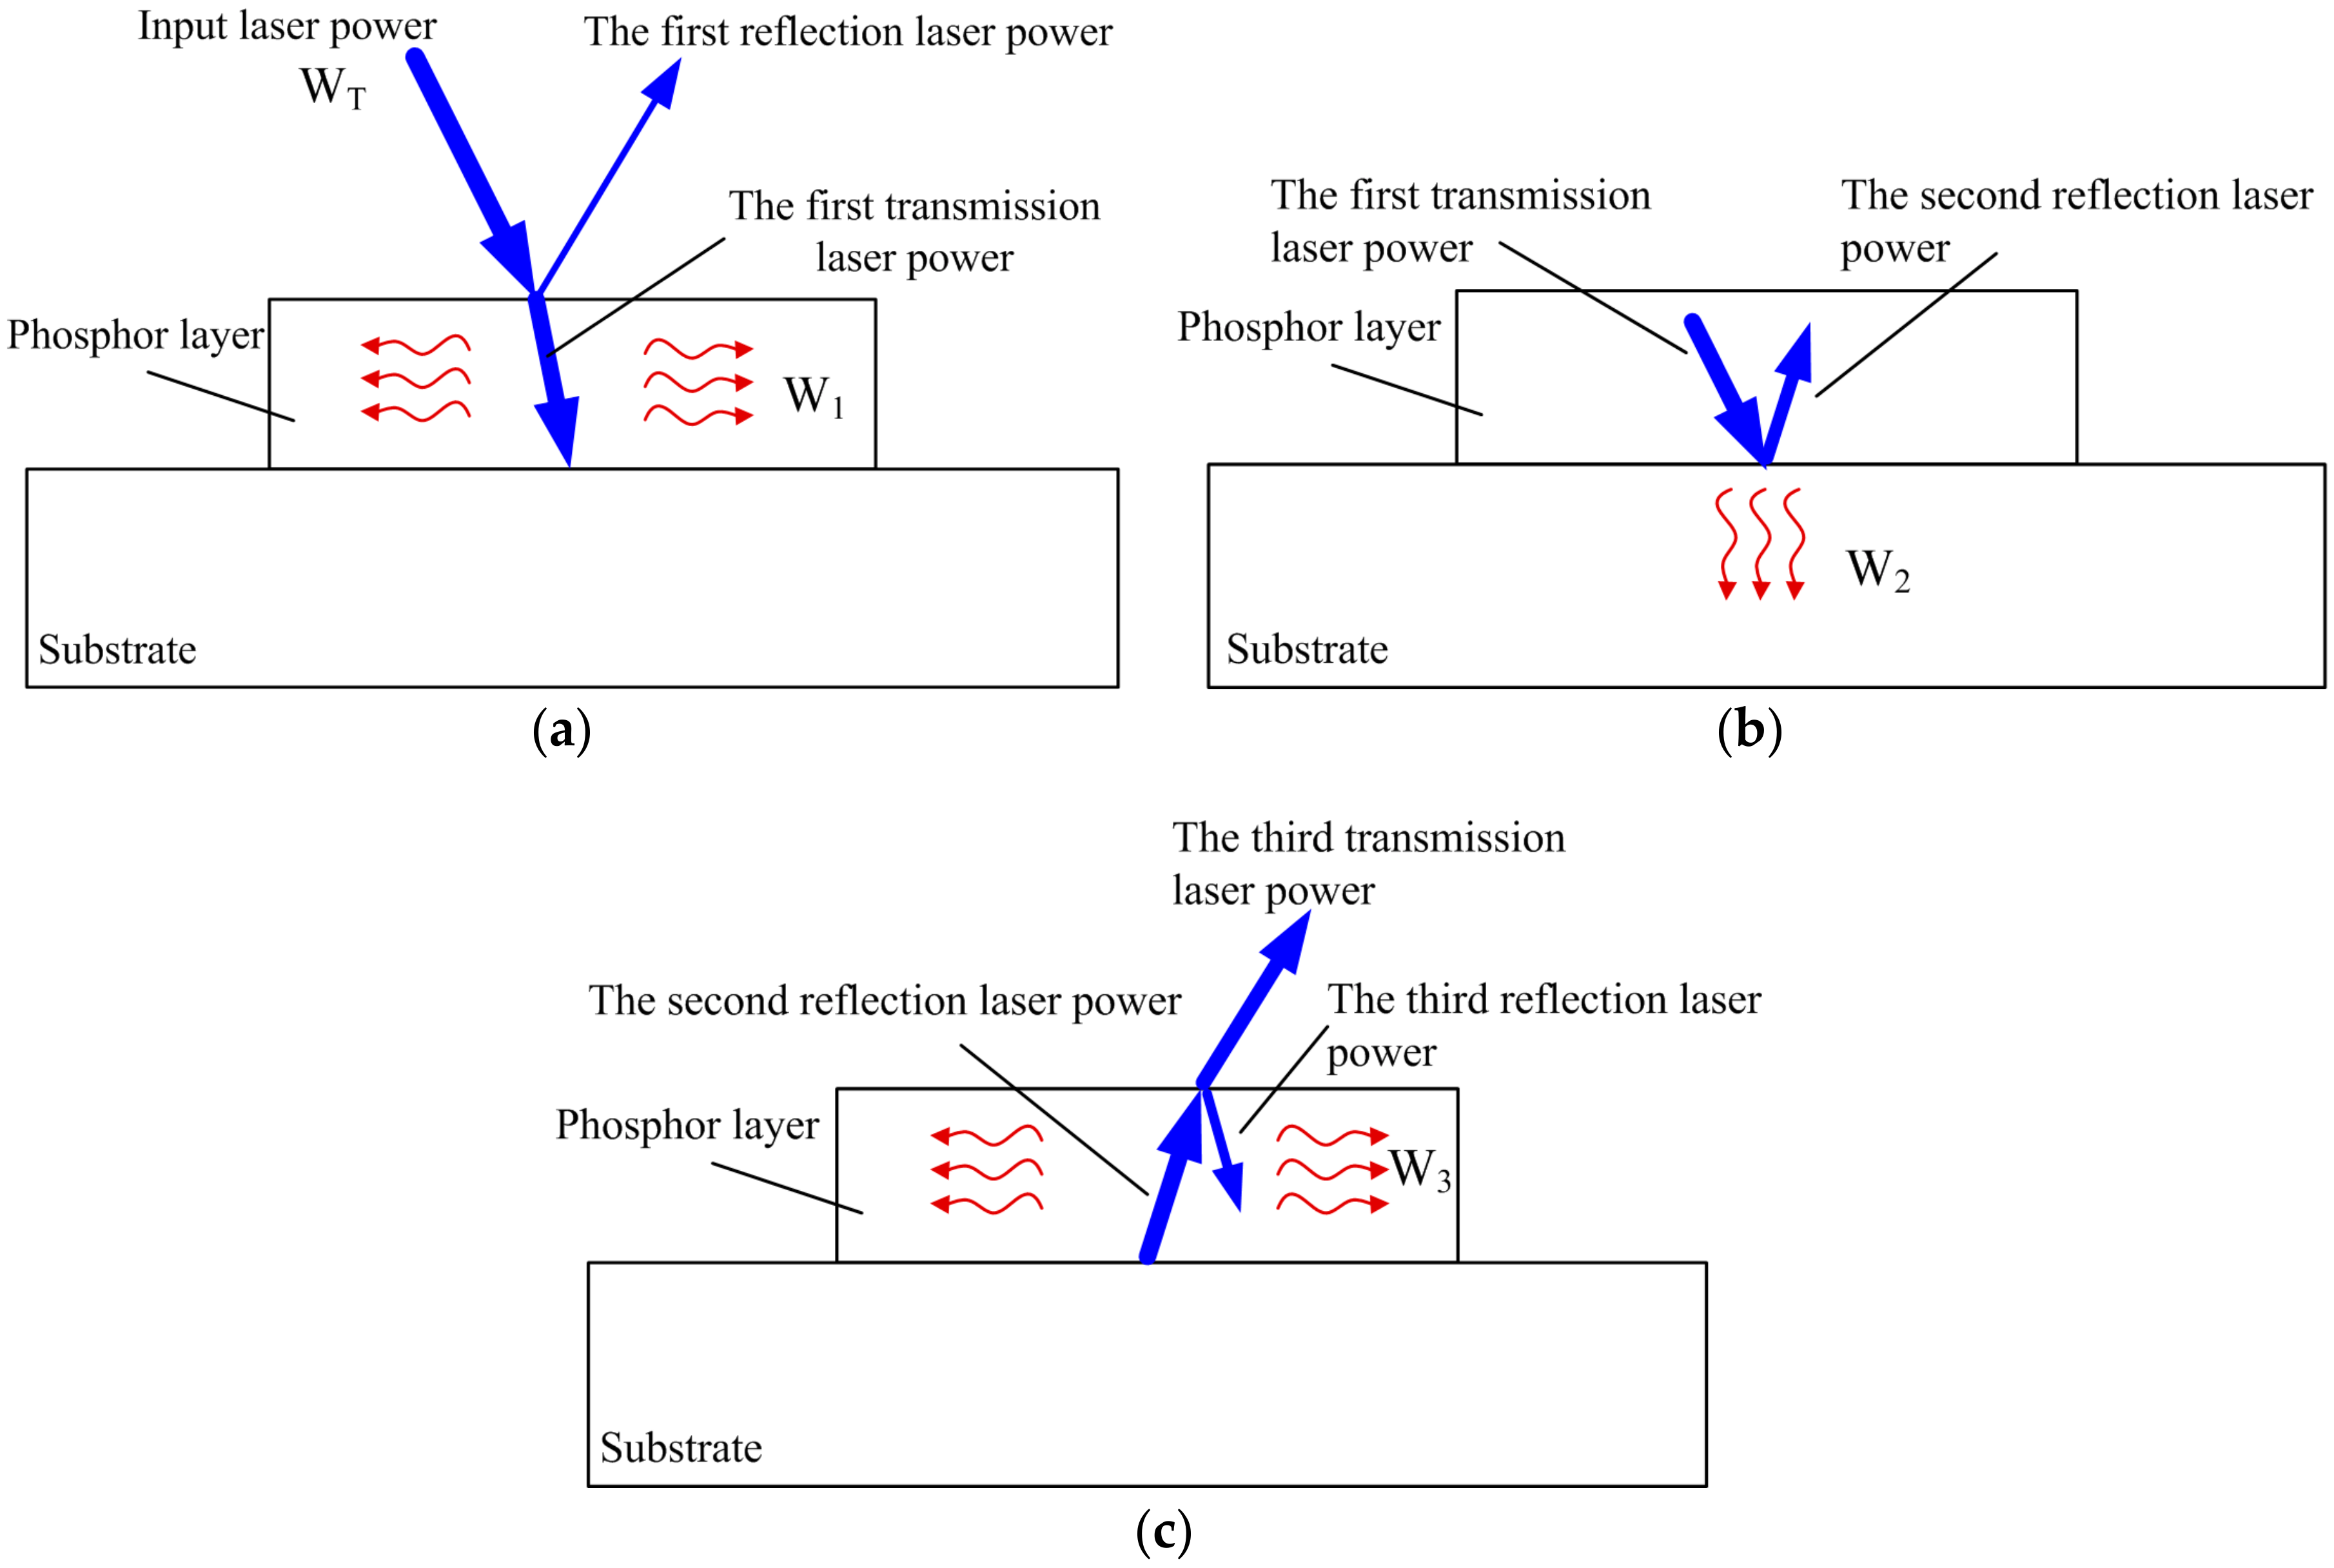
The generated heat can be divided into three parts. The first time the input laser passes through the phosphor layer, the input energy causes interatomic collisions within the layer, thus a portion of the optical laser power is transformed into heat. This is the first part of the heat generated. The second part arises when the input laser hits the substrate and is reflected by it. As with the first layer, the input energy leads to interatomic collisions within the substrate, generating heat. After reflection, the laser passes back through the phosphor layer and again triggers interatomic collisions, generating the third component of heat. The process is shown in Figure 2. The ratio of the heat generation rate on the phosphor to the optical input laser power is defined as the phosphor’s heat absorption coefficient (αp), which combines the first and third parts of the aforementioned generated heat. Similarly, the ratio of the heat generation rate on the substrate to the optical input laser power is defined as the substrate’s heat absorption coefficient (αs). These coefficients are expressed by Equations (1) and (2):
where WT is the total optical input laser power (watt), W1 is the first heat generation rate by the transmission laser, W2 is the second heat generation rate within substrate, and W3 is the third heat generation rate in the phosphor layer by the third reflection laser power.
2.2. Geometric and Material Properties of the GP Wheel
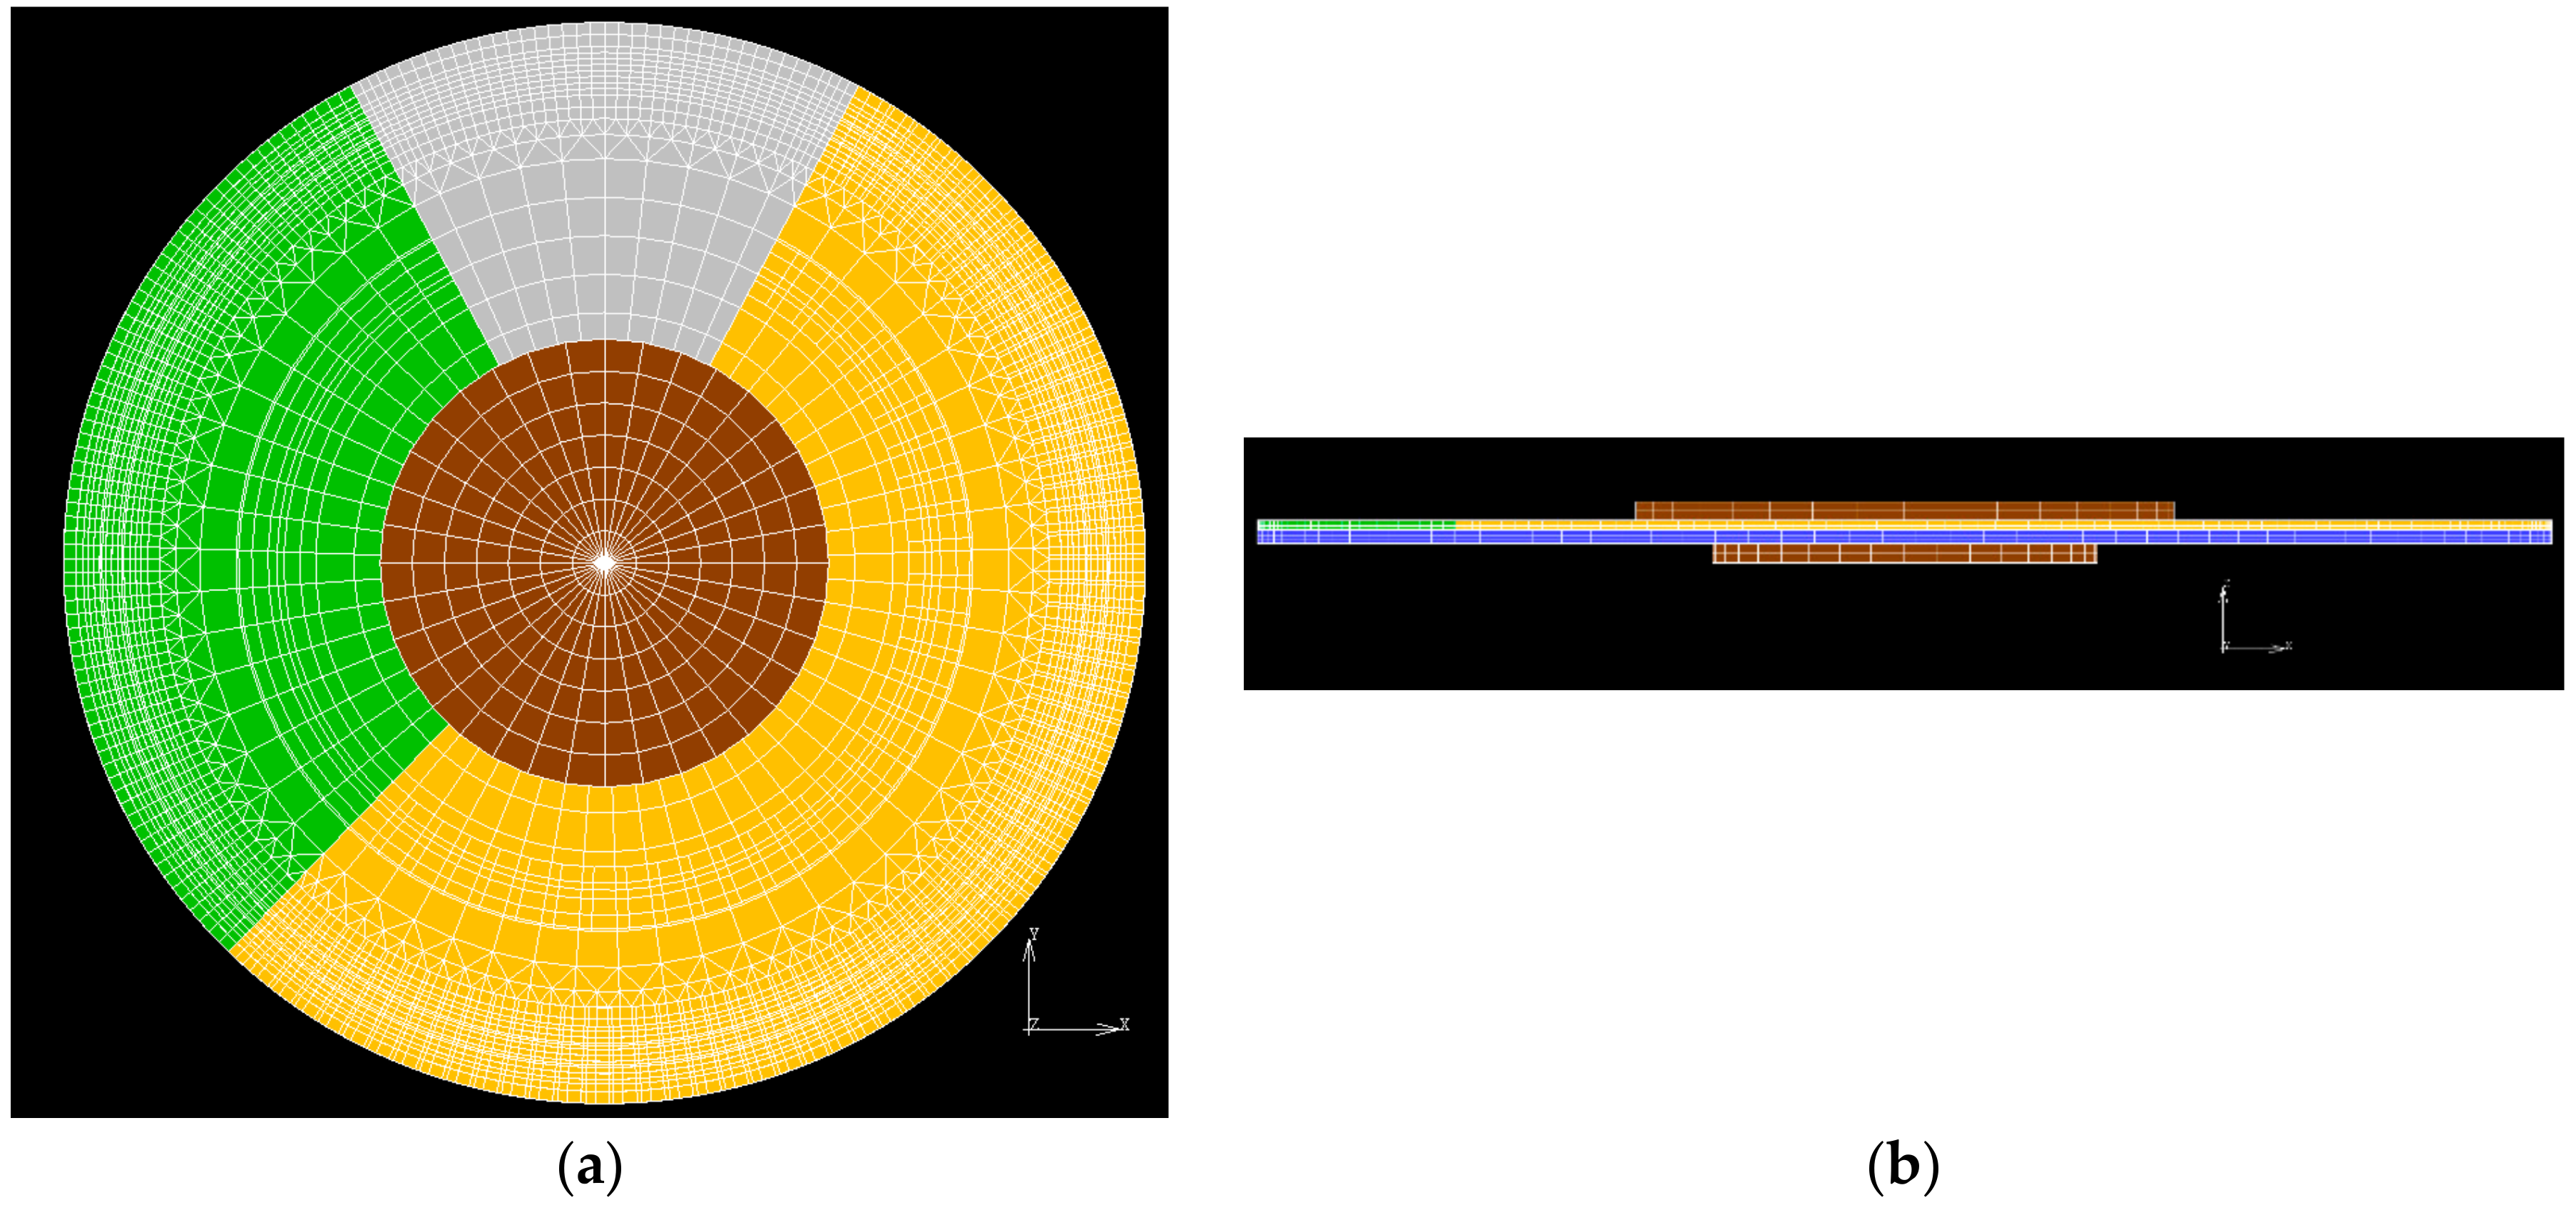
The dimensions of the PC wheel were provided by Taiwan Color Optics, Inc. (TCO, Taichung City, Taiwan) [13] and are listed in Table 1. The material properties of the PC wheel are listed in Table 2. The Young’s modulus and thermal expansion coefficient of silver epoxy depend on temperature; these properties were set as perfectly elastic, as presented in [14]. The constructed FE model of the PC wheel is shown in Figure 3 based on hexahedral element meshes.
2.3. Finite Element Model and Assumptions
Because both thermal-rigid and perfect-thermal-elastic FE simulations are employed in this paper based on hexahedral element meshes, both thermal and structural boundary conditions and input conditions are required. In real circumstances, the PC wheel is sealed by an Φ8 mm shaft on the motor. To simulate this constraint, all degrees of freedom of the nodes within 8 mm of the shaft are fixed. In addition, because the PC wheel is rotated by the attached motor, movement should be added to all elements of the PC wheel. However, having moving elements in an FE model massively increases the computational complexity. As a result, the effects of rotation are separated into two parts in this study. The first part of the rotation effect is the centrifugal force created by the inertia of the PC wheel during rotation, which can easily be applied to all PC wheel elements. The other effect of rotation is the continuous movement of phosphor layers of different colors through the laser source.
2.4. Laser Input/Heat Flux Input Conditions
In real circumstances, a PC wheel rotates at 7200 rpm in the projector chamber, and the minimum time required for the temperature of the PC wheel to attain a steady state is approximately 15 s (tT). To simulate the laser input in MSC.Marc, several assumptions are required.
The first assumption pertains to the movement of the PC wheel. During its operation, the attached motor spins the PC wheel to move phosphor layers of different colors through the immovable laser source. Unfortunately, the movement of a large number of elements increases computational complexity, which increases the time spent performing calculations on the computer. To solve this problem, a moving laser source with the same relative speed was used to replace the movement of the PC wheel, and the effects of the movement of the PC wheel were assumed to be the same as those of the movement of the laser source.
The second assumption states that continuous laser input in practical situations can be divided into a finite number of discrete laser inputs under the same operation time when the time interval of each laser input (∆tinc) is sufficiently small compared to the total operation time (tT). The maximum time interval used in this study is ∆tinc = 532 × 10−6 s, which is substantially smaller than the total system operation time of 15 s, so this assumption seems reasonable.
The third assumption pertains to modification of the input laser’s shape and heat flux value. Because the rotation speed of the PC wheel is 7200 rpm, it takes only 23.1 × 10⁻⁶ s for the wheel to rotate by 1°. If this time interval is applied to the FE model as the time interval of each increment (∆tinc), 648,000 increments are required to complete 15 s, which is the total system operation time. However, this number is very large in terms of calculation in MSC.Marc for the selected element number of 22,709, so the shape of the input laser was modified from a circle to an arc to increase ∆tinc.
2.5. Numerical Convergence Test of Finite Element Model
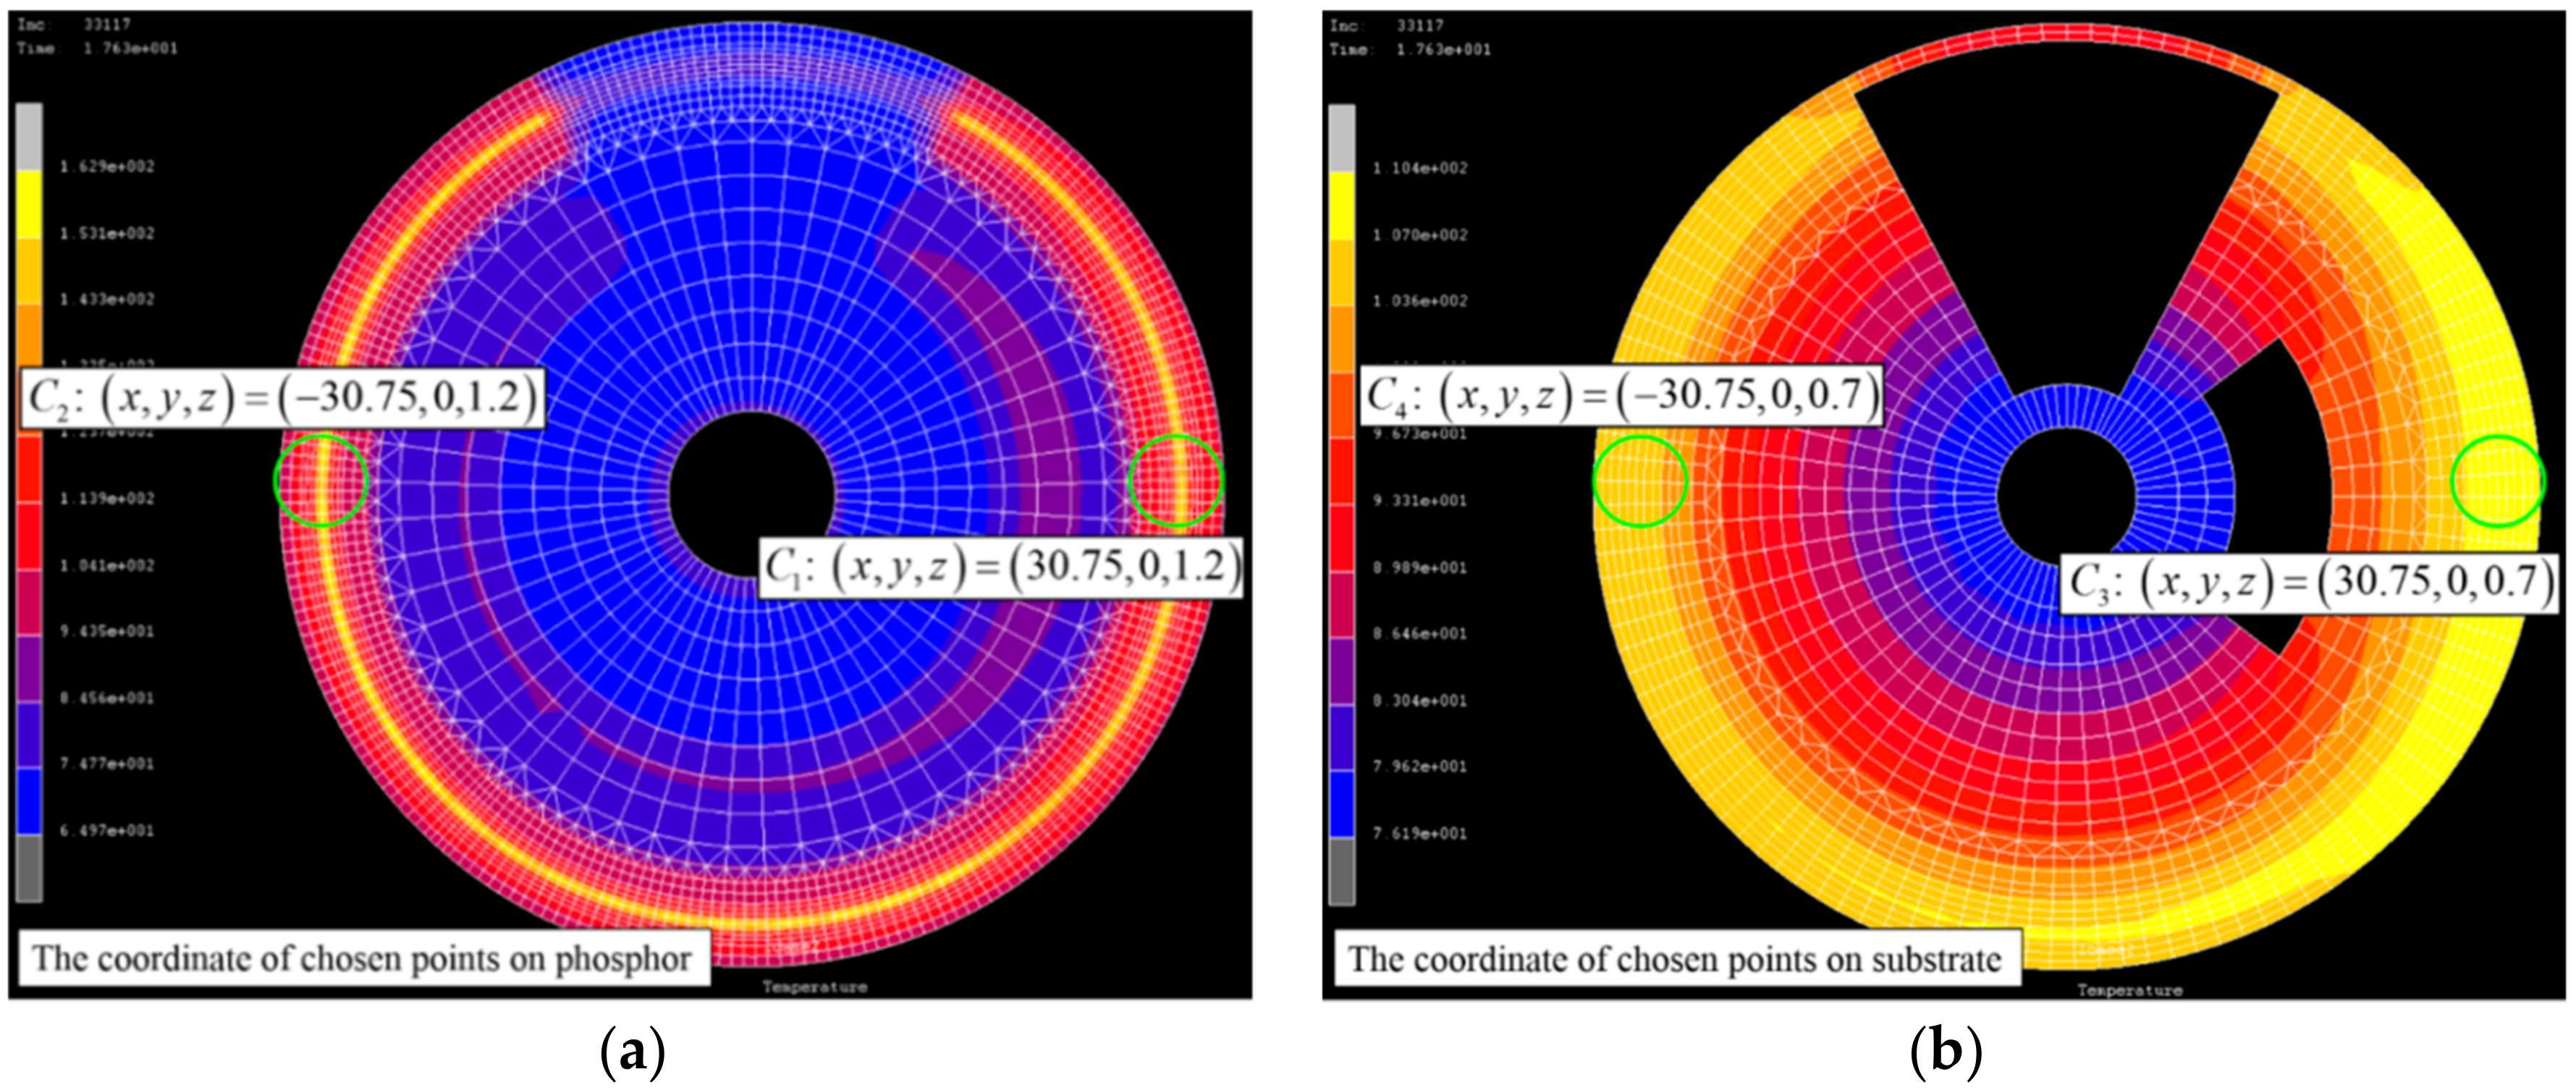
A convergence test of the FE model was performed under the following conditions: initial condition 65 °С, optical power laser input 120 W, rotation speed 7200 rpm, laser spot size Φ1 mm, and operating temperature 65 °С. Four points were selected to check for model convergence: C1 (30.75, 0, 1.2) and C2 (−30.75, 0, 1.2) on the top surface of the phosphor layer and C3 (30.75, 0, 0.7) and C4 (−30.75, 0, 0.7) on the top surface of the substrate, as shown in Figure 4. Because the temperature was a function of time, the highest values at each point within the total operation time were selected as the data to be used in the convergence test. The results show that the difference in temperature after 12,882 elements was less than 0.16%, and the difference in maximum principal stress (σ11) after 22,709 elements was less than 1.5%; these results indicate that the use of 22,709 elements is suitable for the applications in this paper.
3. Inverse Engineering Techniques and Simulation Results
3.1. Inverse Engineering Techniques
Inverse engineering techniques were employed to acquire two parameters for the FE simulation: the heat absorption coefficient of the phosphor layer and the heat convection coefficient.
3.1.1. Measurement of Heat Absorption Coefficient
The heat absorption coefficient of the phosphor (αp) is needed to determine the value of the input heat flux on the phosphor layer. To calculate the heat generated on the phosphor layer and achieve the most conservative results, it is assumed that all energy lost during the light conversion process is transformed to heat and absorbed by the phosphor layer and the substrate. Therefore, the heat generation rate will be equal to the difference in power between the input laser and the output laser. The output laser can be separated into two parts: the remaining blue laser and the converted laser. After the heat generation rate is determined, the heat absorption coefficient of the phosphor can be calculated by dividing the heat generation rate by the original input laser power.
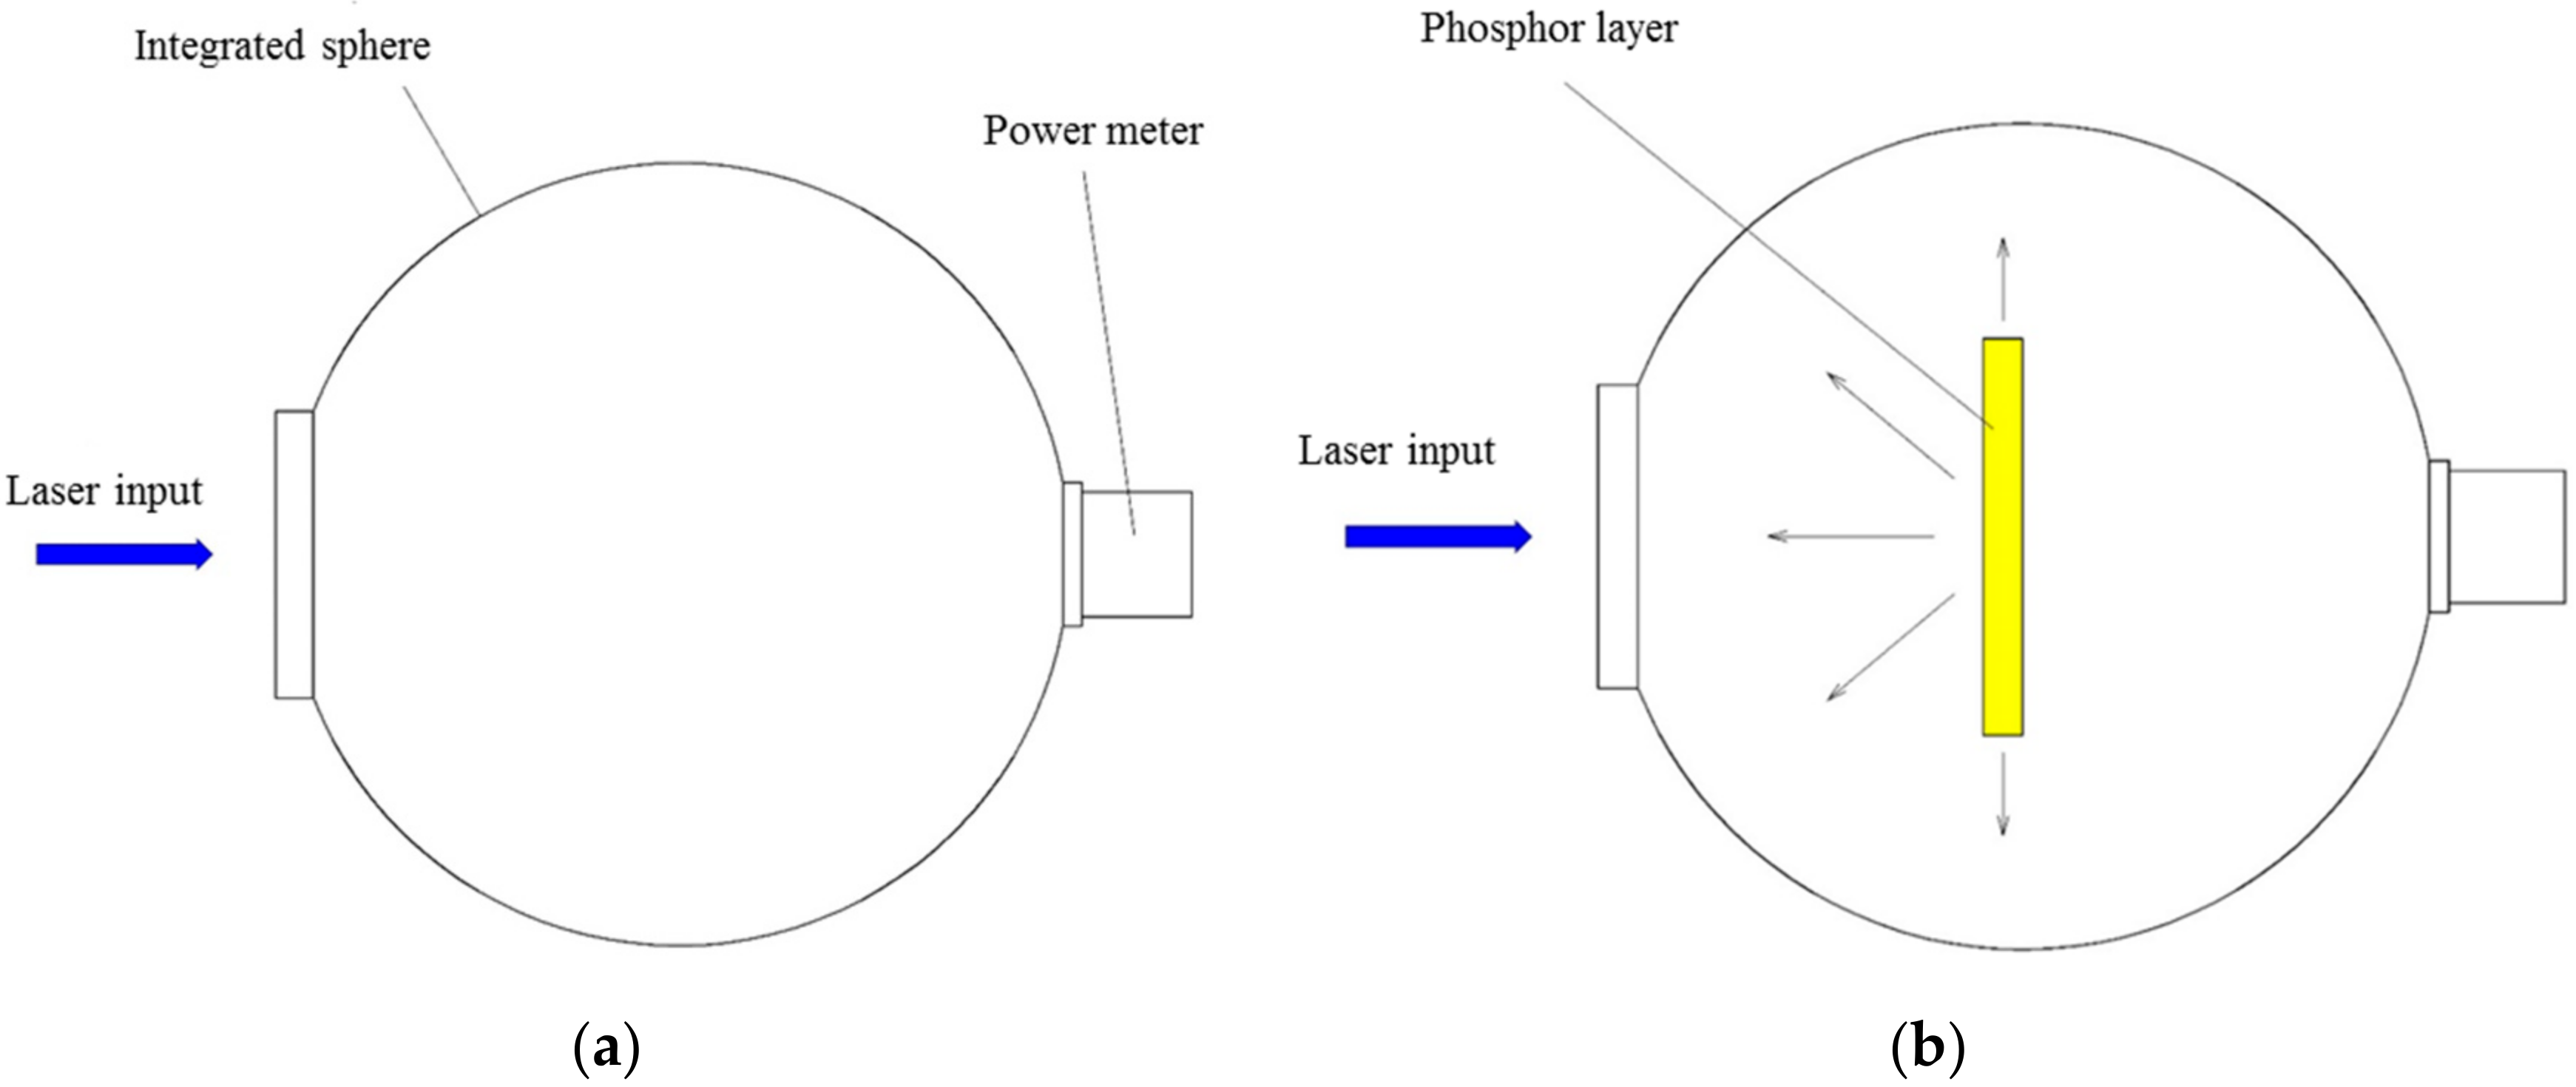
The measurement setup is shown in Figure 5. Three main components were used in this experiment: a laser source to provide constant power laser input, an integrated sphere to minimize the effect of the laser input angle, and an optical power meter. The first step of the measurement involved acquiring the optical input power of the input laser, as shown in Figure 5a; it was found to be 0.54 W. The second step involved measuring the optical power with an SP or GP wheel placed at the center of an integrating sphere, as shown in Figure 5b. The measured results are listed in Table 3. The heat absorption coefficient of the phosphor was calculated by applying Equation (1). The heat absorption coefficient of the phosphor with the yellow SP wheel was approximately 0.46 and with the GP wheel was approximately 0.41; these results are listed in Table 3 as well. To simplify the simulation and derive more conservative results, the heat absorption coefficient of the phosphor was set to 0.46 for all of the phosphor layers.
3.1.2. Modification of Finite Element Model
Because several assumptions and simplifications were made to set the boundary conditions of the FE model, the numerical results might not indicate the real behaviors of the projector system. Also, the heat convection coefficient is valid only in specific situations. As a result, the heat convection coefficient was selected as a parameter of the FE model that should be modified. To determine an appropriate heat convection coefficient for the FE model, the inverse engineering technique was employed. If the heat convection coefficient is tuned such that the temperature calculated using the applied FE model matches the temperature measured in real circumstances, it is reasonable to use this value as a modified heat convection coefficient in the FE model. In this case, the numerical results of the FE model after this modification will be considerably closer to those obtained in real circumstances and more reliable.
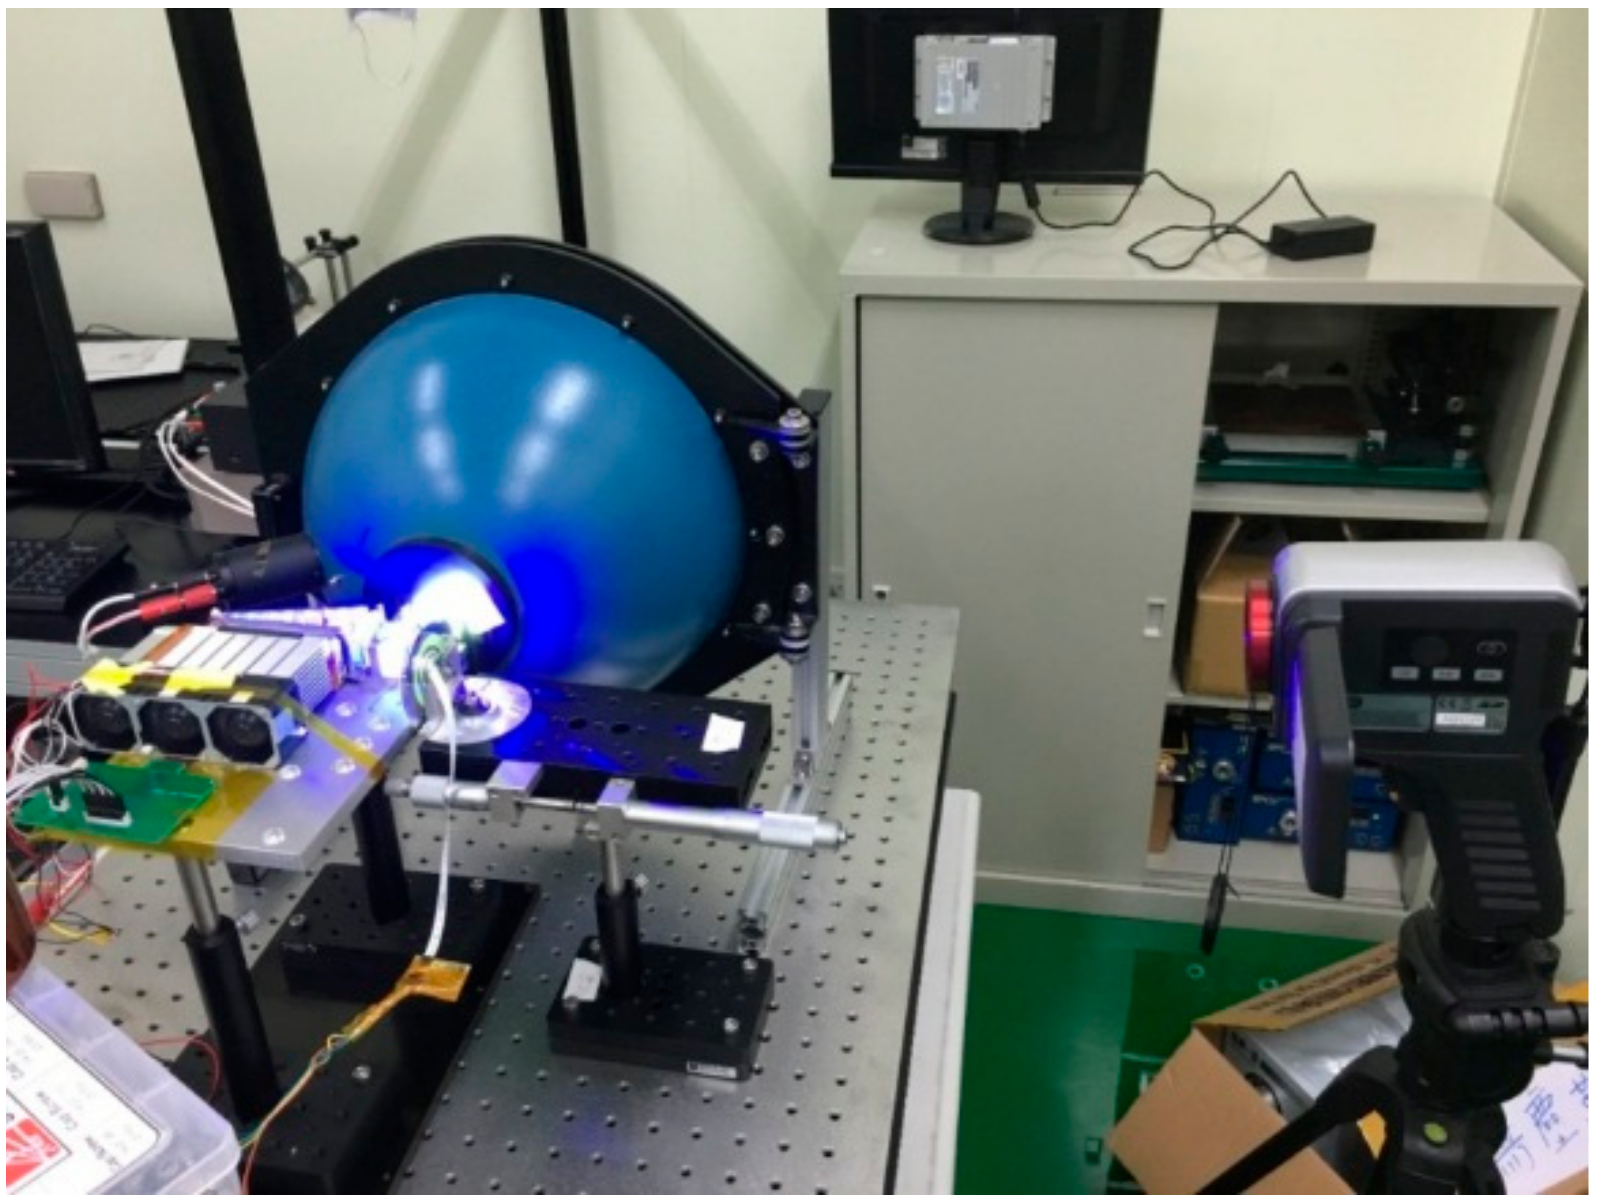
The measurement setup is shown in Figure 6. The setup contains four main components to simulate the conditions within a laser projector: an optical power laser bank of 27 W, a set of reflection lenses that collect the laser to form a circular laser spot of Φ1 mm, a GP wheel located 0.3 mm from the output lens of the reflection modulus (on the focus of the reflection modulus), and a radial thermal meter to measure the temperature of the GP wheel. This measurement setup can simulate all of the parameters of an operating projector except for operating temperature, which in this experiment was 25 °С. The measured results are shown in Figure 7 and Figure 8, and the numerical results are listed in Table 4. After interpolation, the value of the modified heat convection coefficient in this study was determined to be 158.61 W/m2·K.
3.2. Numerical Results
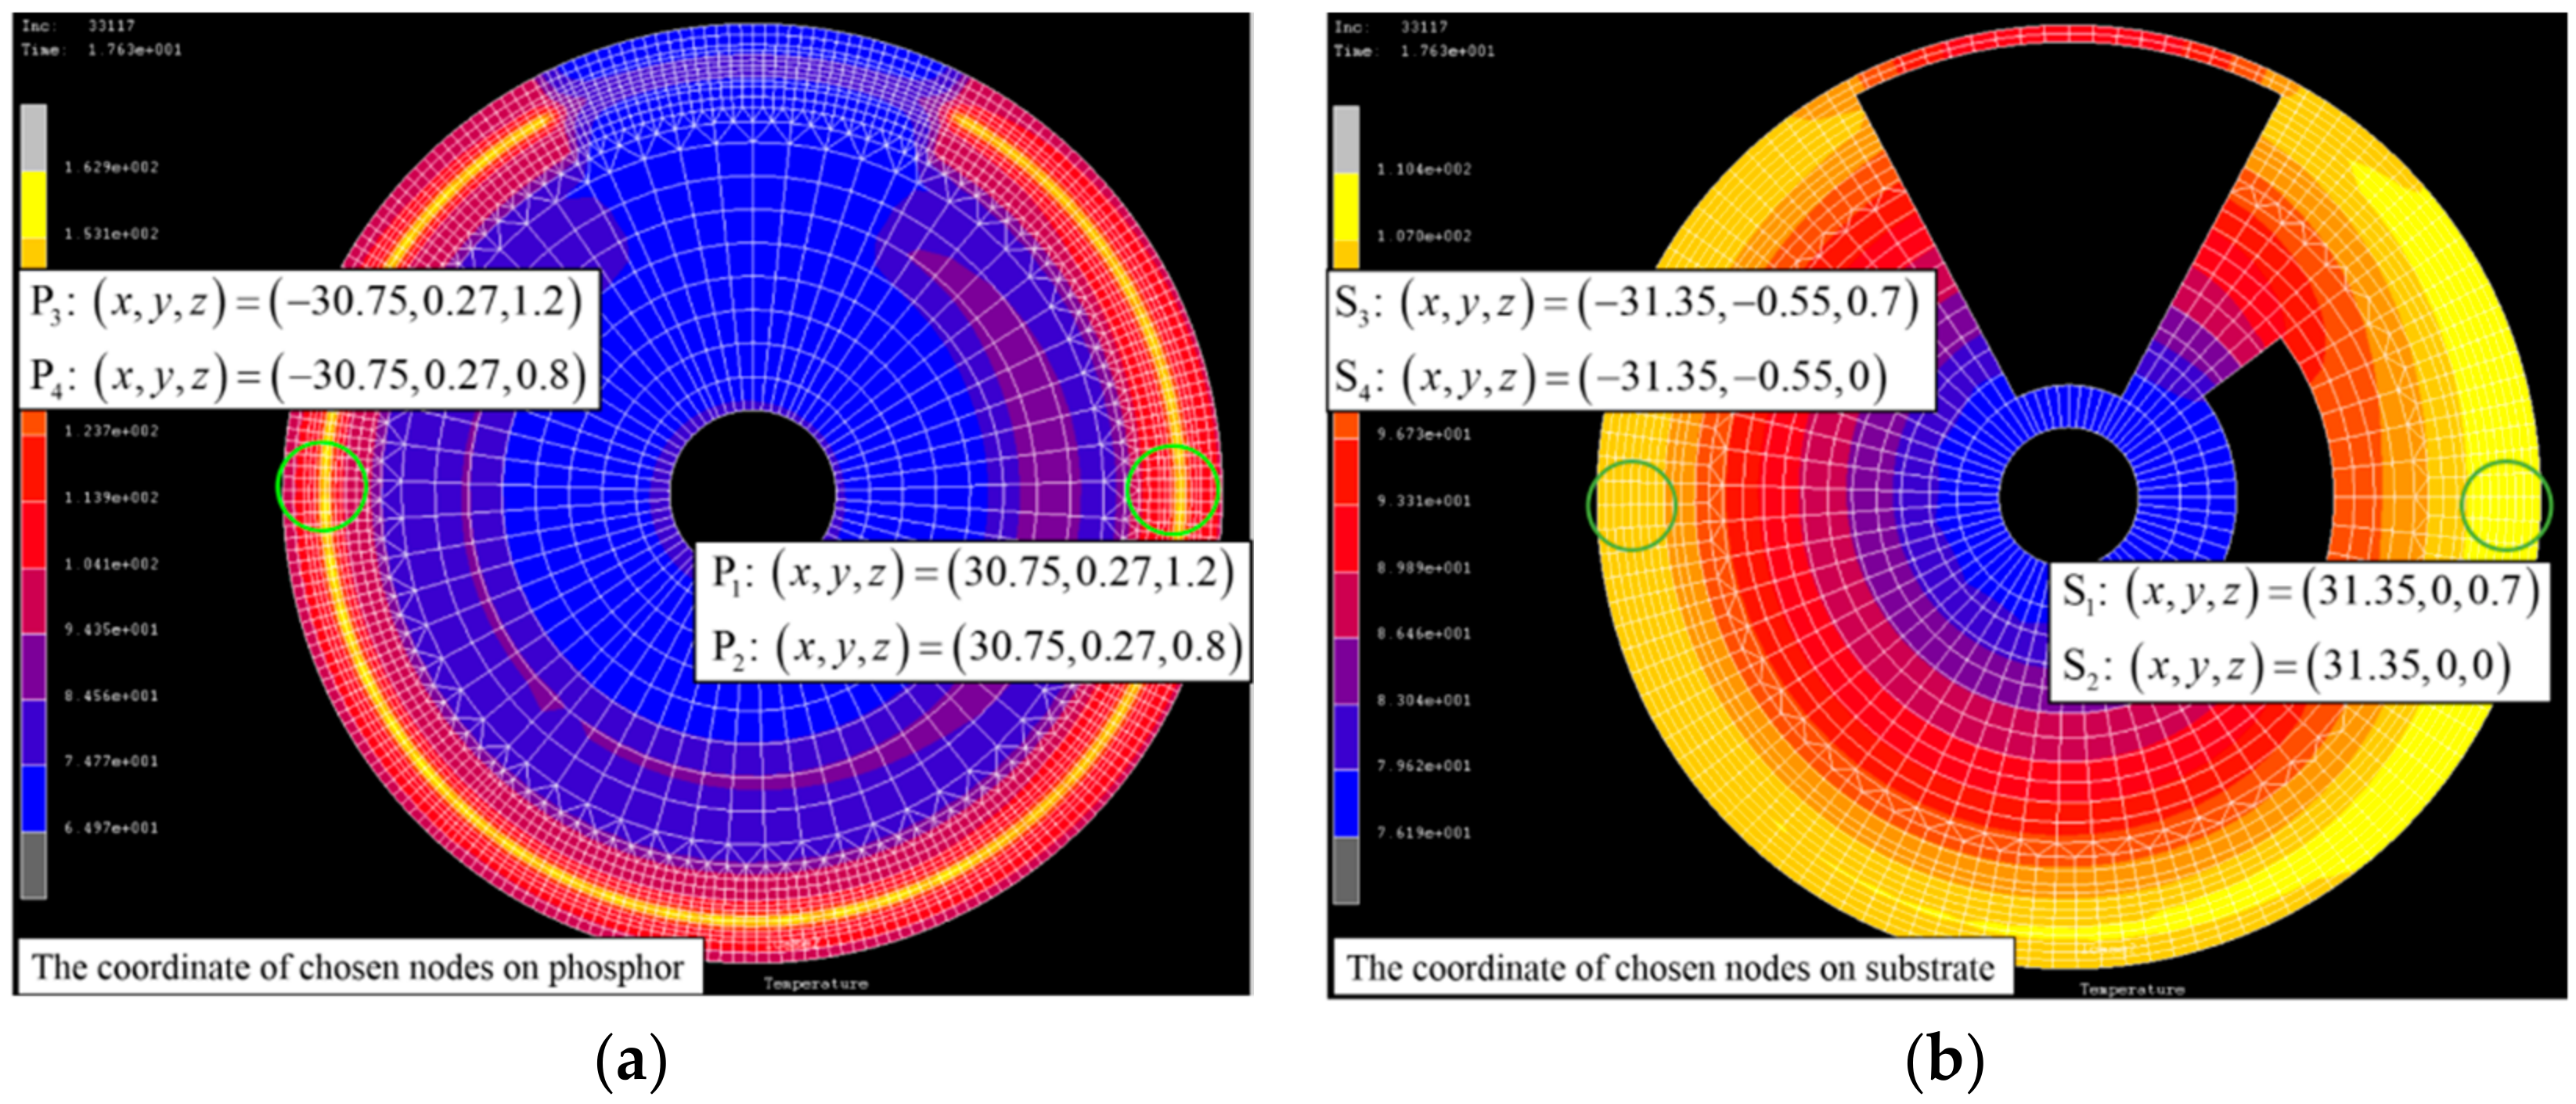
Five main parameters affect the PC wheel: laser power, laser spot size, operating temperature, heat convection coefficient, and substrate thickness. The reference values of these parameters were provided by TCO [13]. The domain of each parameter was selected to investigate the most significant effects of the GP wheel in a practical situation, as listed in Table 5. The numerical results were collected at the following selected points: P1 (30.75, 0.27, 1.2), P2 (30.75, 0.27, 0.8), P3 (−30.75, 0.27, 1.2), and P4 (−30.75, 0.27, 0.8) on the phosphor layer, and S1 (31.35, 0, 0.7), S2 (31.35, 0, 0), S3 (–31.35, –0.55, 0.7), and S4 (−31.35, −0.55, 0) on the substrate, as shown in Figure 9.
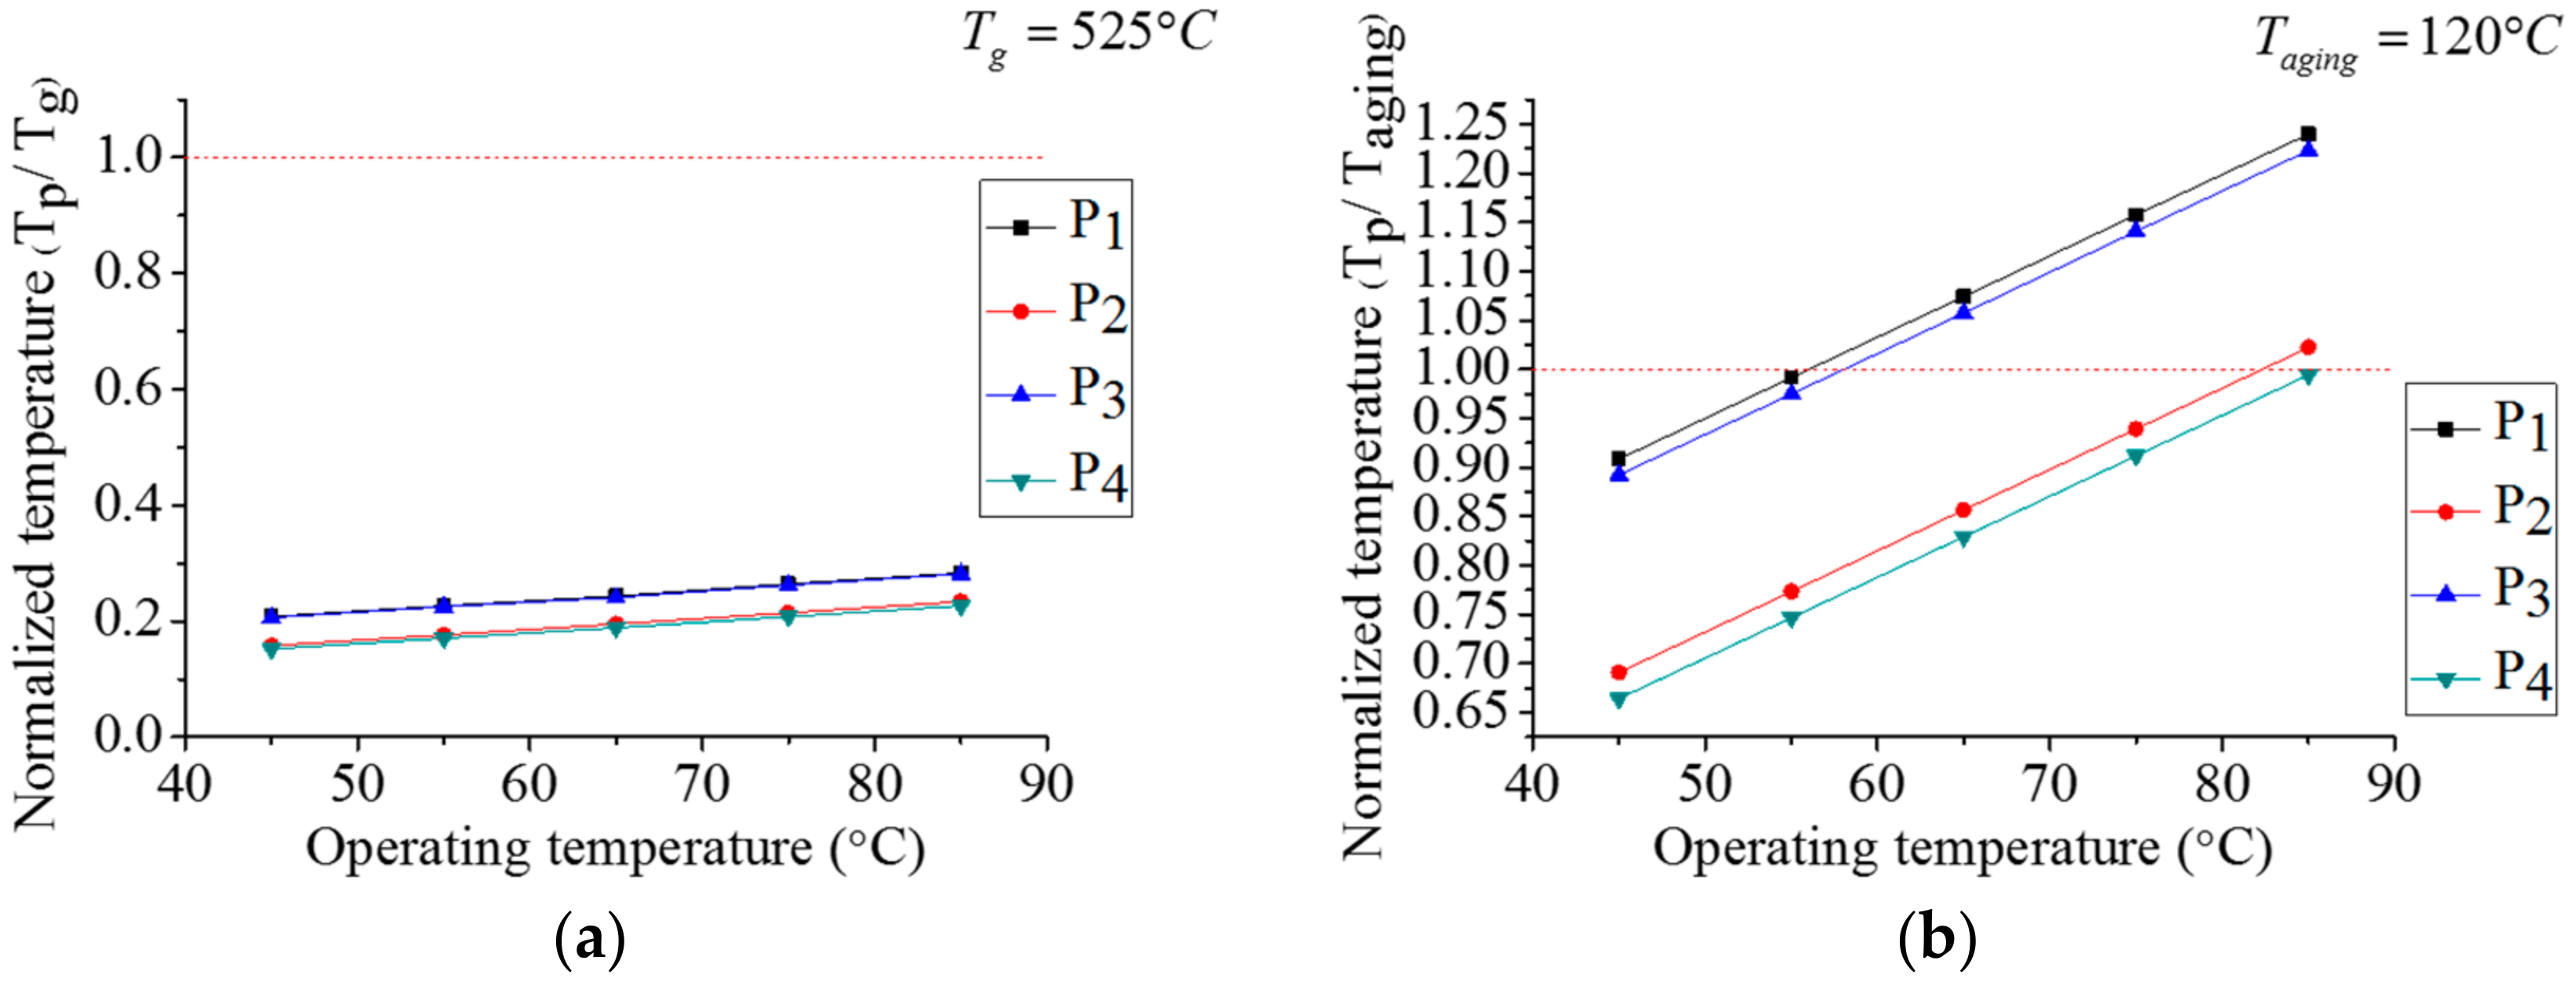
The numerical results of each parameter are shown in two figures. In the first figure, a normalized temperature (Tp/Tg or Tp/Taging) was employed for each parameter to indicate the potential for thermal failure, where Tp is the temperature on the phosphor layer at the selected position; Tg is the glass transition temperature (Tg = 525 °C) [15], which is applied to the GP wheel; and Taging is the temperature at which the aging effects of silicone are the most significant. Yuan et al. [16] proposed a Taging value of 120 °С, and this was applied to the SP wheel in this paper.
3.2.1. Thermal Analysis under Steady-State Conditions
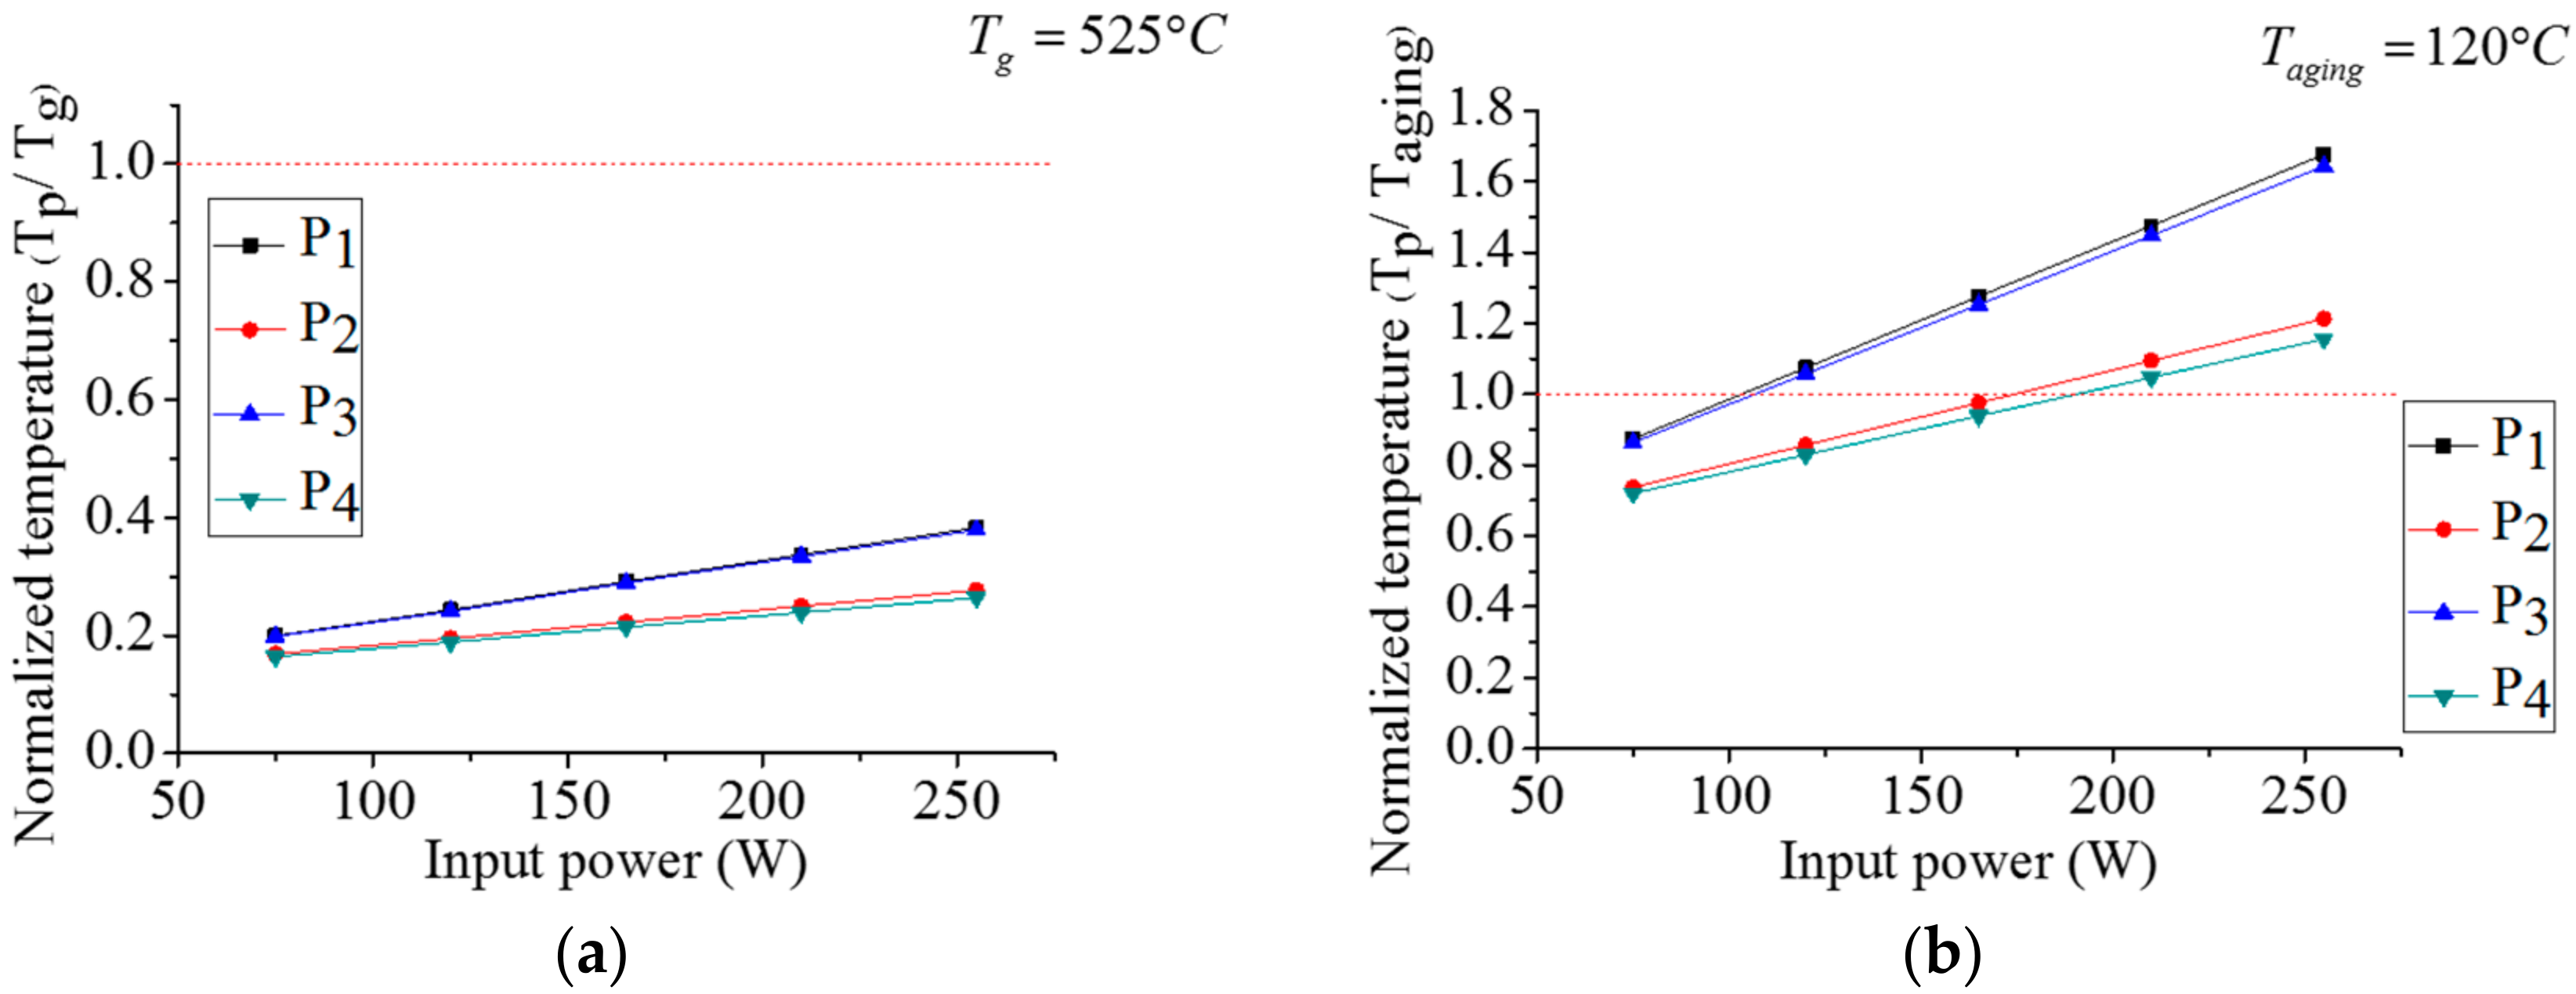
Laser Power
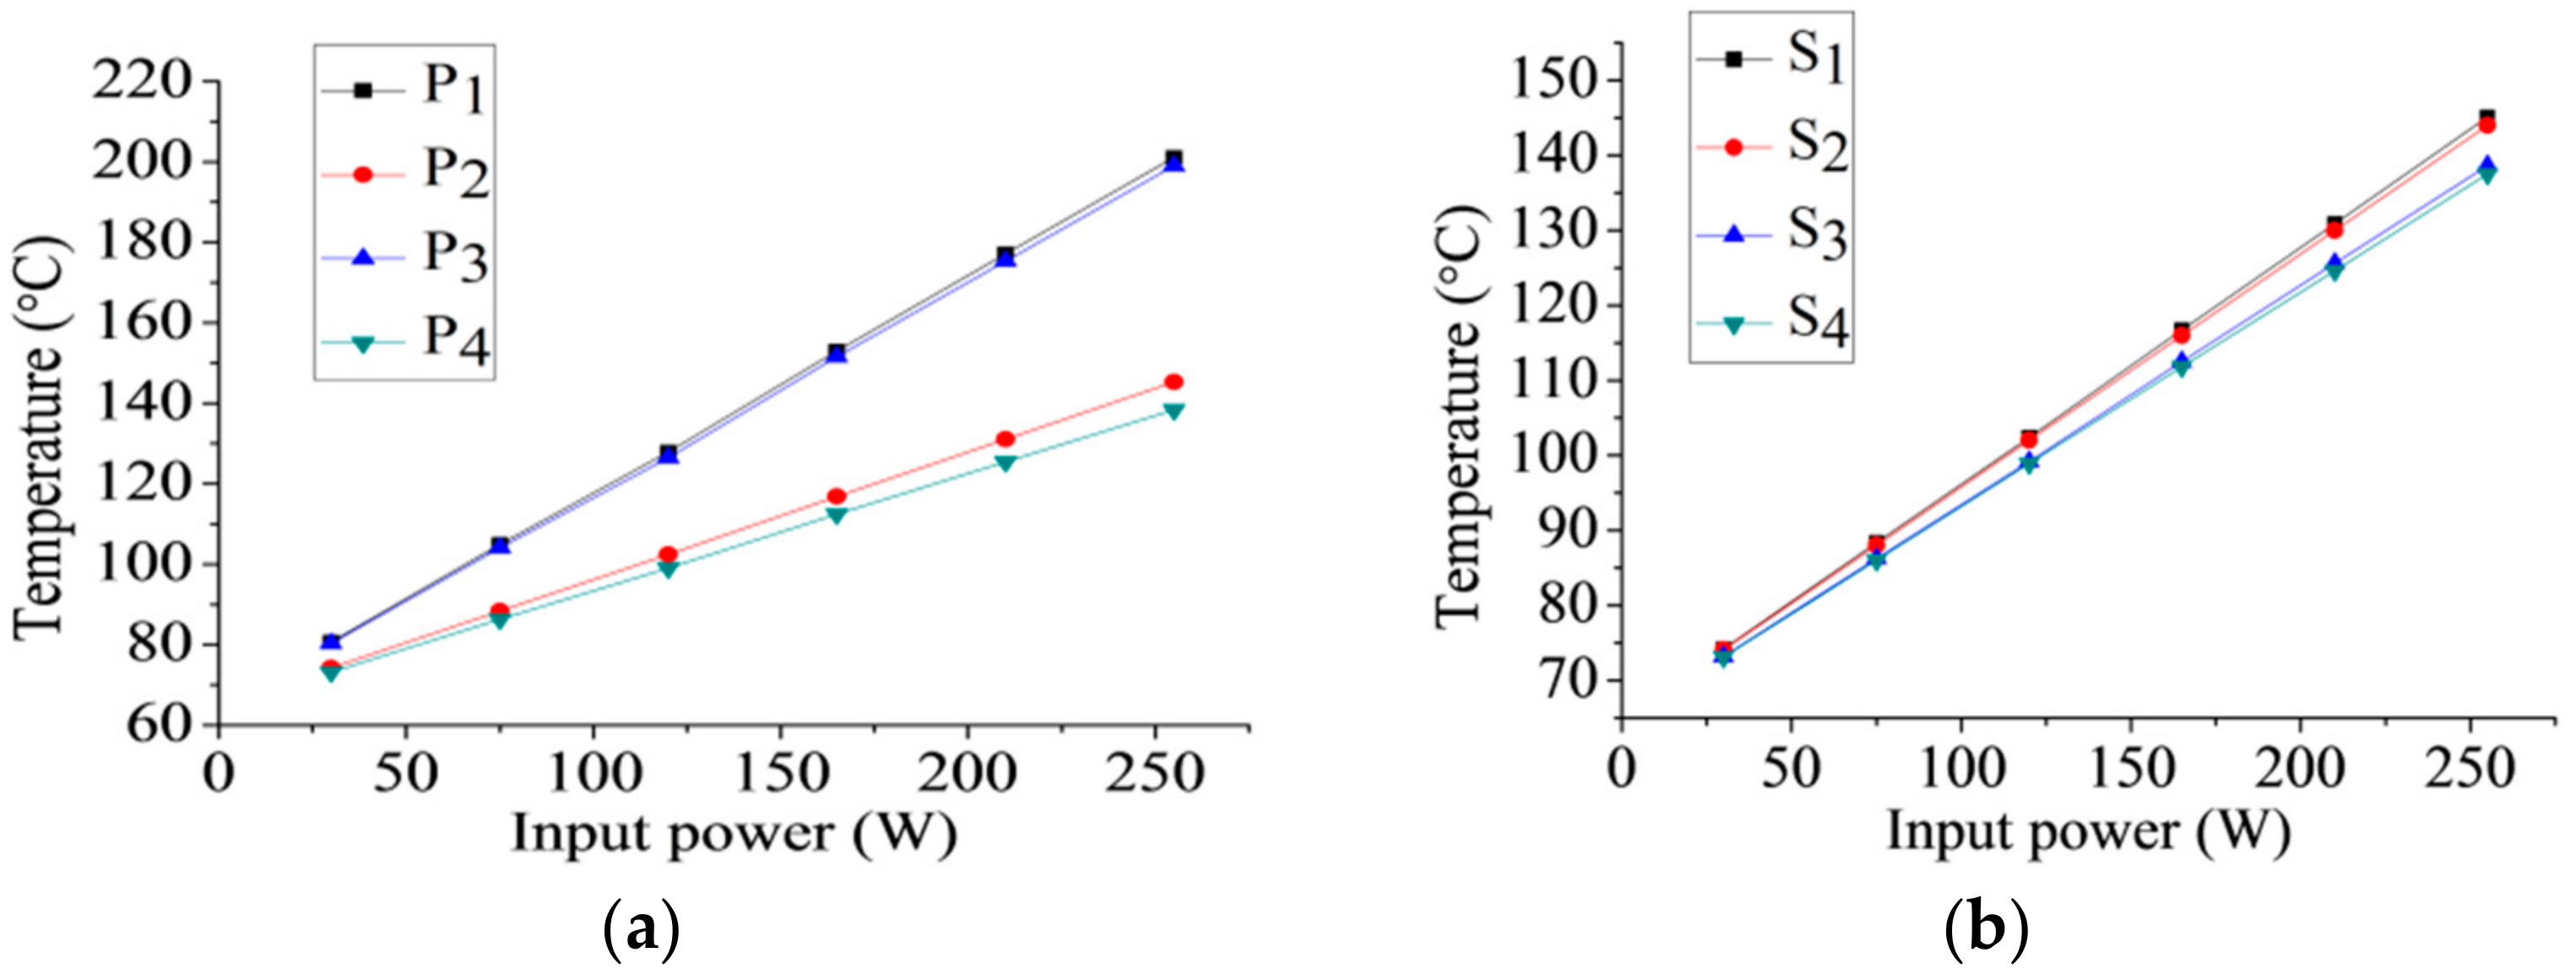
The normalized temperature of GP/SP wheels under different laser powers is shown in Figure 10. With the SP wheel, the normalized temperature on the phosphor layer was lower than unity only under a laser input power of 75 W, which indicates that thermal failure is very likely to occur on the SP wheel under high-power laser input. By contrast, the normalized temperature of the GP wheel was less than 0.4 for all values of power input, which strongly supports the assertion that the glass-based phosphor-converted layer is the more favorable choice for high-power applications. Figure 11 shows that the temperature of the phosphor layer and the substrate are almost linearly dependent on the input laser power, and the effects of power input are more significant on both the phosphor layer and the substrate than the other parameters. As the laser power input increases from 75 to 255 W, the temperature of P1 rises from 104.9 to 201.1 °С and the temperature of S1 rises from 88.4 °С to 145.1 °С.
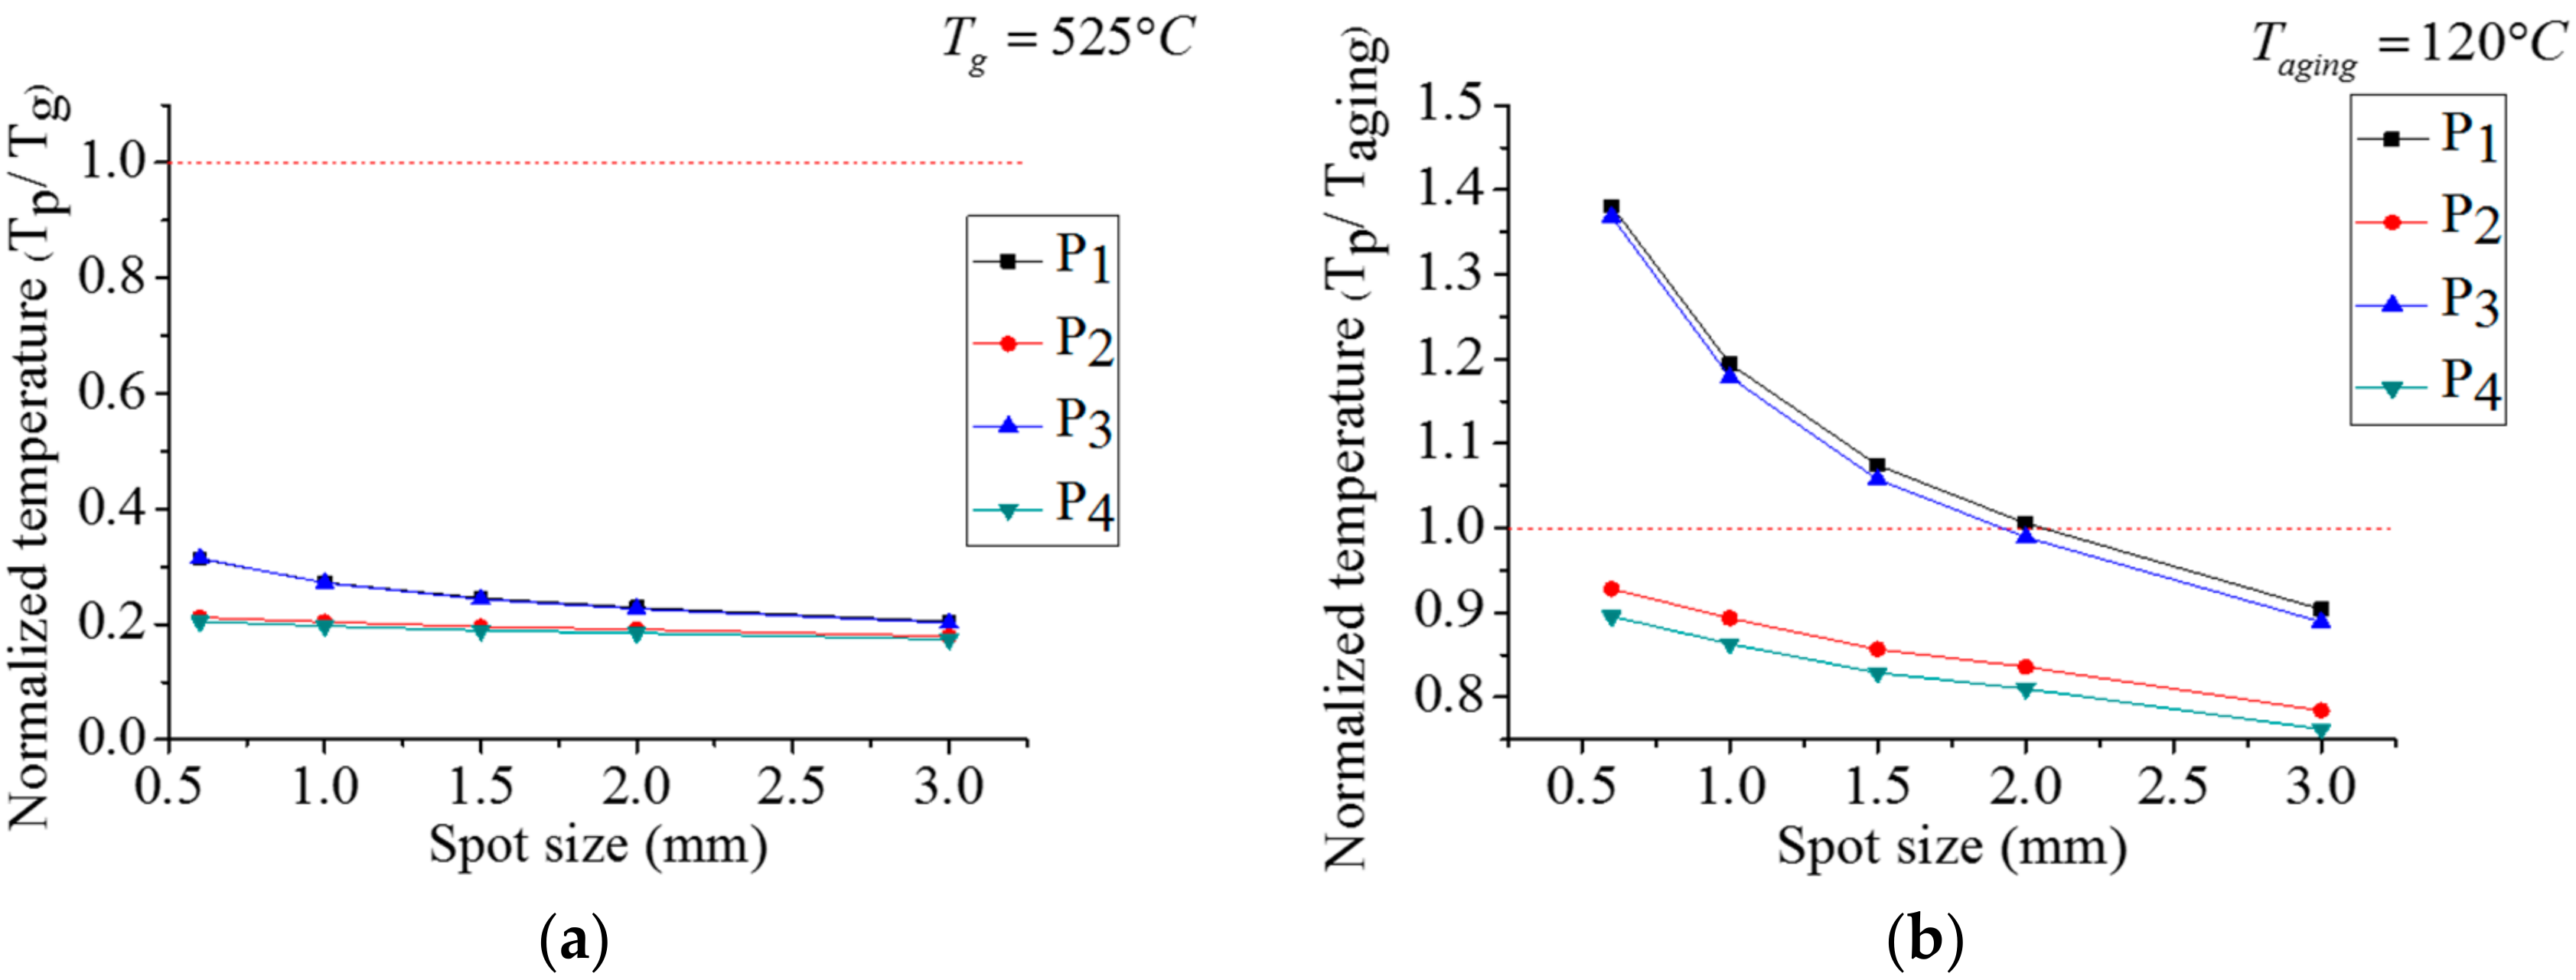
Laser Spot
Figure 12 presents the normalized temperature of the GP/SP wheels for different laser spot sizes. The normalized temperature on the phosphor layer of the SP wheel was less than unity only when the diameter of the laser spot was Φ3 mm, which means that when spot size is within this range, the SP wheel might experience thermal failure. In contrast, the GP wheel avoided thermal failure with all the laser spot sizes considered in this investigation.
Operating Temperature
The normalized temperature results of the GP/SP wheels under different operating temperatures are presented in Figure 13. The normalized temperature on the phosphor layer of the SP wheel was less than unity only when the operating temperature was 45 °С. Even then, the normalized temperature was approximately 0.9; in other words, very close to unity. It is reasonable to believe that the SP wheel might experience thermal failure under most of the operating temperatures within this range. However, the GP wheel remained intact under all operating temperatures applied in these investigations.
Heat Convection Coefficient
Figure 14 illustrates the results for the normalized temperature of the GP/SP wheels for different heat convection coefficients. The normalized temperature on the phosphor layer of the SP wheel for all selected heat convection coefficients was greater than unity, meaning the SP wheel cannot be used with the heat convection coefficients used in this study. However, the GP wheel remained intact for all heat convection coefficients, and its maximum normalized temperature was only about 0.35 within this range.
Substrate Thickness
Figure 15 presents the normalized temperature results of the GP/SP wheels for different substrate thicknesses. The normalized temperature on the phosphor layer of the SP wheel for all substrate thicknesses was greater than unity, indicating that the SP wheel cannot be employed under these conditions. In contrast, the GP wheel yielded favorable results for all substrate thickness values, and its maximum normalized temperature was only approximately 0.33 within this range.
3.2.2. Stress Analysis under Steady-State Conditions
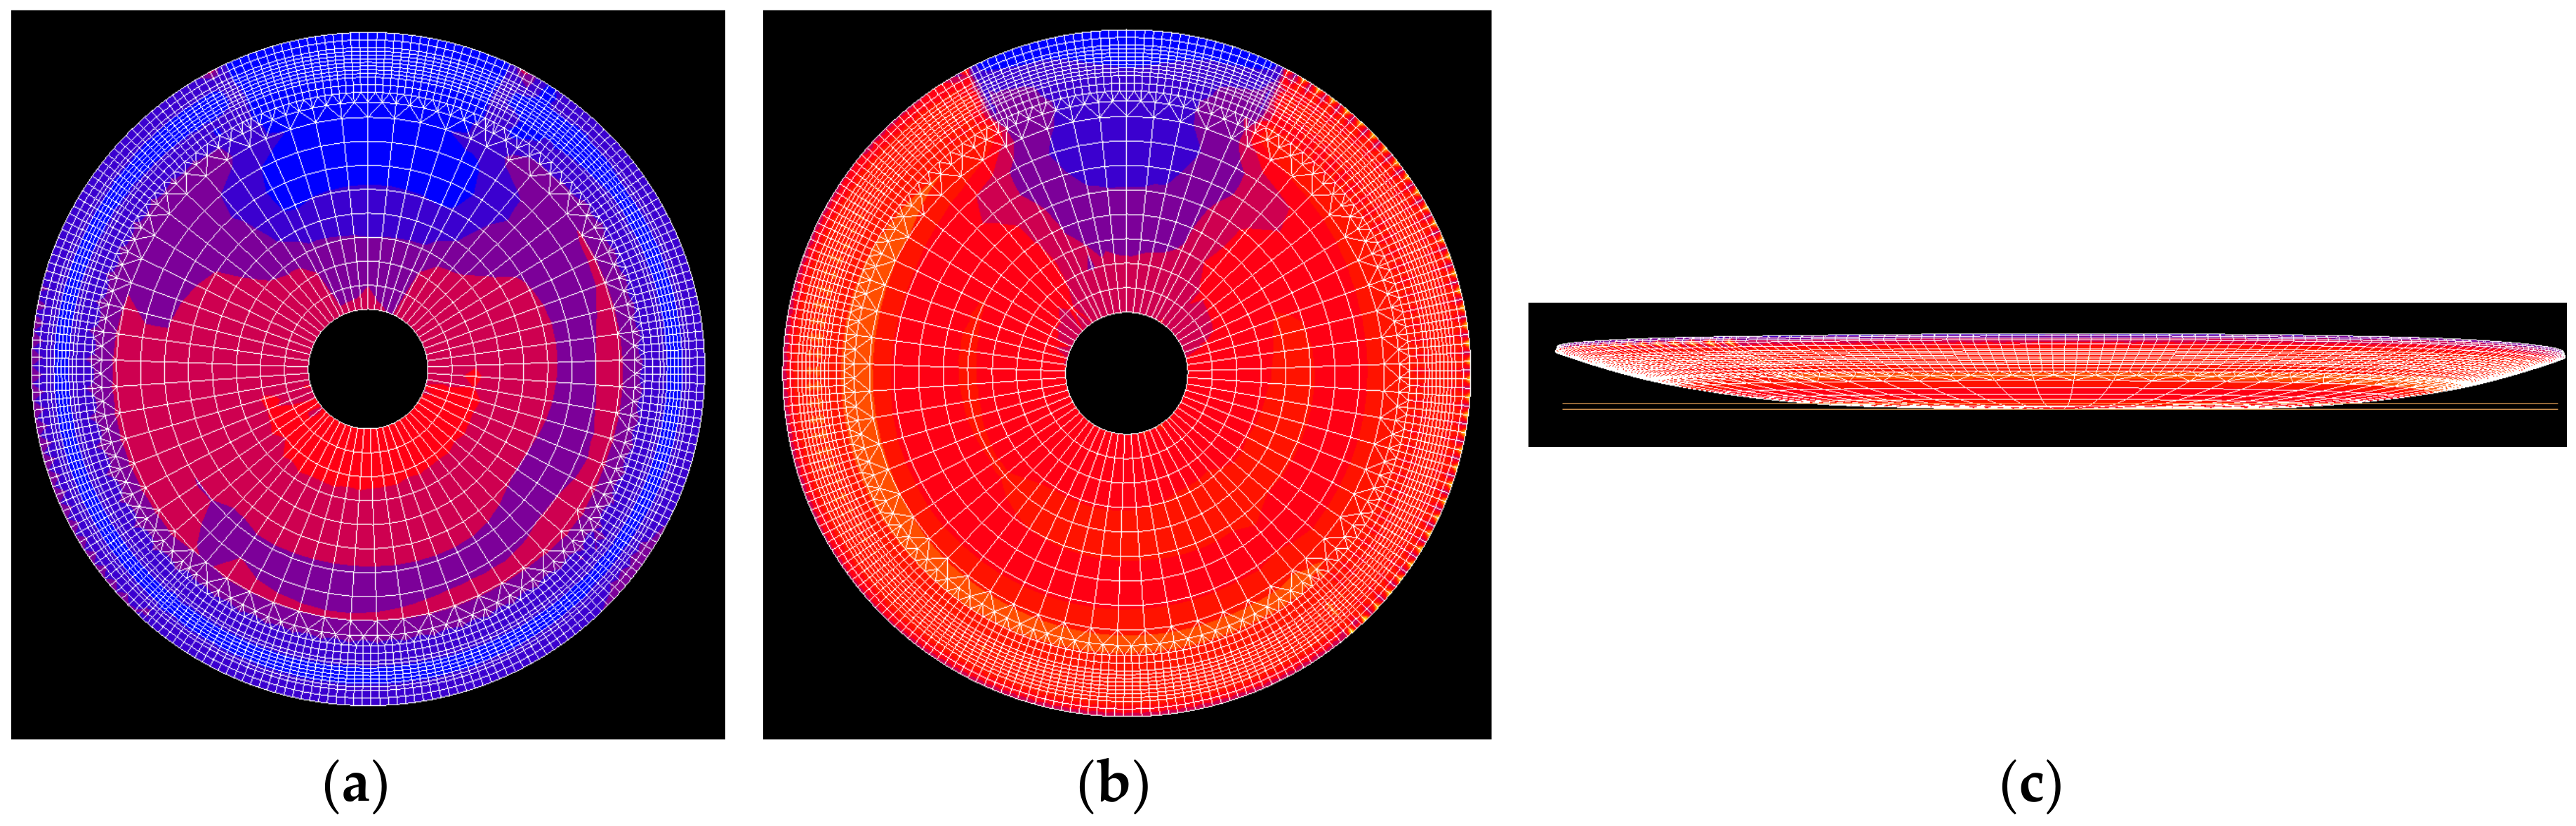
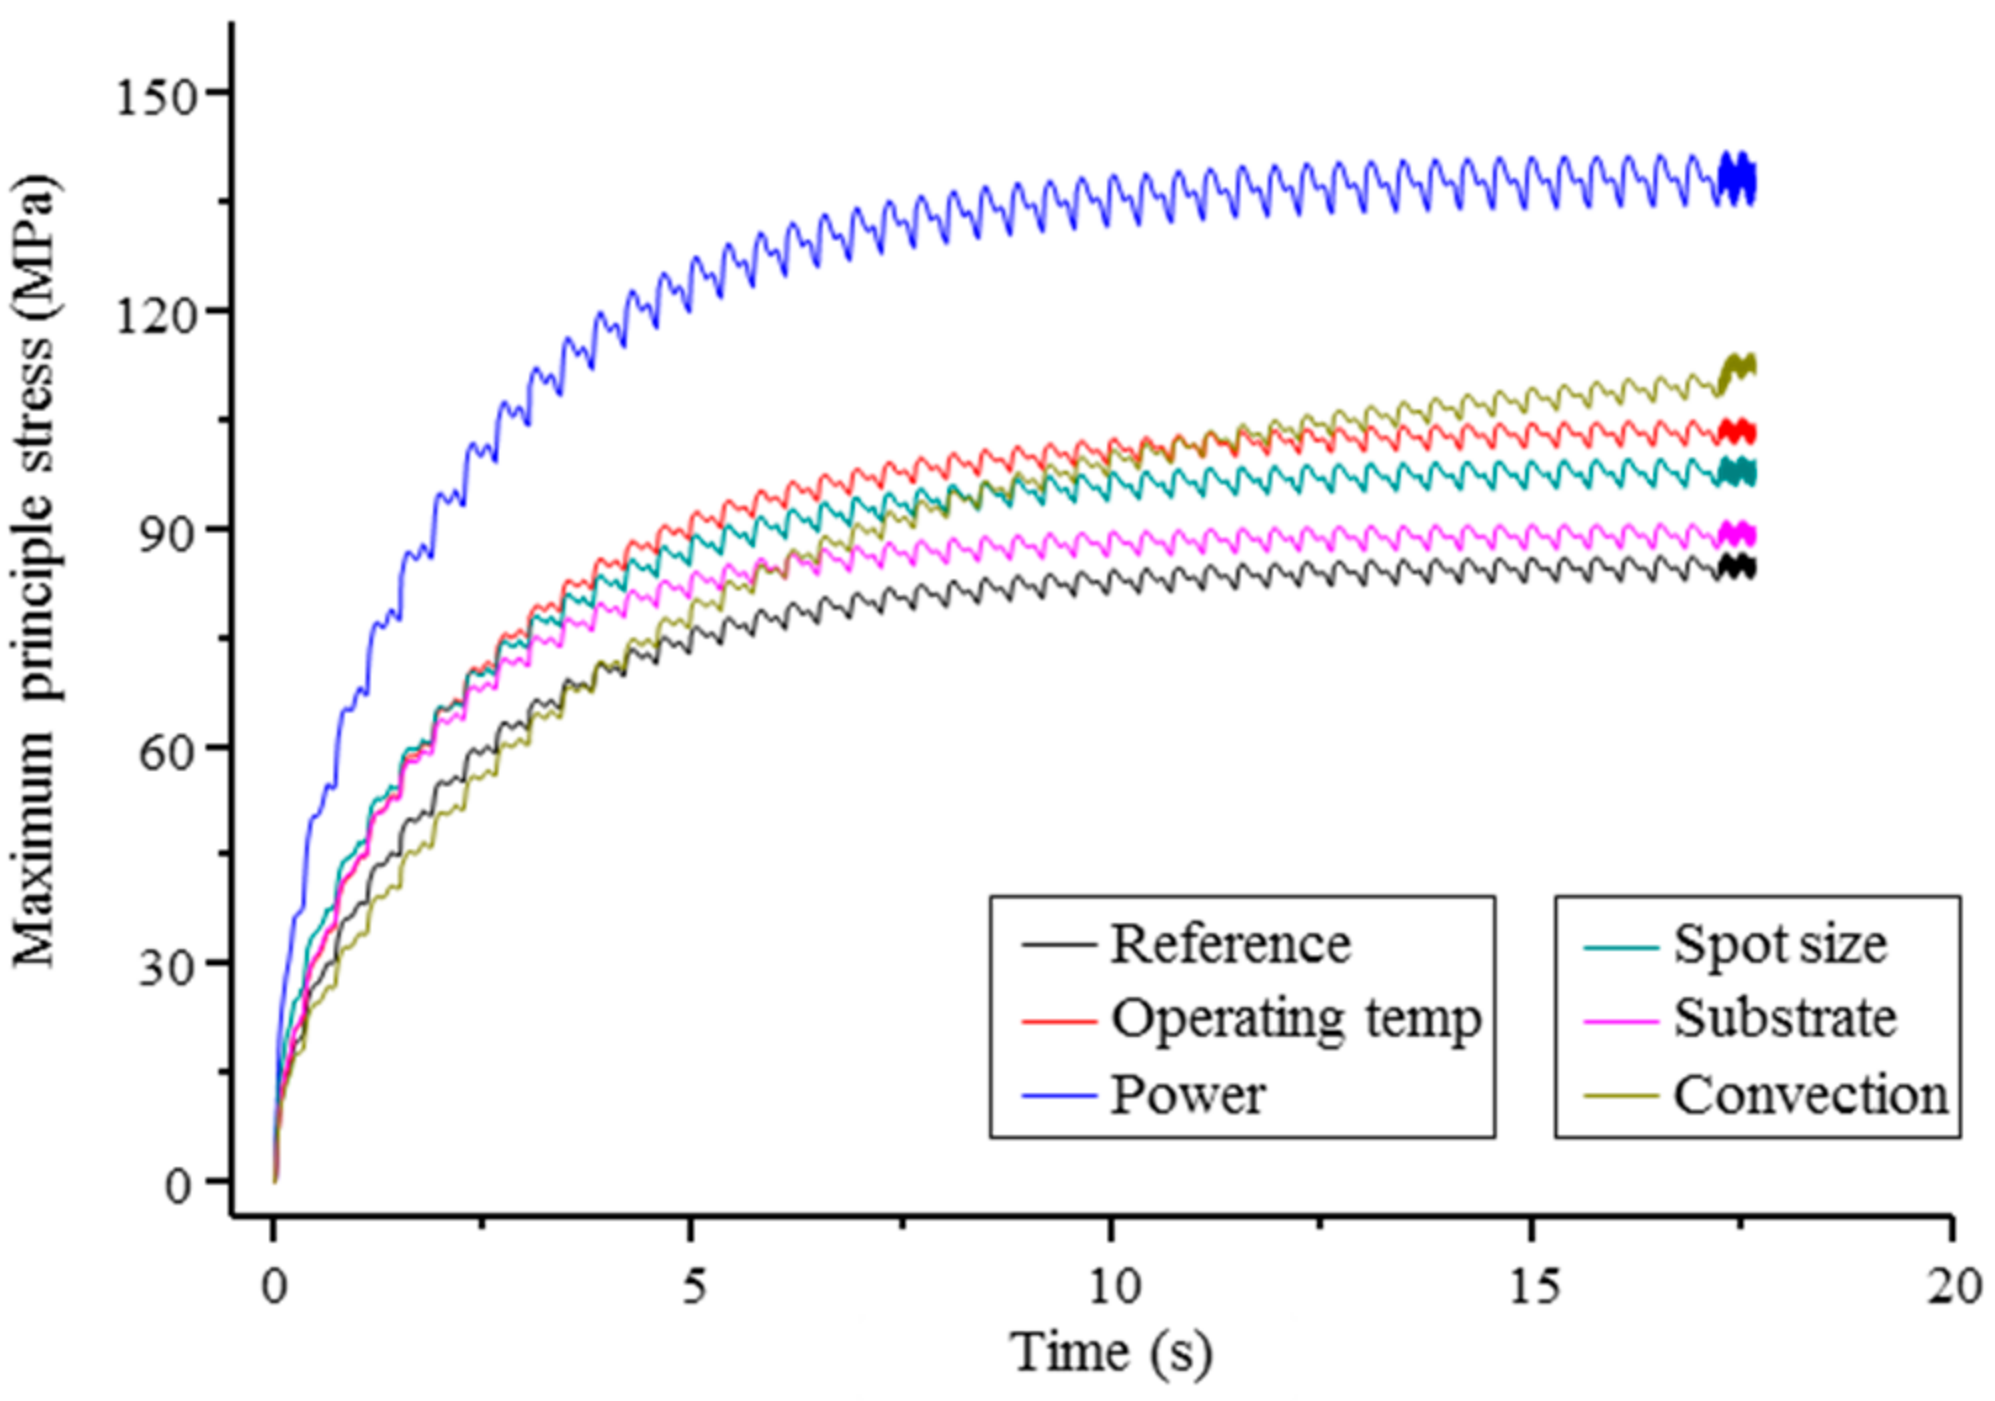
The deformation of the phosphor layer with the reference parameters (see Table 5) is shown in Figure 16. The red region is the area under tensile load and the blue area is the region under compression load. Figure 16 makes clear that the top surface of the phosphor layer is compressed and the bottom surface is stretched. Note that the major principal stress σ11 is considered for stress analysis in the radial direction for tensile and compressive stress distribution. Since the compressive resistance of glass is much higher than its tensile resistance, the focus of this section is on the bottom surface of the phosphor layer. P2 (30.75, 0.27, 0.8) was selected as the point for extracting information about stress values. The major principle stress (σ11) with respect to the operating time under the parameters in Table 5 is shown in Figure 17. The maximum and minimum values of the major stress (σ11) under steady-state conditions are important factors affecting the failure of the phosphor layer. Therefore, this section looks at the maximum and minimum values of the major stress (σ11) under different parameters. The values for the last 720 increments are listed in Table 6 and show that the parameters affecting the major stress values most significantly are the laser input power and the heat convection coefficient. The maximum major stress (σ11,max) rises from 86.7 to 142 MPa as the laser input power increases from 120 to 255 W, and rises from 86.7 to 115 MPa as the heat convection coefficient decreases from 160 to 75 W/m2·K. The tensile stress of glass is about 80–120 MPa. The debonding phenomenon between phosphor and glass can be discussed by the major principal stress analysis for tensile and compressive stress. According to these values, failure due to major stress is very likely to occur even within the reference parameters. To avoid failure without decreasing the projector’s power, the suggested parameters are: laser power 120 W, laser spot size Φ3 mm, operating temperature 45 °С, heat convection coefficient 225 W/m2·K, and substrate thickness 1 mm.
4. Conclusions
In this paper, the inverse engineering technique was applied to determine heat absorption coefficients and modify an FE model of color wheels. The adjusted FE model was employed to investigate the thermal effects of a phosphor-converted color wheel under different parameters and geometries. The numerical simulation results indicate that the proposed arc-shaped moving heat flux model proposed is feasible based on spot thermal and stress analyses. The effects on the maximum/minimum values of major principal stress (σ11) were investigated on a glass-based phosphor layer under laser power 255 W, laser spot size 0.6 mm, operating temperature 85 °С, heat convection coefficient 255 W/m2·K, and substrate thickness 0.5 mm. Stress analysis of each parameter’s riskiest value was performed. The results indicate that a glass-based phosphor-converted color wheel has higher thermal resistance than a silicone-based phosphor-converted color wheel under the same conditions. In the future, we will examine the thermal and structural properties of the glass-/silicone-based phosphor layer using particle experiments to obtain more accurate results that will help manufacturers better understand the failures of different glass types. The results will also be extended to analyze the behaviors of a transparent phosphor-converted color wheel, since it will generate less heat than a reflective phosphor wheel because the laser will follow a different path.
Author Contributions
C.-M.H. and A.-D.L. conceived and designed the simulations and experiments; C.-L.K. and H.-E.S. performed the simulations and experiments; C.-Y.C. wrote and edited the paper.
Funding
This research was funded by the Ministry of Science and Technology, Taiwan (106-2221-E-151-017 and 106-2622-E-110-009-CC2).
Conflicts of Interest
The authors declare no conflict of interest. The founding sponsors had no role in the design of the study; in the collection, analyses, or interpretation of data; in the writing of the manuscript, and in the decision to publish the results.
References
- Chewpraditkul, W.; Swiderski, L.; Moszynski, M.; Szczesniak, T.; Syntfeld-Kazuch, A.; Wanarak, C.; Limsuwan, P. Scintillation properties of LuAG: Ce, YAG: Ce and LYSO: Ce crystals for gamma-ray detection. IEEE Trans. Nucl. Sci. 2009, 56, 3800–3805. [Google Scholar] [CrossRef]
- Comanzo, H.A. Aluminum Fluoride Flux Synthesis Method for Producing Cerium Doped YAG. U.S. Patent 6,409,938 B1, 25 June 2002. [Google Scholar]
- Barton, D.L. Degradation of blue AlGaN/InGaN/GaN LEDs subjected to high current pulses. In Proceedings of the 33rd Annual Proceedings of Reliability Physics Symposium, Las Vegas, NV, USA, 4–6 April 1995; pp. 191–199. [Google Scholar]
- Fu, H.-K.; Ying, S.-P.; Chen, T.-T.; Hsieh, H.-H.; Yang, Y.-C. Accelerated life testing and fault analysis of high-power LED. IEEE Trans. Electron Devices 2018, 65, 1036–1042. [Google Scholar] [CrossRef]
- McIntosh, K.R.; Cotsell, J.N.; Cumpston, J.S.; Norris, A.W.; Powell, N.E.; Ketola, B.M. The Effect of Accelerated Aging Tests on the Optical Properties of Silicone and EVA Encapsulants; Dow Corning Corporation: Midland, MI, USA, 2009. [Google Scholar]
- Tsai, C.-C.; Chen, M.-H.; Huang, Y.-C.; Hsu, Y.-C.; Lo, Y.-T.; Lin, Y.-J.; Kuamg, J.-H.; Huang, S.-B.; Hu, H.-L.; Su, Y.-I.; et al. Decay mechanisms of radiation pattern and optical spectrum of high-power LED modules in aging test. IEEE J. Sel. Top. Quantum Electron. 2009, 15, 1156–1162. [Google Scholar] [CrossRef]
- Wang, J.; Tsai, C.-C.; Cheng, W.-C.; Chen, M.-H.; Chung, C.-H.; Cheng, W.-H. High thermal stability of phosphor-converted white light-emitting diodes employing Ce: YAG-doped glass. IEEE J. Sel. Top. Quantum Electron. 2011, 17, 741–746. [Google Scholar] [CrossRef]
- Pareek, R.; Kumbhare, M.N.; Joshi, A.V.; Banerjee, A.; Gupta, P. Optimization of single-layer sol-gel antireflection coatings on potassium dihydrogen phosphate crystals in quadrature geometry for second-harmonic conversion of high-power Nd: Glass lasers. Opt. Eng. 2010, 49, 091010. [Google Scholar] [CrossRef]
- Chang, J.K.; Cheng, W.C.; Chang, Y.P.; Kuo, Y.Y.; Tsai, C.C.; Huang, Y.C.; Chen, L.Y.; Cheng, W.H. Next-generation glass-base phosphor-converted laser light engine. In Proceedings of the Fourteenth International Conference on Solid State Lighting and LED-Based Illumination Systems, San Diego, CA, USA, 8 September 2015. [Google Scholar]
- Cheng, W.H.; Tsai, C.C.; Wang, J. Lumen degradation and chromaticity shift in glass and silicone based high-power phosphor-converted white-emitting diodes under thermal tests. In Proceedings of the 11th International Conference on Solid State Lighting, San Diego, CA, USA, 21–25 August 2011. [Google Scholar]
- Tsai, C.-C. Thermal aging performance analysis of high color rendering index of glass-based phosphor-converted white-light-emitting diode. IEEE Trans. Device Mater. Reliab. 2015, 15, 617–620. [Google Scholar] [CrossRef]
- El-Daher, M.S. Finite element analysis of thermal effects in diode end-pumped solid-state lasers. Adv. Opt. Technol. 2017, 2017, 9256053. [Google Scholar] [CrossRef]
- Taiwan Color Optics, Inc. Homepage. Available online: http://taiwan-color-optics-inc.webnode.tw (accessed on 14 May 2018).
- Lee, H.; Nenille, K. Handbook of Epoxy Resins; McGraw-Hill: Taipei, Taiwan, 1984. [Google Scholar]
- The Material Properties of Transparent Glass. SCHOTT AG. Available online: https://www.us.schott.com (accessed on 14 May 2018).
- Yuan, F.; Pan, K.; Guo, Y.; Chen, S. Study on thermal degradation of high power LEDs during high temperature and electrical aging. In Proceedings of the 10th China International Forum on Solid State Lighting (ChinaSSL), Beijing, China, 10–12 November 2013. [Google Scholar] [CrossRef]
Figure 1.
Structure of the phosphor-converted color wheel (PC wheel).

Figure 2.
Schematic diagram of heat generation within the phosphor layer and substrate: (a) first part, (b) second part, and (c) third part of generated heat.
Figure 2.
Schematic diagram of heat generation within the phosphor layer and substrate: (a) first part, (b) second part, and (c) third part of generated heat.

Figure 3.
Developed finite element model of the PC wheel: (a) front view and (b) side view.

Figure 4.
Demonstration of selected points in convergence test: (a) on phosphor layer and (b) on substrate.
Figure 4.
Demonstration of selected points in convergence test: (a) on phosphor layer and (b) on substrate.

Figure 5.
Measurement setup for heat absorption coefficient of phosphor: measurement of (a) optical laser power and (b) converted laser power.
Figure 5.
Measurement setup for heat absorption coefficient of phosphor: measurement of (a) optical laser power and (b) converted laser power.

Figure 6.
Measurement setup for modified heat coefficient.

Figure 7.
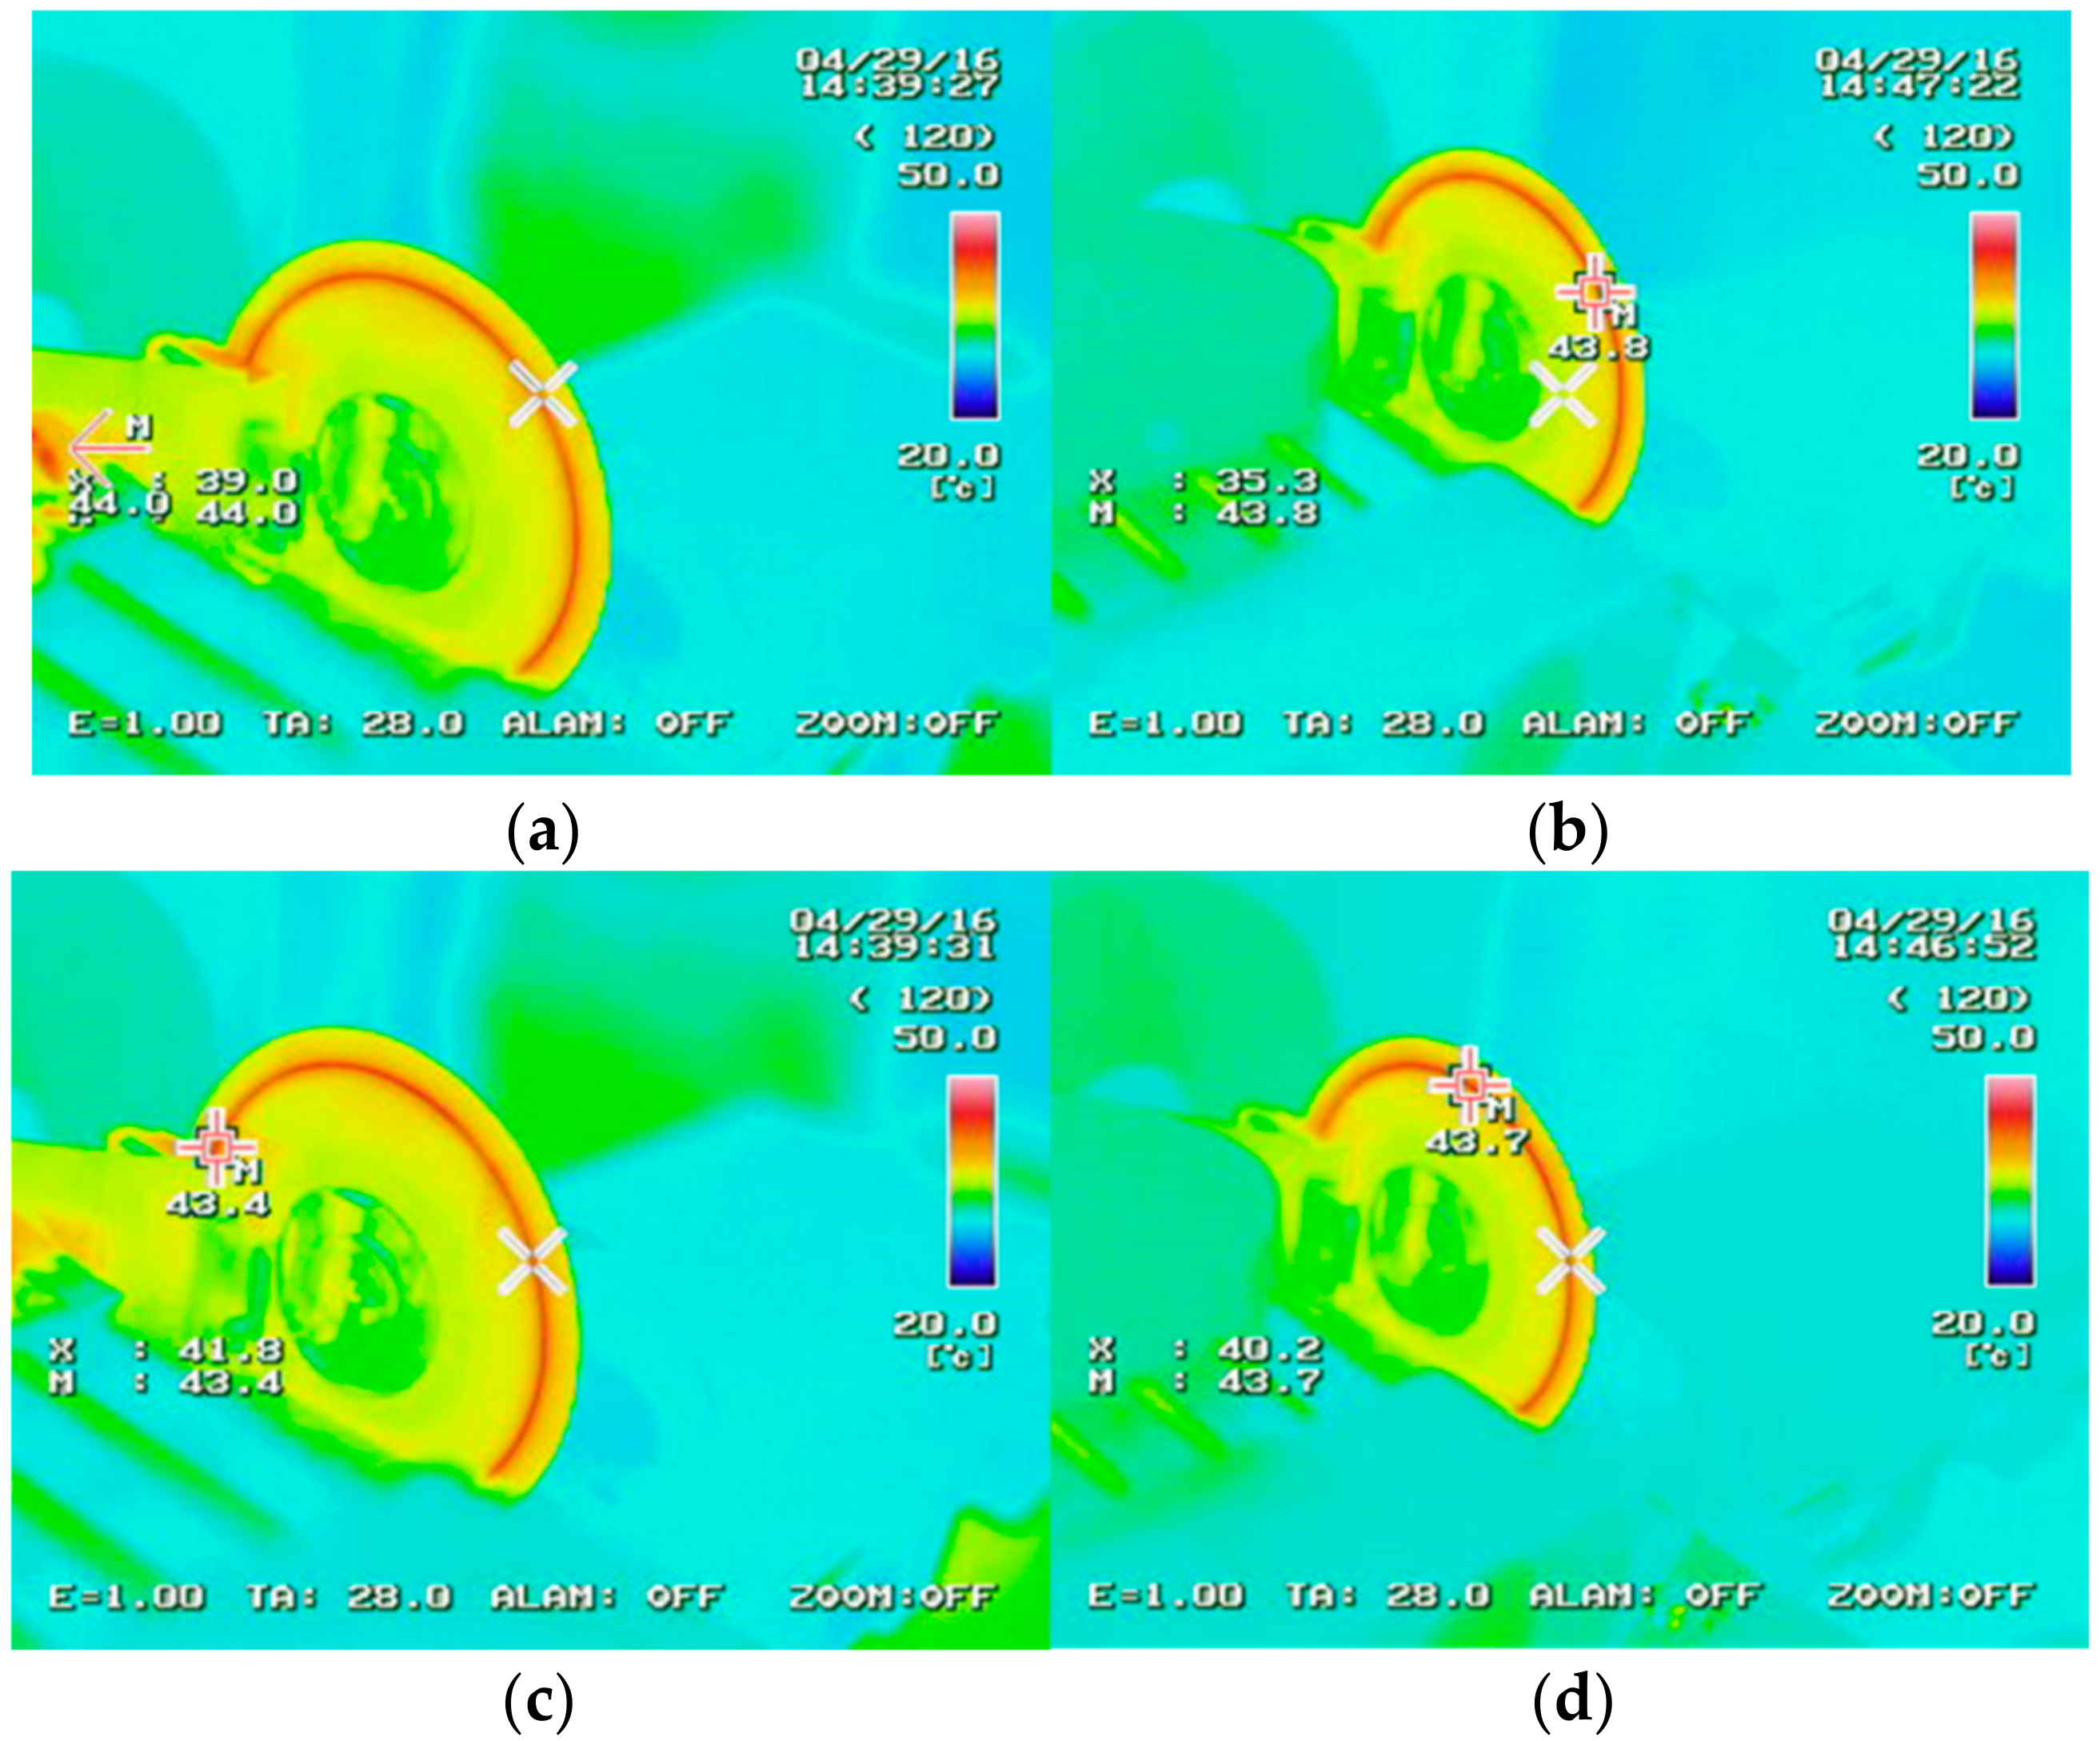
Measured temperatures on the phosphor layers: (a) front board for first part; (b) front board for third part; (c) back board for first part; and (d) back board for third part of generated heat.
Figure 7.
Measured temperatures on the phosphor layers: (a) front board for first part; (b) front board for third part; (c) back board for first part; and (d) back board for third part of generated heat.

Figure 8.
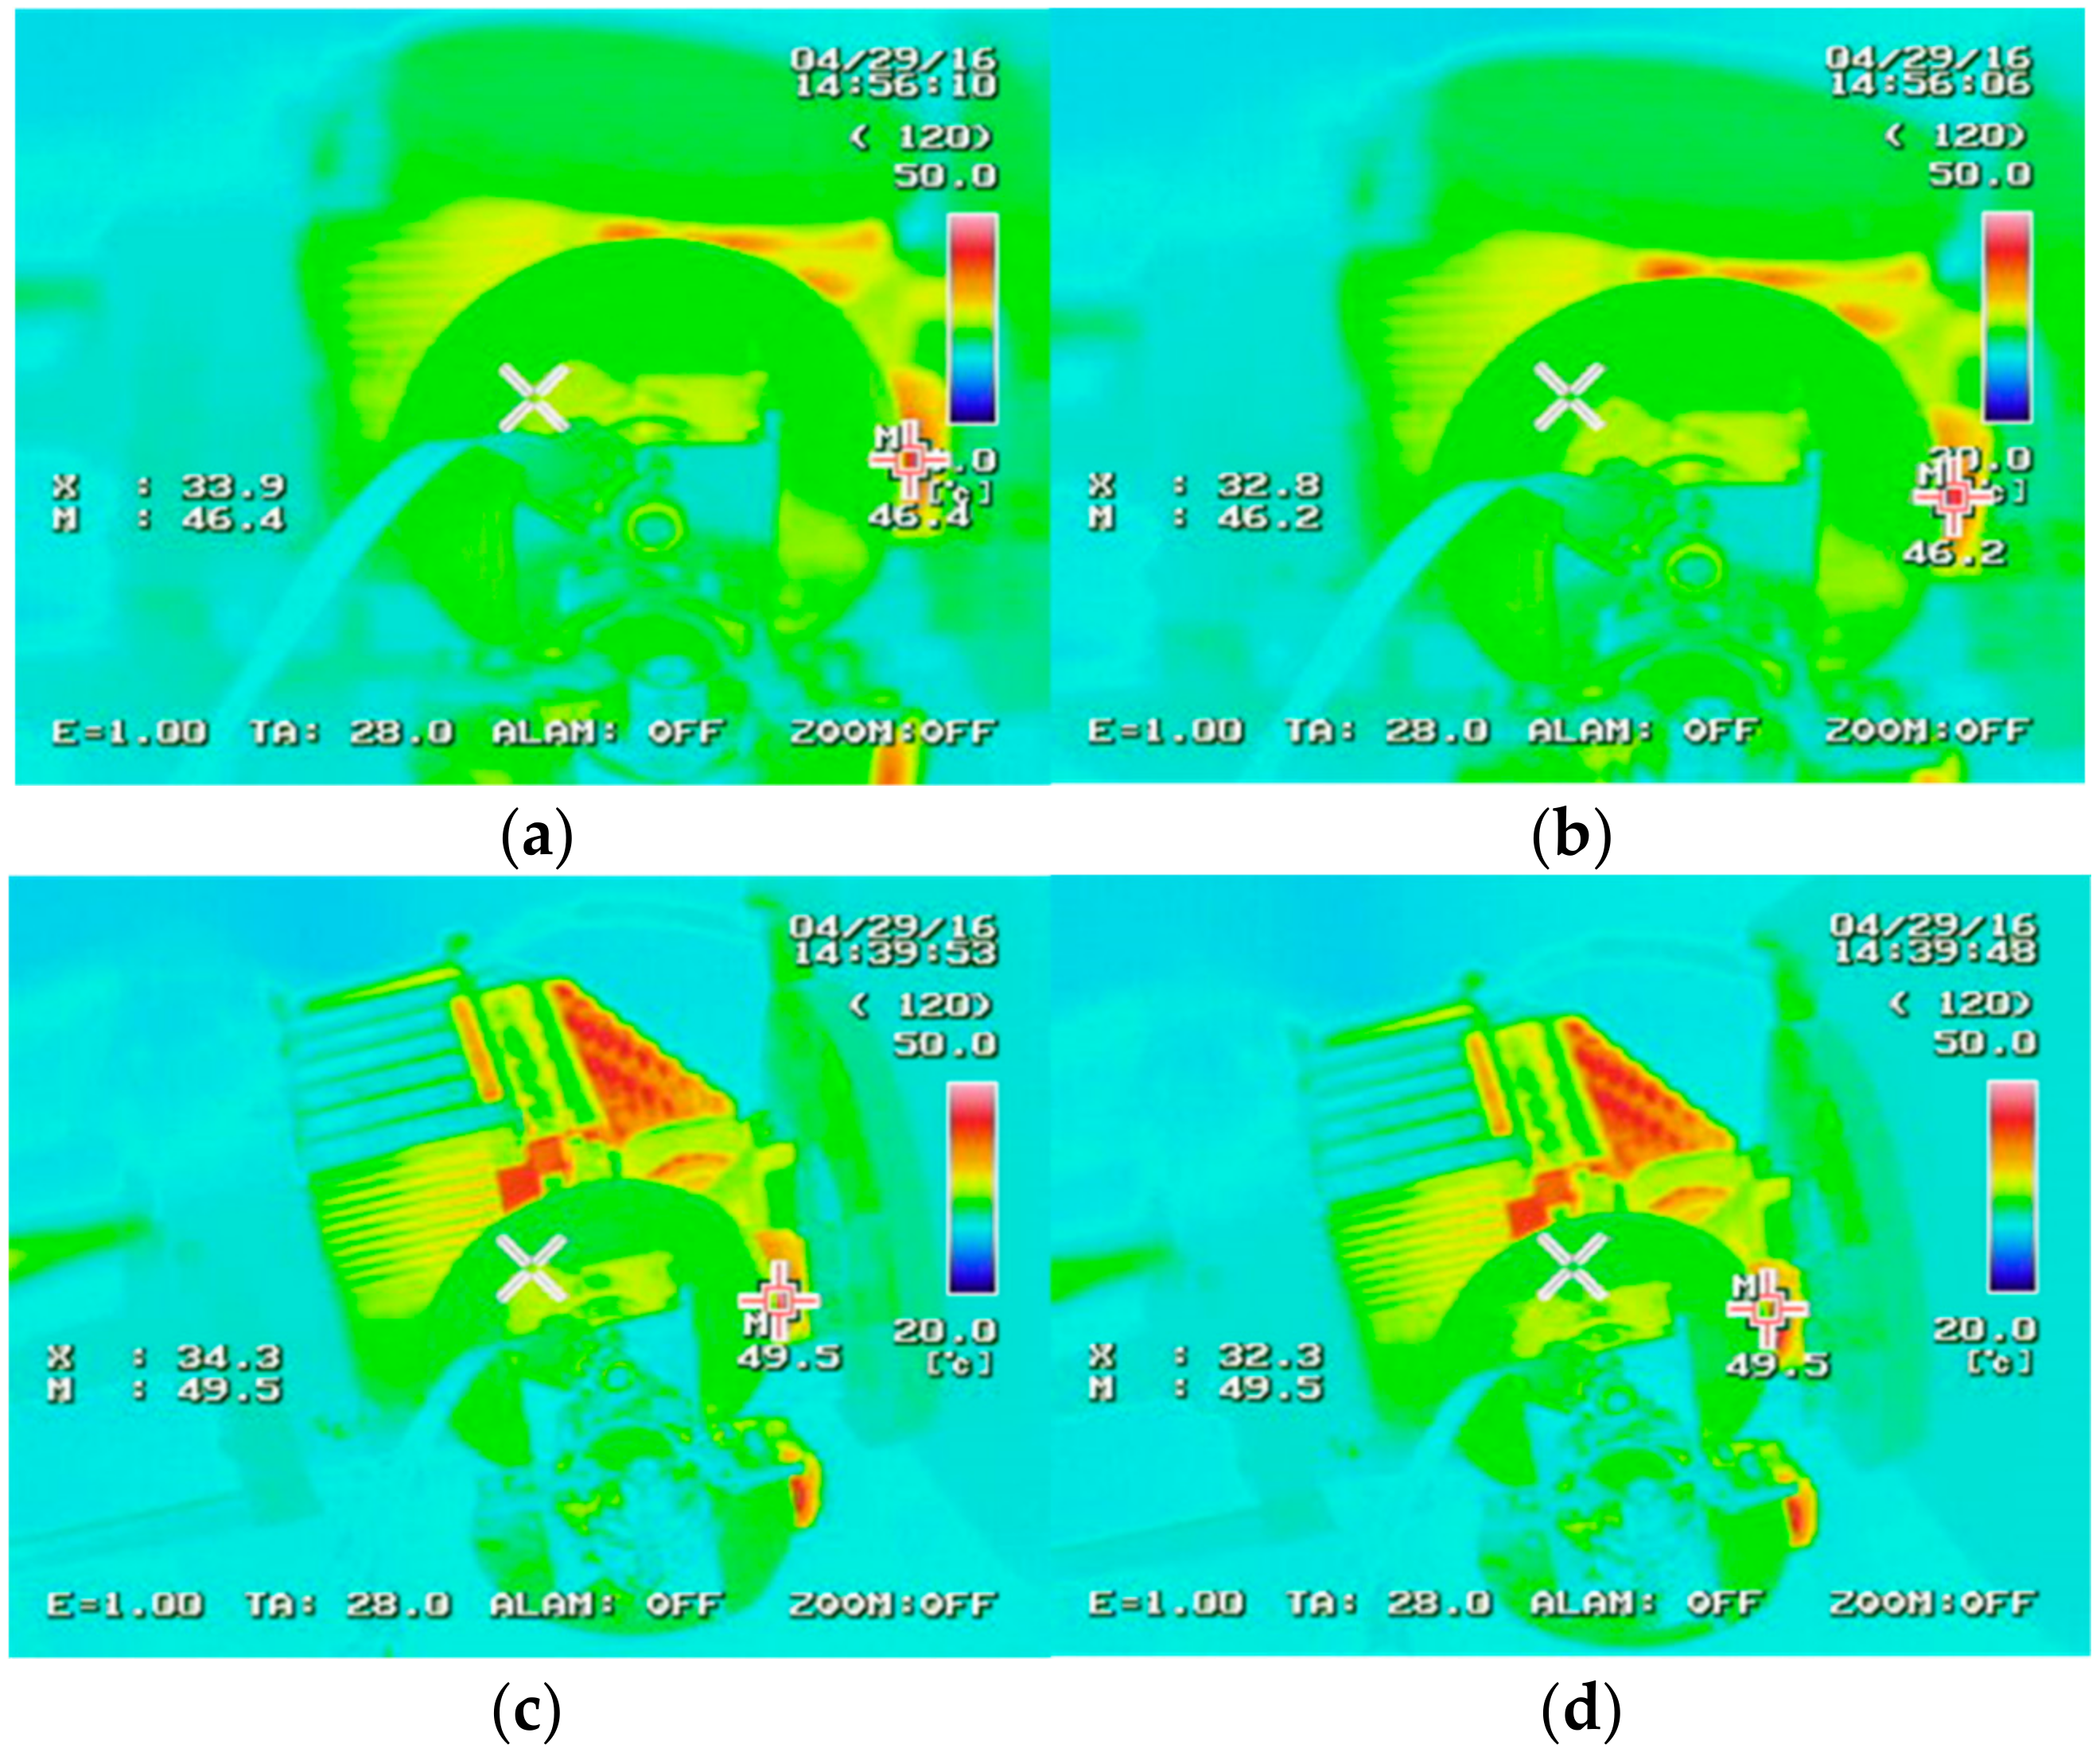
Measured temperatures on the substrate: (a) front board for second part; (b) front board for third part; (c) back board for second part; (d) back board for third part of generated heat.
Figure 8.
Measured temperatures on the substrate: (a) front board for second part; (b) front board for third part; (c) back board for second part; (d) back board for third part of generated heat.

Figure 9.
Selected points for extracting thermal results: (a) on phosphor layer and (b) on substrate.
Figure 9.
Selected points for extracting thermal results: (a) on phosphor layer and (b) on substrate.

Figure 10.
Normalized temperature of wheels for different laser powers: (a) GP wheel and (b) SP wheel.
Figure 10.
Normalized temperature of wheels for different laser powers: (a) GP wheel and (b) SP wheel.

Figure 11.
Temperature of GP wheels for different laser powers: (a) phosphor layer and (b) substrate.
Figure 11.
Temperature of GP wheels for different laser powers: (a) phosphor layer and (b) substrate.

Figure 12.
Normalized temperature of wheels for different laser spot sizes: (a) GP wheel and (b) SP wheel.
Figure 12.
Normalized temperature of wheels for different laser spot sizes: (a) GP wheel and (b) SP wheel.

Figure 13.
Normalized temperature of wheels under different operating temperatures: (a) GP wheel and (b) SP wheel.
Figure 13.
Normalized temperature of wheels under different operating temperatures: (a) GP wheel and (b) SP wheel.

Figure 14.
Normalized temperature of wheels with different heat convection coefficients: (a) GP wheel and (b) SP wheel.
Figure 14.
Normalized temperature of wheels with different heat convection coefficients: (a) GP wheel and (b) SP wheel.

Figure 15.
Normalized temperature of wheels for different substrate thicknesses: (a) GP wheel and (b) SP wheel.
Figure 15.
Normalized temperature of wheels for different substrate thicknesses: (a) GP wheel and (b) SP wheel.

Figure 16.
Deformation of a phosphor layer under reference conditions: (a) front view; (b) back view; (c) side view.
Figure 16.
Deformation of a phosphor layer under reference conditions: (a) front view; (b) back view; (c) side view.

Figure 17.
The flow of maximum principle stress at point P2.


Table 1.
Dimensions of the phosphor wheel.
| Component | Dimensions | ||
|---|---|---|---|
| Radius/Width (mm) | Thickness (mm) | Angle (°) | |
| Green phosphor | 25.75 | 0.4 | 108 |
| Yellow phosphor | 25.75 | 0.4 | 196 |
| Anti-reflection (AR) glass | 25.75 | 0.4 | 56 |
| Substrate | 33.75 | 0.7 | 360 |
| Glue | 3.4 | 0.1 | 304 |
| Clamper | 14 | 1.0 | 360 |
| Center hole | 5 | 0.7 | 360 |
Table 2.
Material properties of the phosphor wheel.
| Materials | Properties | ||||||
|---|---|---|---|---|---|---|---|
| ρ (kg/m3) | E (GPa) | υ | α (10−6/K) | k (W/m∙K) | cp (J/kg∙K) | ||
| Al | 2700 | 68 | 0.36 | 24 | 210 | 900 | |
| Cu | 8960 | 110 | 0.35 | 16.4 | 401 | 385 | |
| Ag | 10490 | 76 | 0.37 | 18.9 | 429 | 230 | |
| Ag–Epoxy | 2400 | 5.3 for temp. <110 °C 3.2 for others [14] | 0.35 | 89 for temp. >120 °C 39 for others [14] | 7.5 | 300 | |
| AR Glass | 2500 | 70 | 0.22 | 8.5 | 1.38 | 840 | |
| Si | 1000 | 0.01 | 0.45 | 310 | 2 | 1588 | |
| Air | 1.205 | – | – | – | 0.0257 | 1.005 | |
| Glass | 35 wt.% | 2969 | 95.6 | 0.22 | 8.31 | 2.208 | 753 |
| 40 wt.% | 3052 | 102.3 | 0.22 | 8.28 | 2.401 | 740 | |
| Si | 35 wt.% | 1376 | 0.013 | 0.45 | 274 | 2.448 | 987 |
| 40 wt.% | 1458 | 0.014 | 0.45 | 259 | 2.557 | 956 | |
Table 3.
Measured heat absorption coefficient on phosphor layer. GP, glass-based phosphor-converted color wheel; SP, silicone-based phosphor-converted color wheel.
Table 3.
Measured heat absorption coefficient on phosphor layer. GP, glass-based phosphor-converted color wheel; SP, silicone-based phosphor-converted color wheel.
| Specimens | Measurement Results | |||
|---|---|---|---|---|
| Input Laser Power (Pin) | Remaining Blue Ray (Pre) | Converted Laser Ray Power (Pcon) | Heat Absorption Coefficient (αg,p) | |
| 35% green GP layer | 0.54 | 0.050 | 0.280 | 0.39 |
| 35% green SP layer | 0.54 | 0.045 | 0.269 | 0.42 |
| 40% yellow GP layer | 0.54 | 0.047 | 0.269 | 0.41 |
| 40% yellow SP layer | 0.54 | 0.037 | 0.255 | 0.46 |
Table 4.
Measurement results and modified heat convection coefficient. FEM, finite element method.
| Results | Parameters | ||
|---|---|---|---|
| Heat Convection Coefficient (W/m2·K) | Front Board Temperature (°С) | Back Board Temperature (°С) | |
| Measurement results | – | 43.75 | 33.33 |
| FEM results 1 | 75 | 51 | 40.4 |
| FEM results 2 | 150 | 44.16 | 34.57 |
| FEM results 3 | 175 | 42.97 | 33.43 |
| Modified results | 160 | 43.78 | 34.15 |
Table 5.
Simulation interval of each parameter.
| Parameter | Reference Value | Domain | |
|---|---|---|---|
| Laser power | (Pin) | 120 W | 75~255 W |
| Laser spot size | (r) | Φ1.5 mm | Φ0.6~3 mm |
| Operating temperature | (Top) | 65 °С | 45~85 °С |
| Heat convection coefficient | (h) | 158.61 W/m2·K | 75~225 W/m2·K |
| Substrate thickness | (ts) | 0.7 mm | 0.5~1.0 mm |
Table 6.
Maximum/minimum values of major principal stress (σ11).
| Parameter | Controlled Value | σ11,max (MPa) | σ11,min (MPa) |
|---|---|---|---|
| Reference parameter | – | 86.7 | 83.2 |
| Laser power (W) | 255 | 142 | 135 |
| Laser spot size (Φ, mm) | 0.6 | 100 | 95.9 |
| Operating temperature (°С) | 85 | 105 | 102 |
| Heat convection coefficient (W/m2·K) | 75 | 115 | 111 |
| Substrate thickness (mm) | 0.5 | 91.1 | 87.5 |
© 2018 by the authors. Licensee MDPI, Basel, Switzerland. This article is an open access article distributed under the terms and conditions of the Creative Commons Attribution (CC BY) license (http://creativecommons.org/licenses/by/4.0/).
Share and Cite
MDPI and ACS Style
Lin, A.-D.; Kung, C.-L.; Hsu, S.-P.; Hsu, C.-M.; Chen, C.-Y. Effects of Coating Film Parameters on Thermal and Stress Distributions of Glass-Based Phosphor-Converted Color Wheels. Coatings 2018, 8, 188. https://doi.org/10.3390/coatings8050188
AMA Style
Lin A-D, Kung C-L, Hsu S-P, Hsu C-M, Chen C-Y. Effects of Coating Film Parameters on Thermal and Stress Distributions of Glass-Based Phosphor-Converted Color Wheels. Coatings. 2018; 8(5):188. https://doi.org/10.3390/coatings8050188
Chicago/Turabian StyleLin, Ah-Der, Chi-Liang Kung, Sung-Po Hsu, Chao-Ming Hsu, and Cheng-Yi Chen. 2018. "Effects of Coating Film Parameters on Thermal and Stress Distributions of Glass-Based Phosphor-Converted Color Wheels" Coatings 8, no. 5: 188. https://doi.org/10.3390/coatings8050188
Note that from the first issue of 2016, this journal uses article numbers instead of page numbers. See further details here.