Enhanced Transmittance Modulation of SiO2-Doped Crystalline WO3 Films Prepared from a Polyethylene Oxide (PEO) Template

 , , and
Abstract
:1. Introduction
2. Materials and Methods
3. Results and Discussion
4. Conclusions
Author Contributions
Funding
Acknowledgments
Conflicts of Interest
References
- Shendage, S.S.; Patil, V.L.; Vanalakar, S.A.; Patil, S.P.; Harale, N.S.; Bhosale, J.L.; Kim, J.H.; Patil, P.S. Sensitive and selective NO2 gas sensor based on WO3 nanoplates. Actuators B Chem. 2017, 240, 426–433. [Google Scholar] [CrossRef]
- Miyazaki, H.; Ishigaki, T.; Suzuki, H.; Ota, T. Effect of film thickness and air atmosphere on photochromic properties of WO3-based composite films. Bull. Chem. Soc. Jpn. 2016, 89, 20–23. [Google Scholar] [CrossRef]
- Sotelo-Vazquez, C.; Quesada-Cabrera, R.; Ling, M.; Scanlon, D.O.; Kafizas, A.; Thakur, P.K.; Lee, T.L.; Taylor, A.; Watson, G.W.; Palgrave, R.G.; et al. Evidence and effect of photogenerated charge transfer for enhanced photocatalysis in WO3/TiO2 heterojunction films: A computational and experimental study. Adv. Funct. Mater. 2017, 27, 1605413. [Google Scholar] [CrossRef]
- Granqvist, C.G. Electrochromic tungsten oxide films: Review of progress 1993–1998. Sol. Energy Mater. Sol. Cells 2000, 60, 201–262. [Google Scholar] [CrossRef]
- Wang, Y.; Runnerstrom, E.L.; Milliron, D.J. Switchable materials for smart windows. Annu. Rev. Chem. Biomol. Eng. 2016, 7, 283–304. [Google Scholar] [CrossRef] [PubMed]
- Esmail, A.; Hashem, H.; Soltan, S.; Hammam, M.; Ramadan, A. Thickness dependence of electro-optical properties of WO3 films as an electrochromic functional material for energy-efficient applications. Phys. Status Solidi A 2017, 214, 1600478-10. [Google Scholar] [CrossRef]
- Vernardou, D.; Psifis, K.; Louloudakis, D.; Papadimitropoulos, G.; Davazoglou, D.; Katsarakis, N.; Koudoumas, E. Low pressure CVD of electrochromic WO3 at 400 °C. J. Electrochem. Soc. 2015, 162, H579–H582. [Google Scholar] [CrossRef]
- Sahu, D.R.; Hung, C.Y.; Wang, S.C.; Huang, J.L. Existence of electrochromic reversibility at the 1000th cyclic voltammetry for spin coating WO3 film. Ionics 2017, 23, 3227–3233. [Google Scholar] [CrossRef]
- Garg, D.; Henderson, P.B.; Hollingsworth, R.E.; Jensen, D.G. An economic analysis of the deposition of electrochromic WO3 via sputtering or plasma enhanced chemical vapor deposition. Mater. Sci. Eng. B Adv. Funct. Solid-State Mater. 2005, 119, 224–231. [Google Scholar] [CrossRef]
- Myzelev, A. Electrochromic properties of sol-gel synthesized macroporous tungsten oxide films doped with gold nanoparticles. J. Electrochem. Soc. 2014, 161, H276–H283. [Google Scholar]
- Cheng, W.; Baudrin, E.; Dunn, B.; Zink, J.I. Synthesis and electrochromic properties of mesoporous tungsten oxide. J. Mater. Chem. 2000, 11, 92–97. [Google Scholar] [CrossRef]
- Zhan, Y.; Tan, M.R.J.; Cheng, X.; Tan, W.M.A.; Cai, G.F.; Chen, J.W.; Kumar, V.; Magdassi, S.; Lee, P.S. Ti-doped WO3 synthesized by a facile wet bath method for improved electrochromism. J. Mater. Chem. C 2017, 5, 9995–10000. [Google Scholar] [CrossRef]
- Azimirad, R.; Akhavan, O.; Moshfegh, A.Z. An investigation on electrochromic properties of (WO3)1−x–(Fe2O3)x thin films. Thin Solid Films 2006, 515, 644–647. [Google Scholar] [CrossRef]
- Lee, C.T.; Chiang, D.; Chiu, P.K.; Chang, C.M. WO3 electrochromic thin films doped with carbon. IEEE Trans. Magn. 2014, 50, 3501204. [Google Scholar] [CrossRef]
- Zhou, D.; Xie, D.; Shi, F.; Wang, D.H.; Ge, X.; Xia, X.H.; Wang, X.L.; Gu, C.D.; Tu, J.P. Crystalline/amorphous tungsten oxide core/shell hierarchical structures and their synergistic effect for optical modulation. J. Colloid Interface Sci. 2015, 460, 200–208. [Google Scholar] [CrossRef] [PubMed]
- Chu, J.; Lan, J.; Lu, D.; Ma, J.; Wang, X.; Wu, B.; Gong, M.; Zhang, R.; Xiong, S. Facile fabrication of WO3 crystalline nanoplate on FTO glass and their application in electrochromism. Micro Nano Lett. 2016, 11, 749–752. [Google Scholar] [CrossRef]
- Hutchins, M.G.; Butt, N.S.; Topping, A.J.; Gallego, J.; Milne, P.; Jeffrey, D.; Brotherston, I. Infrared reflectance modulation in tungsten oxide based electrochromic devices. Electrochim. Acta 2001, 46, 1983–1988. [Google Scholar] [CrossRef]
- Zhao, B.; Zhang, X.; Dong, G.; Wang, H.; Yan, H. Efficient electrochromic device based on sol–gel prepared WO3 films. Ionics 2015, 21, 2879–2887. [Google Scholar] [CrossRef]
- Li, Y.J.; Liu, Z.F.; Liang, X.P.; Ya, J.; Cui, T.; Liu, Z.C. Synthesis and electrochromic properties of PEG doped WO3 film. Mater. Technol. 2014, 29, 341–349. [Google Scholar] [CrossRef]
- Liang, C.; Dai, S. Dual phase separation for synthesis of bimodal meso-/macroporous carbon monoliths. Chem. Mater. 2009, 21, 2115–2124. [Google Scholar] [CrossRef]
- Li, D.; Wu, G.; Gao, G.; Shen, J.; Huang, F. Ultrafast coloring-bleaching performance of nanoporous WO3–SiO2 gasochromic films doped with Pd catalyst. ACS Appl. Mater. Interfaces 2011, 3, 4573–4579. [Google Scholar] [CrossRef] [PubMed]
- Righettoni, M.; Tricoli, A.; Pratsinis, S.E. Thermally stable, silica-doped ε-WO3 for sensing of acetone in the human breath. Chem. Mater. 2010, 22, 3152–3157. [Google Scholar] [CrossRef]
- Gerand, B.; Nowogrocki, G.; Figlarz, M. A new tungsten trioxide hydrate, WO3∙⅓H2O: Preparation, characterization, and crystallographic study. J. Solid State Chem. 1981, 38, 312–320. [Google Scholar] [CrossRef]
- Guo, C.; Liu, H.Z.; Wang, J.; Chen, J.Y. Conformational structure of triblock copolymers by FT-Raman and FTIR spectroscopy. J. Colloid Interface Sci. 1999, 209, 368–373. [Google Scholar] [CrossRef] [PubMed]
- Finocchio, E.; Cristiani, C.; Dotelli, G.; Stampino, P.G.; Zampori, L. Thermal evolution of PEG-based and BRIJ-based hybrid organo-inorganic materials. FT-IR studies. Vib. Spectrosc. 2014, 71, 47–56. [Google Scholar] [CrossRef]
- Wen, S.J.; Richardson, T.J.; Ghantous, D.I.; Striebel, K.A.; Ross, P.N.; Cairns, E.J. FTIR PEO + LiN(CF3SO2)2 electrolytes. J. Electroanal. Chem. 1996, 408, 113–118. [Google Scholar] [CrossRef]
- Deepa, M.; Sharma, N.; Varshney, P.; Varma, S.P.; Agnihotry, S.A. FTIR investigations of solid precursor materials for sol-gel deposition of WO3 based electrochromic films. J. Mater. Sci. 2000, 35, 5313–5318. [Google Scholar] [CrossRef]
- Rougier, A.; Portemer, F.; Quédé, A.; Marssi, M.E. Characterization of pulsed laser deposited WO3 thin films for electrochromic devices. Appl. Surf. Sci. 1999, 153, 1–9. [Google Scholar] [CrossRef]
- López, T.; Tzompantzi, F.; Hernández-Ventura, J.; Gómez, R.; Bokhimi, X.; Pecchi, G.; Reyes, P. Effect of zirconia precursor on the properties of ZrO2-SiO2 sol-gel oxides. J. Sol-Gel Sci. Technol. 2002, 24, 207–219. [Google Scholar] [CrossRef]
- Ramkumar, S.; Rajarajan, G. Effect of Fe doping on structural, optical and photocatalytic activity of WO3 nanostructured thin films. J. Mater. Sci. Mater. Electron. 2016, 27, 1847–1853. [Google Scholar] [CrossRef]
- Zeng, X.; Zhou, Y.; Ji, S.; Luo, H.; Yao, H.; Huang, X.; Jin, P. The preparation of a high performance near-infrared shielding CsxWO3/SiO2 composite resin coating and research on its optical stability under ultraviolet illumination. J. Mater. Chem. C 2015, 3, 8050–8060. [Google Scholar] [CrossRef]
- Gao, G.; Feng, W.; Wu, G.; Shen, J.; Zhang, Z.; Jin, X.; Zhang, Z.; Du, A. An investigation on the assembling of WO3 particles on the matrix of silica solution. J. Sol-Gel Sci. Technol. 2012, 64, 427–435. [Google Scholar] [CrossRef]
- Haro-Poniatowski, E.; Jouanne, M.; Morhange, J.F.; Julien, C.; Diamant, R.; Fernández-Guasti, M.; Fuentes, G.A.; Alonso, J.C. Micro-Raman characterization of WO3 and MoO3 thin films obtained by pulsed laser irradiation. Appl. Surf. Sci. 1998, 127–129, 674–678. [Google Scholar] [CrossRef]
- Najafi-Ashtiani, H.; Bahari, A.; Ghasemi, S. A dual electrochromic film based on nanocomposite of copolymer and WO3 nanoparticles: Enhanced electrochromic coloration efficiency and switching response. J. Electroanal. Chem. 2016, 774, 14–21. [Google Scholar] [CrossRef]
- Camirand, H.; Baloukas, B.; Klemberg-Sapieha, J.E.; Martinu, L. In situ spectroscopic ellipsometry of electrochromic amorphous tungsten oxide films. Sol. Energy Mater. Sol. Cells 2015, 140, 77–85. [Google Scholar] [CrossRef]
- El-Nahass, M.M.; Saadeldin, M.M.; Ali, H.A.M.; Zaghllol, M. Electrochromic properties of amorphous and crystalline WO3 thin films prepared by thermal evaporation technique. Mater. Sci. Semicond. Process. 2015, 29, 201–205. [Google Scholar] [CrossRef]
- Meenakshi, M.; Gowthami, V.; Perumal, P.; Sivakumar, R.; Sanjeeviraja, C. Influence of dopant concentration on the electrochromic properties of tungsten oxide thin films. Electrochim. Acta 2015, 174, 302–314. [Google Scholar]


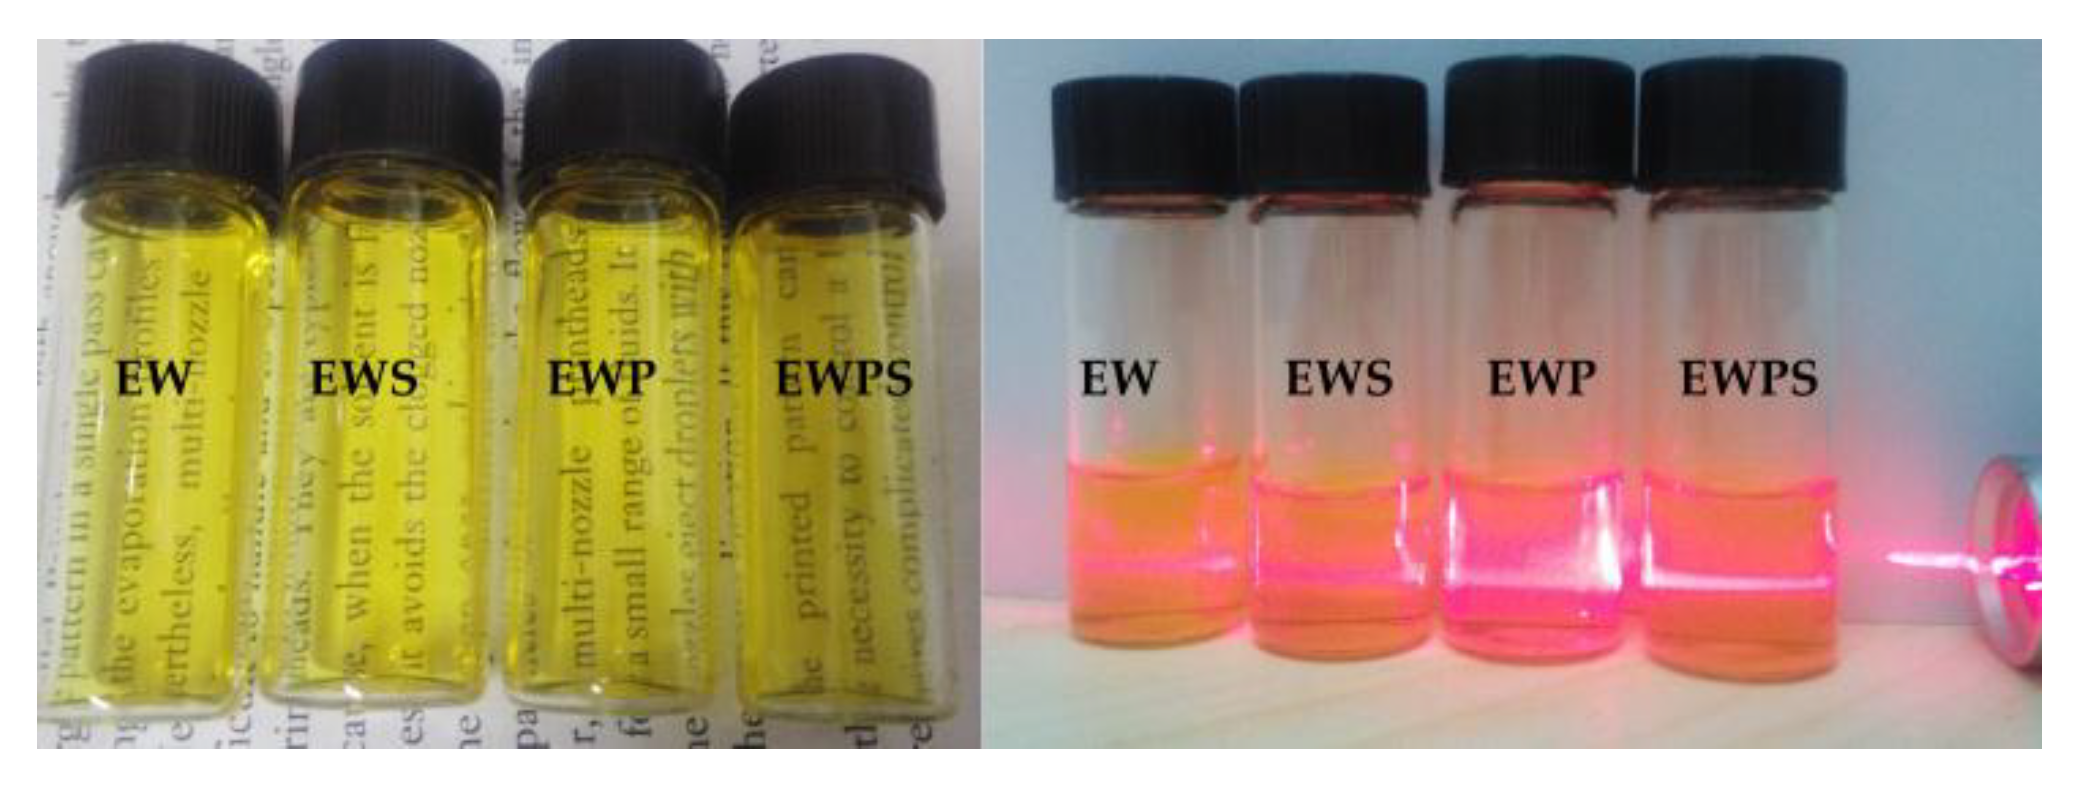
| Label | Absolute Ethanol/mL | Tungstate Solution/mL | Tetraethyl Orthosilicate (TEOS)/g | PEO polyethylene Oxide (Mw: 600,000)/g | Stirring Time/h | Heating Temperature/°C |
|---|---|---|---|---|---|---|
| EW | 2.5 | 2.5 | 0 | 0 | 3 | 70 |
| EWS | 2.5 | 2.5 | 0.21 | 0 | ||
| EWP | 2.5 | 2.5 | 0 | 0.1 | ||
| EWPS | 2.5 | 2.5 | 0.21 | 0.1 |
| Electrochromic Film | Synthetic Method | Crystallinity | ∆T at 628 nm | Reference |
|---|---|---|---|---|
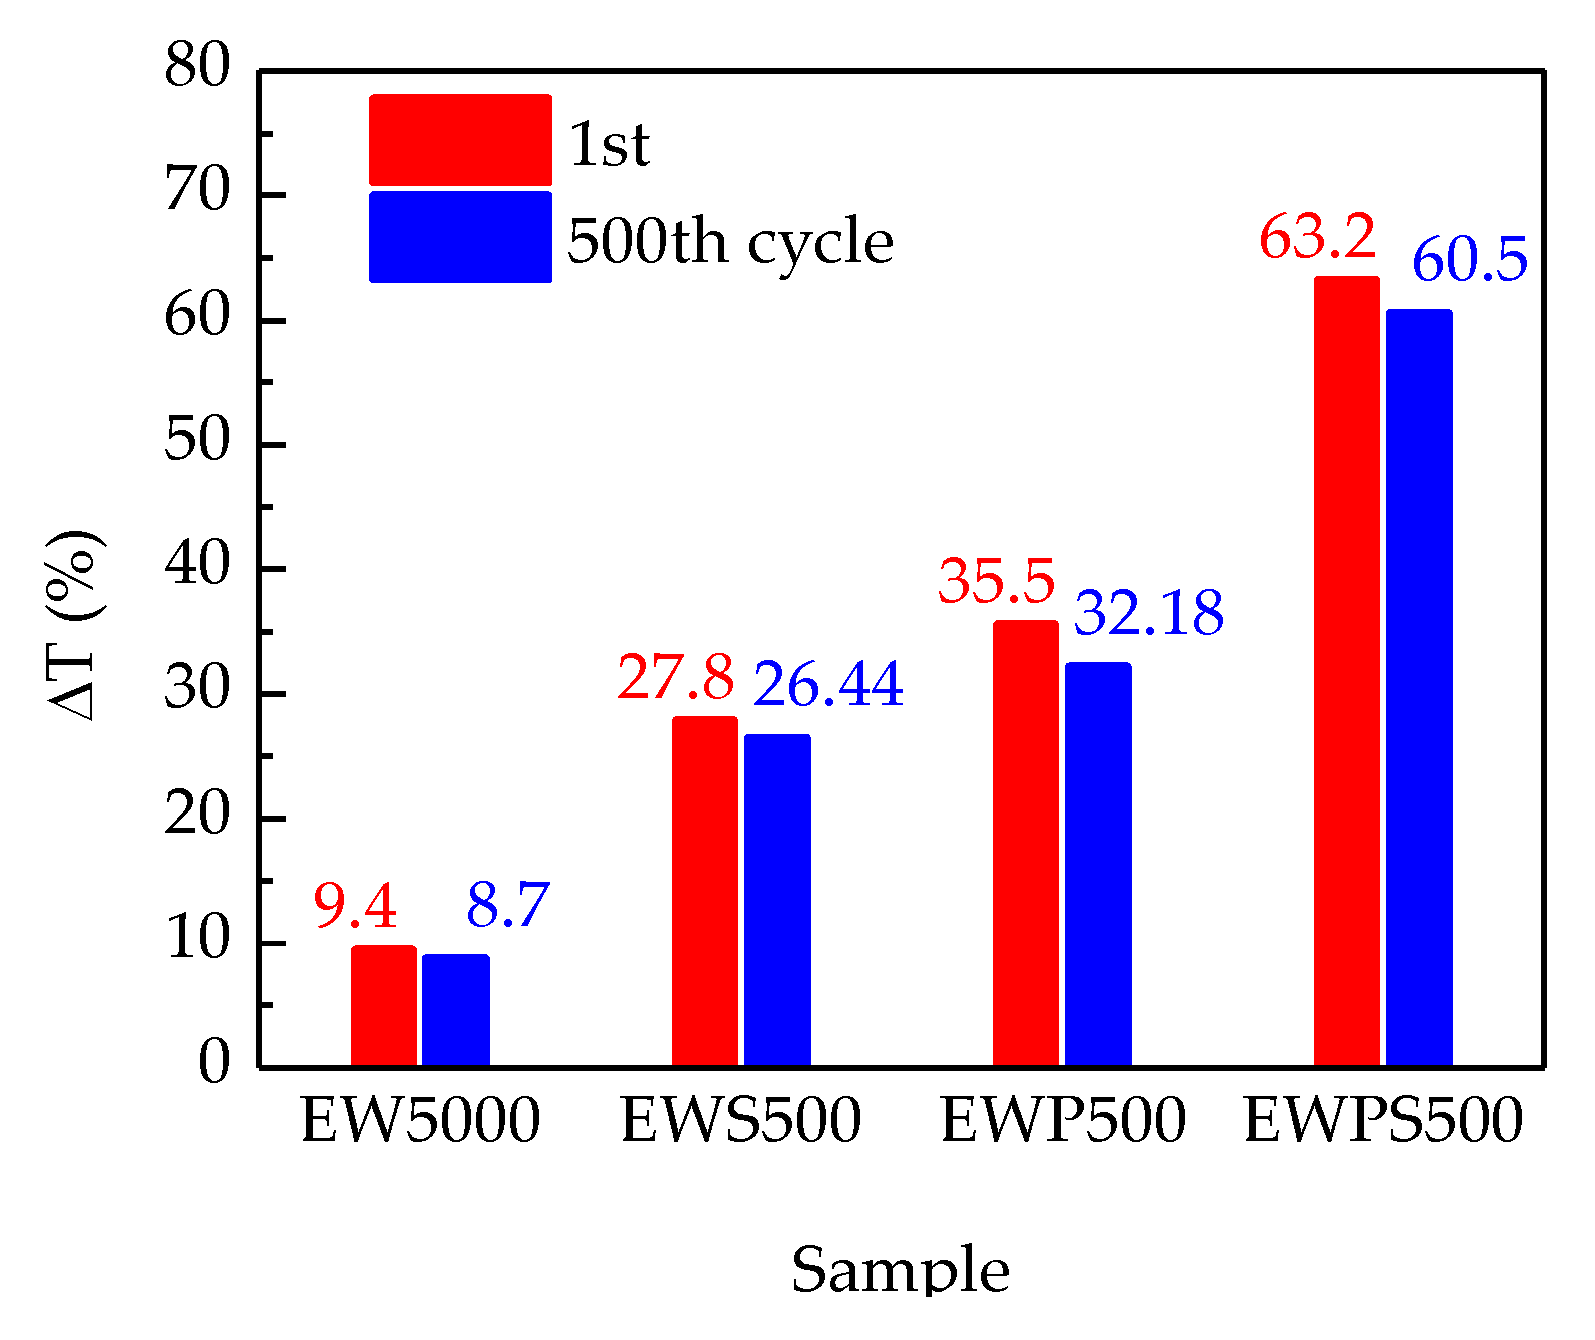
| EWPS500 | Sol–gel method | Crystalline | 63.2% | This work |
| PEG400 doped WO3 | Sol–gel method | Crystalline | ~14% | [19] |
| WO3 | Thermal evaporation | Crystalline | ~32% | [36] |
| WO3 | Thermal evaporation | Amorphous | ~66% | [36] |
| 2%V2O5 doped WO3 | RF magnetron sputtering | Amorphous | ~49% | [37] |
© 2018 by the authors. Licensee MDPI, Basel, Switzerland. This article is an open access article distributed under the terms and conditions of the Creative Commons Attribution (CC BY) license (http://creativecommons.org/licenses/by/4.0/).
Share and Cite
Zhang, G.; Lu, K.; Zhang, X.; Yuan, W.; Ning, H.; Tao, R.; Liu, X.; Yao, R.; Peng, J. Enhanced Transmittance Modulation of SiO2-Doped Crystalline WO3 Films Prepared from a Polyethylene Oxide (PEO) Template. Coatings 2018, 8, 228. https://doi.org/10.3390/coatings8070228
Zhang G, Lu K, Zhang X, Yuan W, Ning H, Tao R, Liu X, Yao R, Peng J. Enhanced Transmittance Modulation of SiO2-Doped Crystalline WO3 Films Prepared from a Polyethylene Oxide (PEO) Template. Coatings. 2018; 8(7):228. https://doi.org/10.3390/coatings8070228
Chicago/Turabian StyleZhang, Guanguang, Kuankuan Lu, Xiaochen Zhang, Weijian Yuan, Honglong Ning, Ruiqiang Tao, Xianzhe Liu, Rihui Yao, and Junbiao Peng. 2018. "Enhanced Transmittance Modulation of SiO2-Doped Crystalline WO3 Films Prepared from a Polyethylene Oxide (PEO) Template" Coatings 8, no. 7: 228. https://doi.org/10.3390/coatings8070228