Article

Corrosion Resistance of Boronized, Aluminized, and Chromized Thermal Diffusion-Coated Steels in Simulated High-Temperature Recovery Boiler Conditions

by
Amirhossein Mahdavi
,
Eugene Medvedovski
,
Gerardo Leal Mendoza
and
André McDonald
*
10-203 Donadeo Innovation Center for Engineering, Department of Mechanical Engineering, University of Alberta, Edmonton, AB T6G 1H9, Canada
*
Author to whom correspondence should be addressed.
Coatings 2018, 8(8), 257; https://doi.org/10.3390/coatings8080257
Submission received: 30 May 2018 / Revised: 5 July 2018 / Accepted: 22 July 2018 / Published: 24 July 2018
(This article belongs to the Special Issue Coatings for Harsh Environments)

Abstract

:
In this study, the high-temperature molten salt corrosion resistance of bare steels and steels with protective coatings, fabricated by thermal diffusion processes (boronizing, aluminizing and chromizing), were investigated and compared. Surface engineering through thermal diffusion can be used to fabricate protective coatings against corrosion, while alleviating issues around possible cracking and spallation that is typical for conventional thermal-sprayed coatings. In this regard, samples of low carbon steel and 316 stainless steel substrates were boronized, chromized, and aluminized through a proprietary thermal diffusion process, while some of the samples were further coated with additional thin oxide and non-oxide layers to create new surface architectures. In order to simulate the actual corrosion conditions in recovery boilers (e.g., from black liquor combustion), the surfaces of the samples sprayed with a modeling salt solution, were exposed to low-temperature (220 °C) and high-temperature (600 °C) environments. According to microstructural and X-ray diffraction (XRD) studies and results of hardness determination, the coatings with multilayered architectures, with and without additional oxide layers, showed successful resistance to corrosive attack over bare steels. In particular, the samples with boronized and chromized coatings successfully withstood low-temperature corrosive attack, and the samples with aluminized coatings successfully resisted both low- and high-temperature molten salt corrosive attacks. The results of this study conducted for the first time for the thermal diffusion coatings suggest that these coatings with the obtained architectures may be suitable for surface engineering of large-sized steel components and tubing required for recovery boilers and other production units for pulp and paper processing and power generation.

1. Introduction

Recovery boilers are widely used in pulp and paper mills to produce process steam and electrical power by burning black liquor fuel which is an aqueous solution of lignin hemicellulose and inorganic chemicals [1,2,3]. The primary function of recovery boilers is to recycle inorganic cooking chemicals (black liquor) and to provide the major volume of the process steam used in the Kraft process, as well as auxiliary electricity for the production plant [2,3,4]. As a result of combustion of black liquor with solid contents varying from 20% to 80% of inorganic solids, depending on the used starting materials and process features, low-melting temperature ash or smelt is produced. The produced smelt mainly consists of different salts, e.g., sodium and potassium chlorides, sulfates, and carbonates. At elevated temperatures, mostly greater than 500 °C, the aforementioned salts in certain combination likely become molten. In the presence of oxygen, the molten salts can be highly corrosive [2,3]. Combustion of the black liquor fuel also results in the formation of hot corrosive gases, such as SO2, CO2, Cl2, and some others [5].
Generally, high-temperature black liquor corrosion occurs according to two main mechanisms, namely (i) high-temperature active oxidation and (ii) corrosion due to the formation of sulfidic and chlorine gasses and residual deposits of molten salts and their interaction with the steel surface [6]. In the former mechanism, which generally occurs in high temperatures (above 450 °C), the anions of the molten salt, such as chlorides (Cl), sulfates (SO42−) and sulfides (S2−), continuously diffuse into the oxide-metal interface and actively sustain the oxidation. On the other hand, in the latter mechanism, the presence of the anions of the molten salt at elevated temperatures forms low melting point eutectics, which gradually dissolves the protective oxide layer from the metal surface and facilitates the oxidation of the metal surface [6]. During the high-temperature interaction of the molten salts and formed iron and chromium salts and oxides in the ash and scale layers, the corrosive gases (Cl2, CO2, HCl, and some others) are produced, which can expedite the corrosion of steels. The occurring “self-catalytic active oxidation” corrosion depends on the Kraft process parameters, temperature, formed molten salt and gaseous phase compositions, and many other factors. The features of the corrosion process and the chemical reactions occurring among the steels and formed molten salts and corrosive gases at high temperatures are described in details elsewhere [7,8,9,10,11,12].
Stress corrosion cracking and/or thermal fatigue cracking also occur at specific locations within the boiler system [13,14,15]. In summary, inherent in the boiler system are various species of salts that become molten at the high operating temperatures of the boiler, increasing corrosion of the boiler surfaces and tubes. Flue gases in recovery boilers used in pulp and paper mills pass over the super-heater tubes at temperatures of 700 °C or even greater, and they contain large concentrations of corrosive gases and particulates with melting points as low as 500 °C [14]. Relative to utility boilers, this hot, corrosive gas environment results in significant corrosion of the steels used to fabricate the boiler walls and tubes. Similar problems also occur in the evaporators, superheater systems, fireside, fans, and exhausting systems in the pulp and paper industry. In many cases, the metallic components used in industry are made from carbon steels and low-alloy steels, and, in some case, from expensive stainless steels [2,3,12]. Although stainless steels perform better than low-alloy steels, they also experience sufficient degradation at high temperature molten salt corrosion environments. Anyway, serious corrosion problems with steel components and deposit accumulation reducing equipment efficiency lead to unscheduled shutdown of the boilers and to necessity of expensive maintenance. With regards to the briefly described problems occurring with steels, the reliable protection of steel components, including of long size tubing, is highly important.
Different surface engineering methods, particularly those based on coatings, are used in industry to protect steels and alloys against corrosion. They include painting, dipping, sol-gel processes, cold and thermal spraying, chemical and electrochemical methods (anodizing, electroplating, electroless plating, and electrophoretic deposition), plasma-assisted technologies, physical vapor deposition (PVD), and chemical vapor deposition (CVD), among others [16,17,18,19,20,21,22,23,24,25]. However, most of these methods cannot be widely utilized in industry, especially for processing of large complex shape components and long tubing when the inner surface needs to be protected. Moreover, the application of some of the aforementioned coating processes is limited, since they might experience spallation or delamination of the coating layers due to poor adhesion to the substrate and weak bonding or thermal expansion mismatch at the coating–substrate interface. Coatings with low thickness (sub-micron and micron length scales) and low hardness often experience rapid degradation, especially due to inadvertent mechanical action during service or installation. Organic-based coatings should be excluded because of decomposition or degradation at elevated temperatures.
Typically, thermal-sprayed coatings are used to provide protection against high-temperature corrosion [26,27,28]. Thus, high-velocity oxy-fuel (HVOF) thermal-sprayed coatings of stainless steel or Inconel alloy 625 provide high resistance against corrosion in the pulp and paper processing [26]. Some studies have even explored the use of nanostructured yttria-stabilized zirconia as a top coat for a multi-layered environmental barrier coating system for the boiler tubes [26]. However, due to the high operating temperatures (3,500–10,000 °C) of the thermal spray processes [29,30,31], and possible formation of detrimental cracks and delamination of the final coating, these coatings may not be suitable for all substrate materials and practical conditions. In addition, there is a real challenge to apply thermal spraying techniques for protection of the inner surface of long tubing, as well as the components with complex shapes. To the contrary, surface engineering through the Chemical Vapor Deposition (CVD) technology may be an efficient and reliable process for protection of industrial components with different sizes and shapes [32,33,34,35,36,37]. Thus, thermal diffusion technology, which is based on the CVD principles, is an advanced and novel surface engineering process that can alleviate the issues around cracking and delamination of the surface treatment [32,33]. Therefore, they can be applicable for large size and long components, including for tubing with a high length-to-diameter ratio. This technology and its variations are successfully used to produce thin, hard, and corrosion/wear resistant layers of carbides, borides, aluminides, chromides, and some other compounds on the surface of steel substrates [38,39]. In the light of growing attention towards this technology in recent years, investigation on the corrosion/wear resistance of thermal diffusion coatings is of interest.
The thermal diffusion process allows the formation of the coatings on the steel substrates via deposition of vapors of certain atoms and species occurred through high temperature reactions originated from specially formulated powder mixes, diffusion of these atoms into the metal substrate and consequent high-temperature interaction of these diffused atoms with the metal substrate resulted in the formation of new phases and their consolidation [33,34,35]. In this process, the steel substrates are usually immersed into the special powder mixes which all together are placed into retorts, then heated to selected temperatures. Consequently, new compounds, such as borides or intermetallides (e.g., aluminides and chromides) depending on the selected process, are formed on the surfaces of steel substrates. Since the aforementioned technology is related to diffusion processes, the diffusion laws are applicable to the coating formation. Due to inward diffusion of the deposited atoms (e.g., B, Al, and Cr) and outward diffusion of the metallic constituents from the substrates (e.g., Fe, Cr, Ni, and others), the coatings with a few layers consisted of borides, aluminides, or chromides of certain compositions are formed simultaneously. Their structures, thicknesses, and compositions are defined by the initial (starting) mix compositions, chemistry, and other features of the substrate materials and the process parameters such as temperature, exposure time, gas pressure, and others. As an example of the thermal diffusion process and coating formation, the boronizing process employed by Endurance Technologies Inc. (ETI) has been described in detail elsewhere [40,41]. This process significantly distinguishes from the thermal reactive carbide-based coatings that utilize a salt bath process. The later process has been described in detail by Liu et al. elsewhere [38].
Numerous studies on the corrosion resistance of boronizing thermal diffusion coatings on steels have been conducted with respect to a variety of practical applications, particularly for oil and gas production, refinery, and power generation applications [40,41,42]. It was shown that the boronizing process provides enhanced corrosion resistance of steel components, especially for applications dealt with large-size complex shapes and long tubular components [40]. These coatings with thicknesses of 50–400 µm and uniform, dense “saw-tooth” structures (for carbon steels) demonstrated high wear and corrosion resistance in steam with hydrocarbons, carbonaceous gases (CO + CO2), hydrogen sulfide (H2S), and chloride salts (NaCl and CaCl2) at elevated pressures (14–28 MPa) and temperatures (200–300 °C) for long time exposure, as well as in the actual oil well corrosive conditions [41]. These boronized thermal diffusion coatings provided a noticeable extension of the service life, on average 3–10 times greater longevity compared to uncoated steels, in harsh corrosive environments of oil well production conditions and power generation. However, due to their oxidation at higher temperatures, boronized coatings can be suitable in environment with temperatures only up to 500 °C [41,42].
It has been shown that the aluminizing and chromizing processes enhanced corrosion resistance of steels and alloys exposed to gaseous environments at elevated temperatures up to 800–950 °C [43,44,45,46,47]. The diffusion aluminized coatings usually have two distinctive layers, an outer aluminide layer and an inner inter-diffusion layer, that are formed on top of the original stainless steel substrate [43]. In a detailed study, Wang [45] investigated the corrosion resistance of both the aluminized and chromized thermal diffusion coatings on steel substrates at elevated temperatures (600 °C) and proposed that chromized coating with more than 30 wt.% Cr and a thickness of 120 μm provided suitable corrosion resistance in sulfidation-oxidation conditions. According to Bai et. al. [46], the chromized thermal diffusion coating on low-carbon AISI 1020 steel showed improved resistance to corrosion compared to the original substrate. While these studies have placed emphasis on the corrosion behavior of the boronized, aluminized, and chromized thermal diffusion coatings on steel substrates, no comparative research work has been conducted to explore and develop thermal diffusion coatings to provide protection against high temperature molten salt corrosive attack. Moreover, coatings with more complex architectures, where a few potential protective layers may be involved, have never been considered for application in severely corrosive environmental conditions.
The main principle of the protection of the steels through the formation of the boride or intermetallide coatings is based on the fact that these coating materials have crystalline structures and strong diffusion bonding to the substrates. These coating compounds (intermetallides or borides) have high values of thermodynamic properties (e.g., high crystalline lattice energy and enthalpies) and strong, short covalent bonds of Fe–B, Fe–Al, Cr–Al, among others. As known, high lattice energies provide greater stability of crystal structures and higher degree of covalence associated with chemical bonds in solids, and therefore it has a direct correlation with chemical stability and integrity of the materials in harsh environments [48,49]. Therefore, these compounds have high corrosion resistance in general [50,51]. These coatings do not contain “free” Fe and other elements, like in steels or alloys, and the “introduced” elements (B, Al, and Cr) are not in their “free” forms either. In other words, the possibility of interaction of these metals with the anions of the corrosive environment (e.g., of the salts) is inhibited sufficiently. The interaction with the corrosive medium is possible only when the covalent bonds Fe–B, Fe–Al, Fe–Cr, and other related compounds are “broken”.
The objective of this comparative study was to investigate the corrosion resistance of low carbon steel and 316 stainless steel with boronized, aluminized, or chromized surfaces obtained by using a thermal diffusion process and to compare them with bare steels. In order to simulate a corrosive environment to the typical of actual recovery boilers, the materials were exposed to modeling molten salts in low-temperature (220 °C) and high-temperature (60′0 °C) environments. In this regard, through a comparative study, the microstructure, composition, and corrosion behaviors of the modified surfaces were analyzed.

2. Materials and Methods

2.1. Sample Preparation

In this study, the target substrate steel materials were A36/44W low carbon steel (hereafter “CS”), which has similar composition and properties as steels J55 and K55 widely used in industry for tubing manufacturing, and 316 stainless steel (hereafter “316”). Steel substrates with dimensions of 25 mm × 25 mm × 6.3 mm (1′′ × 1′′ × ¼′′) were coated according to a proprietary ETI thermal diffusion process. In this regard, steel substrates were boronized (–B), aluminized (–A), or chromized (–Cr). To that end, special powder compositions formulated for boronizing, aluminizing, and chromizing, which are the proprietary of ETI, have been prepared. The steel substrates have been immersed into the prepared powder mixes and placed into the retorts. The sealed retorts contained powders and substrates have been heated to certain temperatures provided the gas formation from the selected mixes. As mentioned above, the required atoms deposited onto the substrates diffused into the steel structures with consequent new phase formation, growth, and consolidation of the coating structures. According to the selected process, borides, aluminides, and chromides have been formed on the steels. Some of the obtained thermal diffusion coatings were further coated with thin oxide or non-oxide layers in combinations of boronized + boron nitride (–B–BN), boronized + yttria partially stabilized zirconia (–B–Z), aluminized + tin oxide (–A–Sn), and aluminized + partially stabilized zirconia (–A–Z), creating new composite “more complex” coating architectures. These materials have been selected for the additional layer due to their well-known chemical inertness and high temperature stability (up to 900 °C for BN and greater than 1200 °C for the oxides) [52,53]. The formation of the top thin layer was accomplished by immersion of the diffusion coated samples, which were first cleaned by brushing and washing with acetone, into the selected ceramic suspension, containing nano-size ceramic particles, with subsequent heat treatment at elevated temperatures. This heat treatment allowed consolidation of the top layer and adequate bonding to the boride or aluminide coating. The surface preparation and the use of the suspensions with nanoparticles promoted the adhesion of the coating materials. The obtained top layers had thicknesses varying of below 1 µm (for BN) to several microns for (zirconia and tin oxide). The top coating thickness depended on the concentration of the ceramic suspensions, particle size of the ceramic ingredient, and immersion time.
Five samples of each coating options, along with ten uncoated samples (control samples) were prepared. All the samples were weighed before exposure to corrosive attack by using a high-precision scale (Adventurer Pro AV313, OHAUS Corporation, Parsippany, NJ, USA). The maximum capacity and the tolerance of the scale were 310 g and 1 mg, respectively. The masses of the samples before the corrosive attack were used in the determination of the mass change after corrosive attack.

2.2. Corrosion Testing

For the corrosion study, the coated and uncoated (control) samples were first sprayed with a prepared dissolved salt solution. The simulated salt was a combination of four reagent grade chemicals selected to simulate the deposits on upper boiler tubes [27]. The chemicals in the salt mixture and their weight percentages are listed in Table 1. The simulated salt mixture was dissolved in distilled water to produce an unsaturated solution with a concentration of 192 g/L. According to the results of Differential Thermal Analysis (DTA) conducted by Rao et. al. [27], this salt mixture had a single first melting point of approximately 520 °C. To ensure that the amount of salt sprayed on all samples was approximately equal, the samples were weighed before and after application of the salt.
The corrosion testing was performed in two conditions, namely low temperature (220 °C, i.e., below the melting point of the modeling salt) and high temperature (600 °C, i.e., above the melting point of the modeling salt), both in air, which simulated two different conditions of the actual recovery boiler applications. For this purpose, the low-temperature furnace (ISOTEMP, Fisher Scientific, Ottawa, ON, Canada) and the high-temperature furnace (Wheelco Instruments, Chicago, IL, USA) were used. Accordingly, a list of the samples exposed to the low-temperature and the high-temperature corrosive environments are presented in Table 2. For each experimental series (low- and high-temperature corrosive attack), one sample of each coating was exposed in the corrosive oxidation environments for 24, 48, 96, and 168 h. The samples designated for each experimental series were placed all together to the furnace and exposed simultaneously due to the capacity of the employed furnaces, that is, these samples were tested at the same temperature and time conditions.

2.3. Materials Examination

After the corrosion tests, the samples were rinsed with warm water and 95 vol.% ethanol to clean their surfaces from residual salt, which may remain from the test. Afterward, the samples were kept at room temperature to dry them completely. All the samples were weighed before and after washing and rinsing for the appropriate record of their masses, and the mass change was calculated. A so-called “relative mass change” was presented as a percentage of the mass of the samples before corrosive attack.
Relative   Mass   Change   ( % ) = ( Mass   Before   Corrosive   Attack ) ( Mass   After   Corrosive   Attack ) ( Mass   Before   Corrosive   Attack ) × 100
The samples also were visually examined for the color, presence or absence of the flakes, delamination, macro-cracks, and pitting. After that, the samples were cut in half, mounted in epoxy, and then ground and polished according to the ETI established procedure. The examination of the microstructures of the cross-sections was conducted using a light optical microscope (IM7200, MEIJI Techno, San Jose, CA, USA). For the high quality images, acidic-based etching (e.g., Nital consisted of the nitric acid solution in ethanol) was employed. X-ray Diffraction (XRD) analysis was conducted by using an X-ray diffractometer (Ultima IV, Rigaku Corporation, The Woodlands, TX, USA) to elucidate an evidence of possible phase change within the coated samples after extended time exposure to a high-temperature corrosive environment. A cobalt tube was used to characterize the surface treatments. The tube was used at 38 kV and 38 mA with a curved graphite monochromator. Continuous XRD mode, where the two-theta diffraction angle was changed from 10° to 120° at a rate of 2°/min, was used. Moreover, a portable surface roughness gage (Pocket Surf. III, Mahr Federal Inc., Providence, RI, USA) was used to measure the roughness of the substrates after the corrosive attack. The nominal traverse length of the gage was 5 mm and the traverse speed was 5.08 mm/s.
Two methods of hardness determination were used in this study. Micro-indentation via Knoop hardness testing (Clark Micro-hardness Tester CM-400AT, CM Series, MetLab Corp., Niagara Falls, NY, USA) was employed by applying a diamond indenter with a 100-g load (HK 0.1) onto the coating cross-section under a microscope for a dwell time of 10–15 s. The Rockwell hardness test (Starrett Rockwell Hardness Tester, The L.S. Starrett Company, Athol, MA, USA) was also used and a load of 100 kgf (HRB) was applied onto the substrate material for a dwell time of 10–15 s. Two methods of hardness determination have been selected because, considered together, they provide better evaluation of the integrity of the materials. Rockwell hardness can reflect the property of the steel substrates at high indentation load; while, Knoop micro-hardness shows how the coating resists the action of sharp indentation applied exact to the coating. The measurements of the Knoop micro-hardness for the coating and for the substrate allow for comparison of the two different materials under the same testing conditions. The comparison of the hardness values was carried out for the original samples and for the samples exposed for 168 h; in the corrosion environments at low- and high-temperature conditions. Since the action of corrosion and temperature can create stress and micro-crack formation, phase changes, microstructure modification, etc., which can weaken the structure, the hardness comparison using both methods would provide better understanding of the corrosion resistance and integrity of the materials.

3. Results and Discussion

3.1. Microstructural Analysis

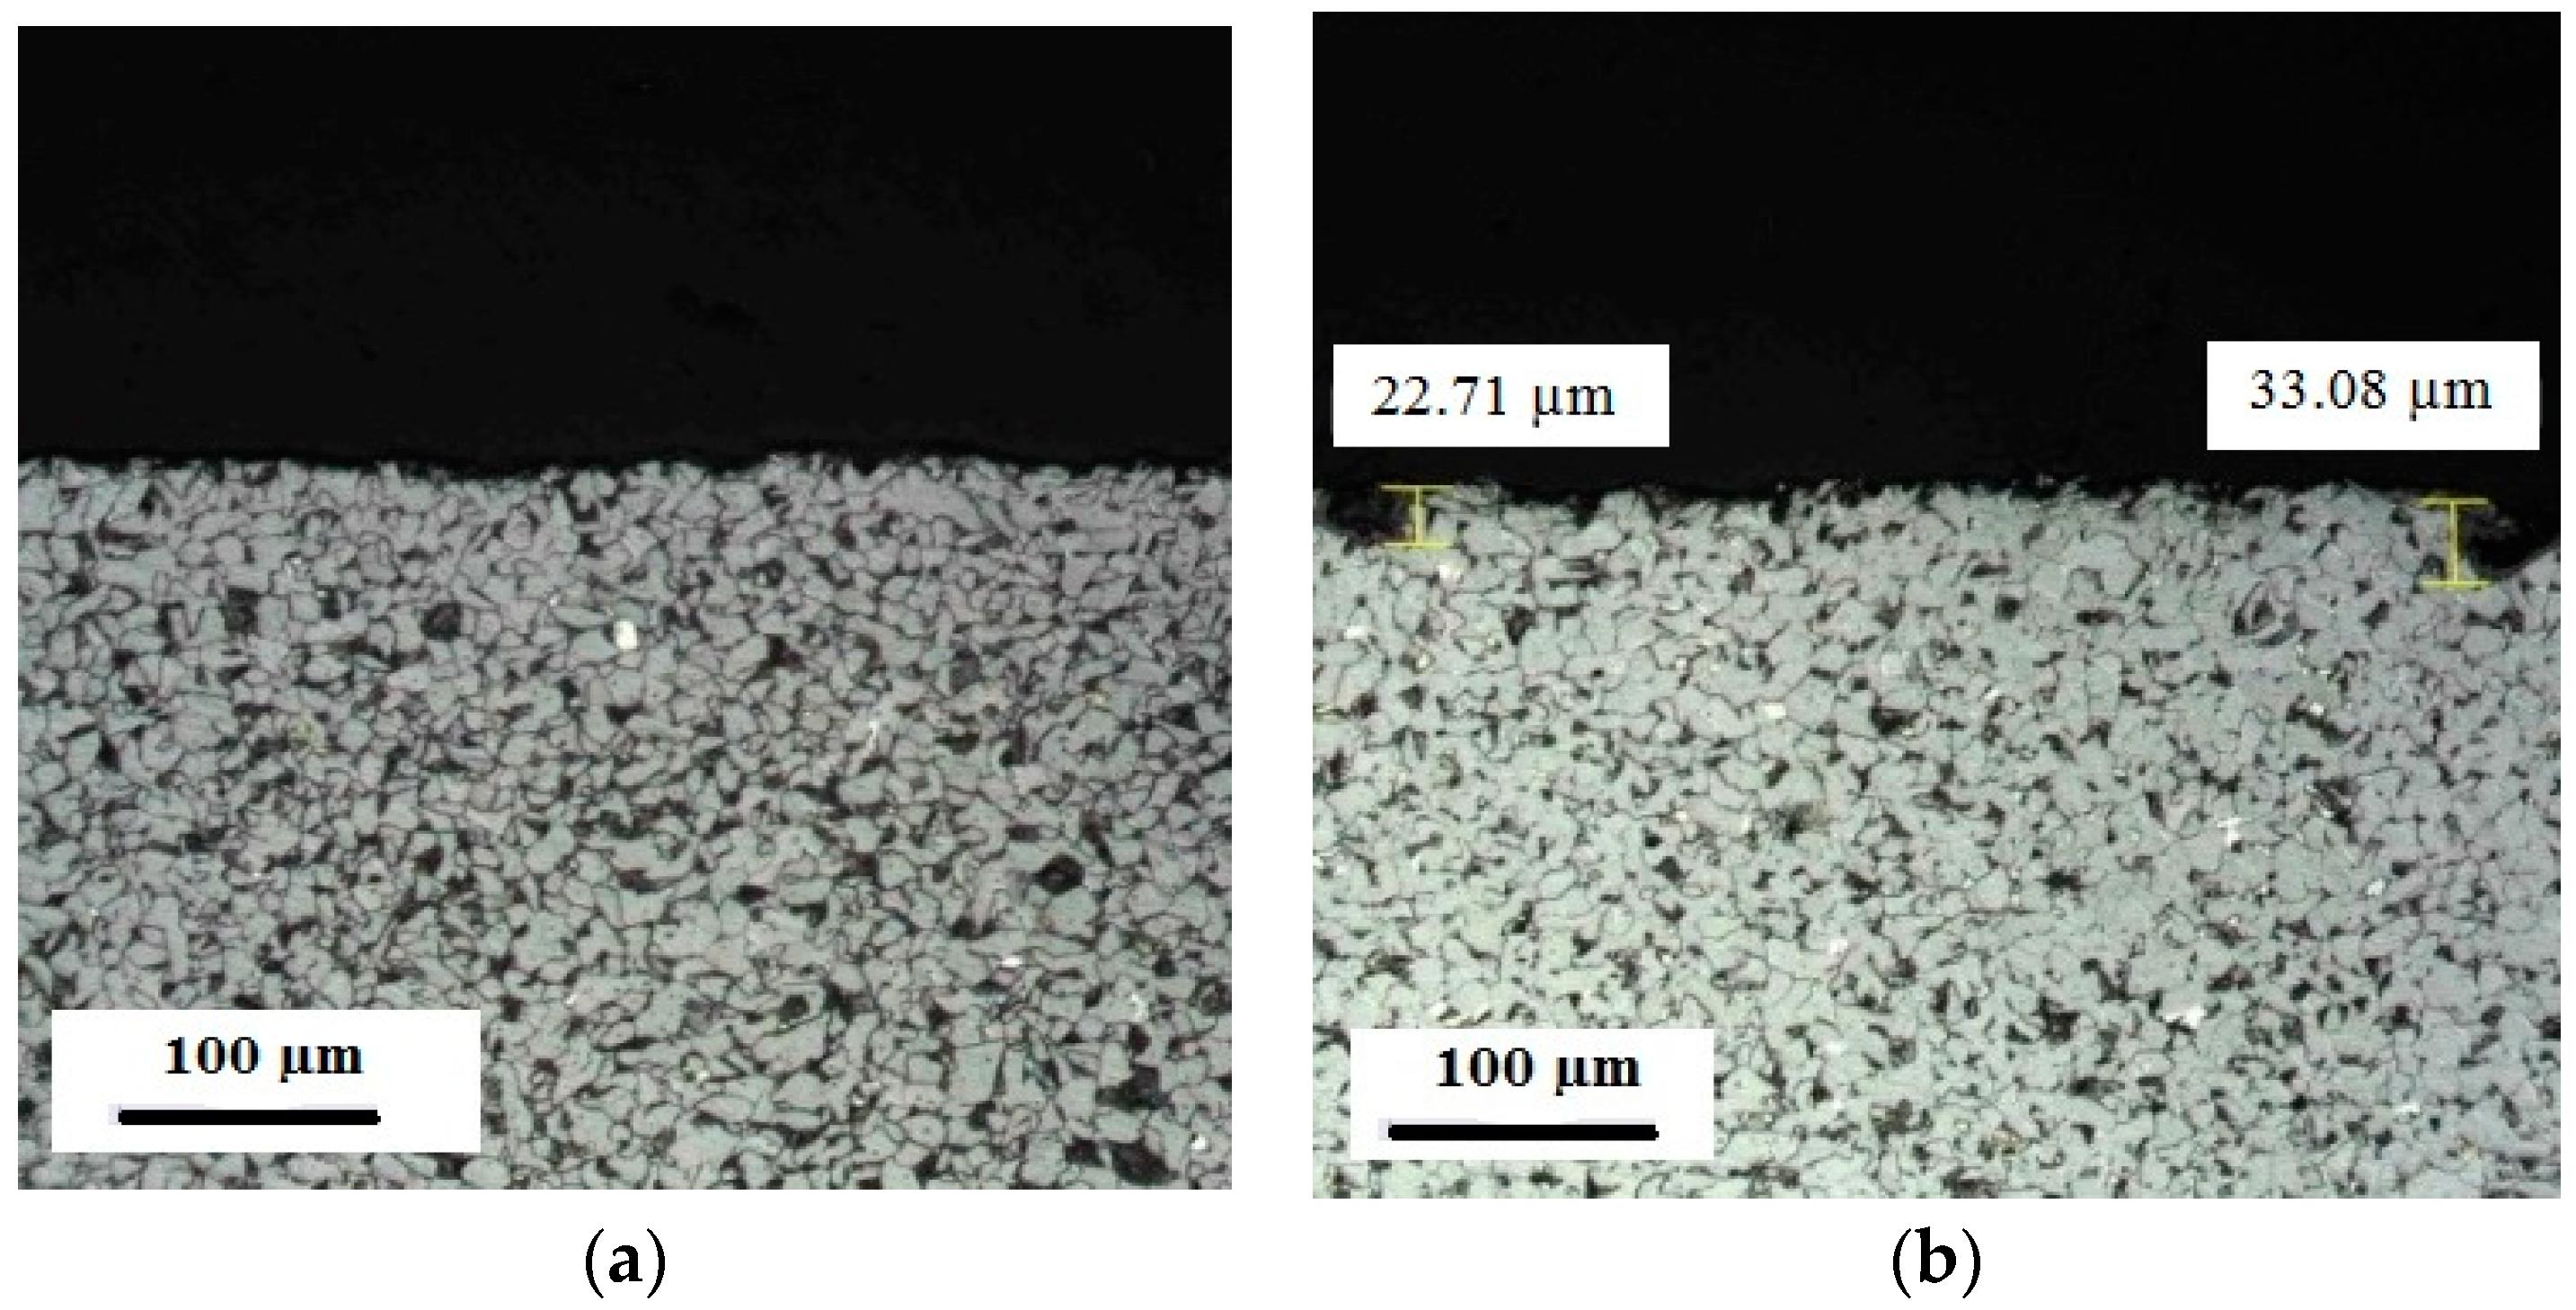
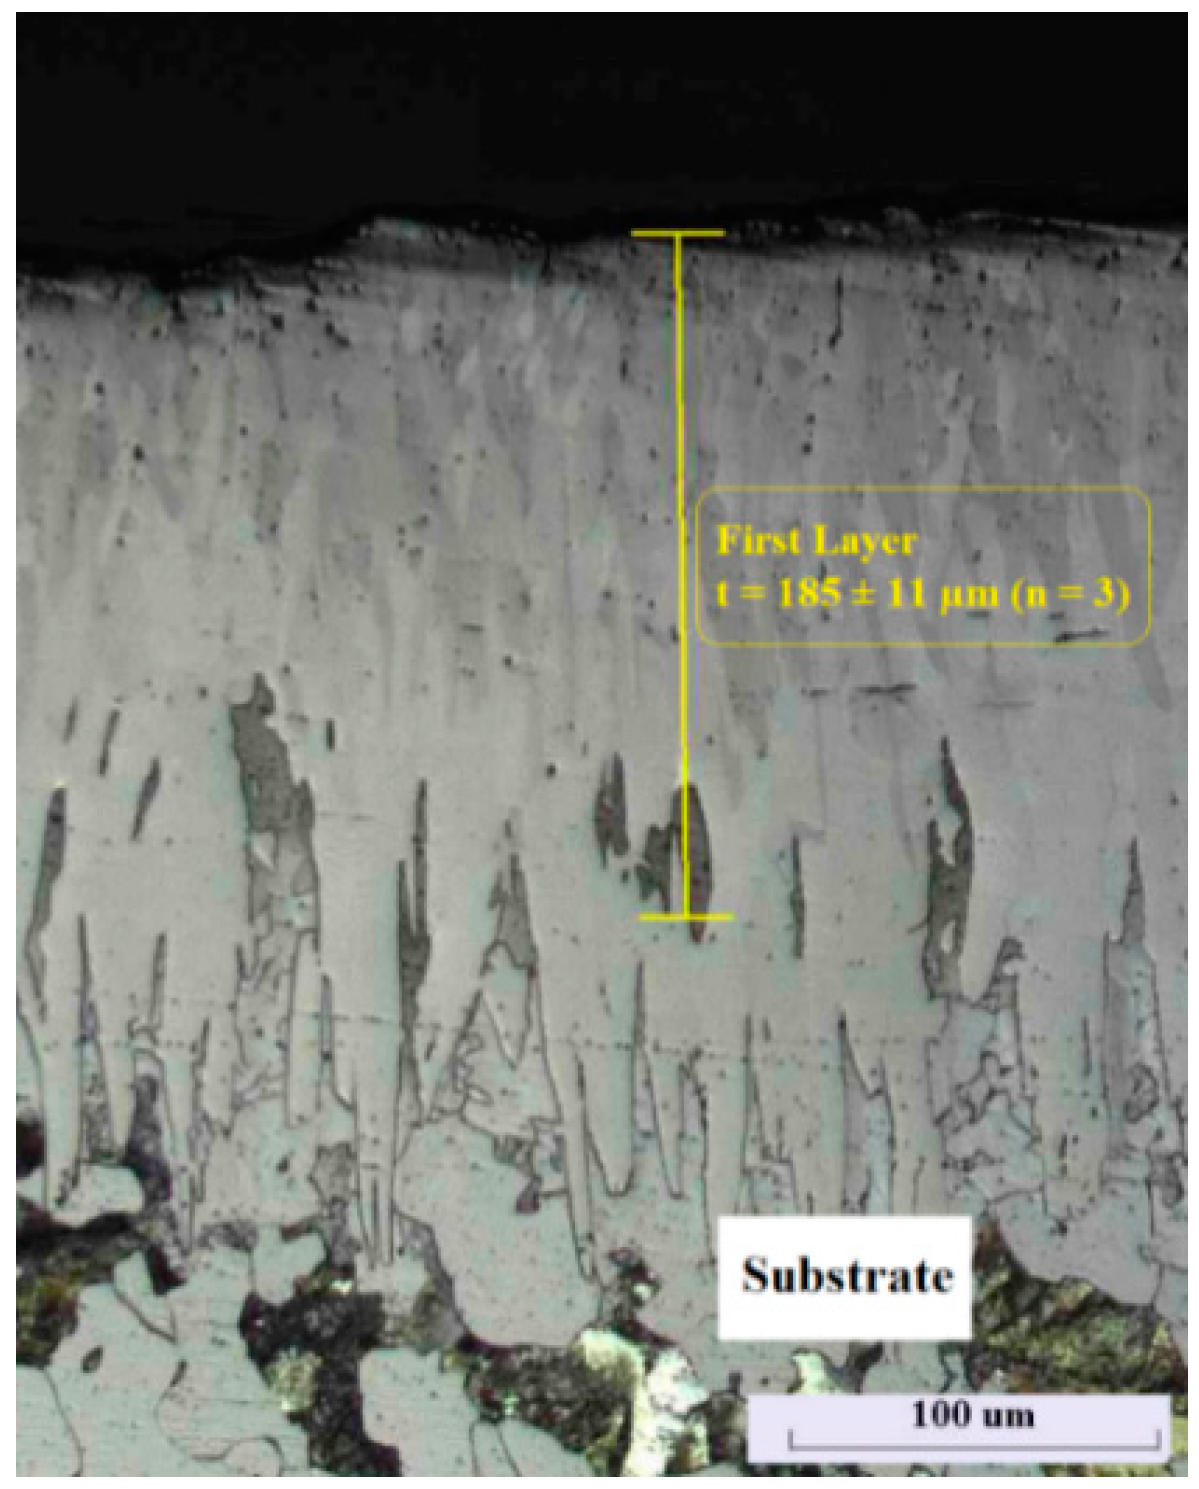
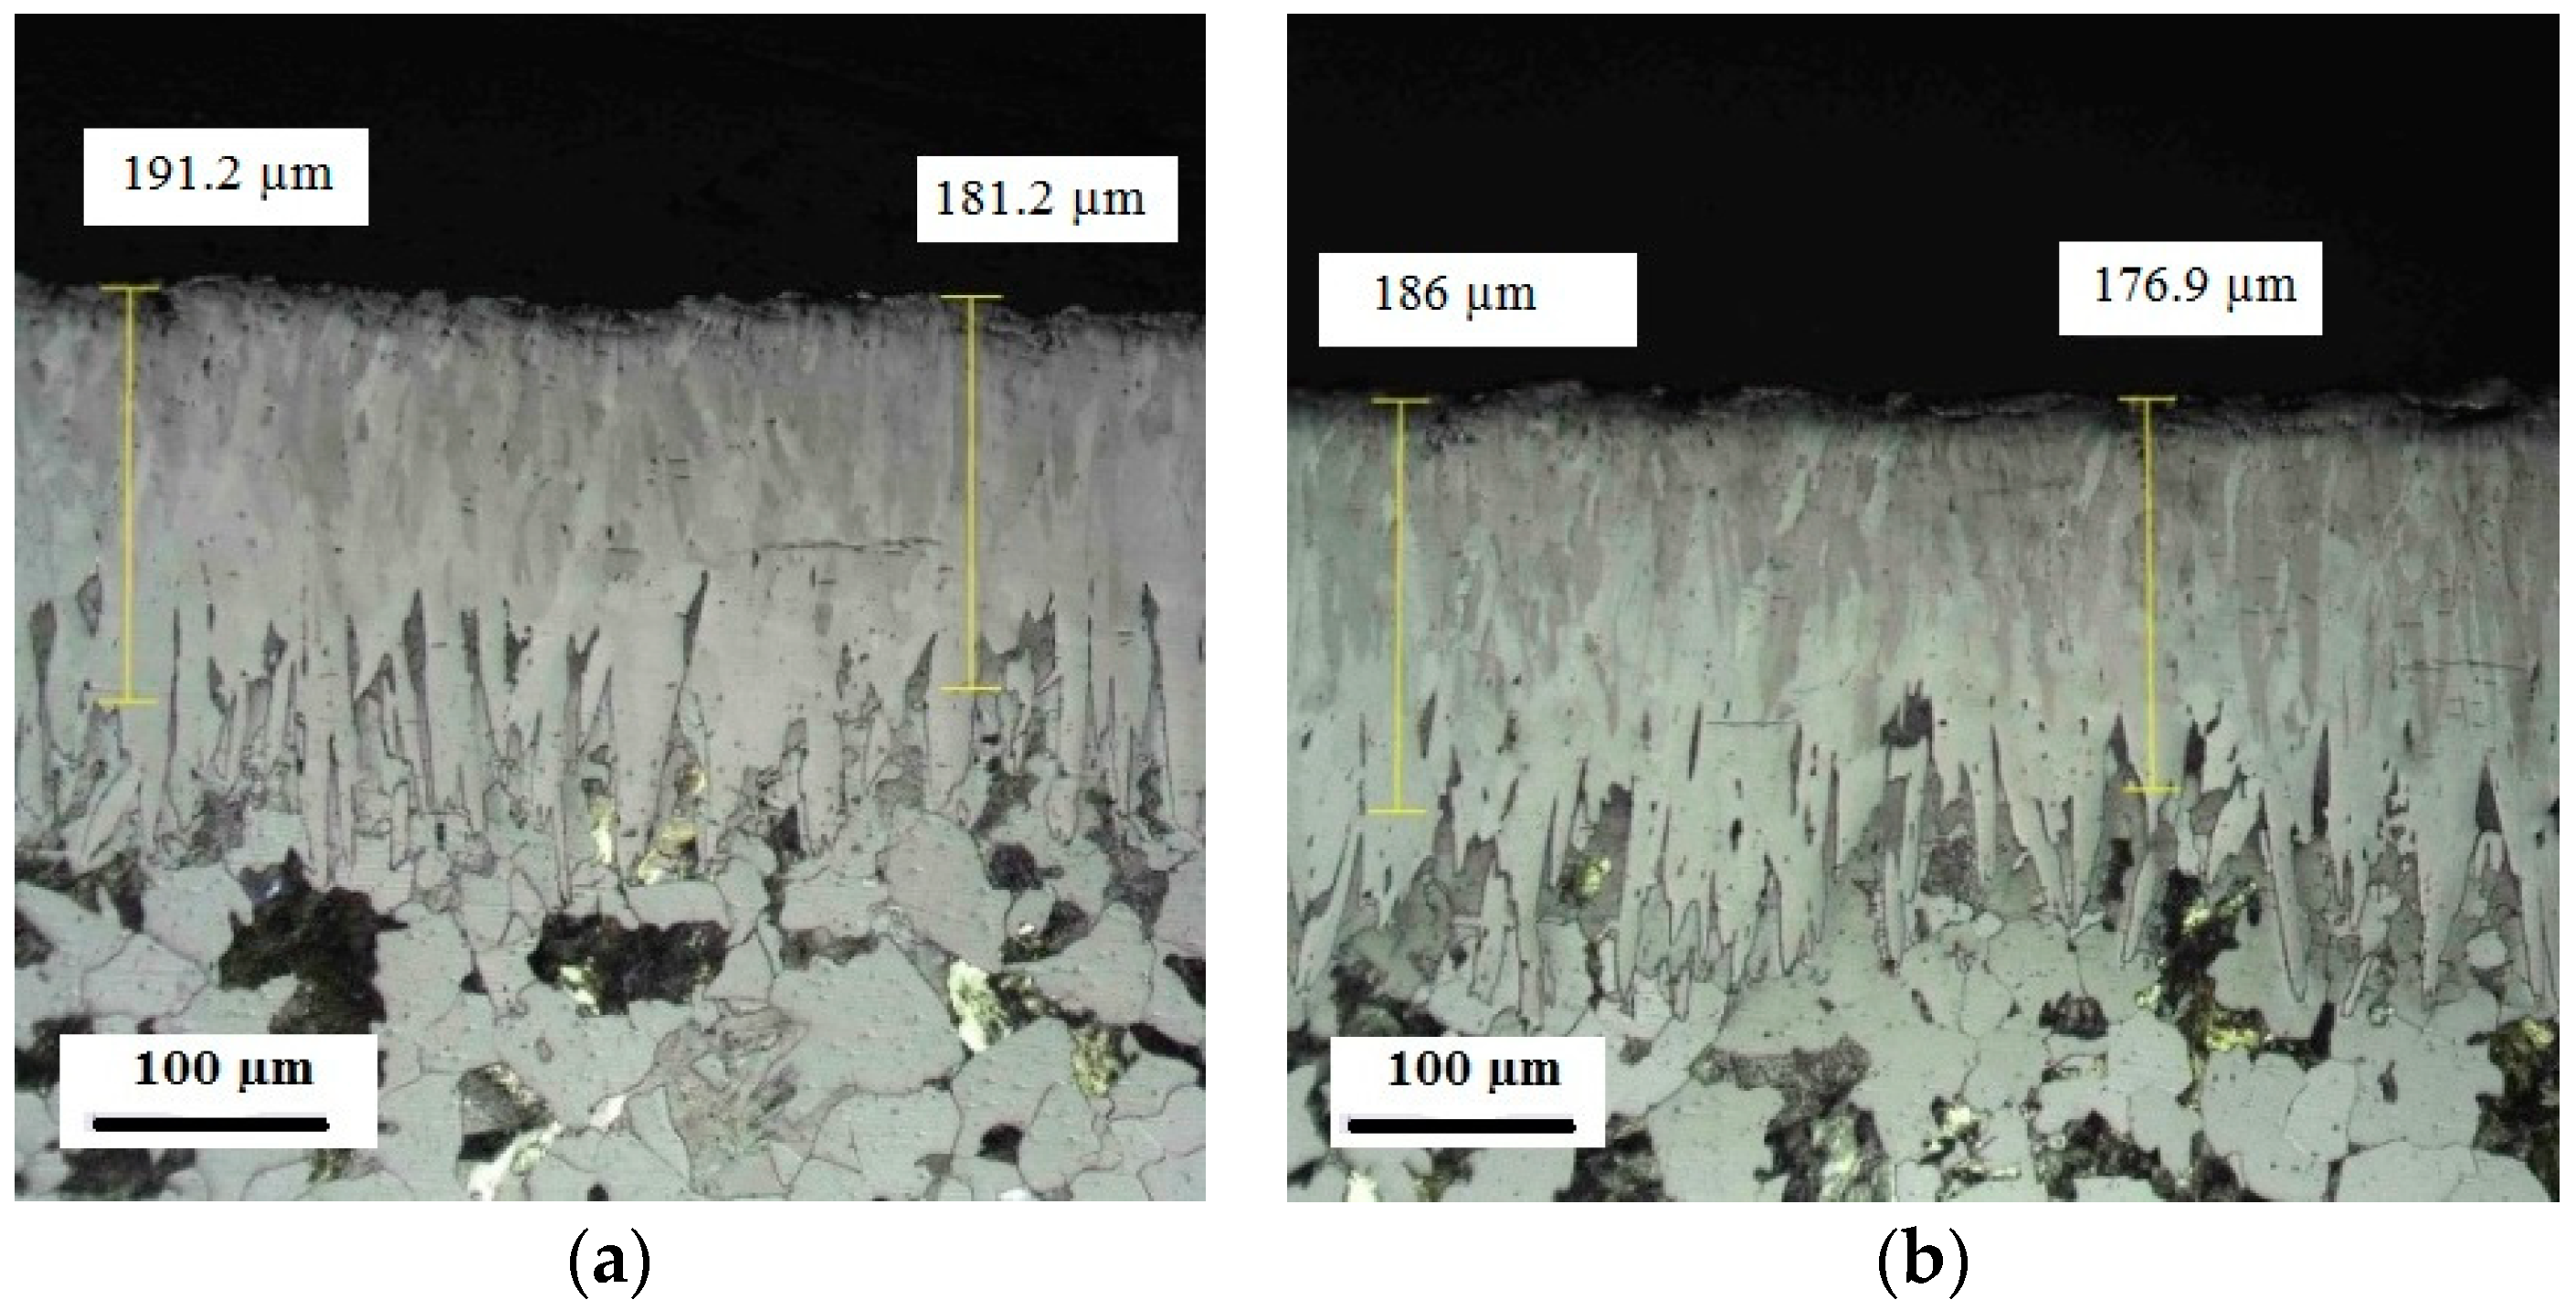
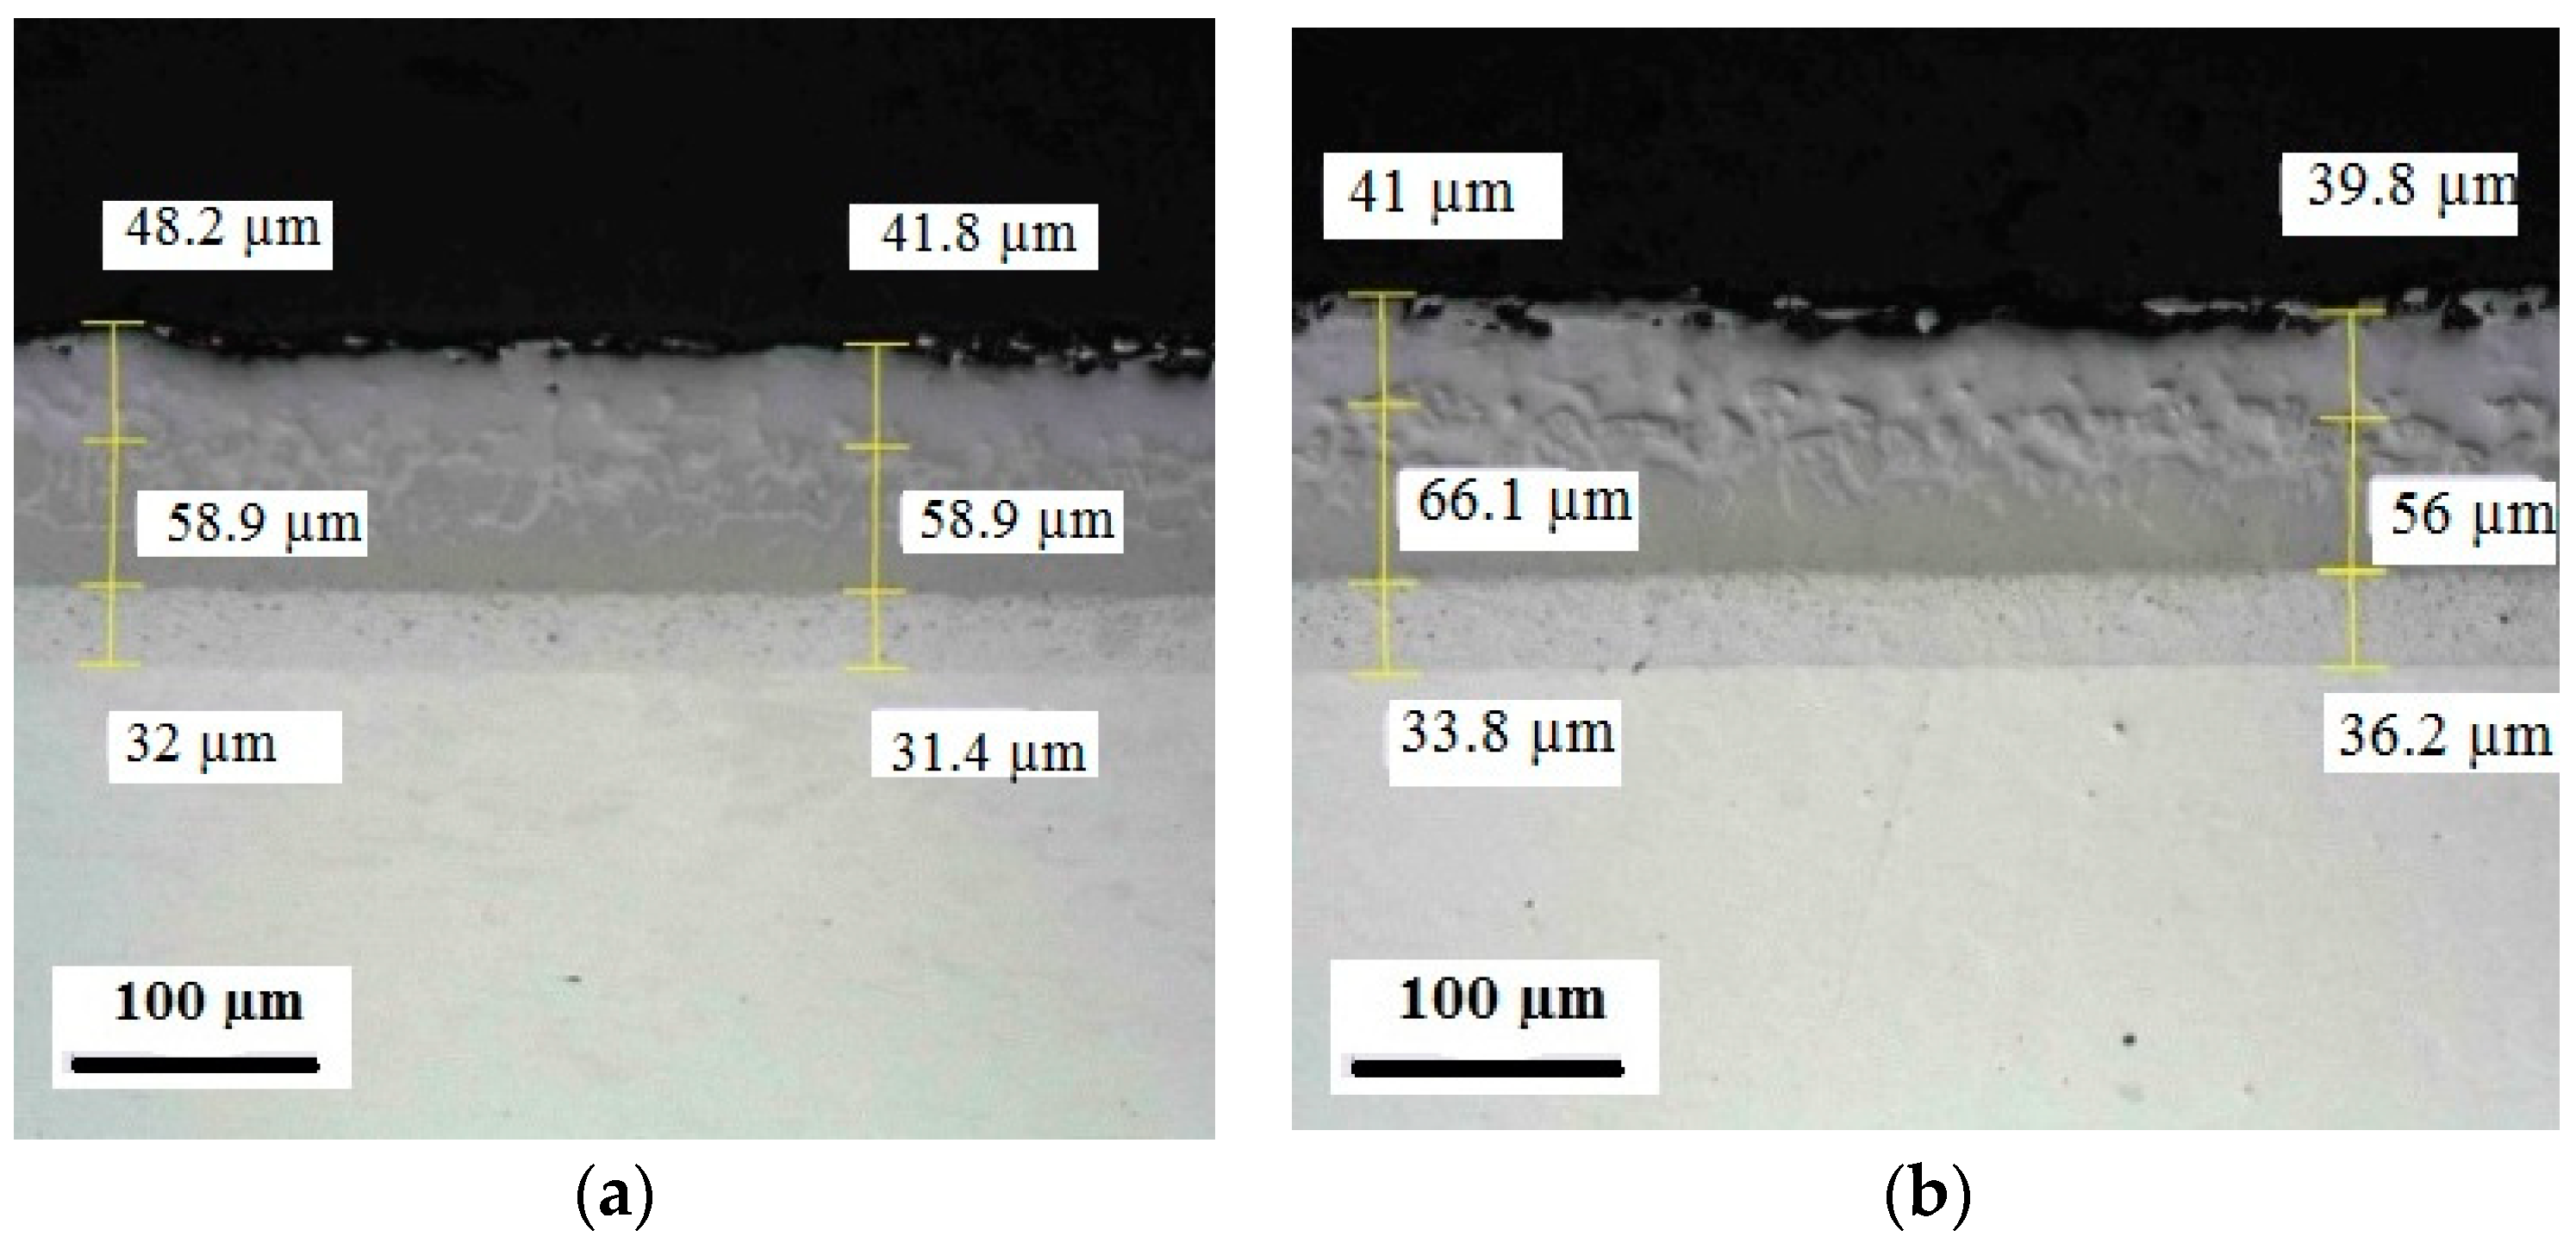
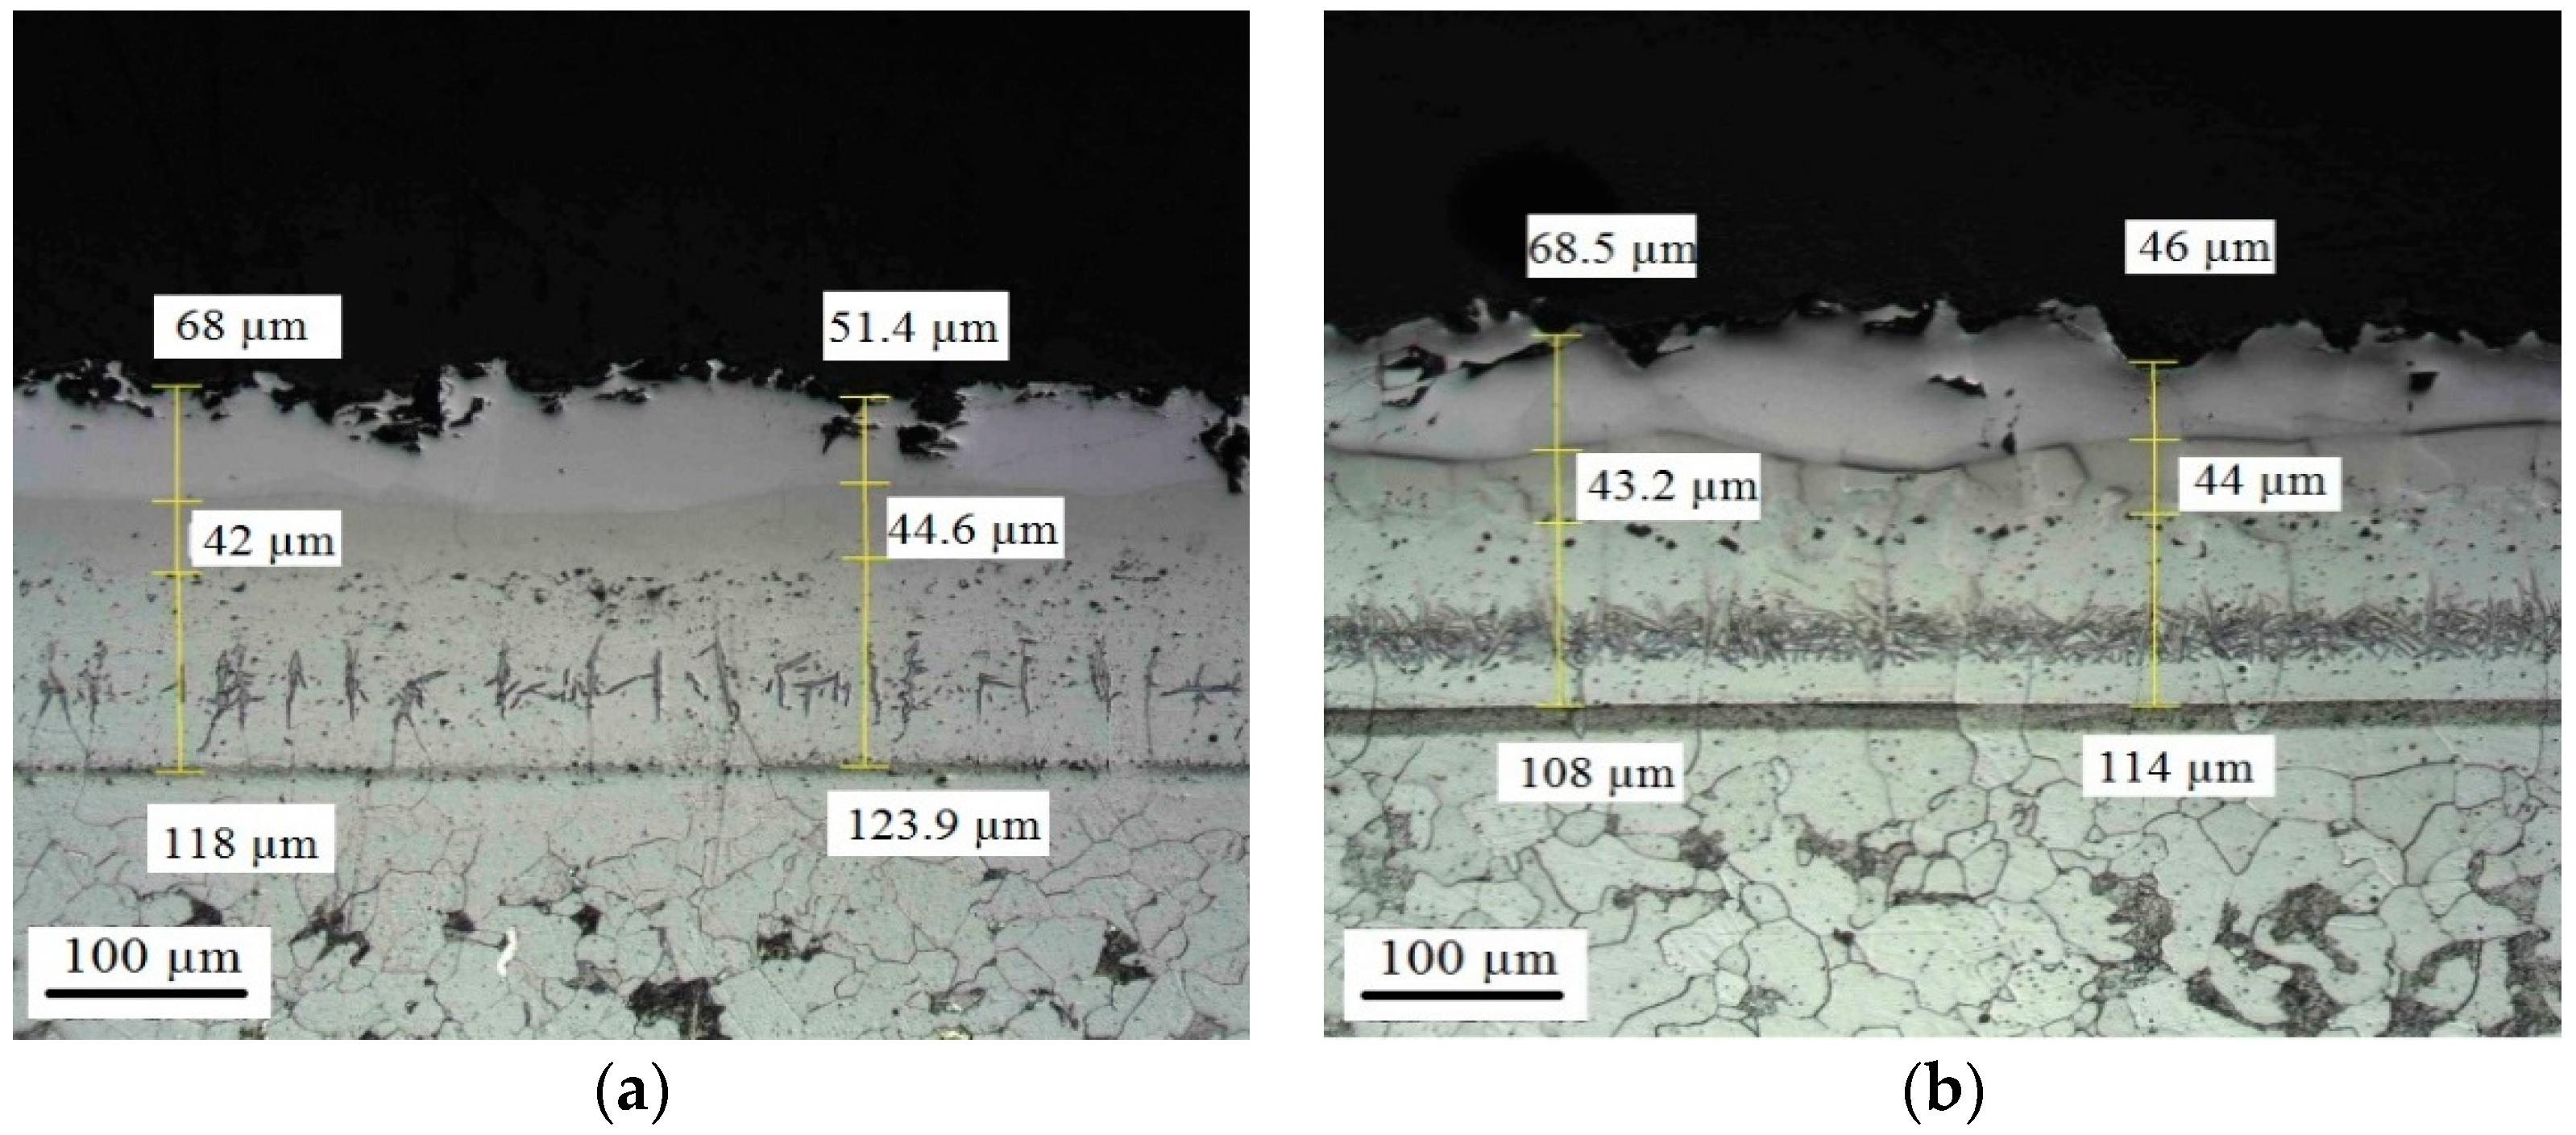
3.1.1. Coating Microstructure before Corrosive Attack

The obtained coatings had multi-layered architectures that were formed simultaneously during the thermal diffusion fabrication process (i.e., a few coating layers were formed through one heat treatment cycle). Besides, for some coatings, a thin top layer of either tin dioxide (SnO2) or partially stabilized zirconia (ZrO2) or boron nitride (BN) was applied as an additional step. Thus, the case depth consisted predominantly of a few layers, and the coating architecture depended on the type of the thermal diffusion process option (i.e., boronizing, aluminizing, or chromizing), substrate material, and whether the additional top layer was applied or not.
Figure 1 shows microstructure images of the aluminized low carbon steel and 316 stainless steel. For the aluminized samples, the top aluminum-rich aluminides layer contained 40–50 wt.% of Al. The subsequent inner aluminide layer (main layer) consisted of aluminides (Fe(Ni,Cr)xAly) with Al contents ranging 30–38 wt.%. In many cases, the area between the main aluminized layer and the Al-rich layer consisted of a mixture of the aluminides with different compositions. In some cases, as shown on Figure 1, a third layer with ~20–28 wt.% of Al could be observed. Finally, the transition layer with Al contents of ~3–8 wt.% was observed between the substrate and the actual protective layers contained the aluminides with sufficient Al contents. With regards to the transition zone, its composition and thickness varied depending on the steel composition. Thus, the transition layer for the aluminized carbon steel was very thin (only a few microns), while this layer for the aluminized stainless steel was significantly greater (approximately 60–70 µm). The difference between the thickness of the transition layer could be explained by the percentage of the contents of the alloying elements, such as Cr, Ni, and some others, in the steel, and their outward diffusion during the aluminizing process and limited inward diffusion of Al. Basically, the structure, thickness of the layers, and Al contents in each layer strongly depended on the substrate material, the features of the inward diffusion of Al and outward diffusion of Fe, Ni, and Cr, which resulted in the formation of aluminides with different compositions, i.e., with different Fe, Cr, Ni, and Al contents. Further discussion of the formation of the coating structure and composition is beyond the scope of the current study. The images of the structures of the aluminized samples with the additional top oxide layers were not shown since these top layers are very thin (a few microns) and could not be well visible at the selected (200×) magnification (they were analyzed in the unpublished ETI work).
Figure 2 shows the microstructure of chromized carbon steel and 316 stainless steel. While the chromized carbon steel consisted of two well-visible layers with different compositions of the formed chromides (the top layer had Cr-rich chromides), the chromized 316 stainless steel had a significantly larger protective layer (greater than 100 µm) with rather homogeneous composition. The latter can be explained by the sufficient content of Cr in the stainless steel. In this case, Cr from the gas phase diffused into the substrate, while Cr from the substrate diffused from the opposite side, and, as a result of the inward-outward diffusion of Cr, two chromide layers with rather close contents of Cr may be observed.
Figure 3 shows the microstructure images of the boronized carbon steel (CS) substrates. This coating consisted of two phases, Fe2B (near the substrate) and FeB as the outer layer, and it had a “saw-tooth” morphology. The features of the boronized coating formation, its composition, and structure have been described elsewhere [41]. For the samples with an additional thin coating layer (boron nitride and zirconia) applied on the top of the boronized coating, this top layer was not fully visible on the cross-section image at the selected magnification (200×) from the light optical microscope; thus, the microstructure images of these samples were not shown.

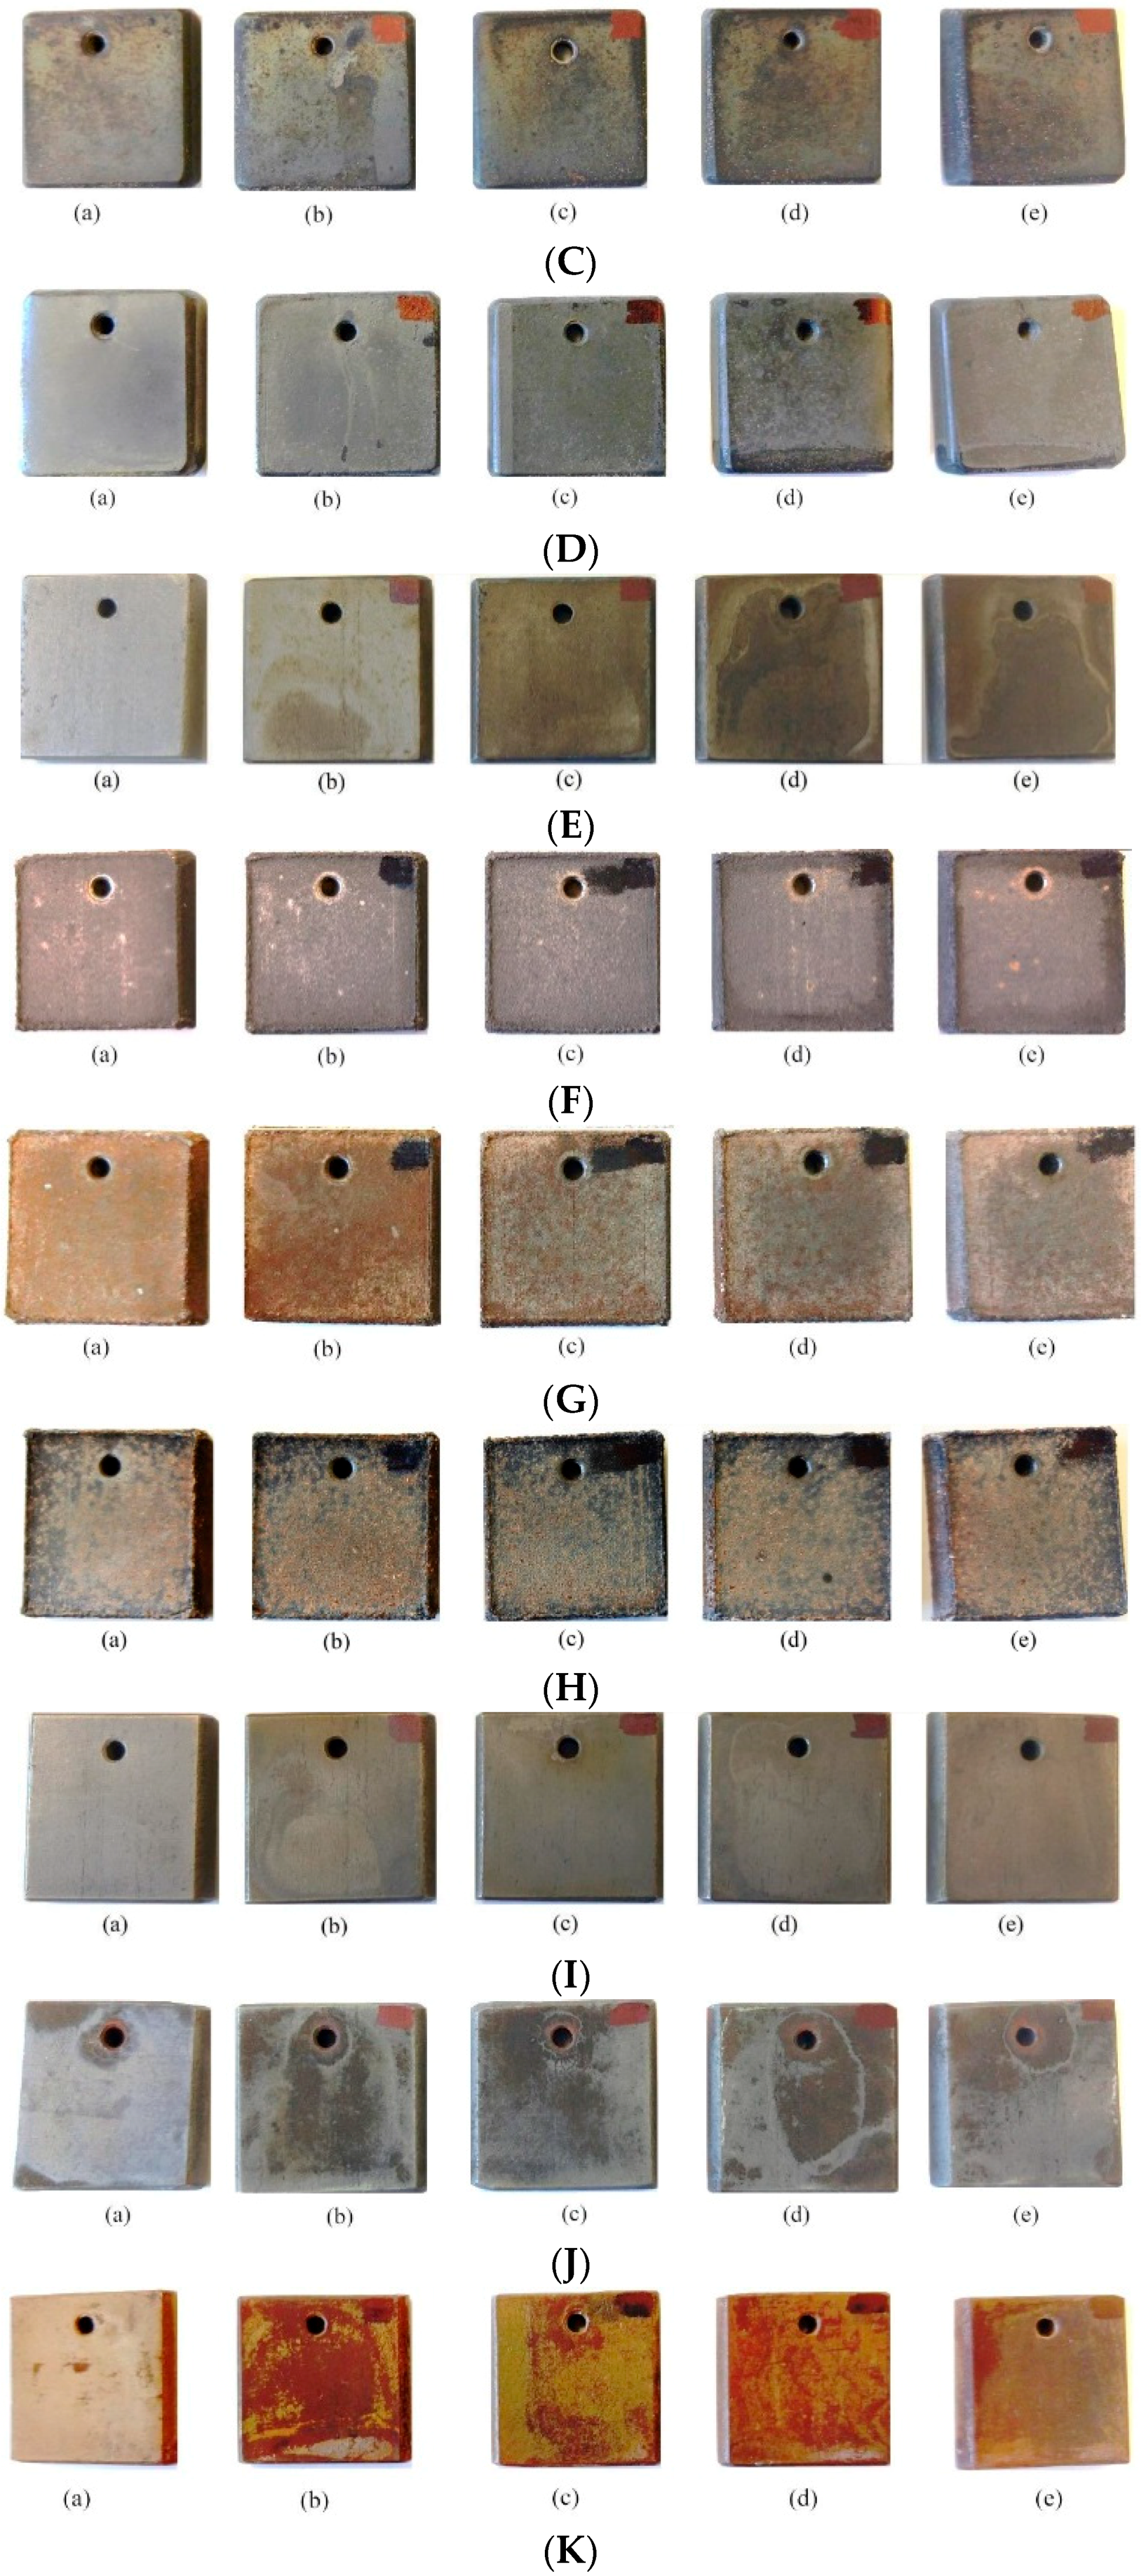
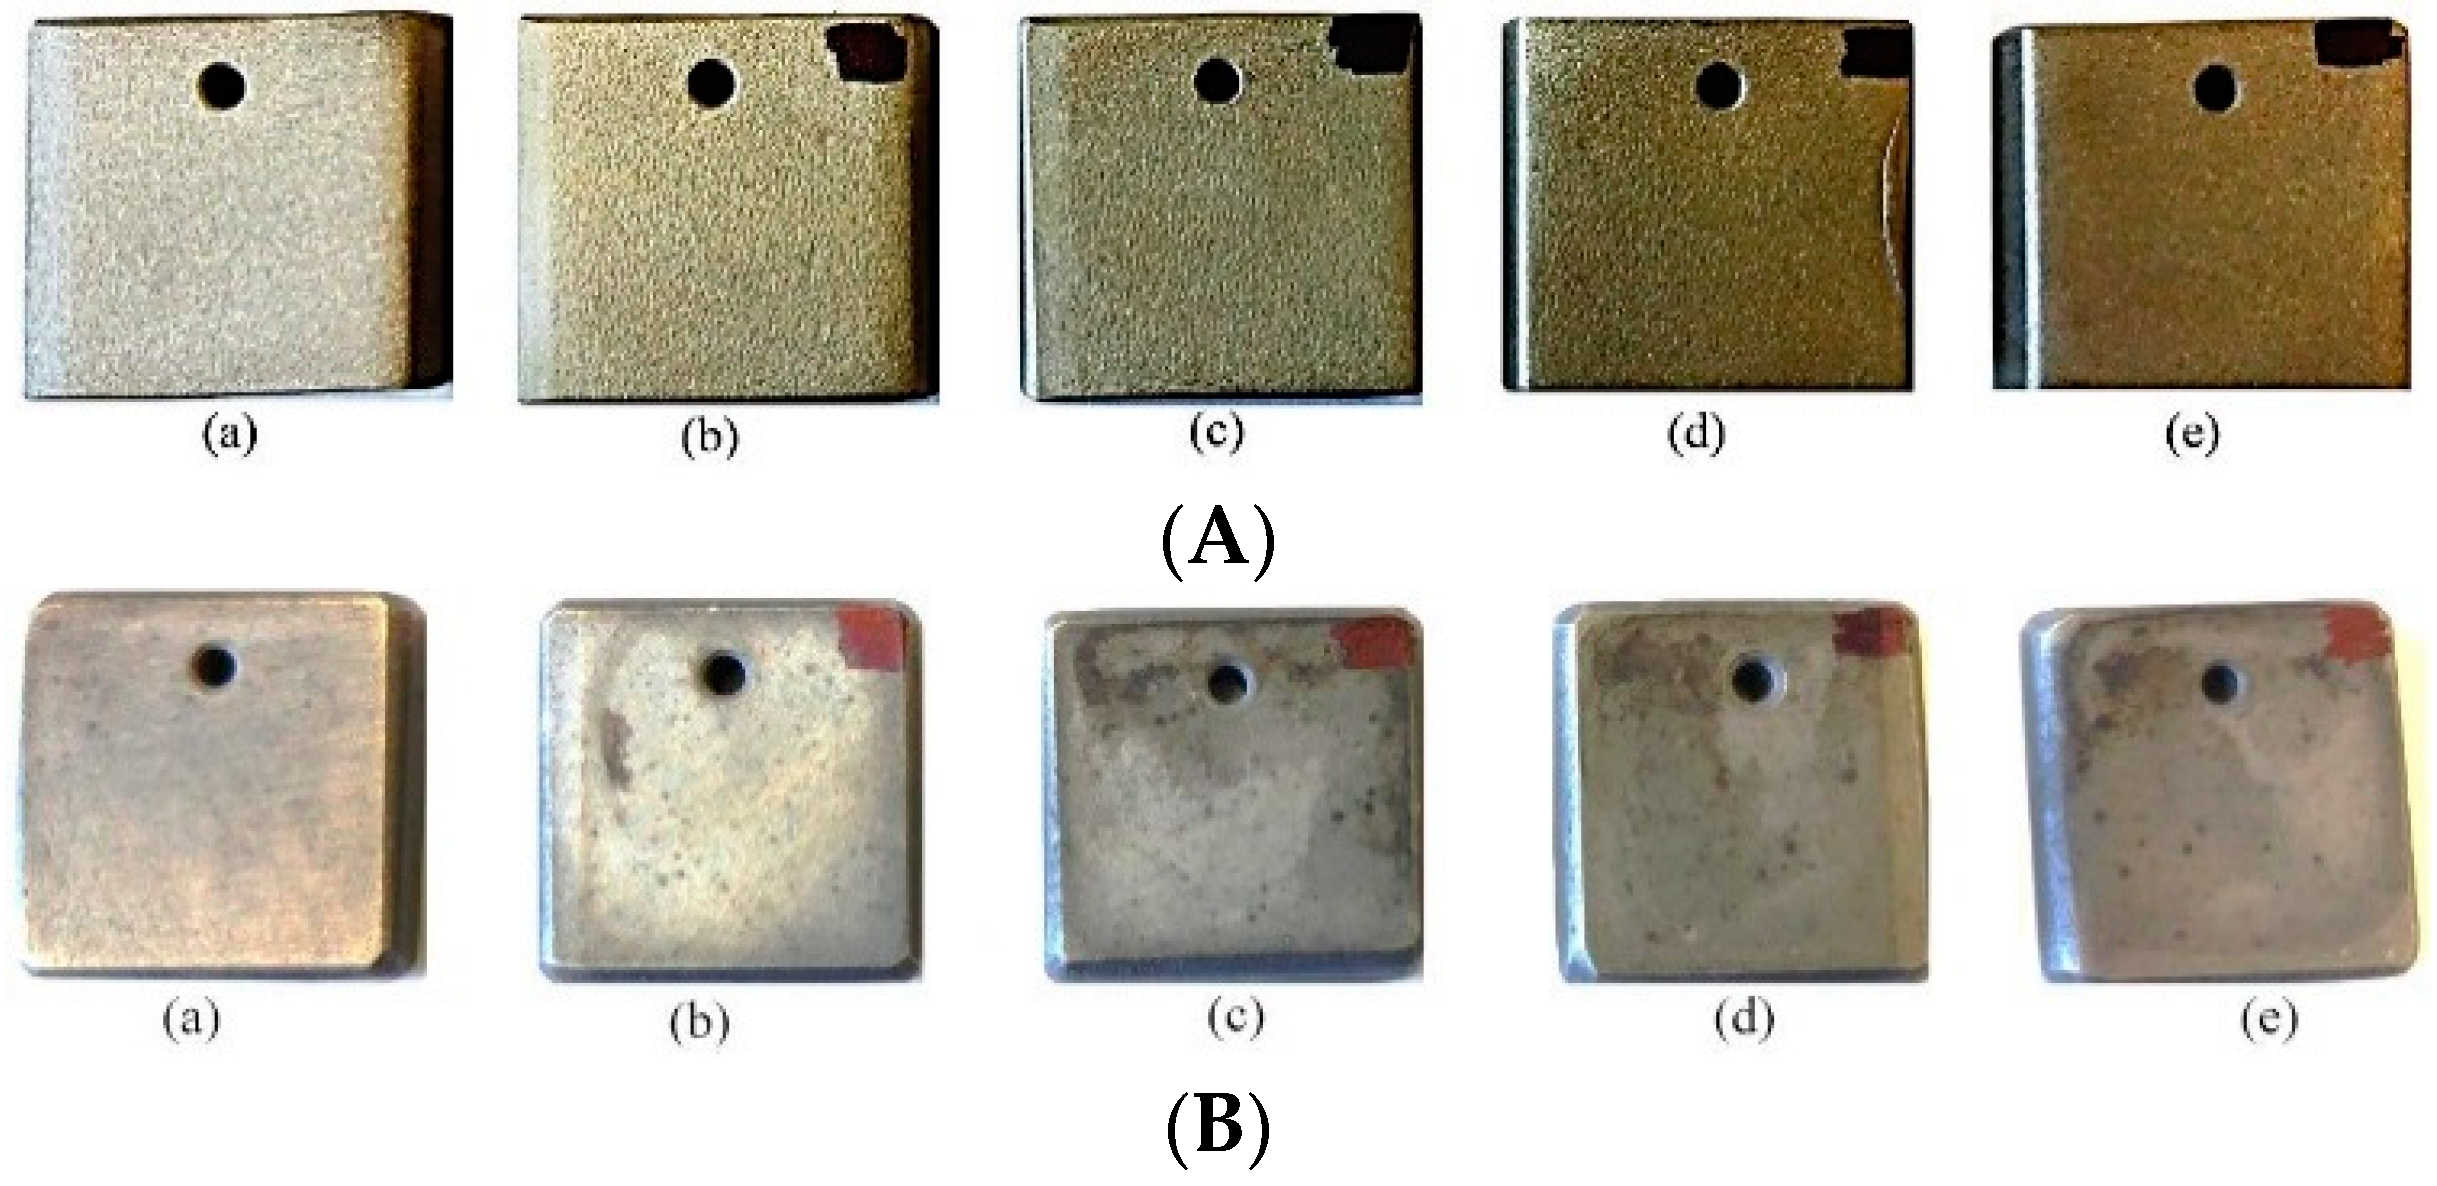
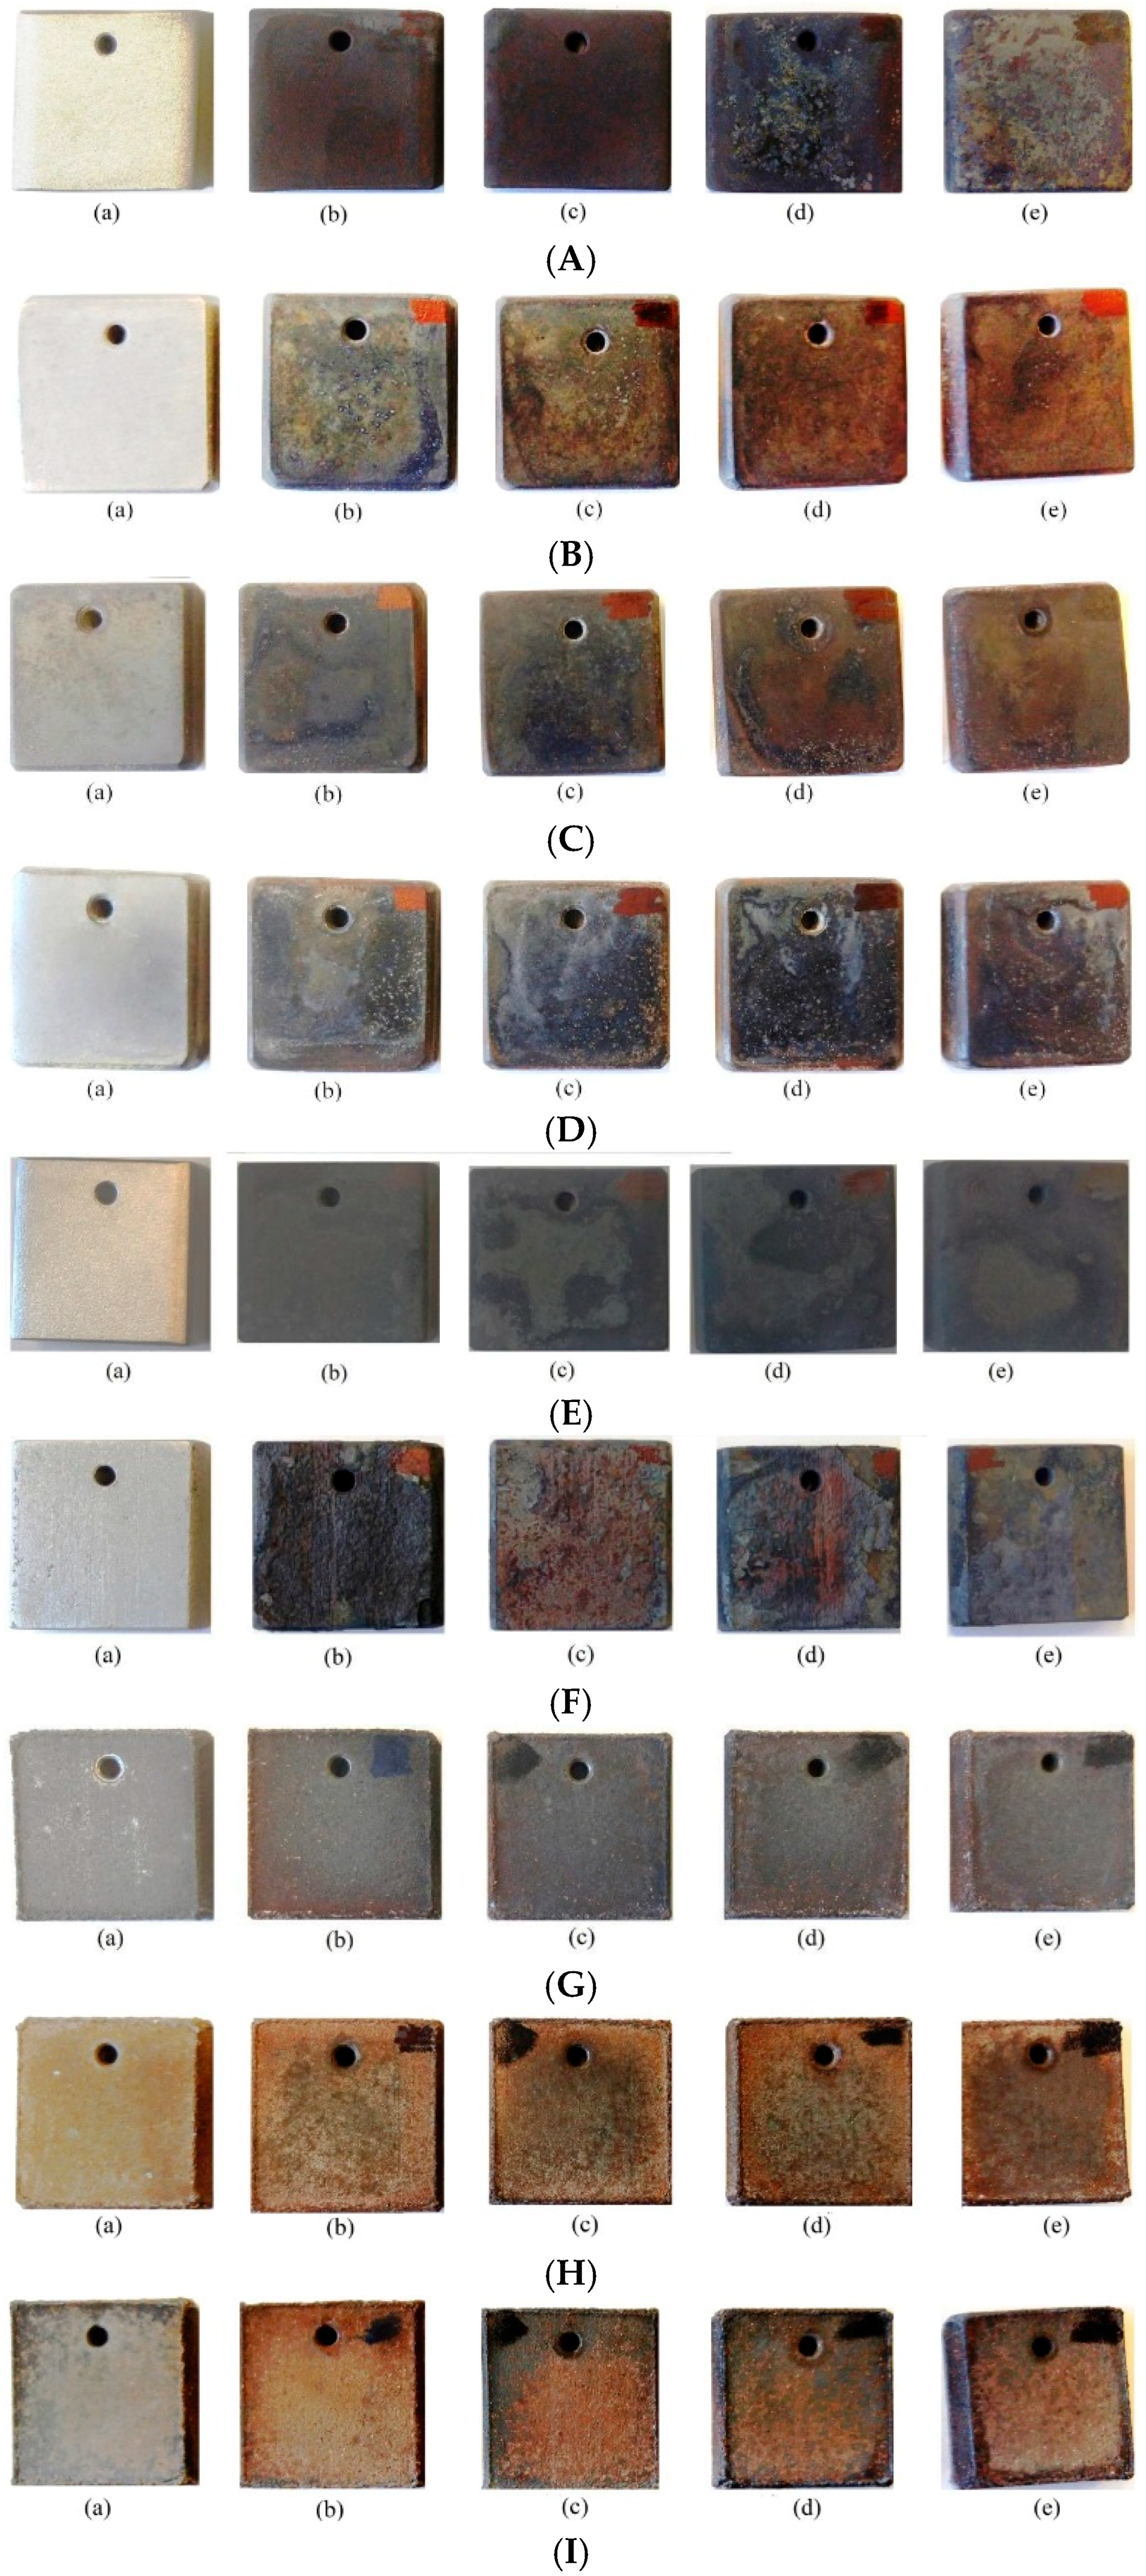
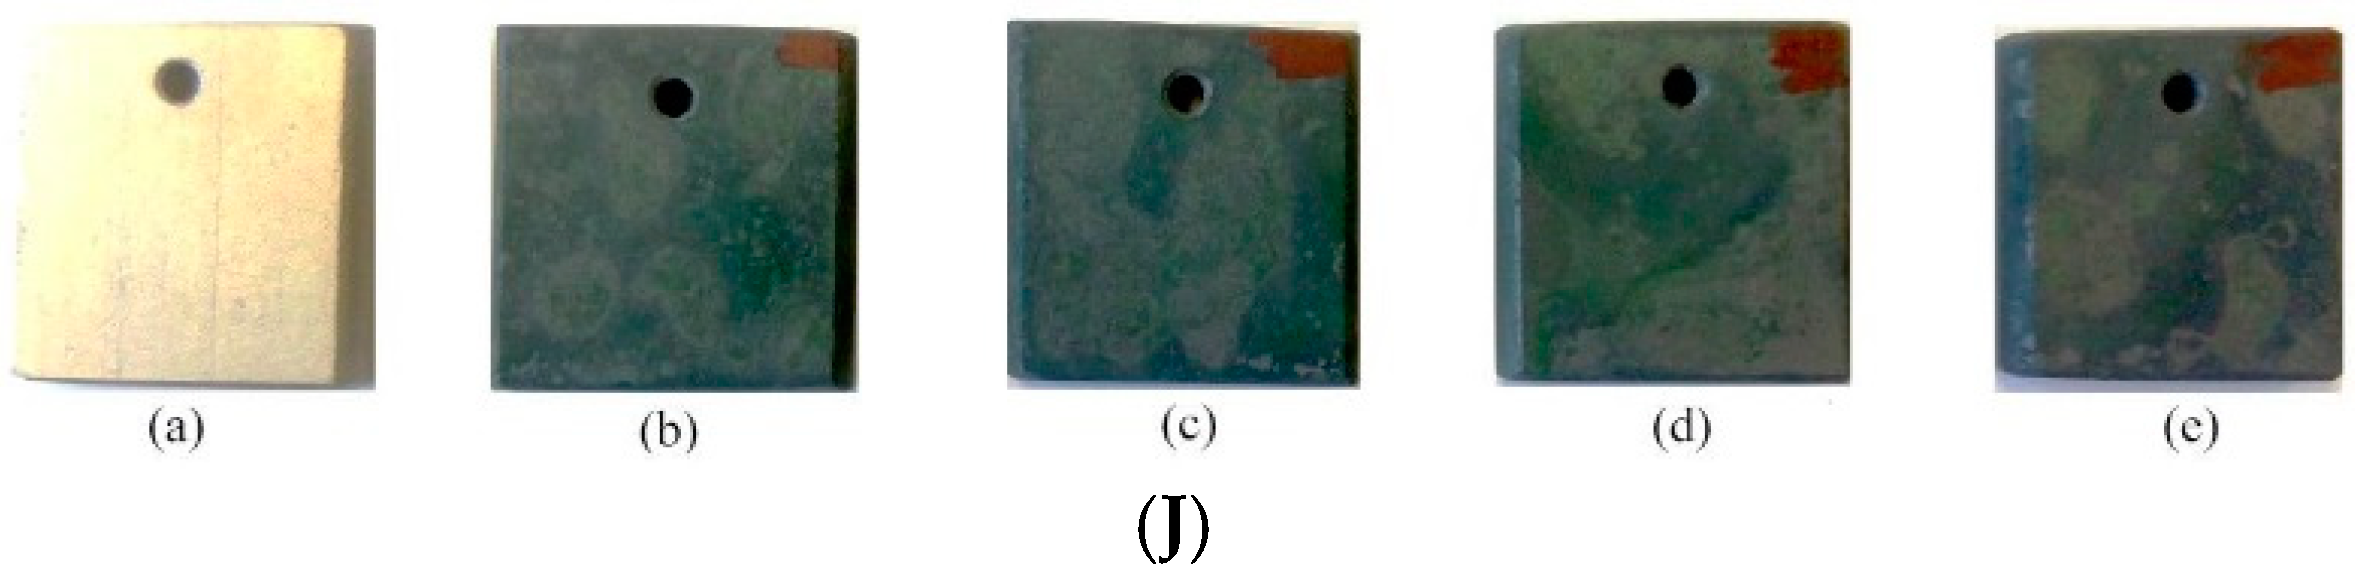
3.1.2. Qualitative Comparison of Top Surface of Samples (Appearance) after Corrosive Attack

In order to provide a qualitative comparison of the samples after the corrosive attack, macroscopic imaging of the top surface of the samples was conducted before mounting them in epoxy. Therefore, macroscopic degradation, if any, due to corrosive attack could be observed. The images of the samples before and after exposure in the corrosion environment conducted according to the tabulated test method (see Table 2) are presented in Figure A1 and Figure A2 in Appendix A. The black mark on the top right- or left-hand side of the samples was painted to indicate the surface that was exposed to the hot corrosive environment. In the figure, the changes of the samples as represented (a) before the corrosion tests, (b) after 24 h, (c) after 48 h, (d) after 96 h, and (e) after 168 h of exposure to the simulated corrosive environment are shown.
Most of the samples changed their colors after the exposure that was related to the surface oxidation. Greater discoloration was observed after high-temperature exposure. However, no blistering, pitting, surface cracking, delamination, and peeling-off was observed for the samples with the protective coatings, even after high-temperature corrosive attack. Considering the aluminized and chromized coatings, it was unlikely that these intermetallides would oxidize at the low-temperature (220 °C) test conditions with formation of “measurable” oxide films, since these intermetallides are rather stable and inert. Therefore, their oxidation had only a superficial effect. On the contrary, the boronized coatings oxidized to a greater extent at 220 °C with formation of the iron-boron oxide film that may be of the “glassy” nature (boron oxide is known as a glassy-forming oxide). However, this oxide film was not easy visible yet even at high magnifications under optical microscope. The simulated salt, as expected, did not melt at 220 °C, and its attack was negligible. At the high-temperature (600 °C) testing conditions, slight oxidation of the aluminized and chromized coatings occurred resulting in the formation of the thin Al2O3 and Cr2O3 films. These oxides had, as is well known, high thermal stability and chemical inertness [52,53]. Therefore, these films, which were well-adhered to the diffusion coatings, protecting these coatings from further oxidation and chemical attack of the molten salt. The additional thin layers of SnO2, ZrO2 and BN applied onto some coatings also protected the boronized and aluminized coatings against oxidation and interaction with the simulated salt, regardless of the low-temperature (unmolten salt) or the high-temperature (molten salt) corrosive attacks. Although, as expected, the adhesion of the molten salt (at 600 °C) to the samples was significantly higher than the adhesion of the unmolten salt (at 220 °C), the coated samples could be easy washed from the residue of the molten salt without visible damage of the coating that may be considered as a positive point.
As opposed to the coated steel samples, a thin scale of the rust could be observed on bare carbon steel samples even after exposure at 220 °C, and this rusting was significantly larger after the exposure at 600 °C. While the surface of stainless steel samples did not have visible rusting after low-temperature testing, the rusting issue was clearly observed after the high-temperature exposure, however, to a significantly less extent compared to low carbon steel. The formed rusting layer was rather soft and porous, loosely adhered to the original steel, and it could be detached from the surface, especially in the case of carbon steel and after longer exposures. The thicknesses of the soft rusting layers were uneven. This matter will be further discussed in the sections related to the materials’ microstructure examination with demonstration of the thickness of the rusting for the bare steel samples. The spallation issue for the steels at high-temperature oxidation or corrosion-oxidation is generally obvious and described in numerous literature sources [54,55]. Because of the delamination issue with the uncoated materials, including stainless steels, it can be expected that the scale formation may grow with extension of the exposure time.

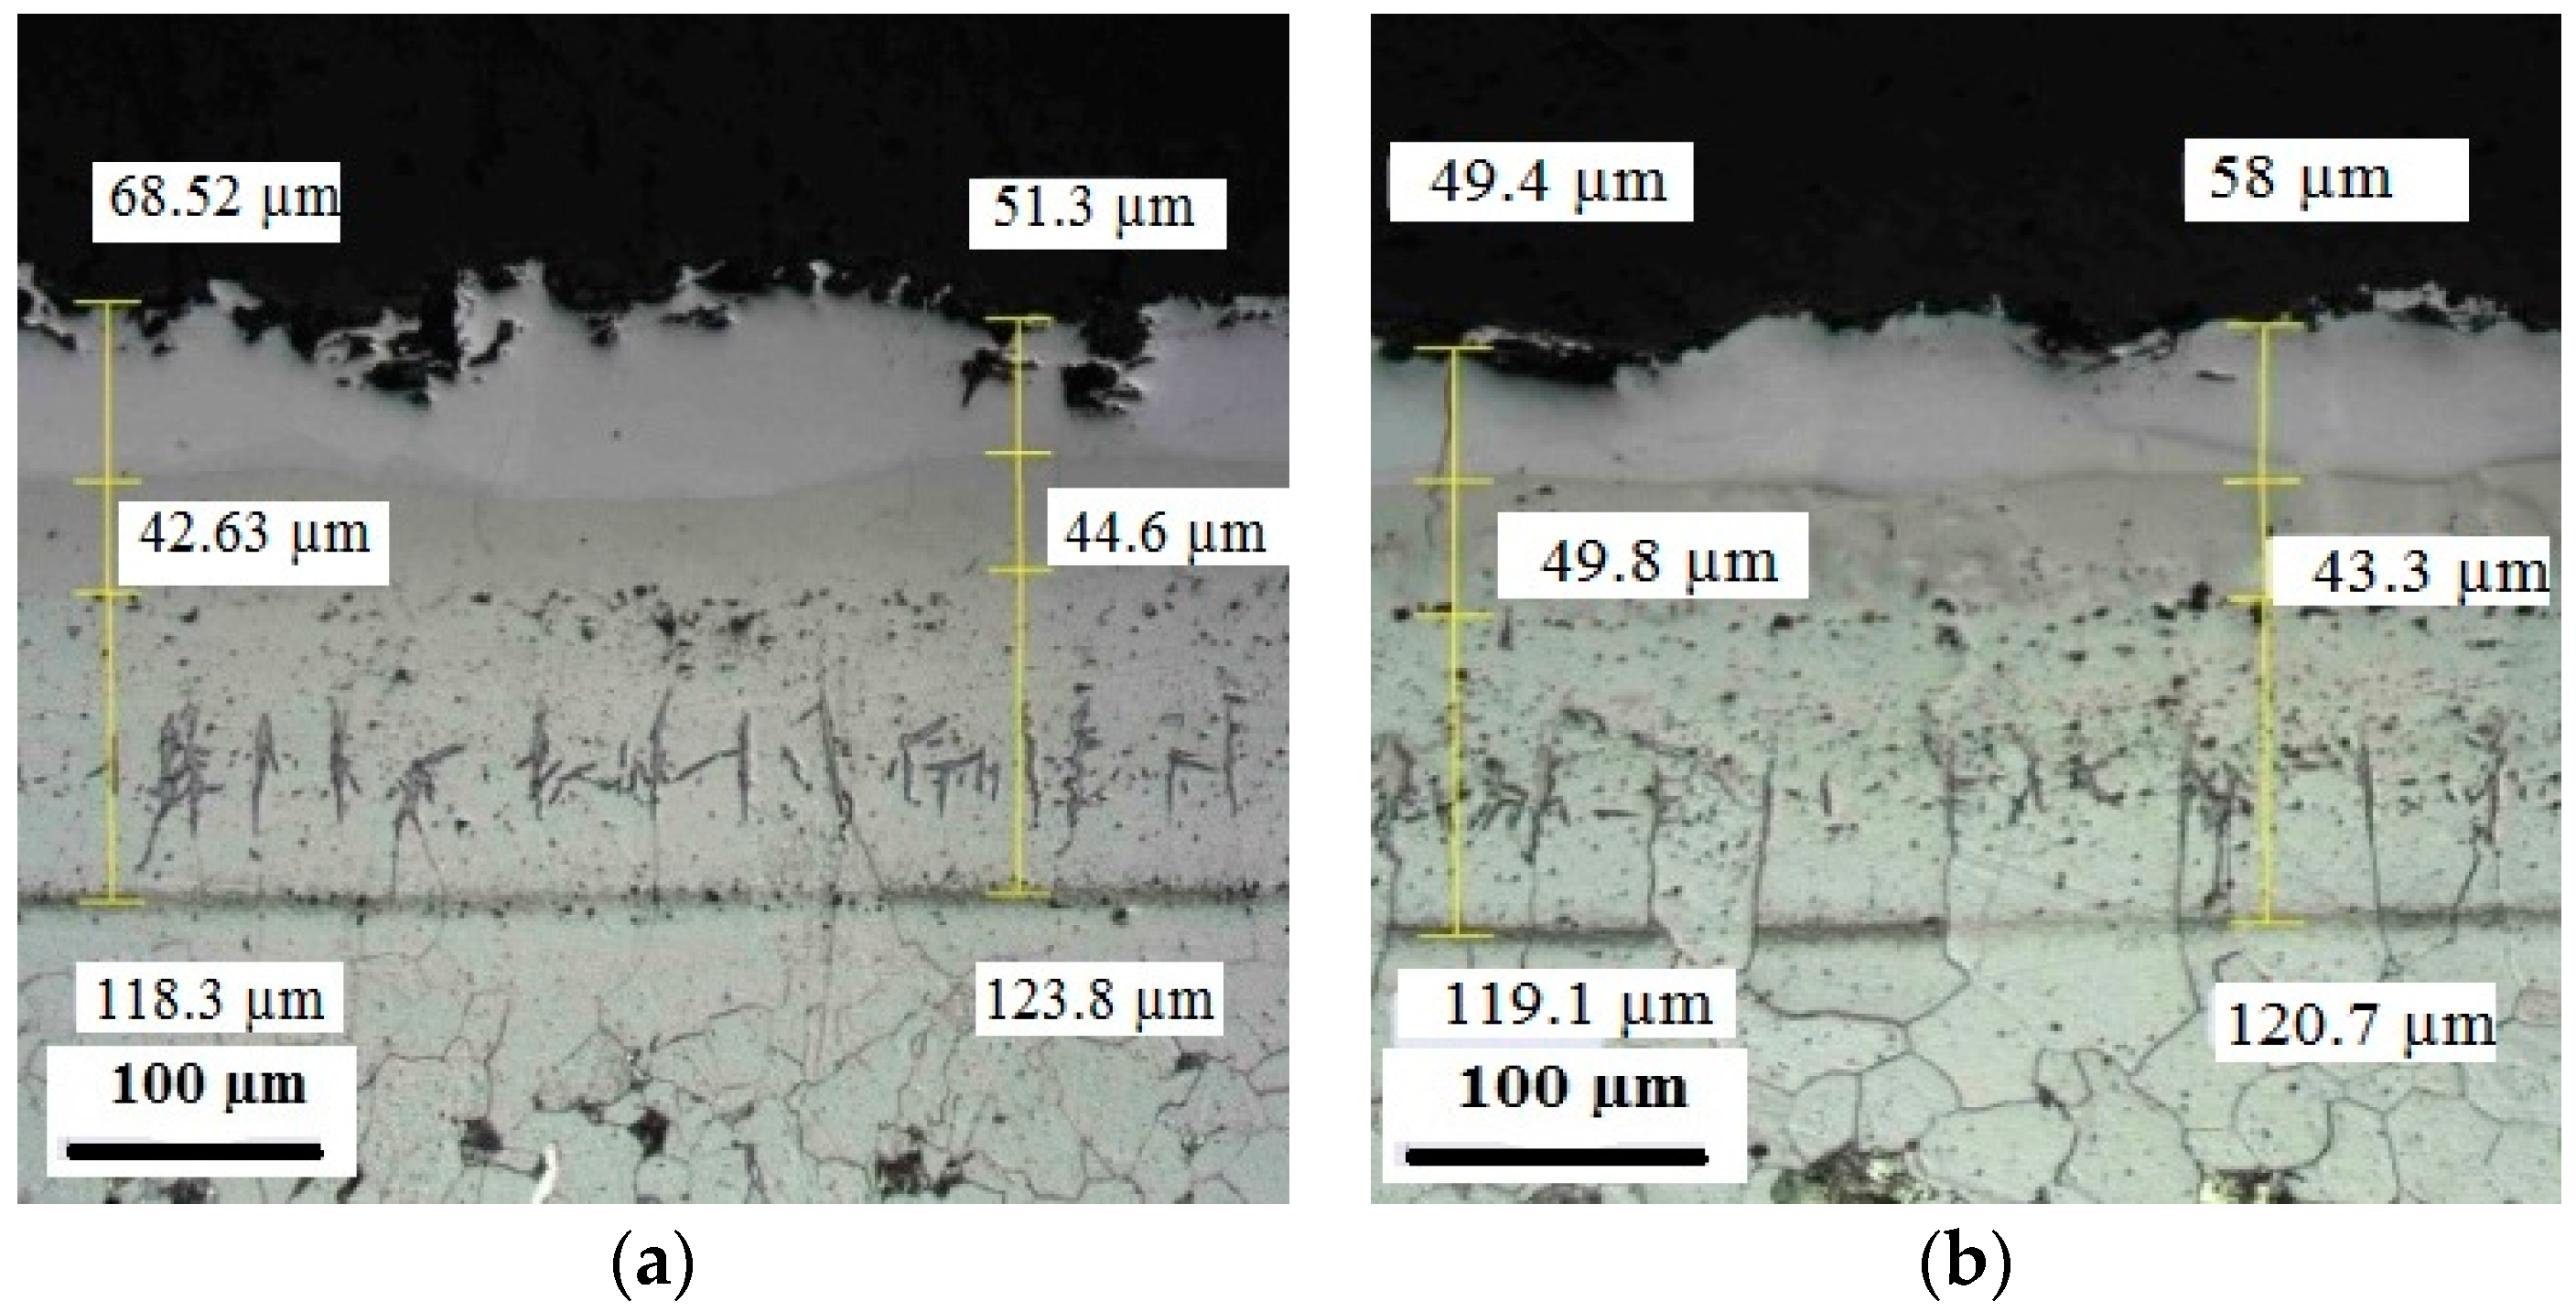
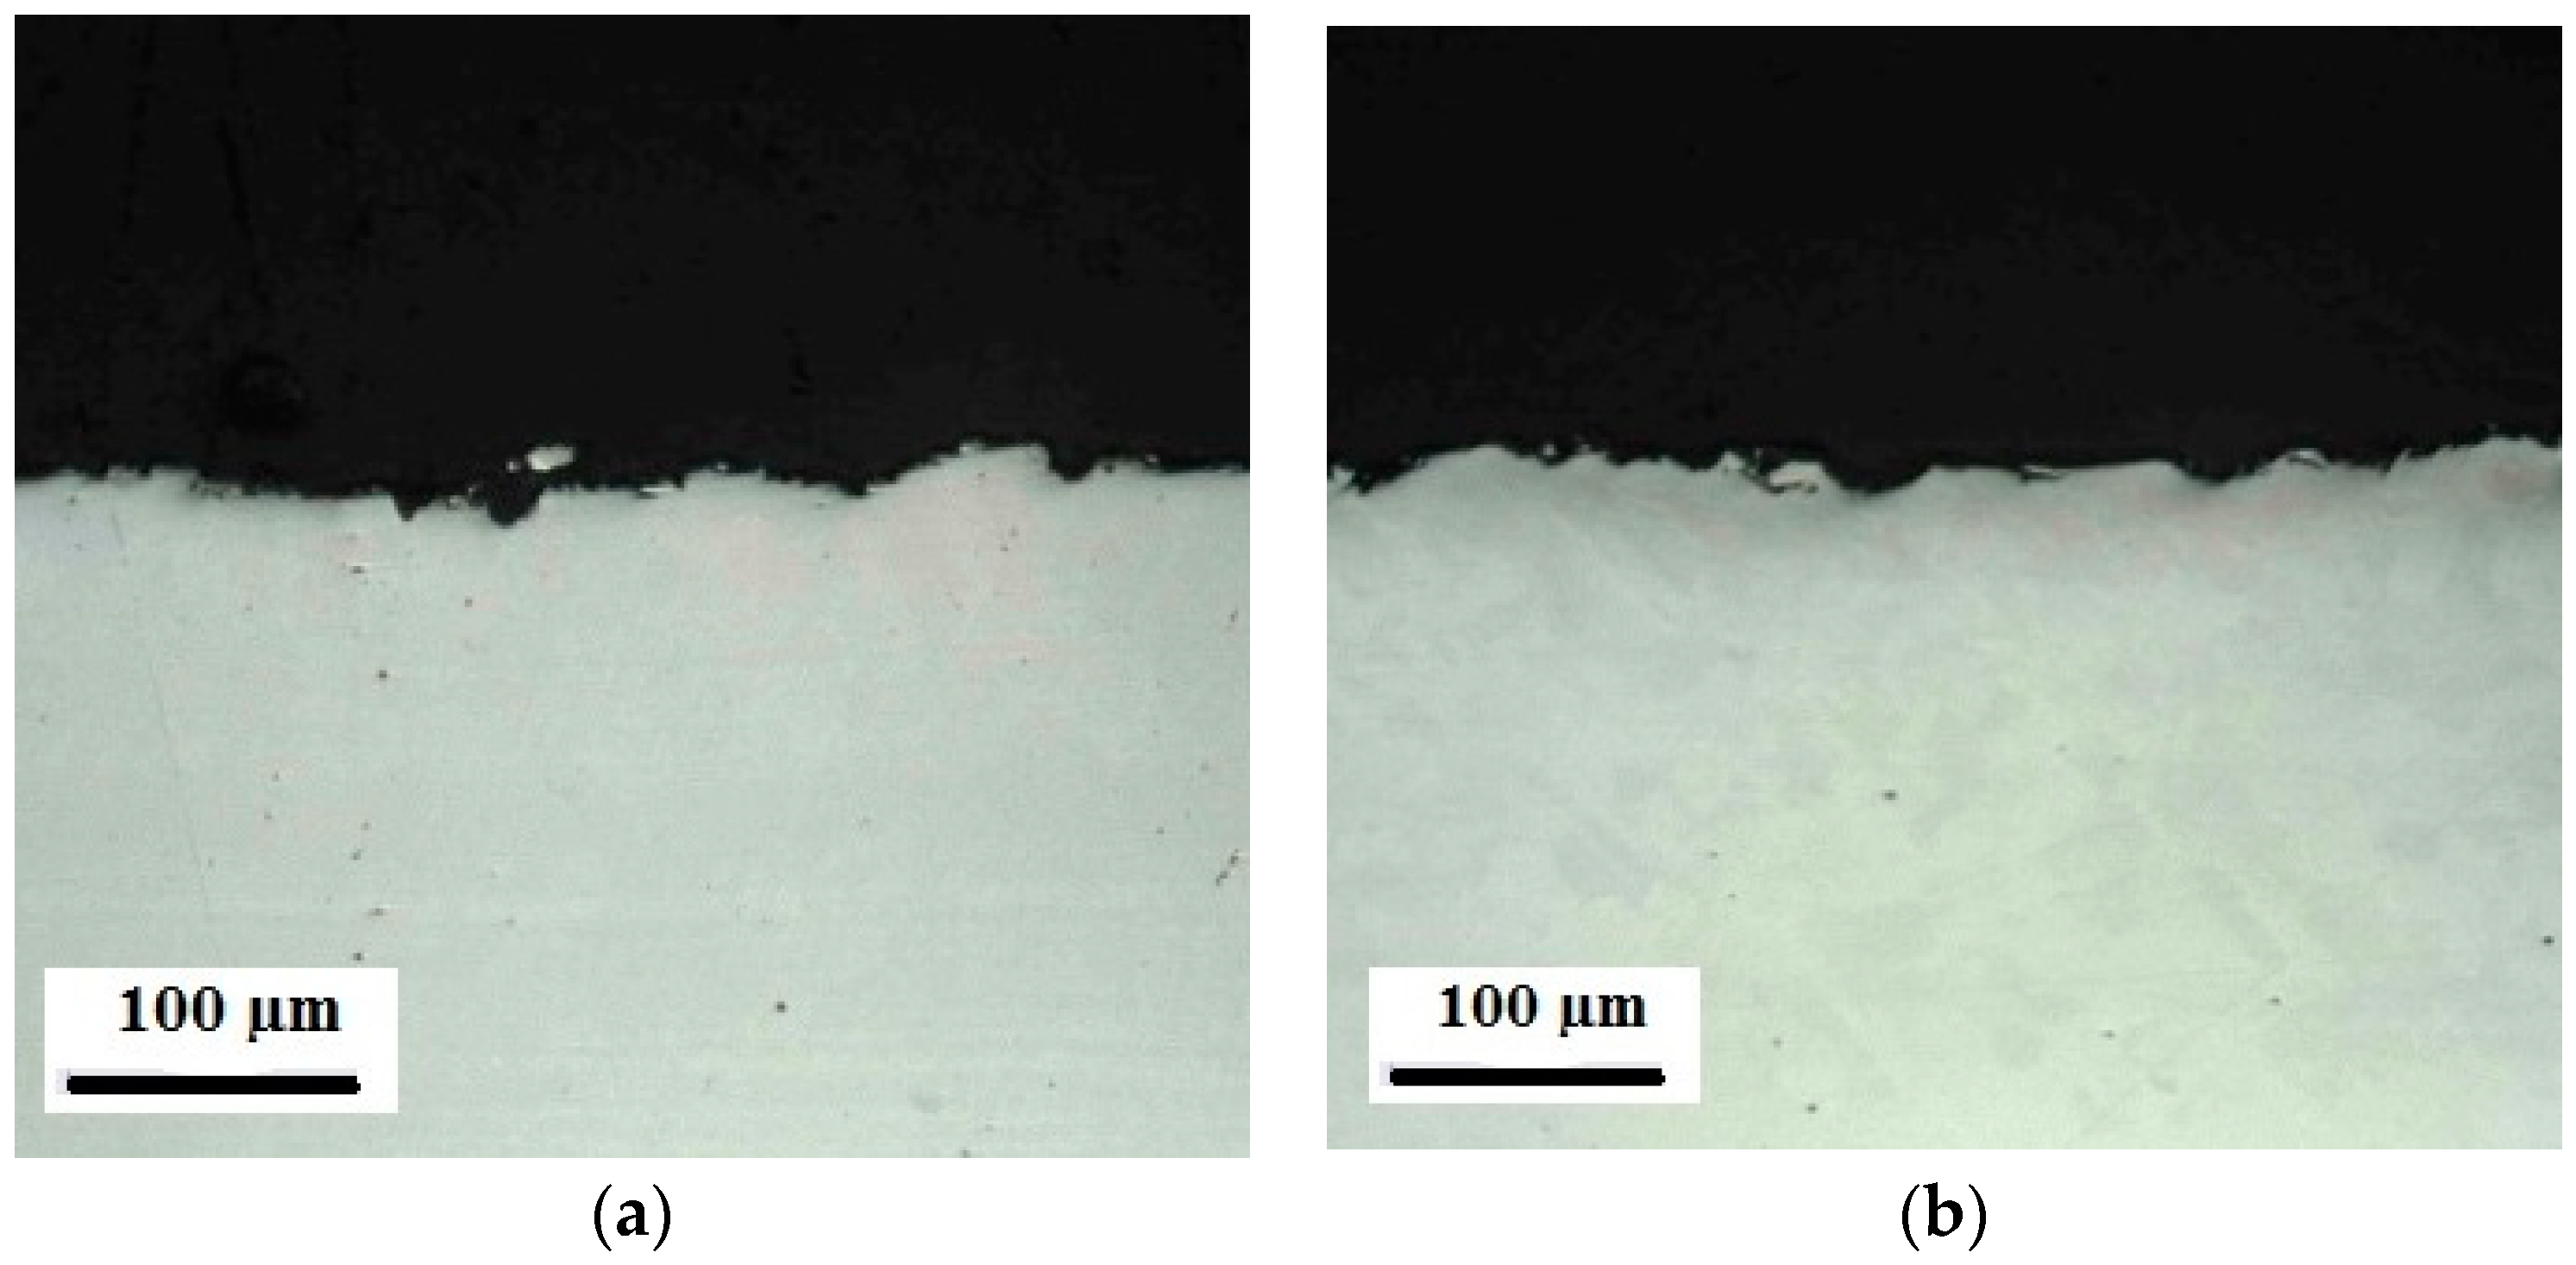
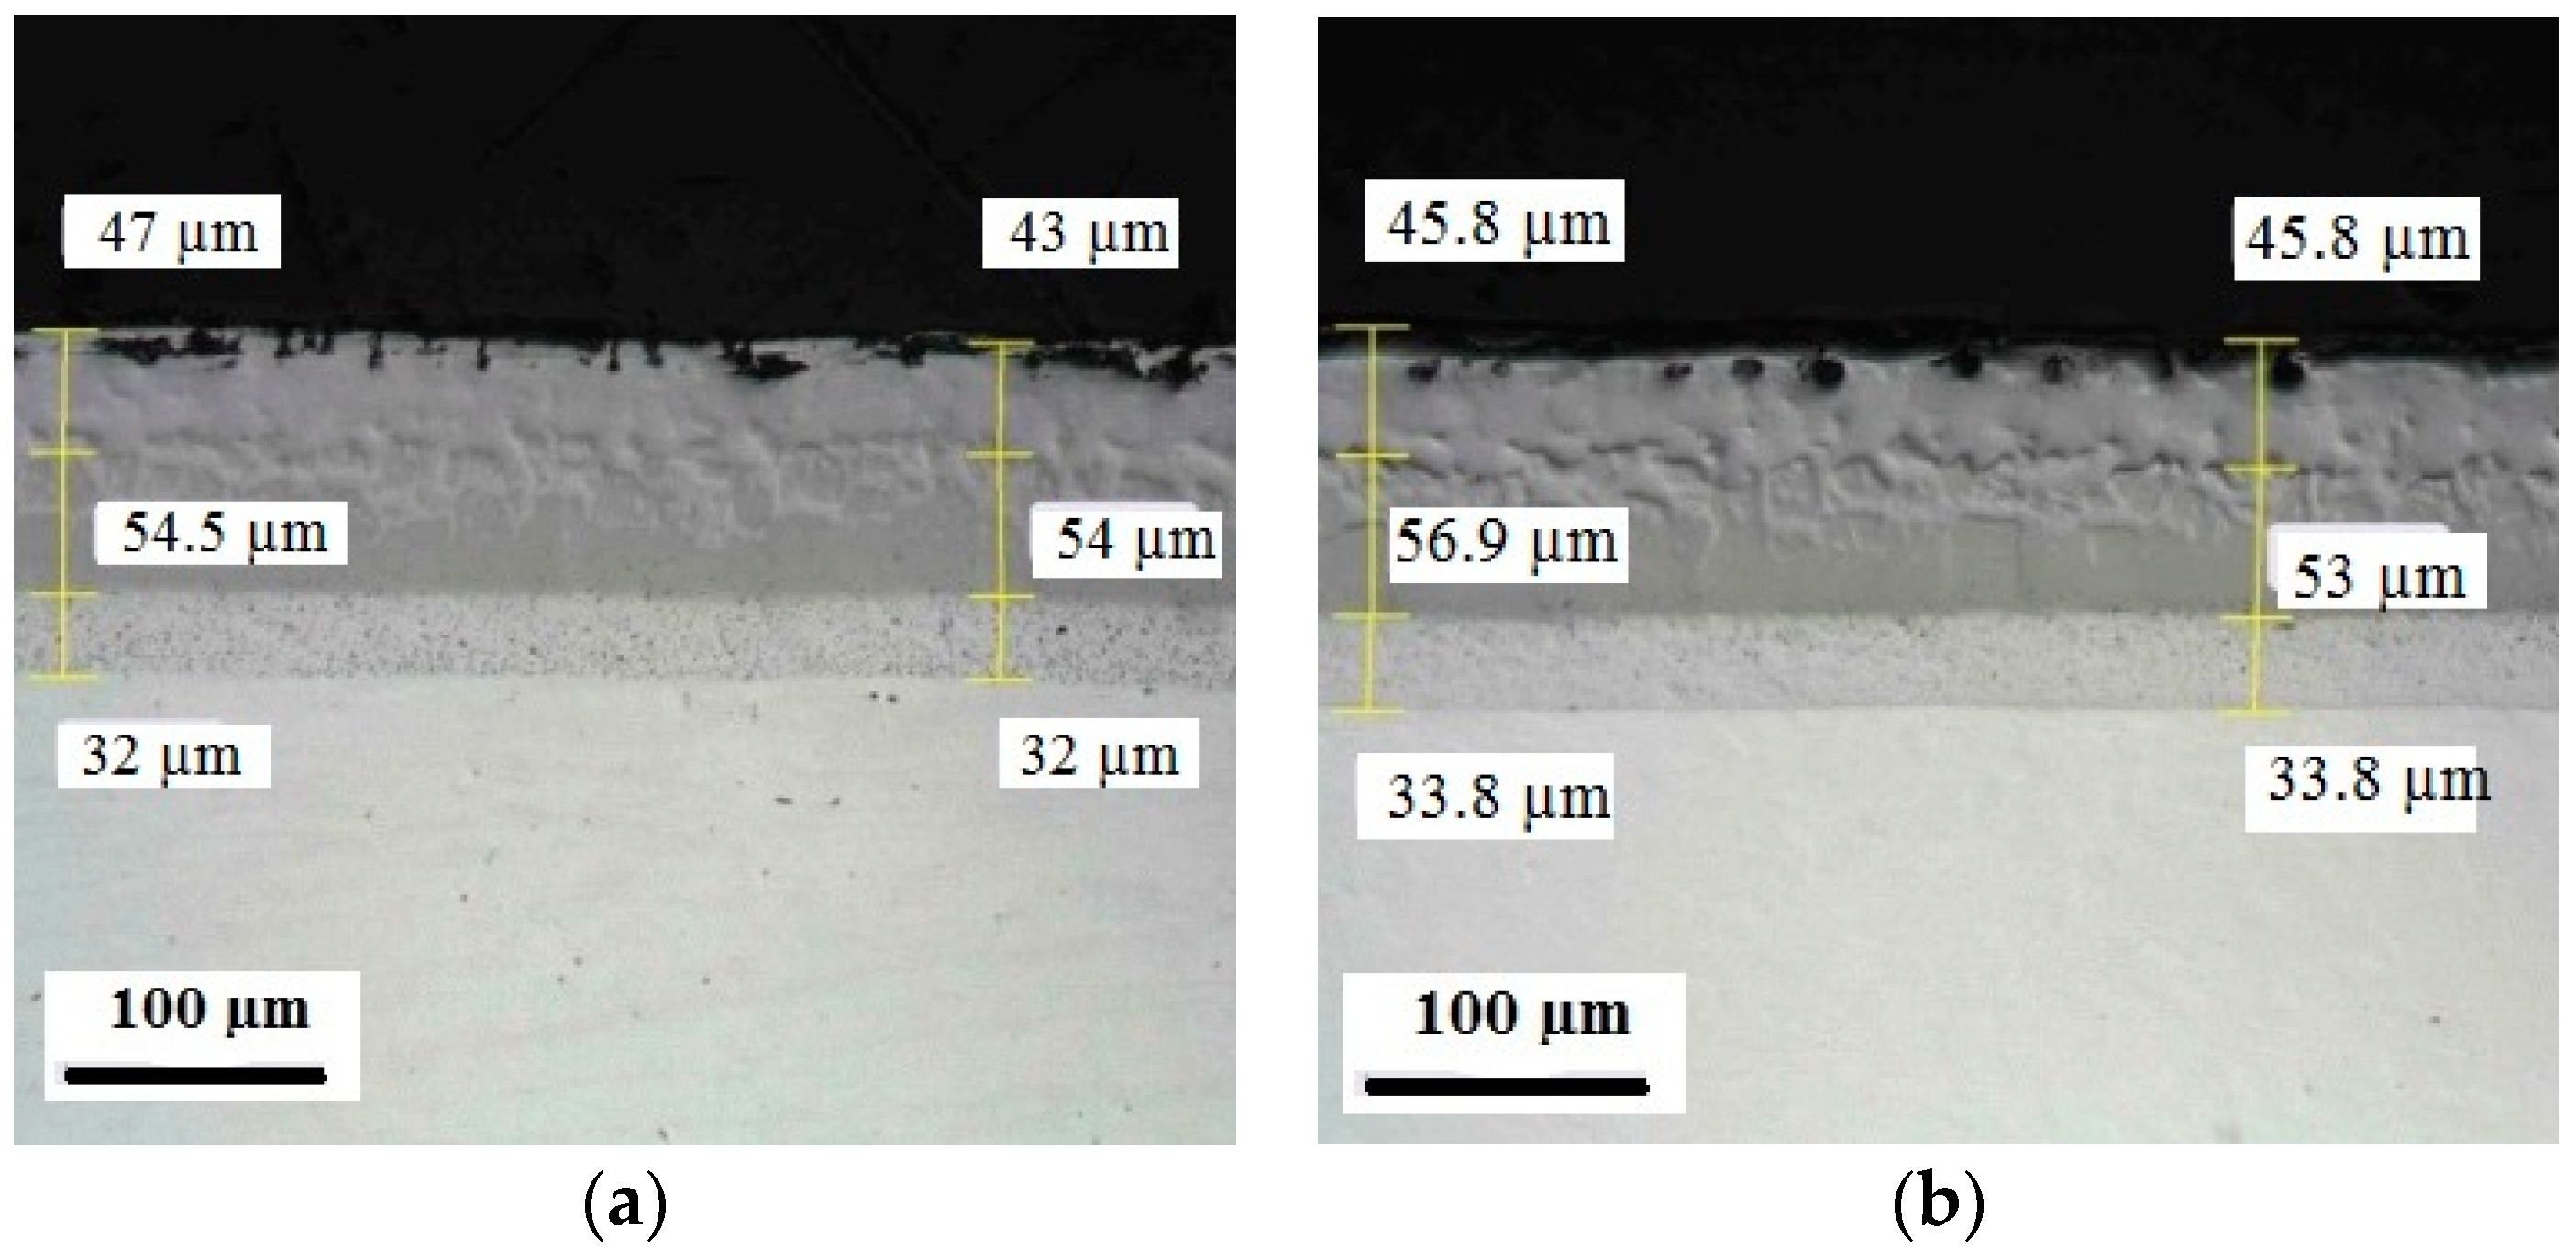
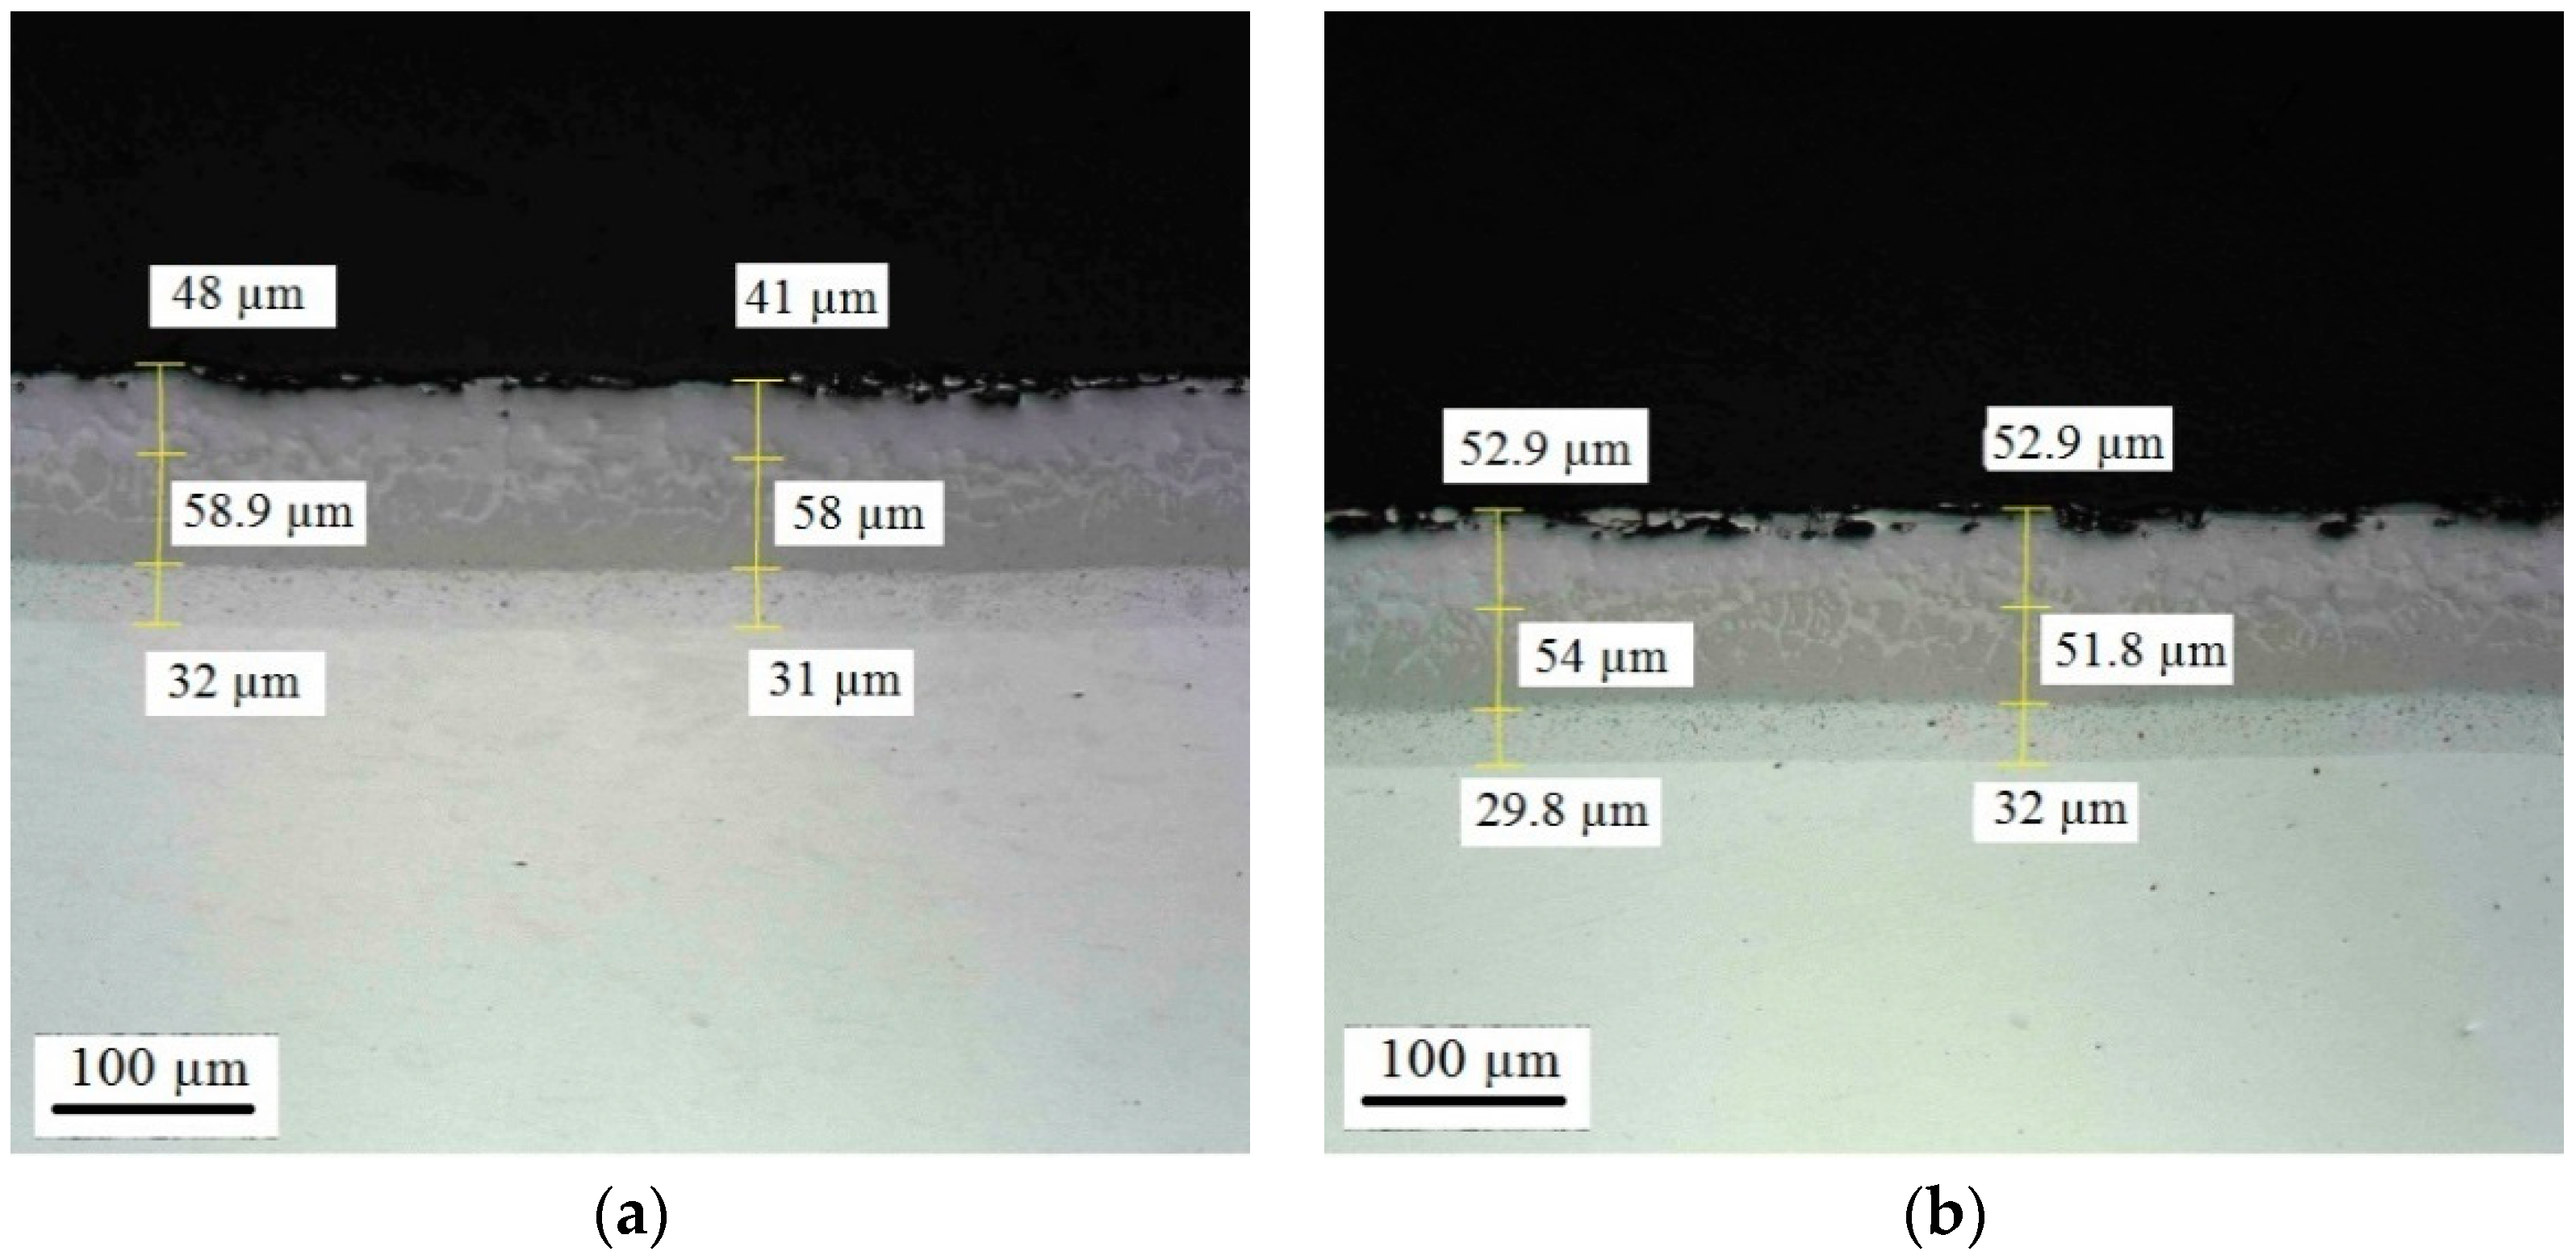
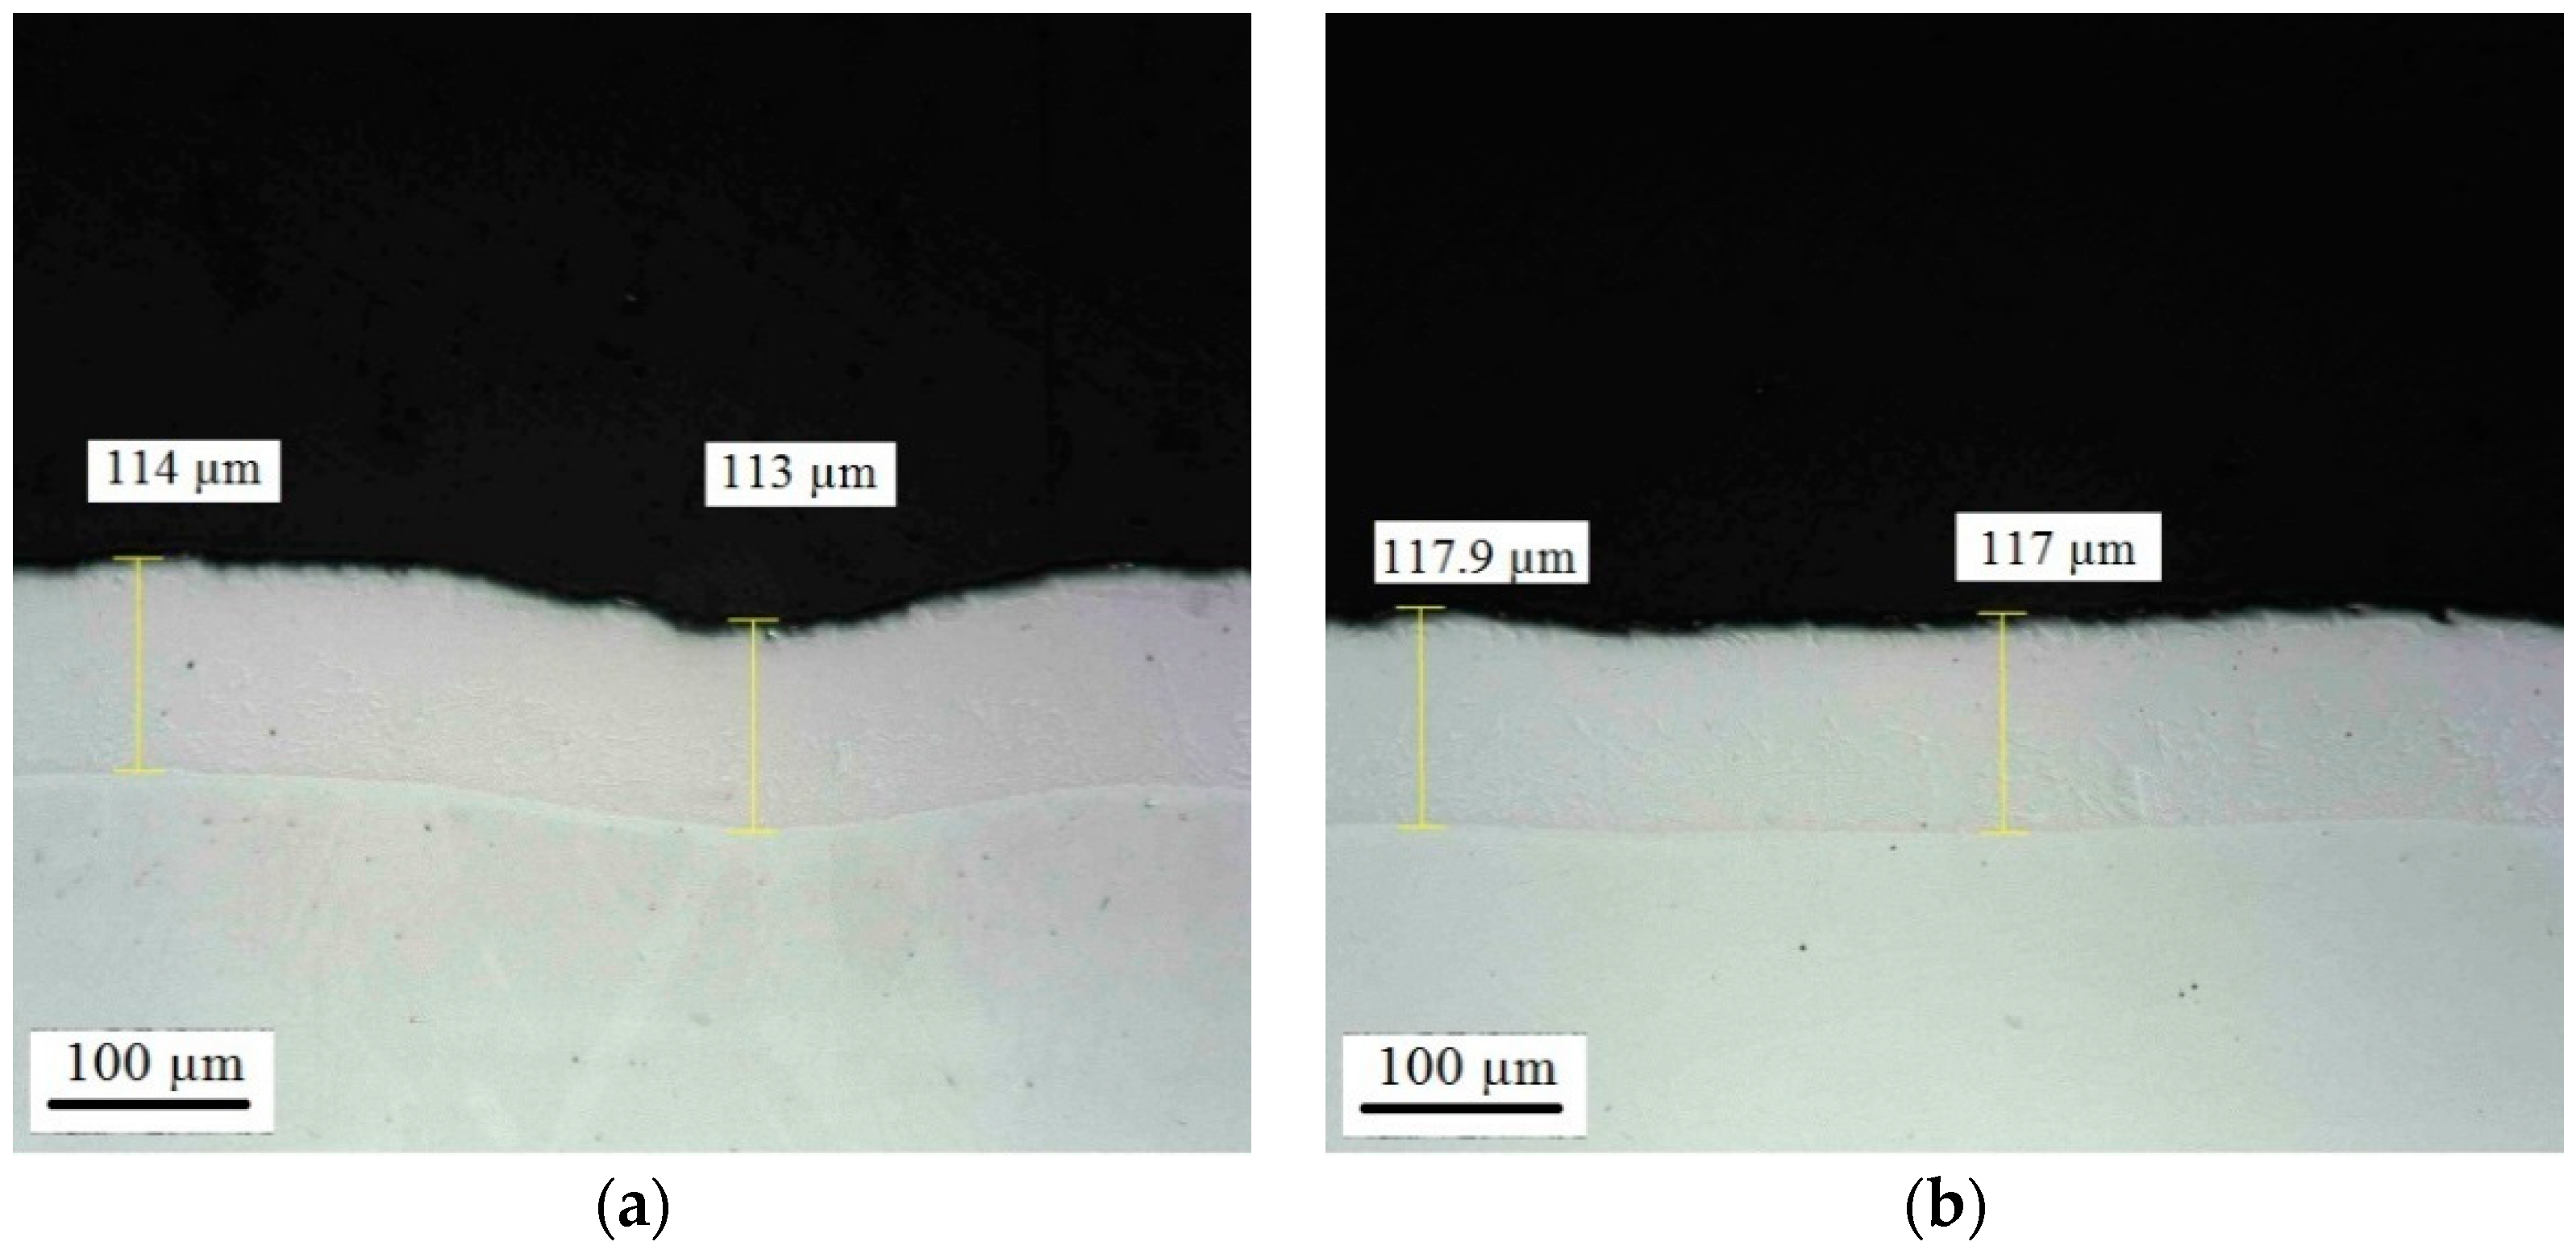
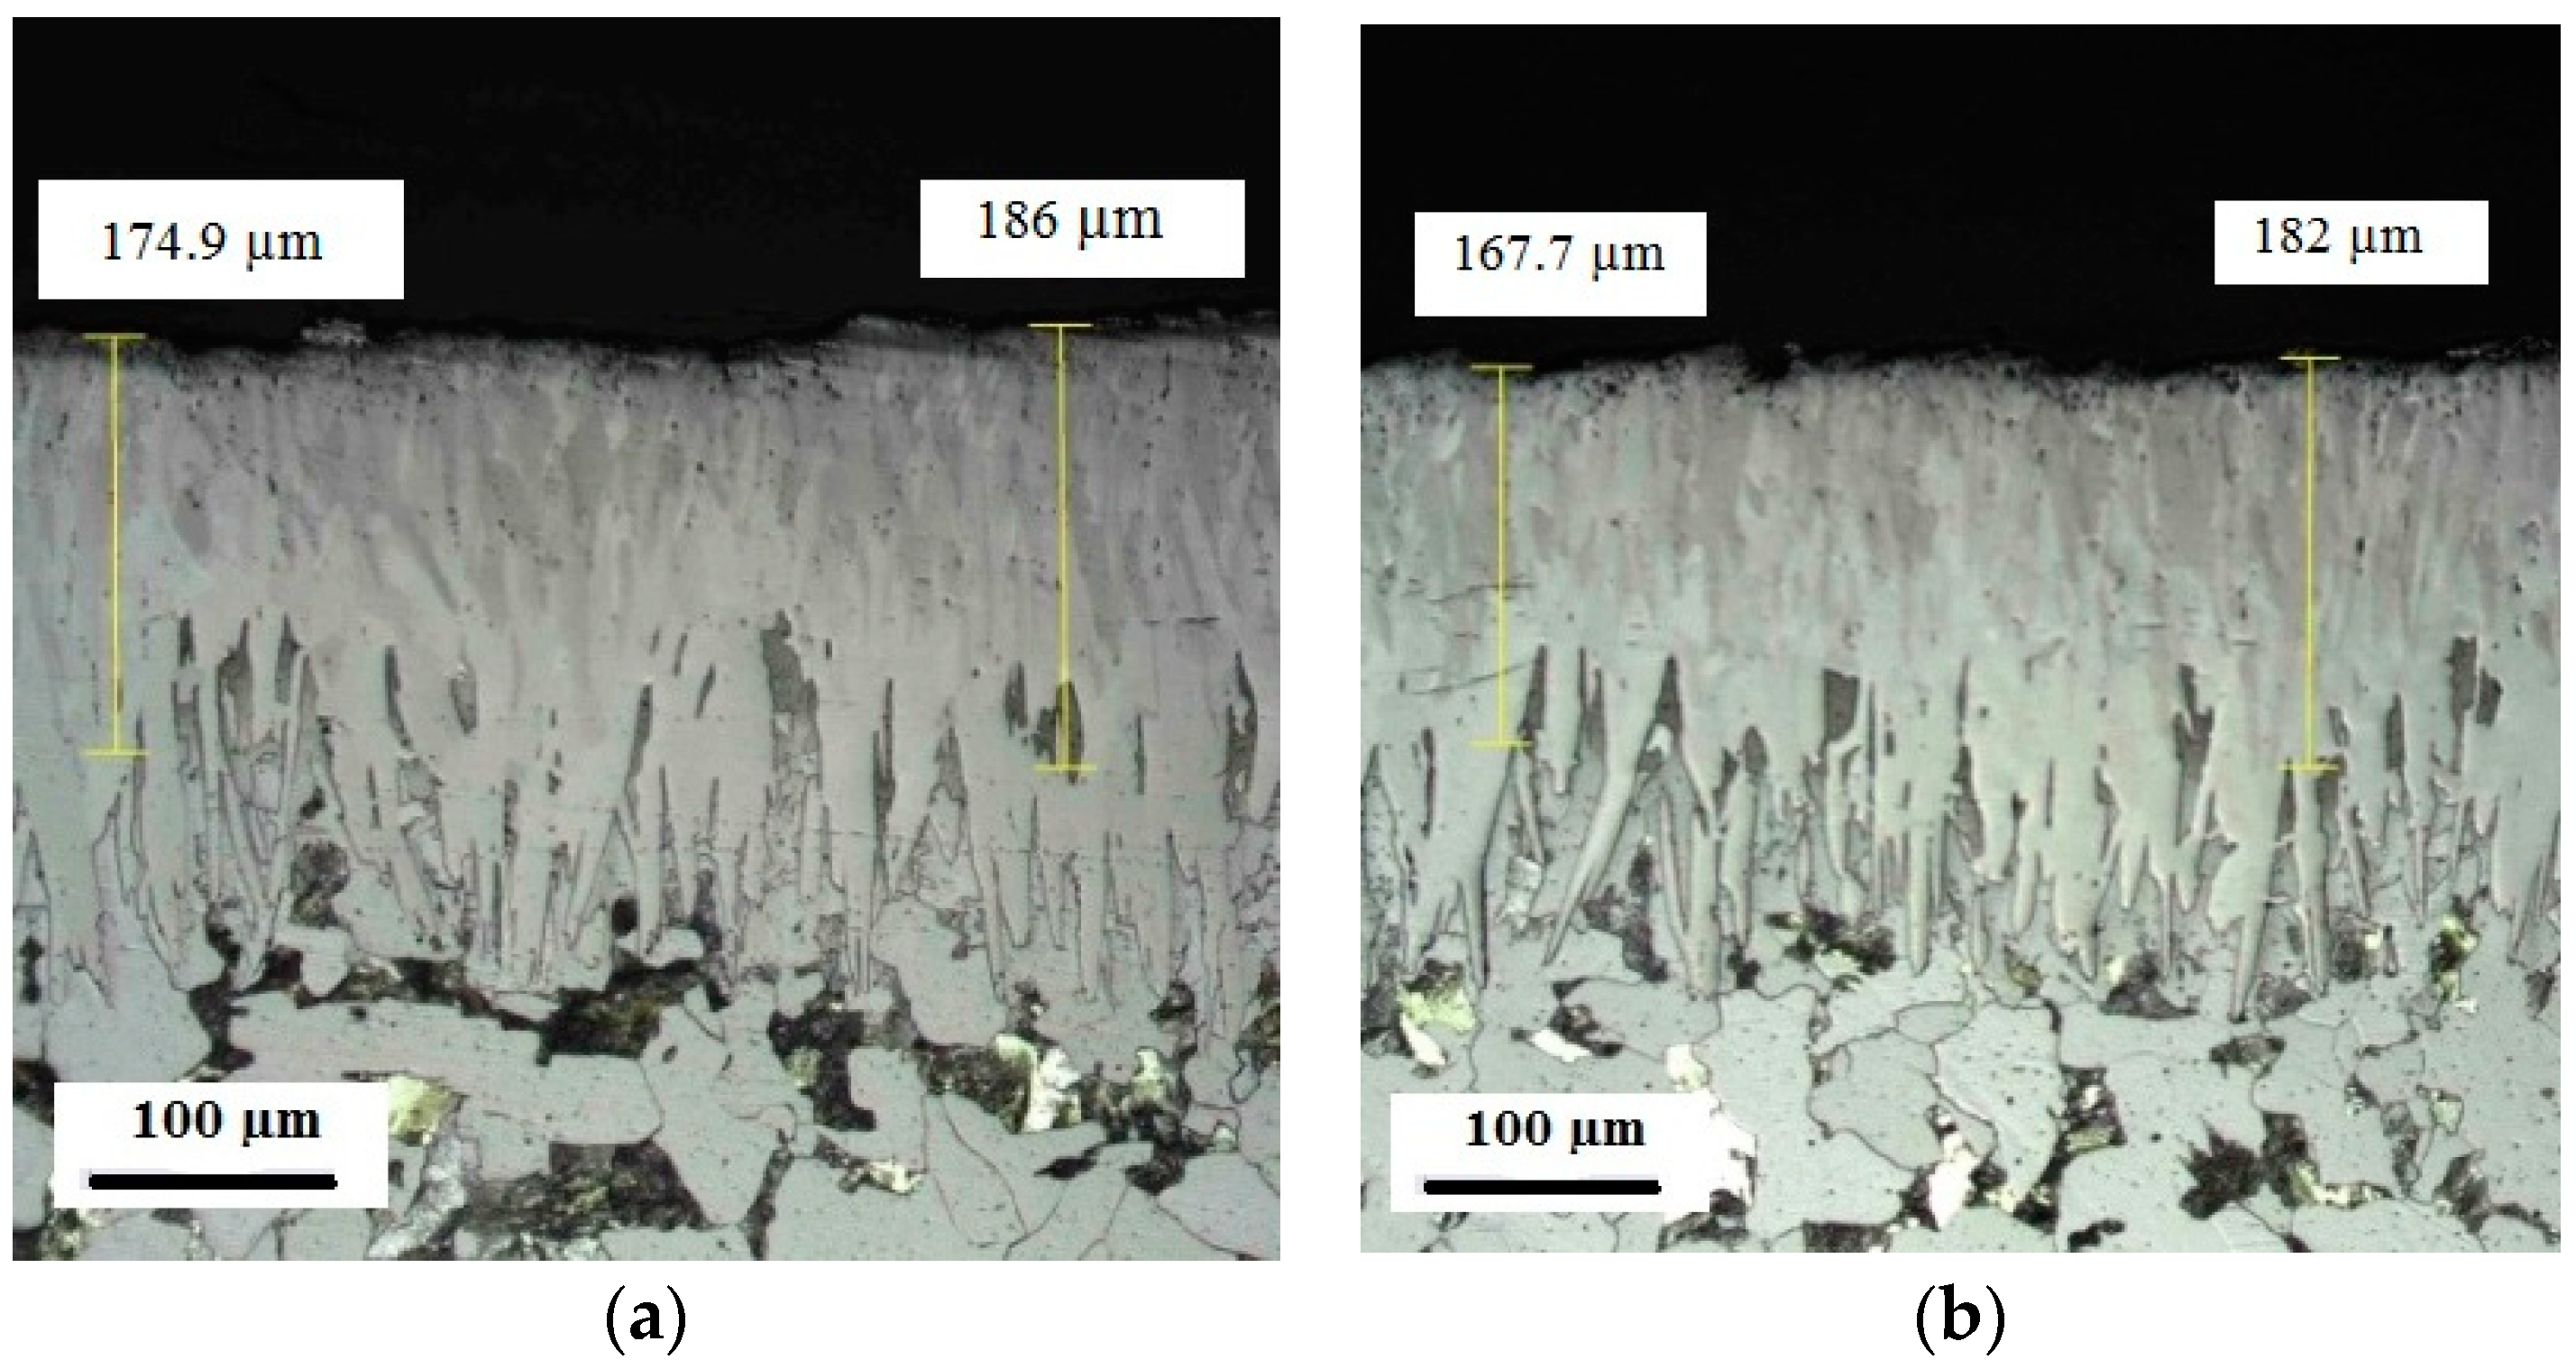
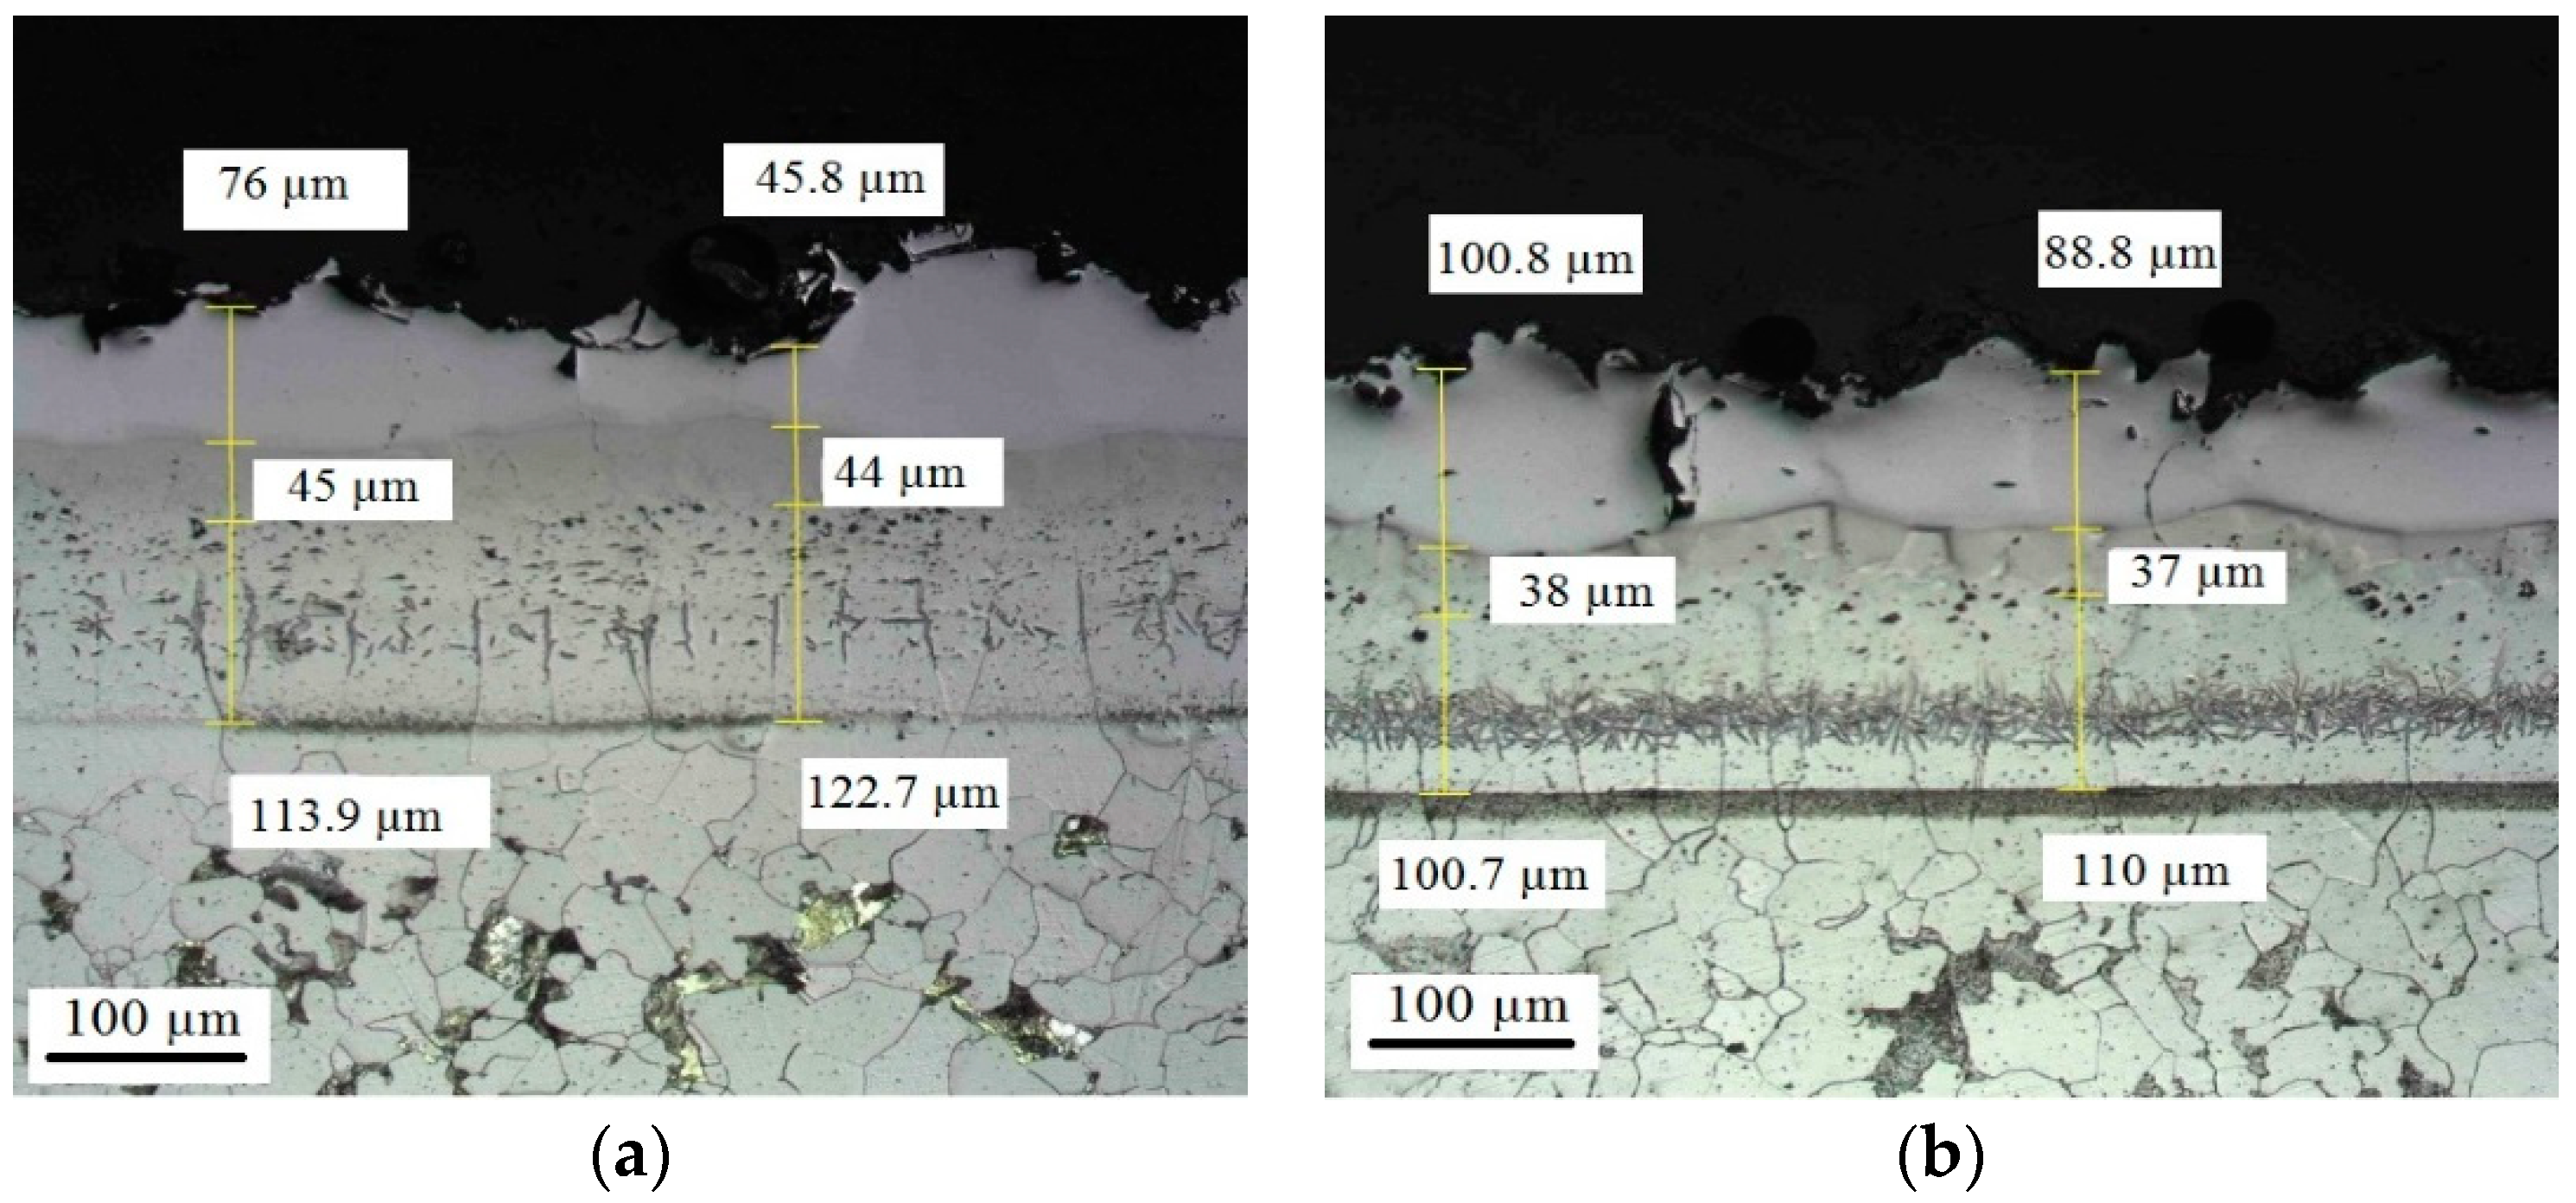
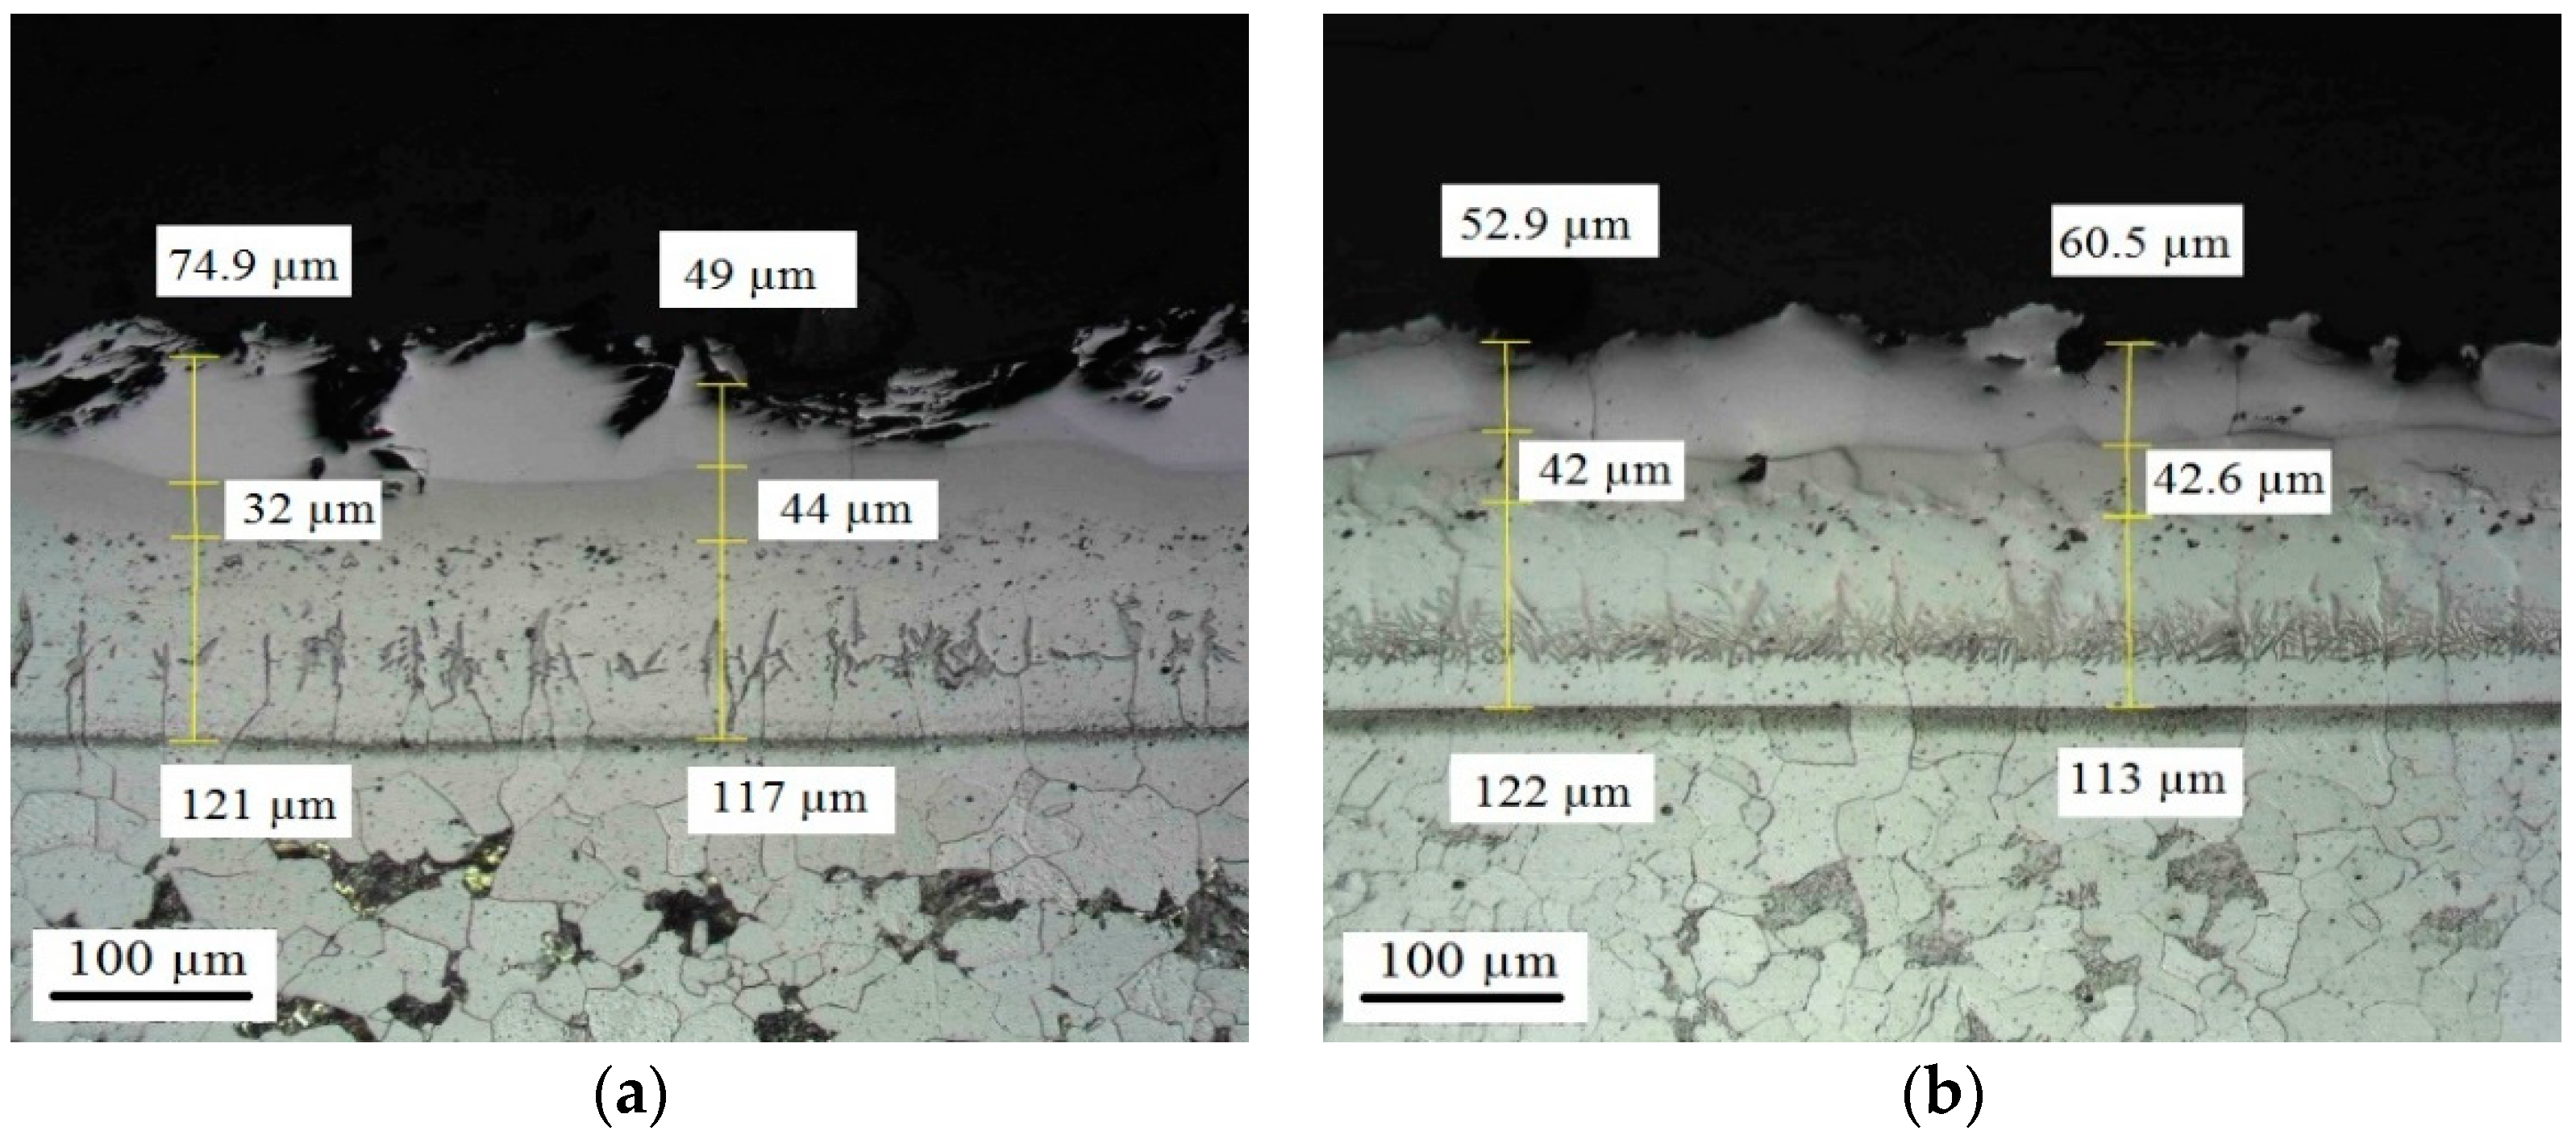
3.1.3. Microstructural Analysis after Corrosive Attack

Low-Temperature Corrosive Attack

The images of the coatings’ microstructures (cross-sections) of the samples examined before and after 168 h of exposure at the low-temperature corrosive attack are presented in Appendix B. It could be seen that the coated samples were not considerably affected by the corrosive testing condition (see Figure A3, Figure A4, Figure A5, Figure A6, Figure A7, Figure A8, Figure A9, Figure A10, Figure A11, Figure A12 and Figure A13 in Appendix B). Thus, no micro-cracks, delamination, or coating structure were observed. As mentioned earlier, since the simulated salt did not melt at the selected temperature (220 °C), the effectiveness of the salt action to induce corrosion of the surface of all samples was limited. Under this low-temperature condition, no difference in the case depths was observed for the coated samples examined before and after the testing (see Figure A3, Figure A4, Figure A5, Figure A6, Figure A7, Figure A8, Figure A9, Figure A10, Figure A11, Figure A12 and Figure A13 in Appendix B). Even for the boronized steel, no noticeable oxidation of iron borides occurred. Moreover, based on the microstructure images of the coatings with additional thin oxide or non-oxide layers, it was likely that the presence of the chemically inert top coatings (e.g., SnO2 and ZrO2, as well as BN) also prevented oxidation of iron borides and aluminides.
As opposed to the coated steel samples, the corrosion-oxidation degradation was observed on the surface of bare carbon steel. A scale with a thickness of several microns could be observed. This scale was soft and poorly bonded to the steel, and it was easily detached at the cross-section preparation. Also pits and cavities with the depths of 20–35 µm were observed (Figure A3), and their presence could facilitate further corrosion in molten salts at elevated temperatures. Stainless steel 316 samples did not experience degradation under the low-temperature unmolten salt testing condition.

High-Temperature Corrosive Attack

The coating microstructure images of the samples examined before and after corrosion testing at 600 °C are presented in Appendix C, while Figure 4 and Figure 5 show the microstructure (cross-sections) of low-carbon steel and 316 stainless steel also before and after high-temperature testing at the same conditions. It was clearly observed that the uncoated steel samples experienced corrosion from their surface. Thus, carbon steel had the uneven rusting scale with a thickness from 40 to 70 µm, and this scale contains pores and even large voids. This scale formation could be detected at short times of molten salt-oxidation exposure (a thin scale was already detected for the sample exposed for 24 h). The uncoated 316 stainless steel sample had, as expected, a significantly smaller scale (from 9 to 15 µm) that was partially flaked-off at the cutting-polishing of the cross-section preparation. The corrosion scale formation can be explained by the joint interaction of the molten salt with the steel surface and oxidation, e.g., by the formation of iron oxides (Fe2O3, Fe3O4, Cr2O3, iron sulfates, and chlorides). The formation of these new compounds was confirmed by the XRD data, which will be discussed later.
In contrary to bare steels, the structures of the aluminized coatings did not experience sufficient changes, and no micro-cracks and delamination were observed (see Figure A14, Figure A15 and Figure A16 and Figure A18, Figure A19 and Figure A20 in Appendix C). However, some changes of the thicknesses of the coatings’ layers could be detected, but without changes of the total case depths. This small change of the thicknesses of the layers can be explained by the continuation of the diffusion processes occurred at the continual action of high temperature (600 °C); particularly, by the inward diffusion of Al and outward diffusion of Fe, Cr, and Ni from the substrate, but not due to the corrosion. As mentioned above, the aluminides of the Al-rich layer started oxidizing with formation of the thin Al2O3 film with high inertness that inhibited the coating surface from further oxidation and from contact with the molten salt ingredients, i.e., this Al2O3 film also enhanced corrosion resistance of the materials [53]. A similar effect can be inherent to the samples with additional top oxide layers (SnO2 and ZrO2).
In order to analyze the surface topology of the materials, the values of their average roughness after high-temperature corrosive attack were measured and presented in Table 3. In Table 3, n represents the number of measurements. In the case of the aluminized coating, the roughness of the coating on the 316 stainless steel was significantly less than that of the coating on the low carbon steel substrate. The lower value of the average roughness of the uncoated low-carbon steel is probably due to the delamination of the corroded parts from top surface; otherwise, a greater value for the average roughness of the uncoated low-carbon steel was expected. Low values of roughness should be more favorable for corrosion protection due to the significantly lower potential contacts with the corrosive media and the exposed material and due to the reduced possibility of fracture and removal of the asperities during occasional mechanical loading of the surface. In the case of chromized samples, insignificant changes in the chromide layers were detected, but these changes were more noticeable in the case of the carbon steel substrate compare to the 316 stainless steel (see Figure A17 and Figure A21 in Appendix C). These changes with the chromized samples may also be related to the continuation of the diffusion processes, but to a significantly smaller extent compared to the aluminized coatings. Since the chromized samples had a smooth top layer, the measurements were unaffected by the topology of the surface (see Table 3).
The difference in the diffusion rate among various metal atoms in the layers within the coating might have caused the mass transfer at the interface during the thermal diffusion process occurred during the high-temperature corrosion testing. This has been characterized as the Kirkendall effect [56]. After the low- and high-temperature corrosive attack, no porosity (voids), as a result of the Kirkendall effect, was observed. Moreover, no evidence of delamination or cracking was found for the coated samples. Since the diffusion process is highly dependent on temperature and exposure time, it was expected that extended exposure to the high-temperature environment might cause minimal phase changes in the coating. This is related to the fact that the diffusion process exhibits a parabolic behavior, in which after a short period of time, any “change” in the coating during the thermal diffusion process will approach a “plateau”. Similarly, with oxidation, the Al2O3 scale formed was chemically inert and protected the inert aluminides against further oxidation. Therefore, it was found that the coated samples, particularly aluminized, showed good resistance against the high-temperature corrosive environment.

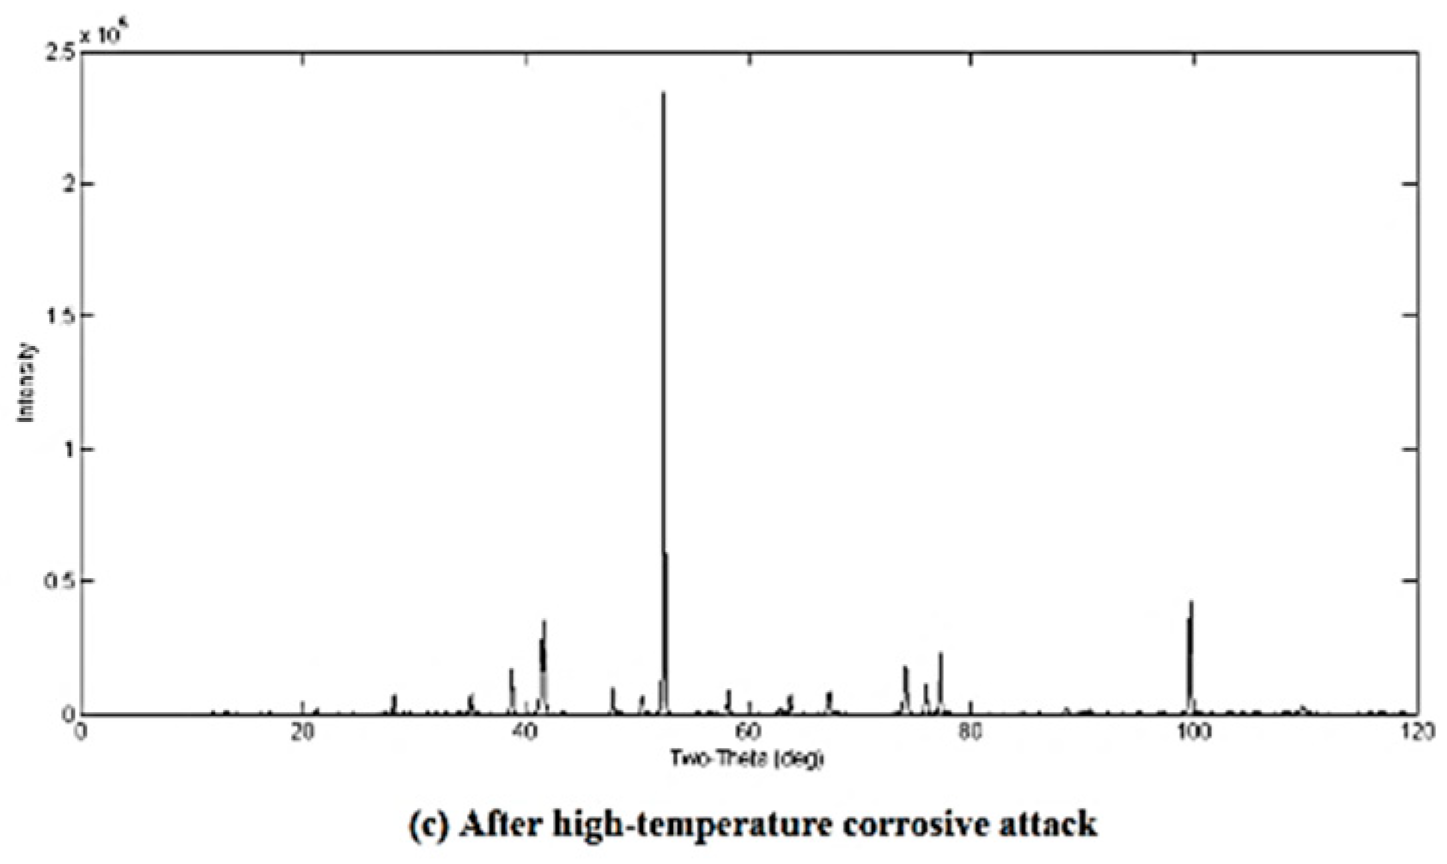
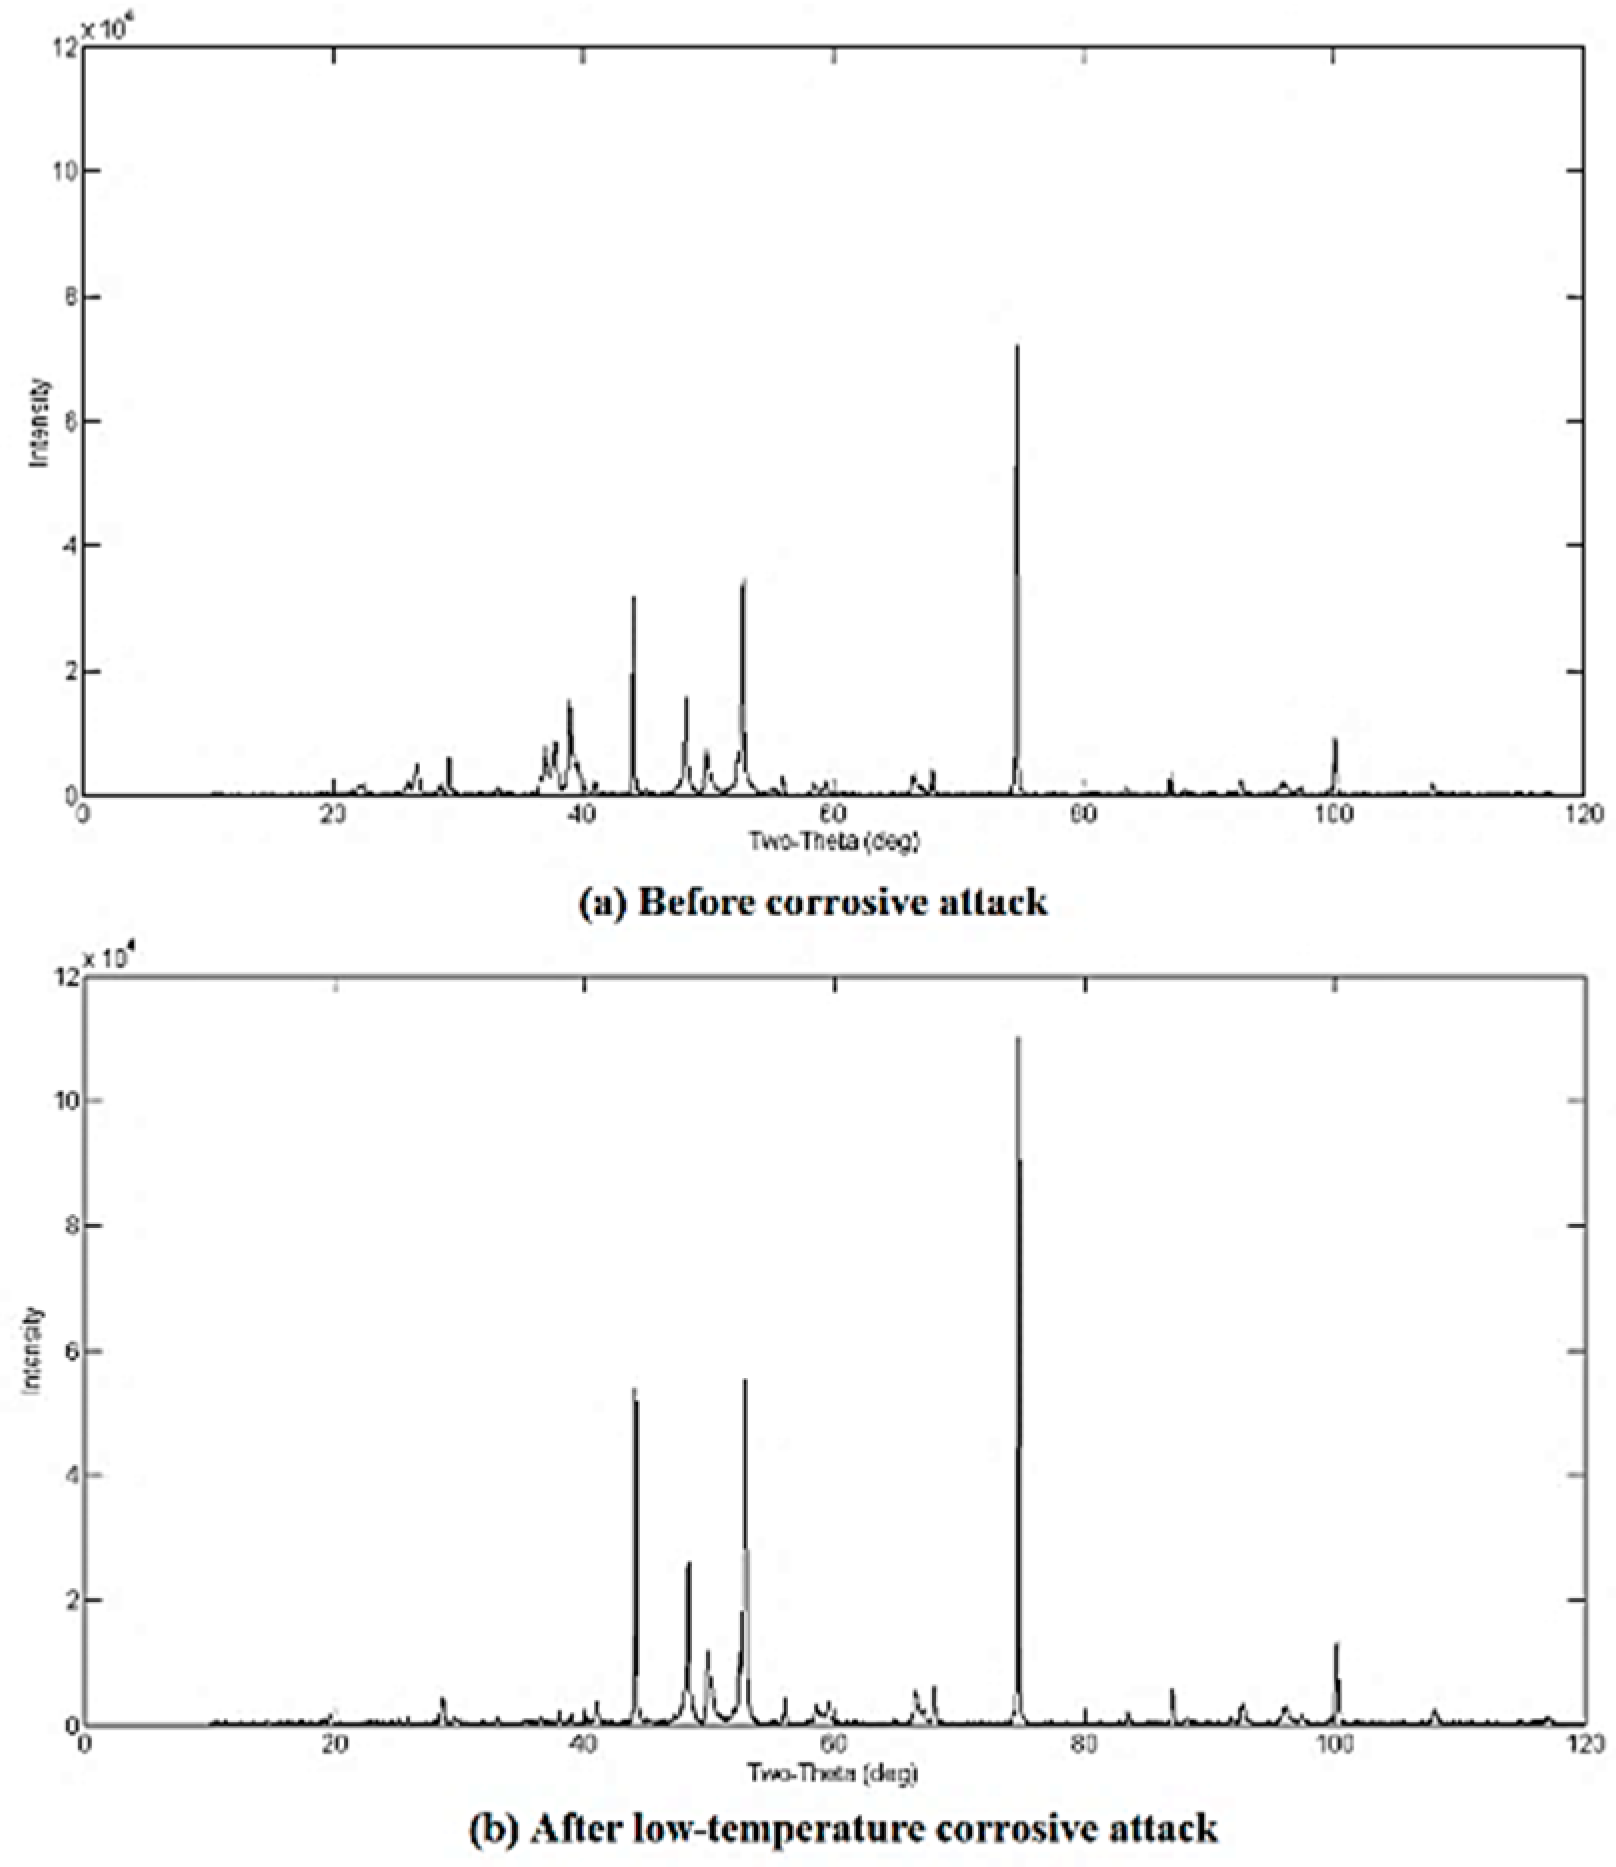
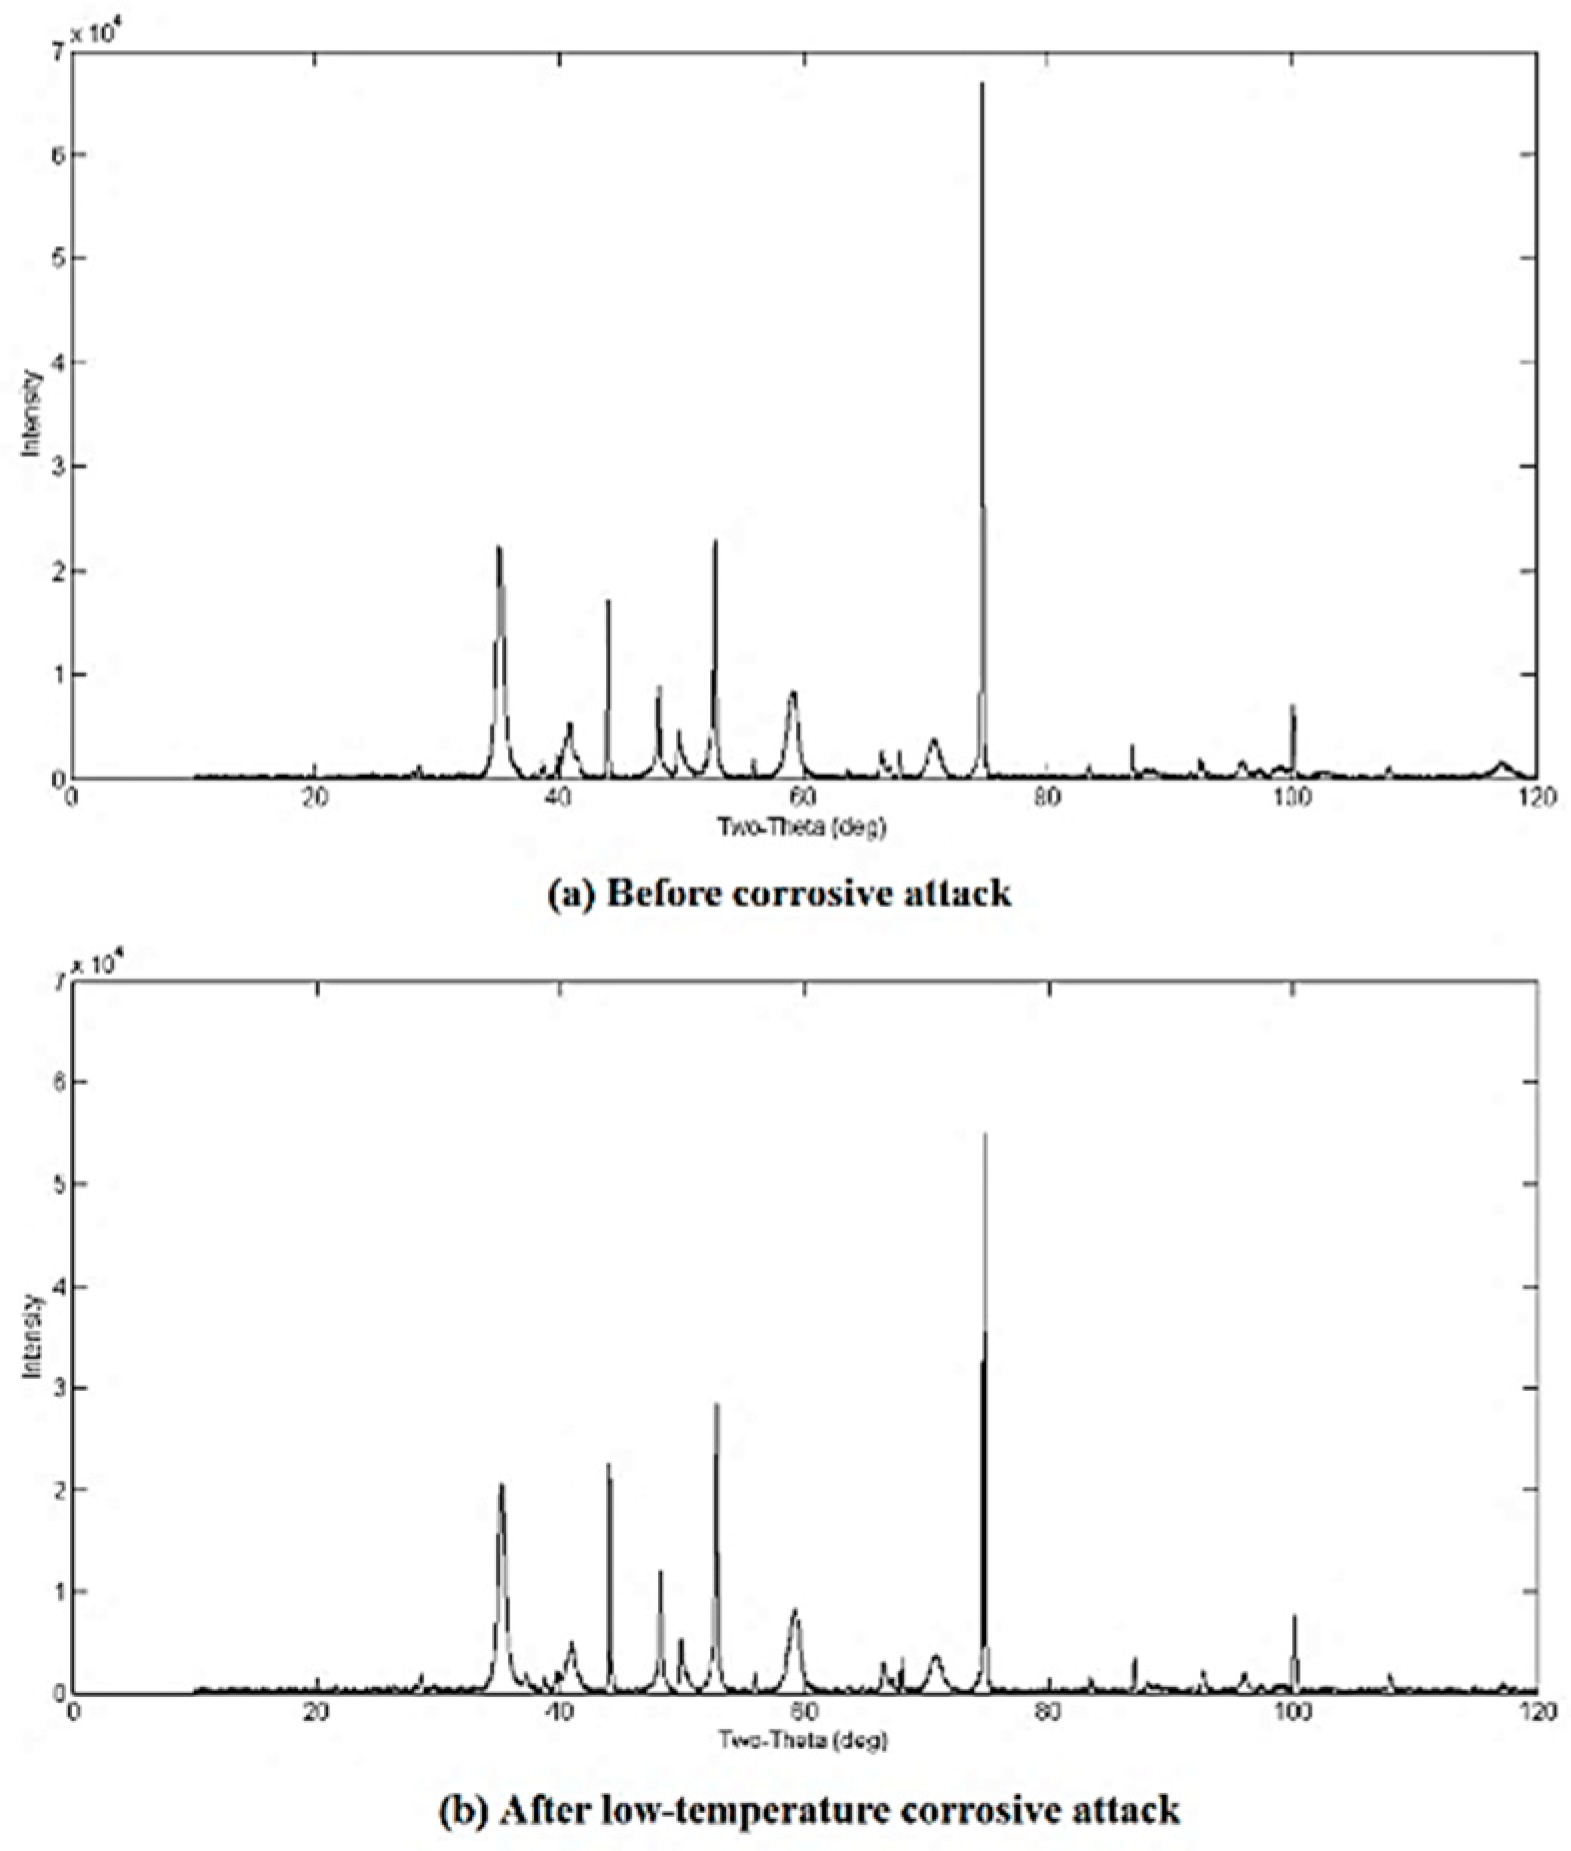
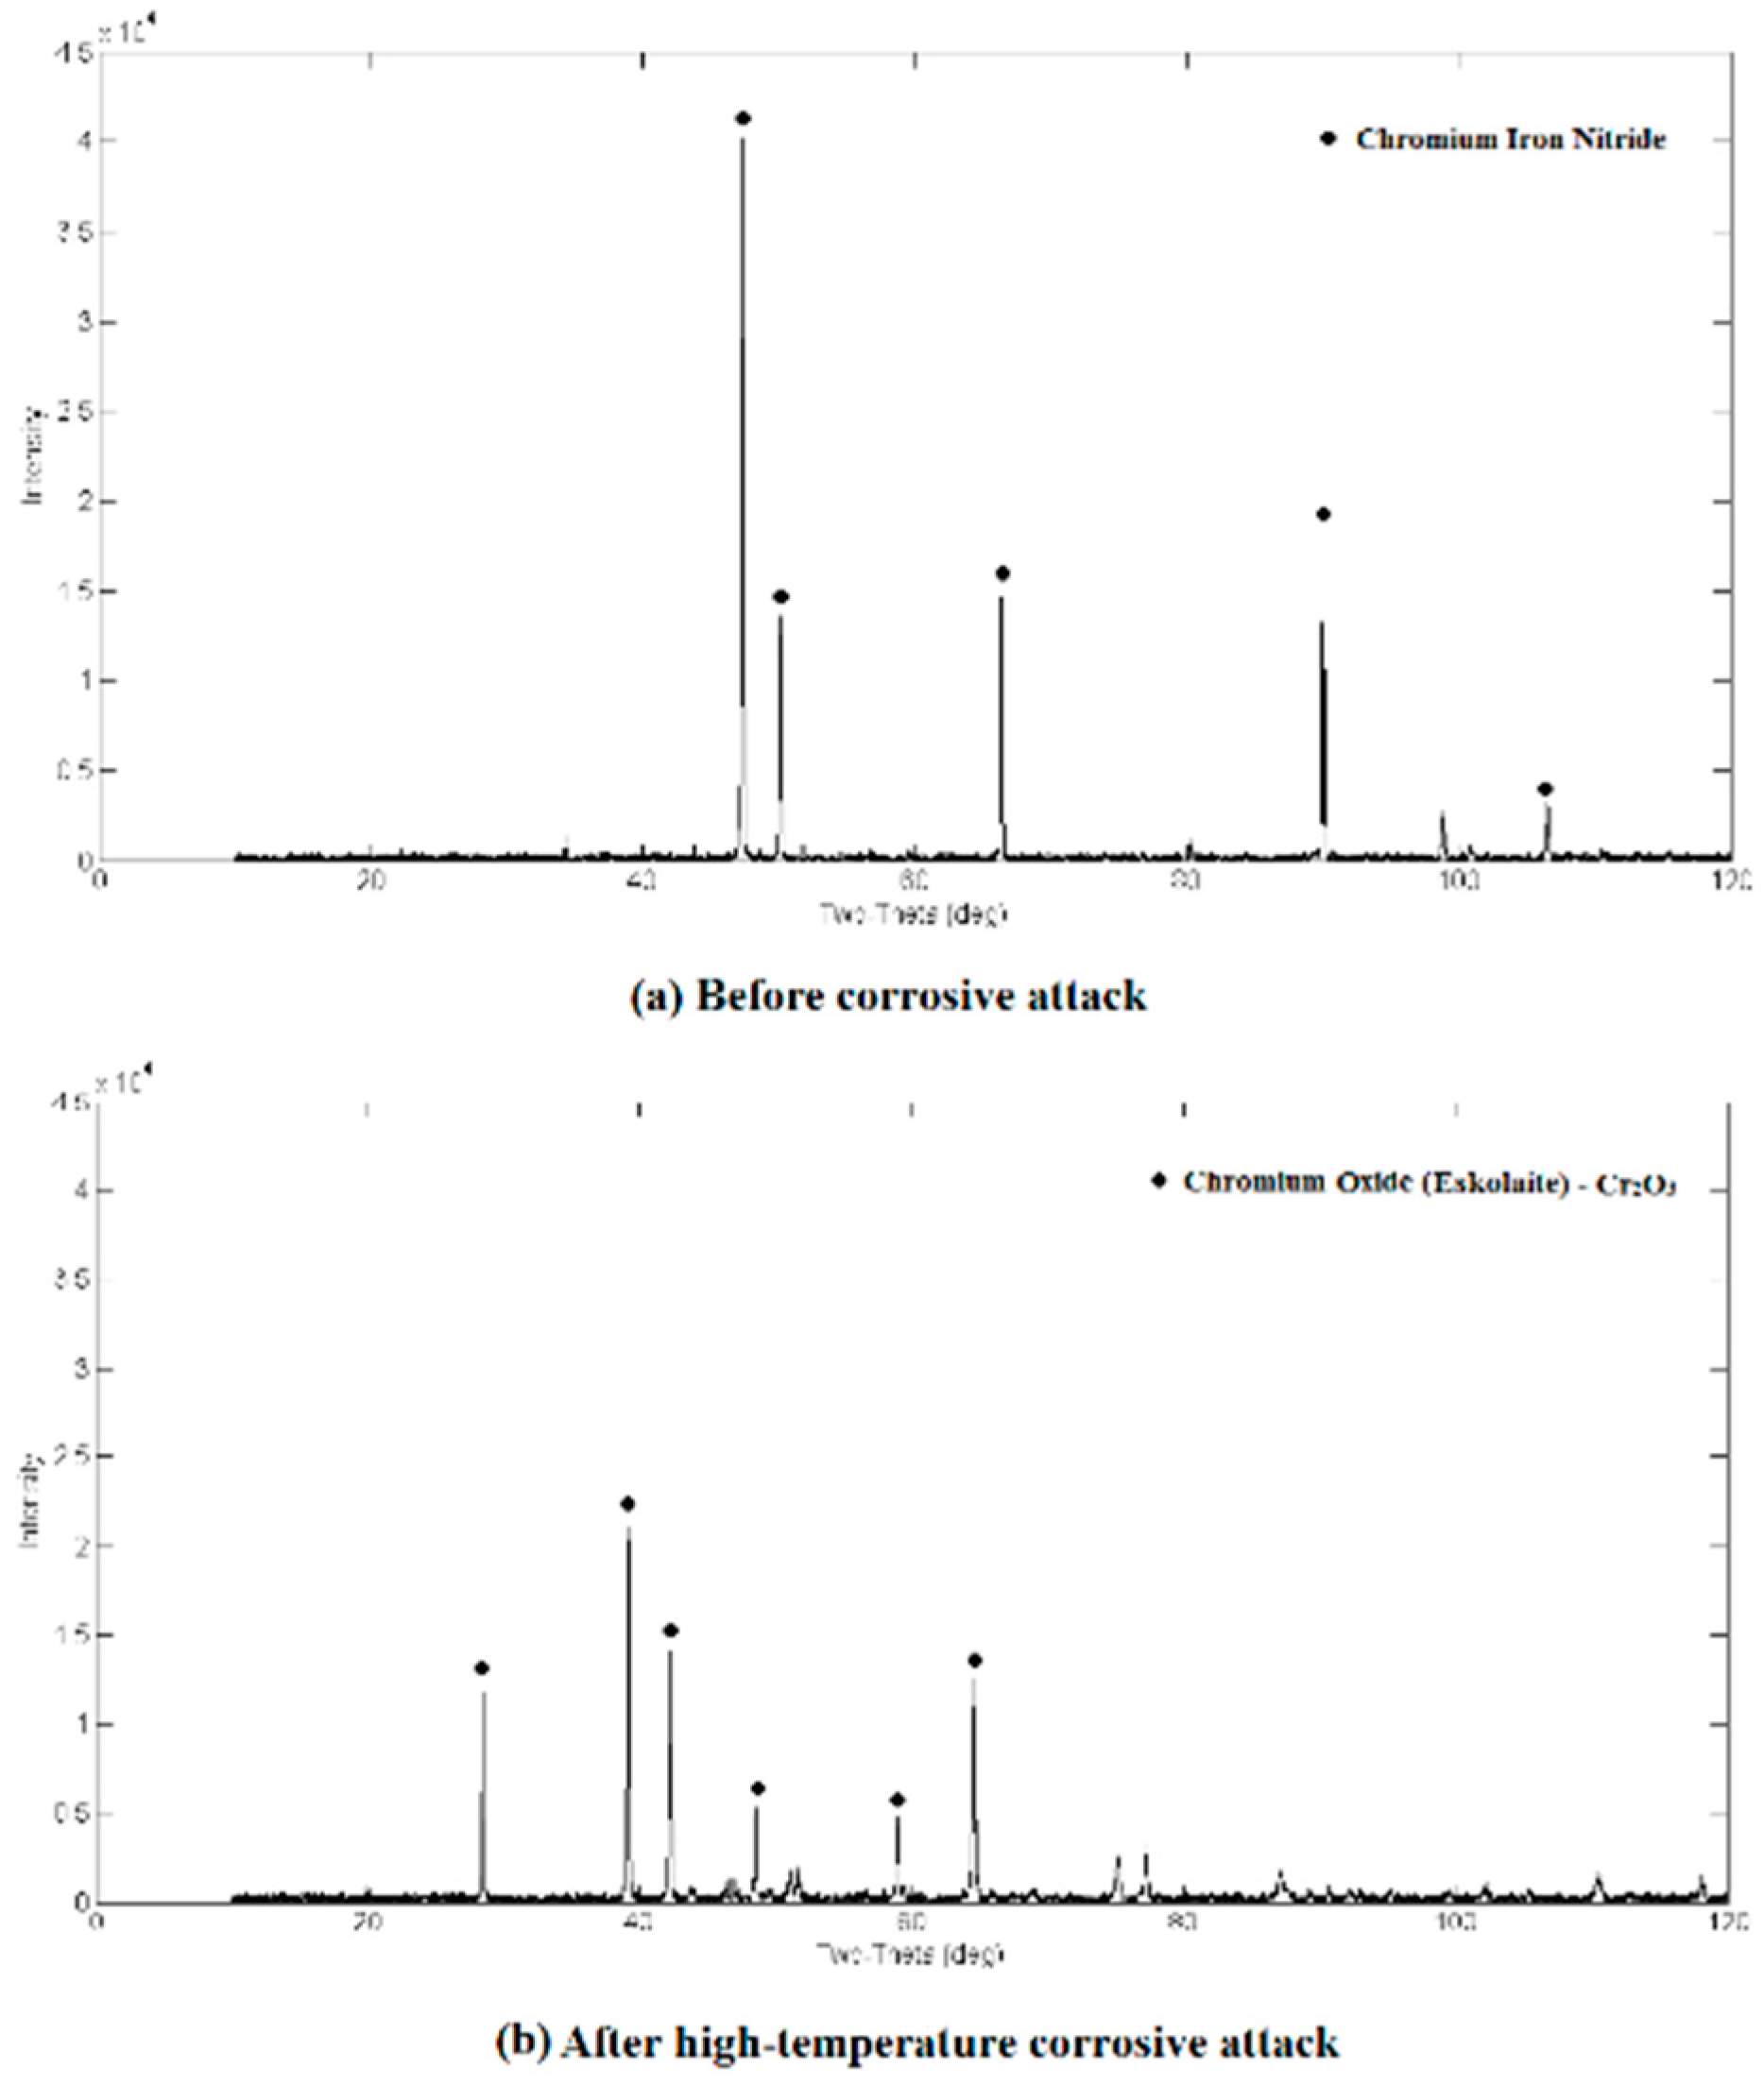
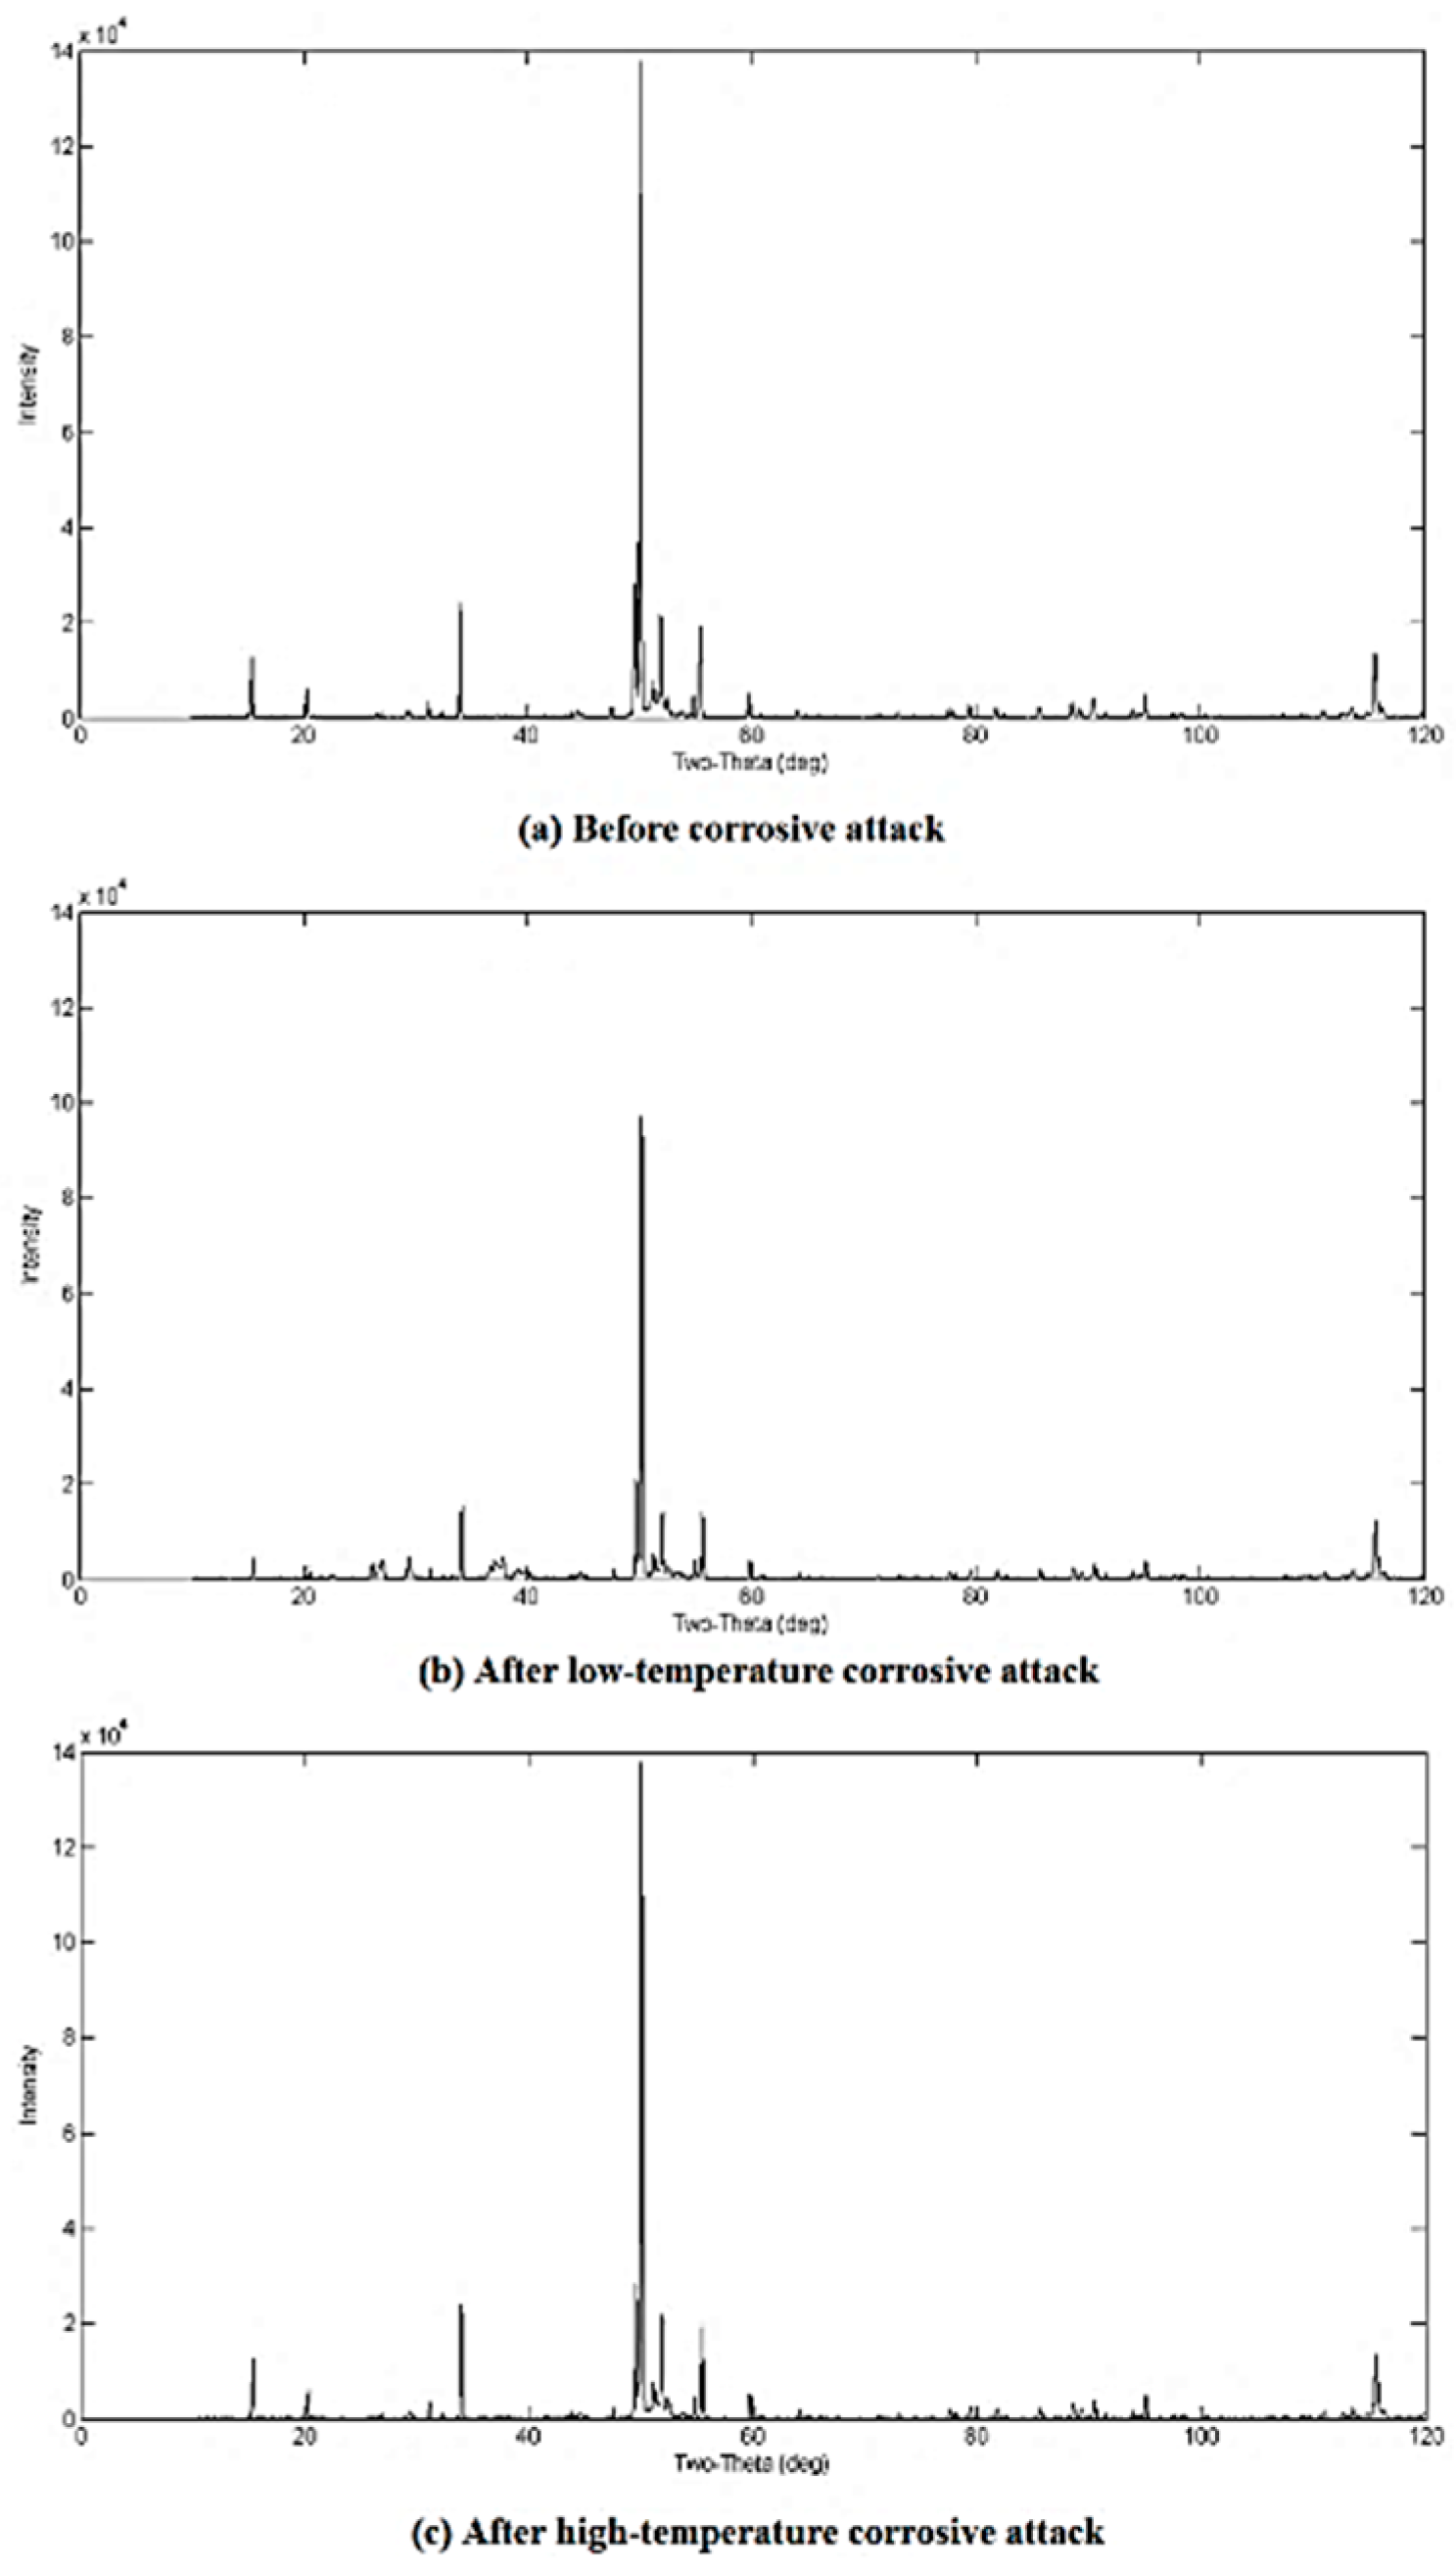
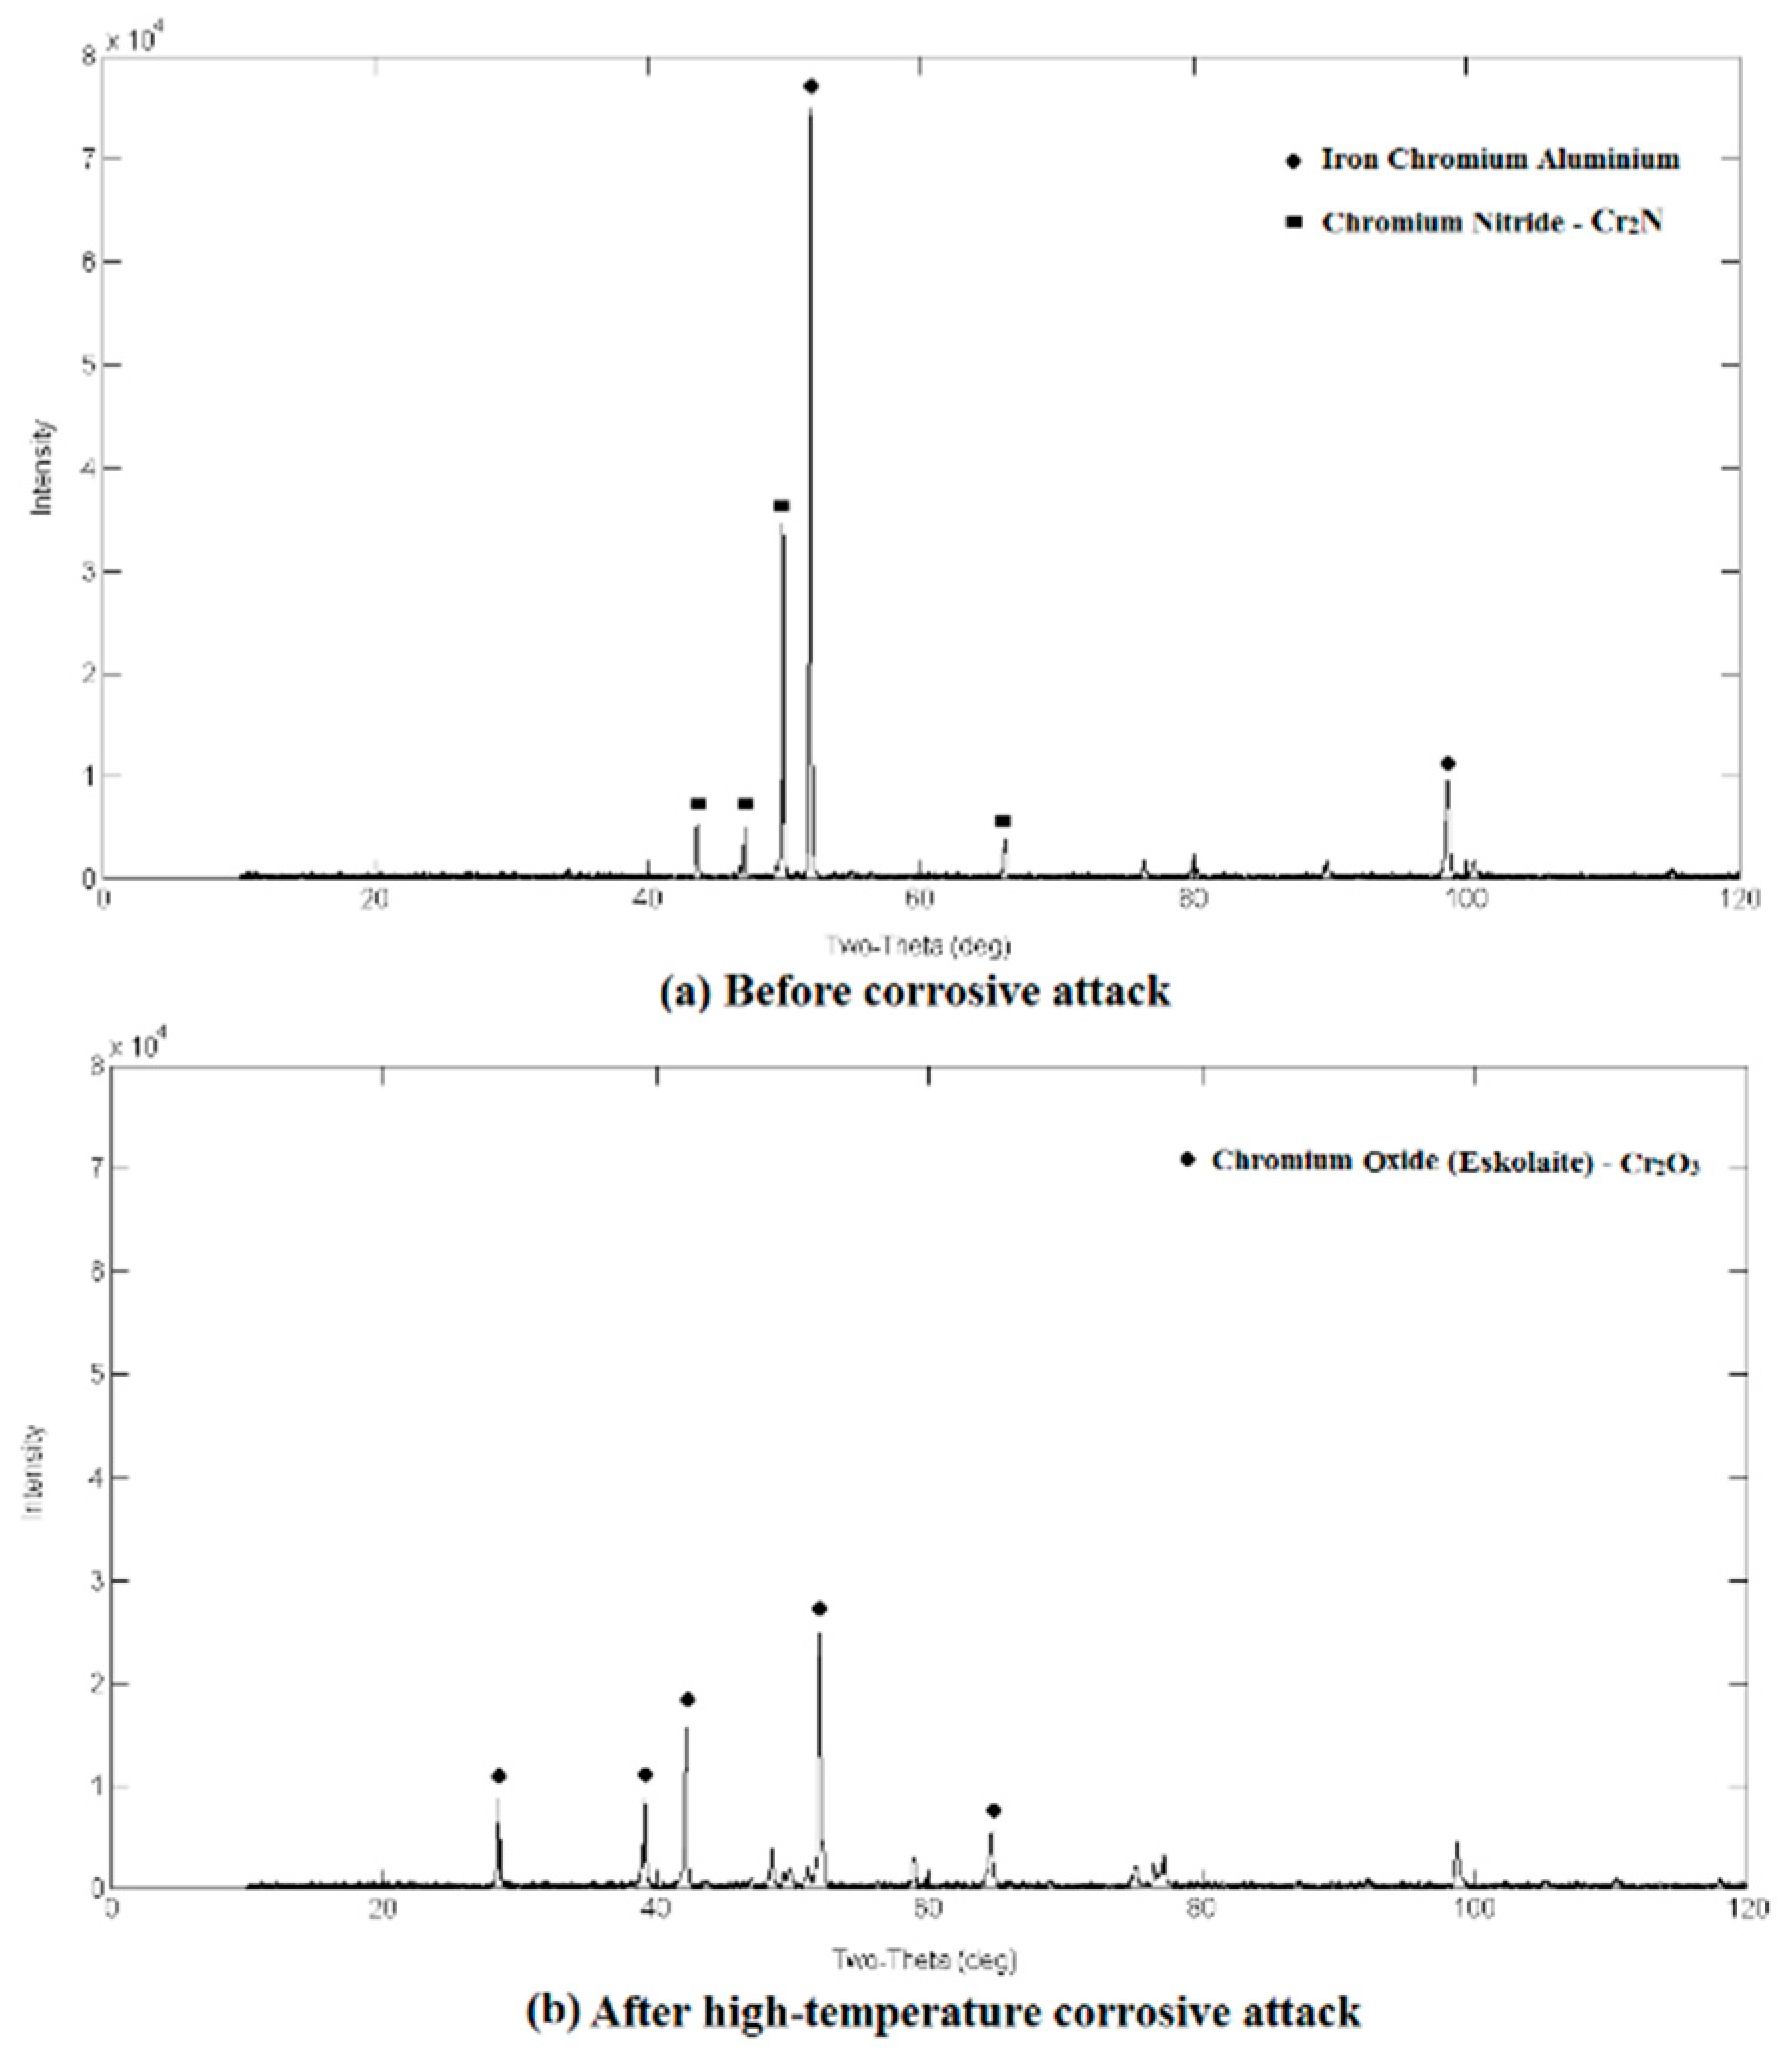
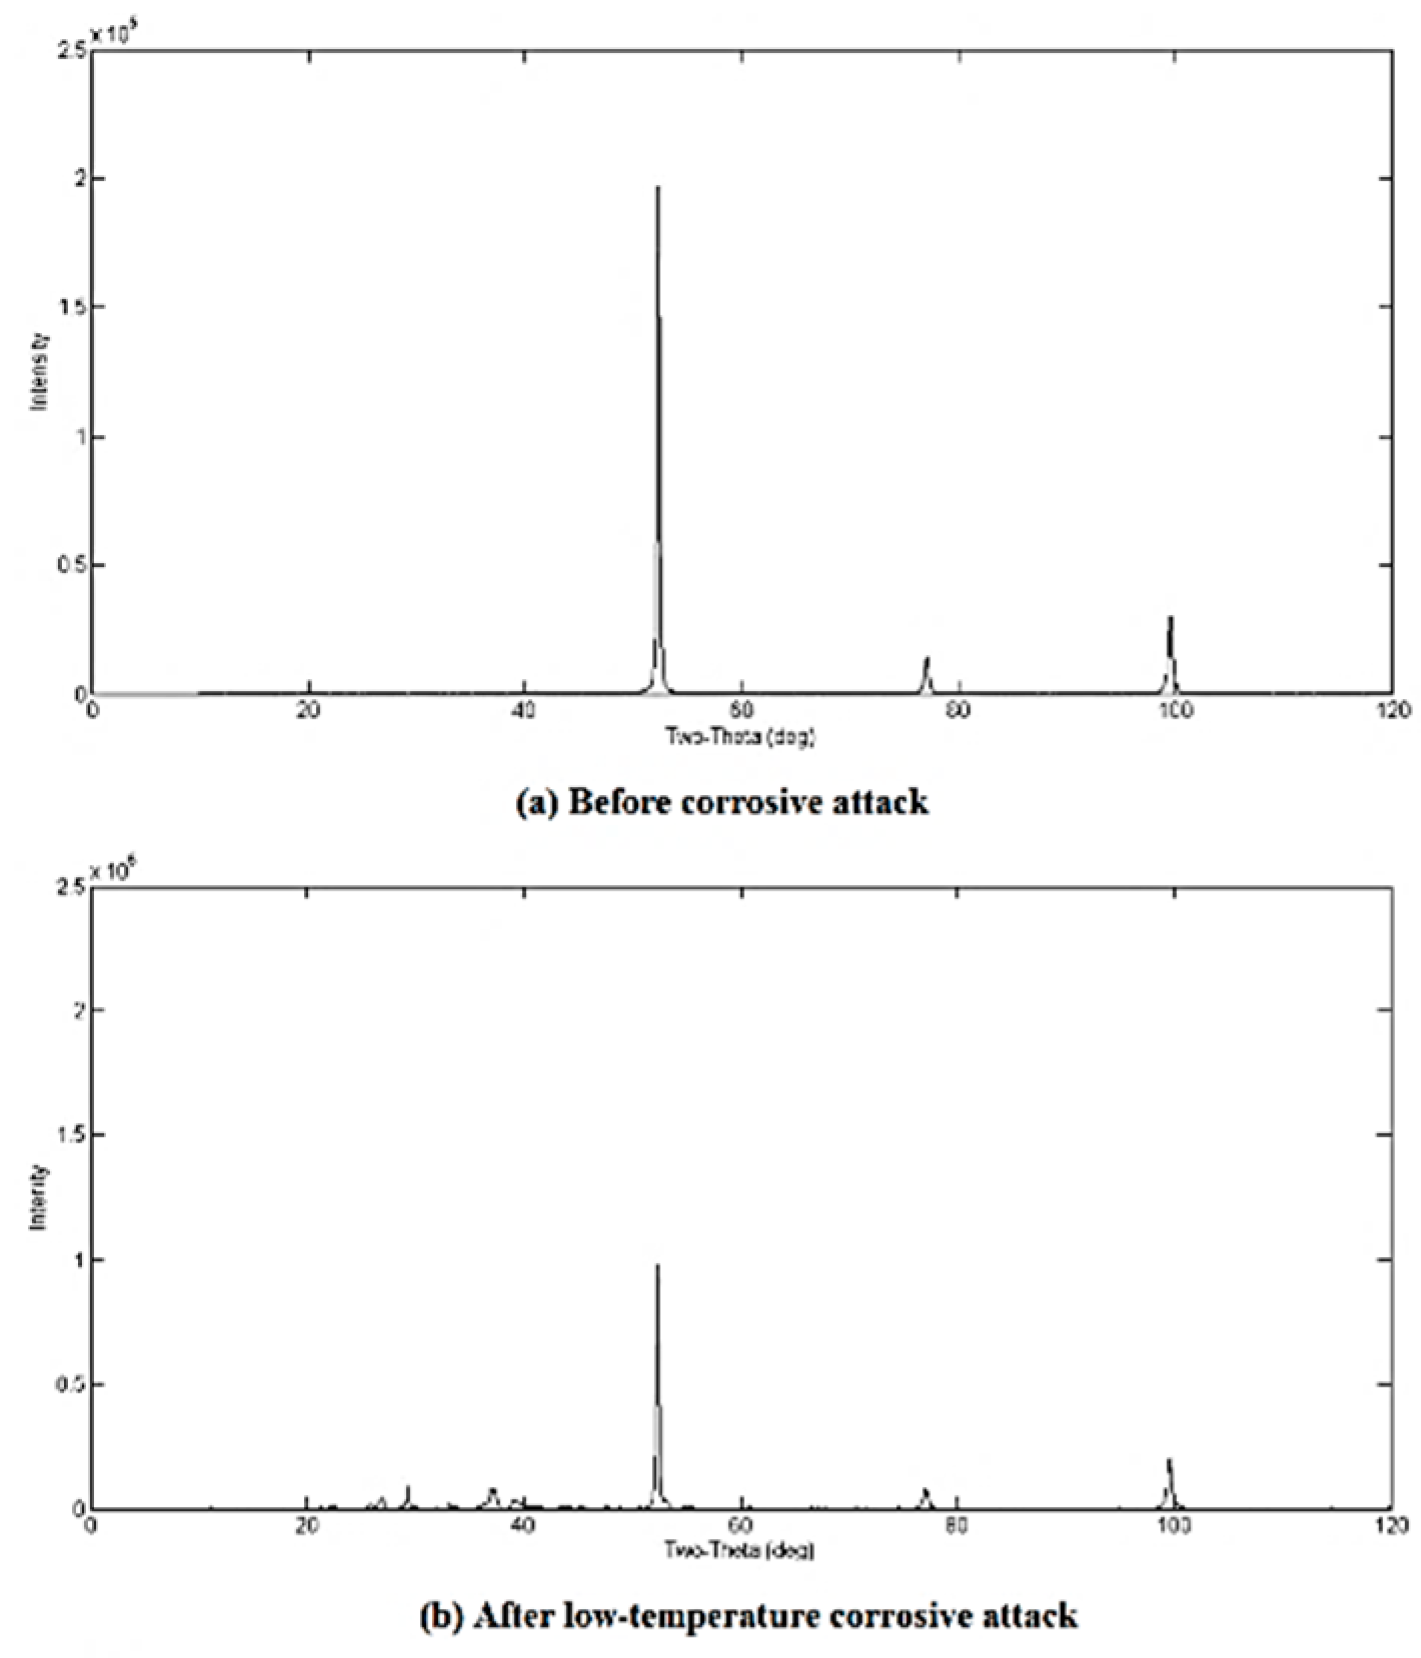
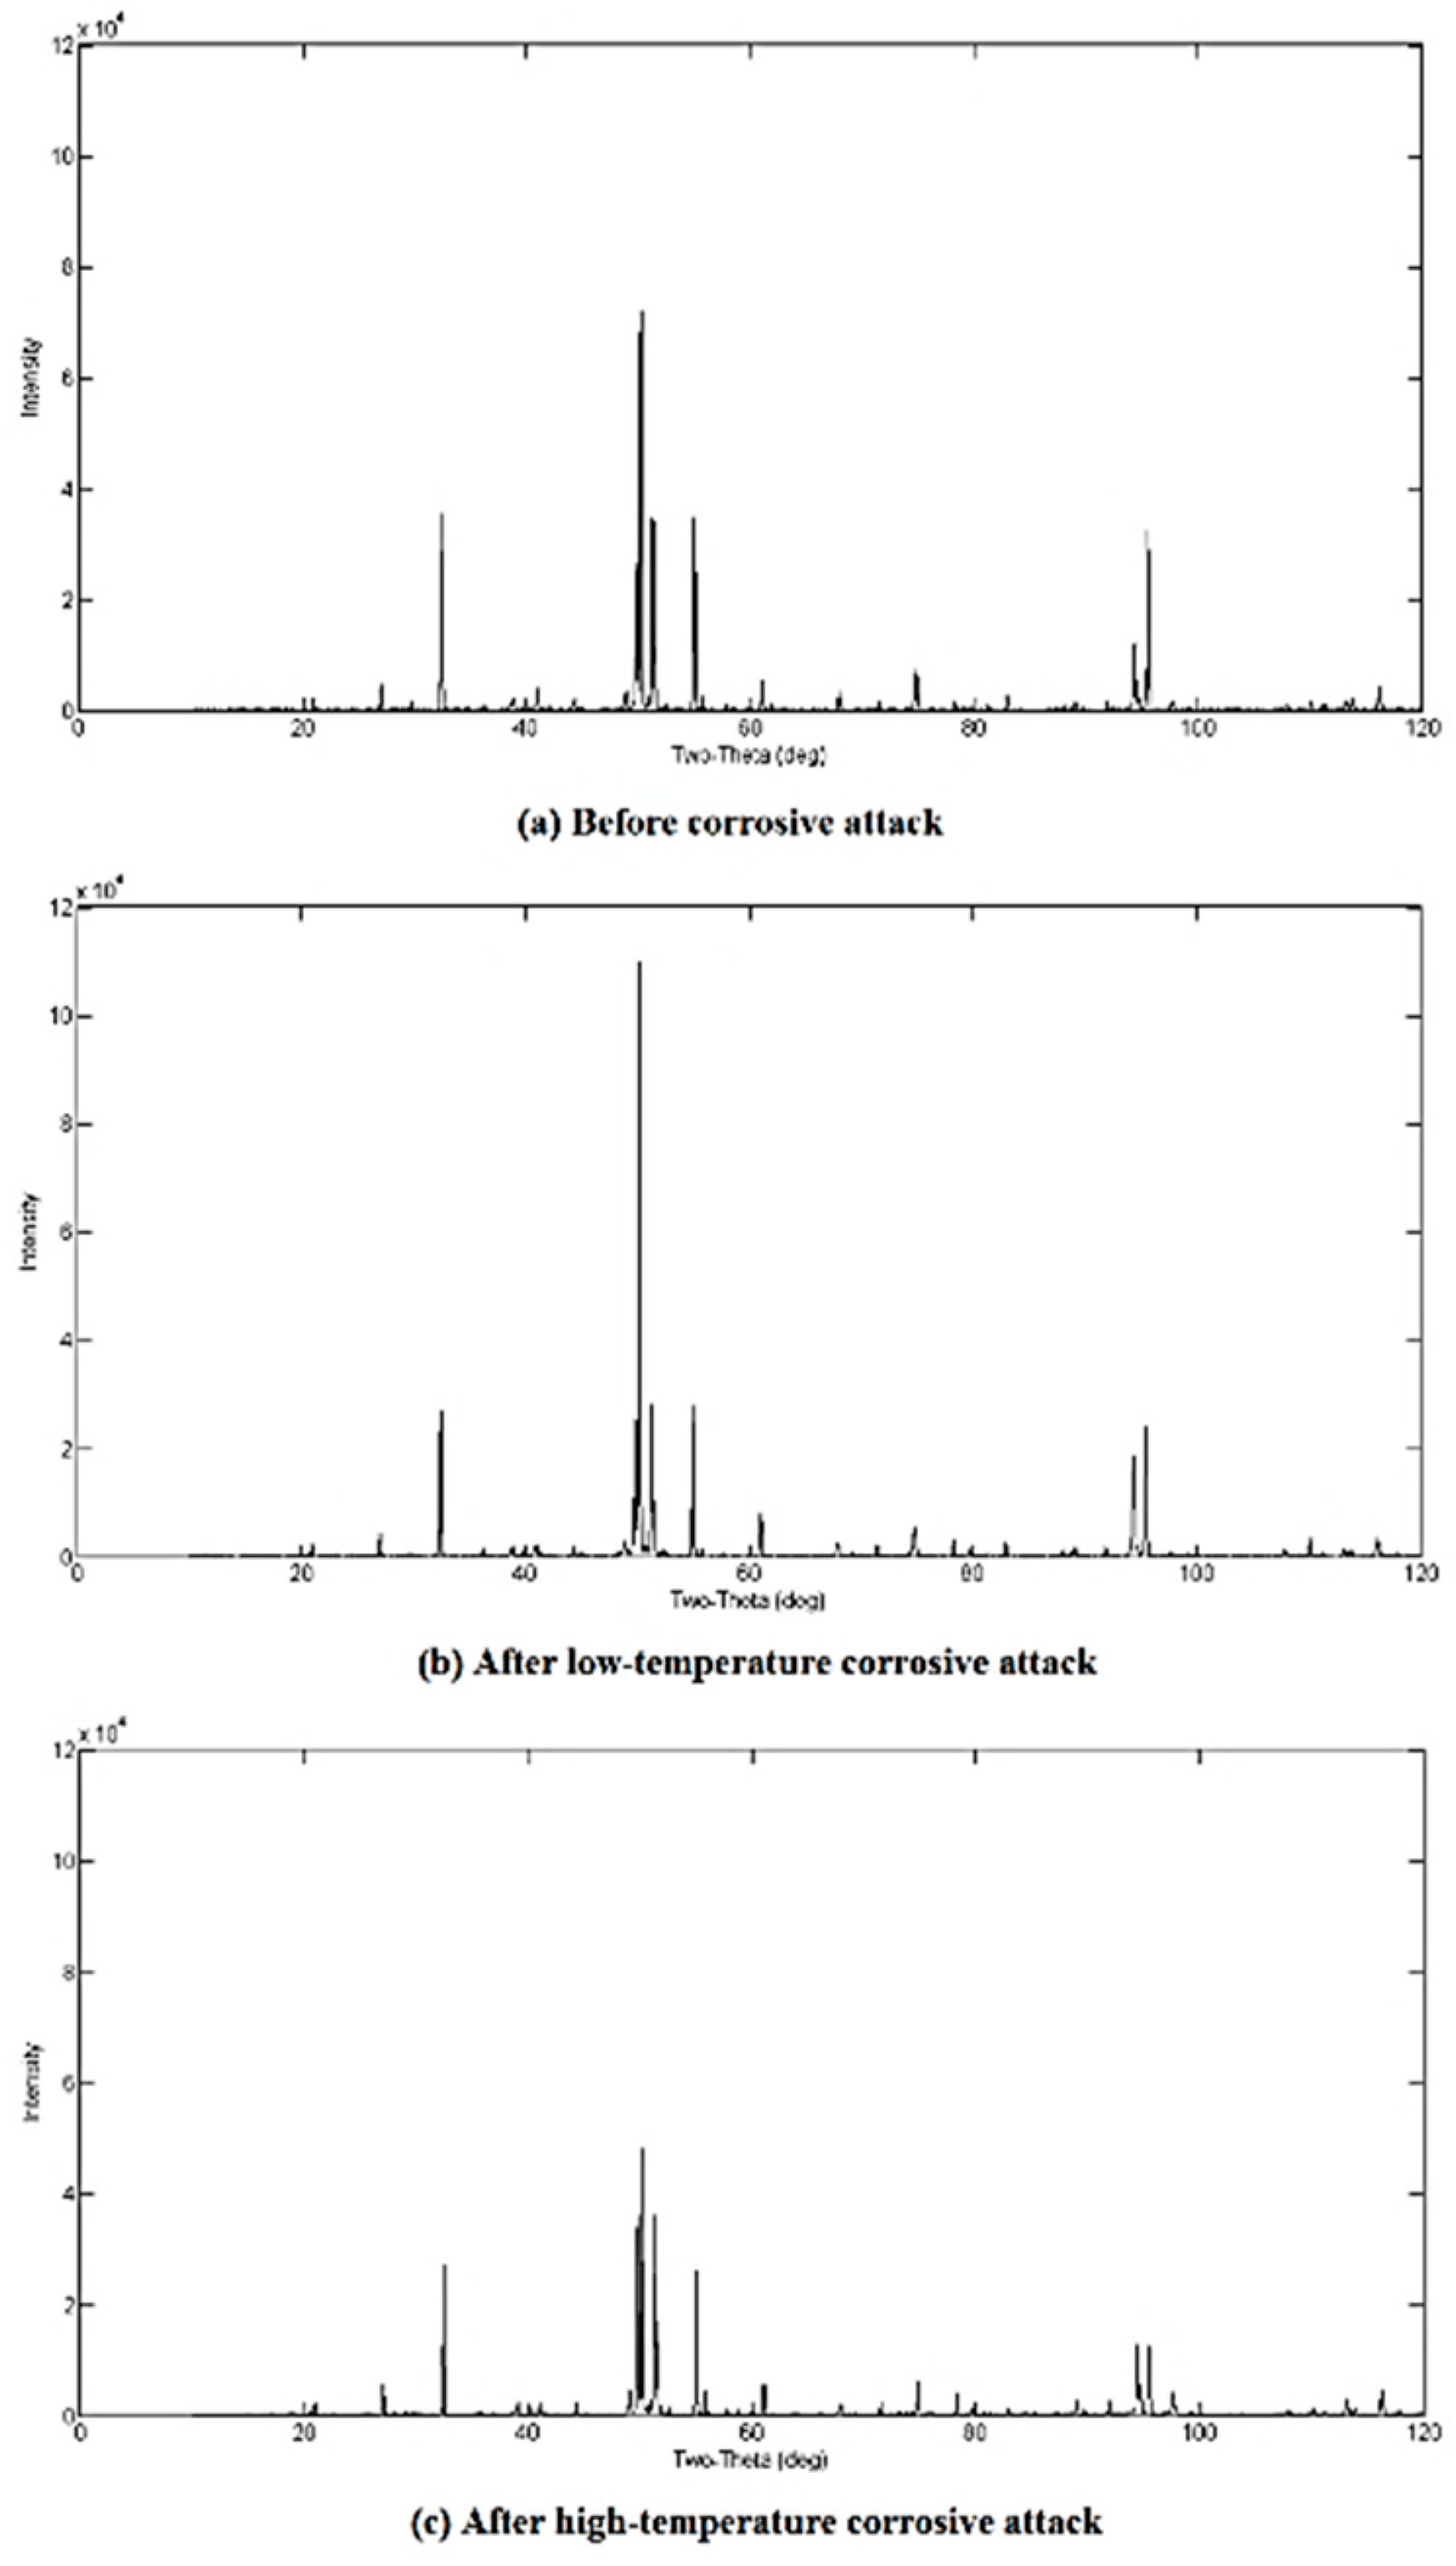
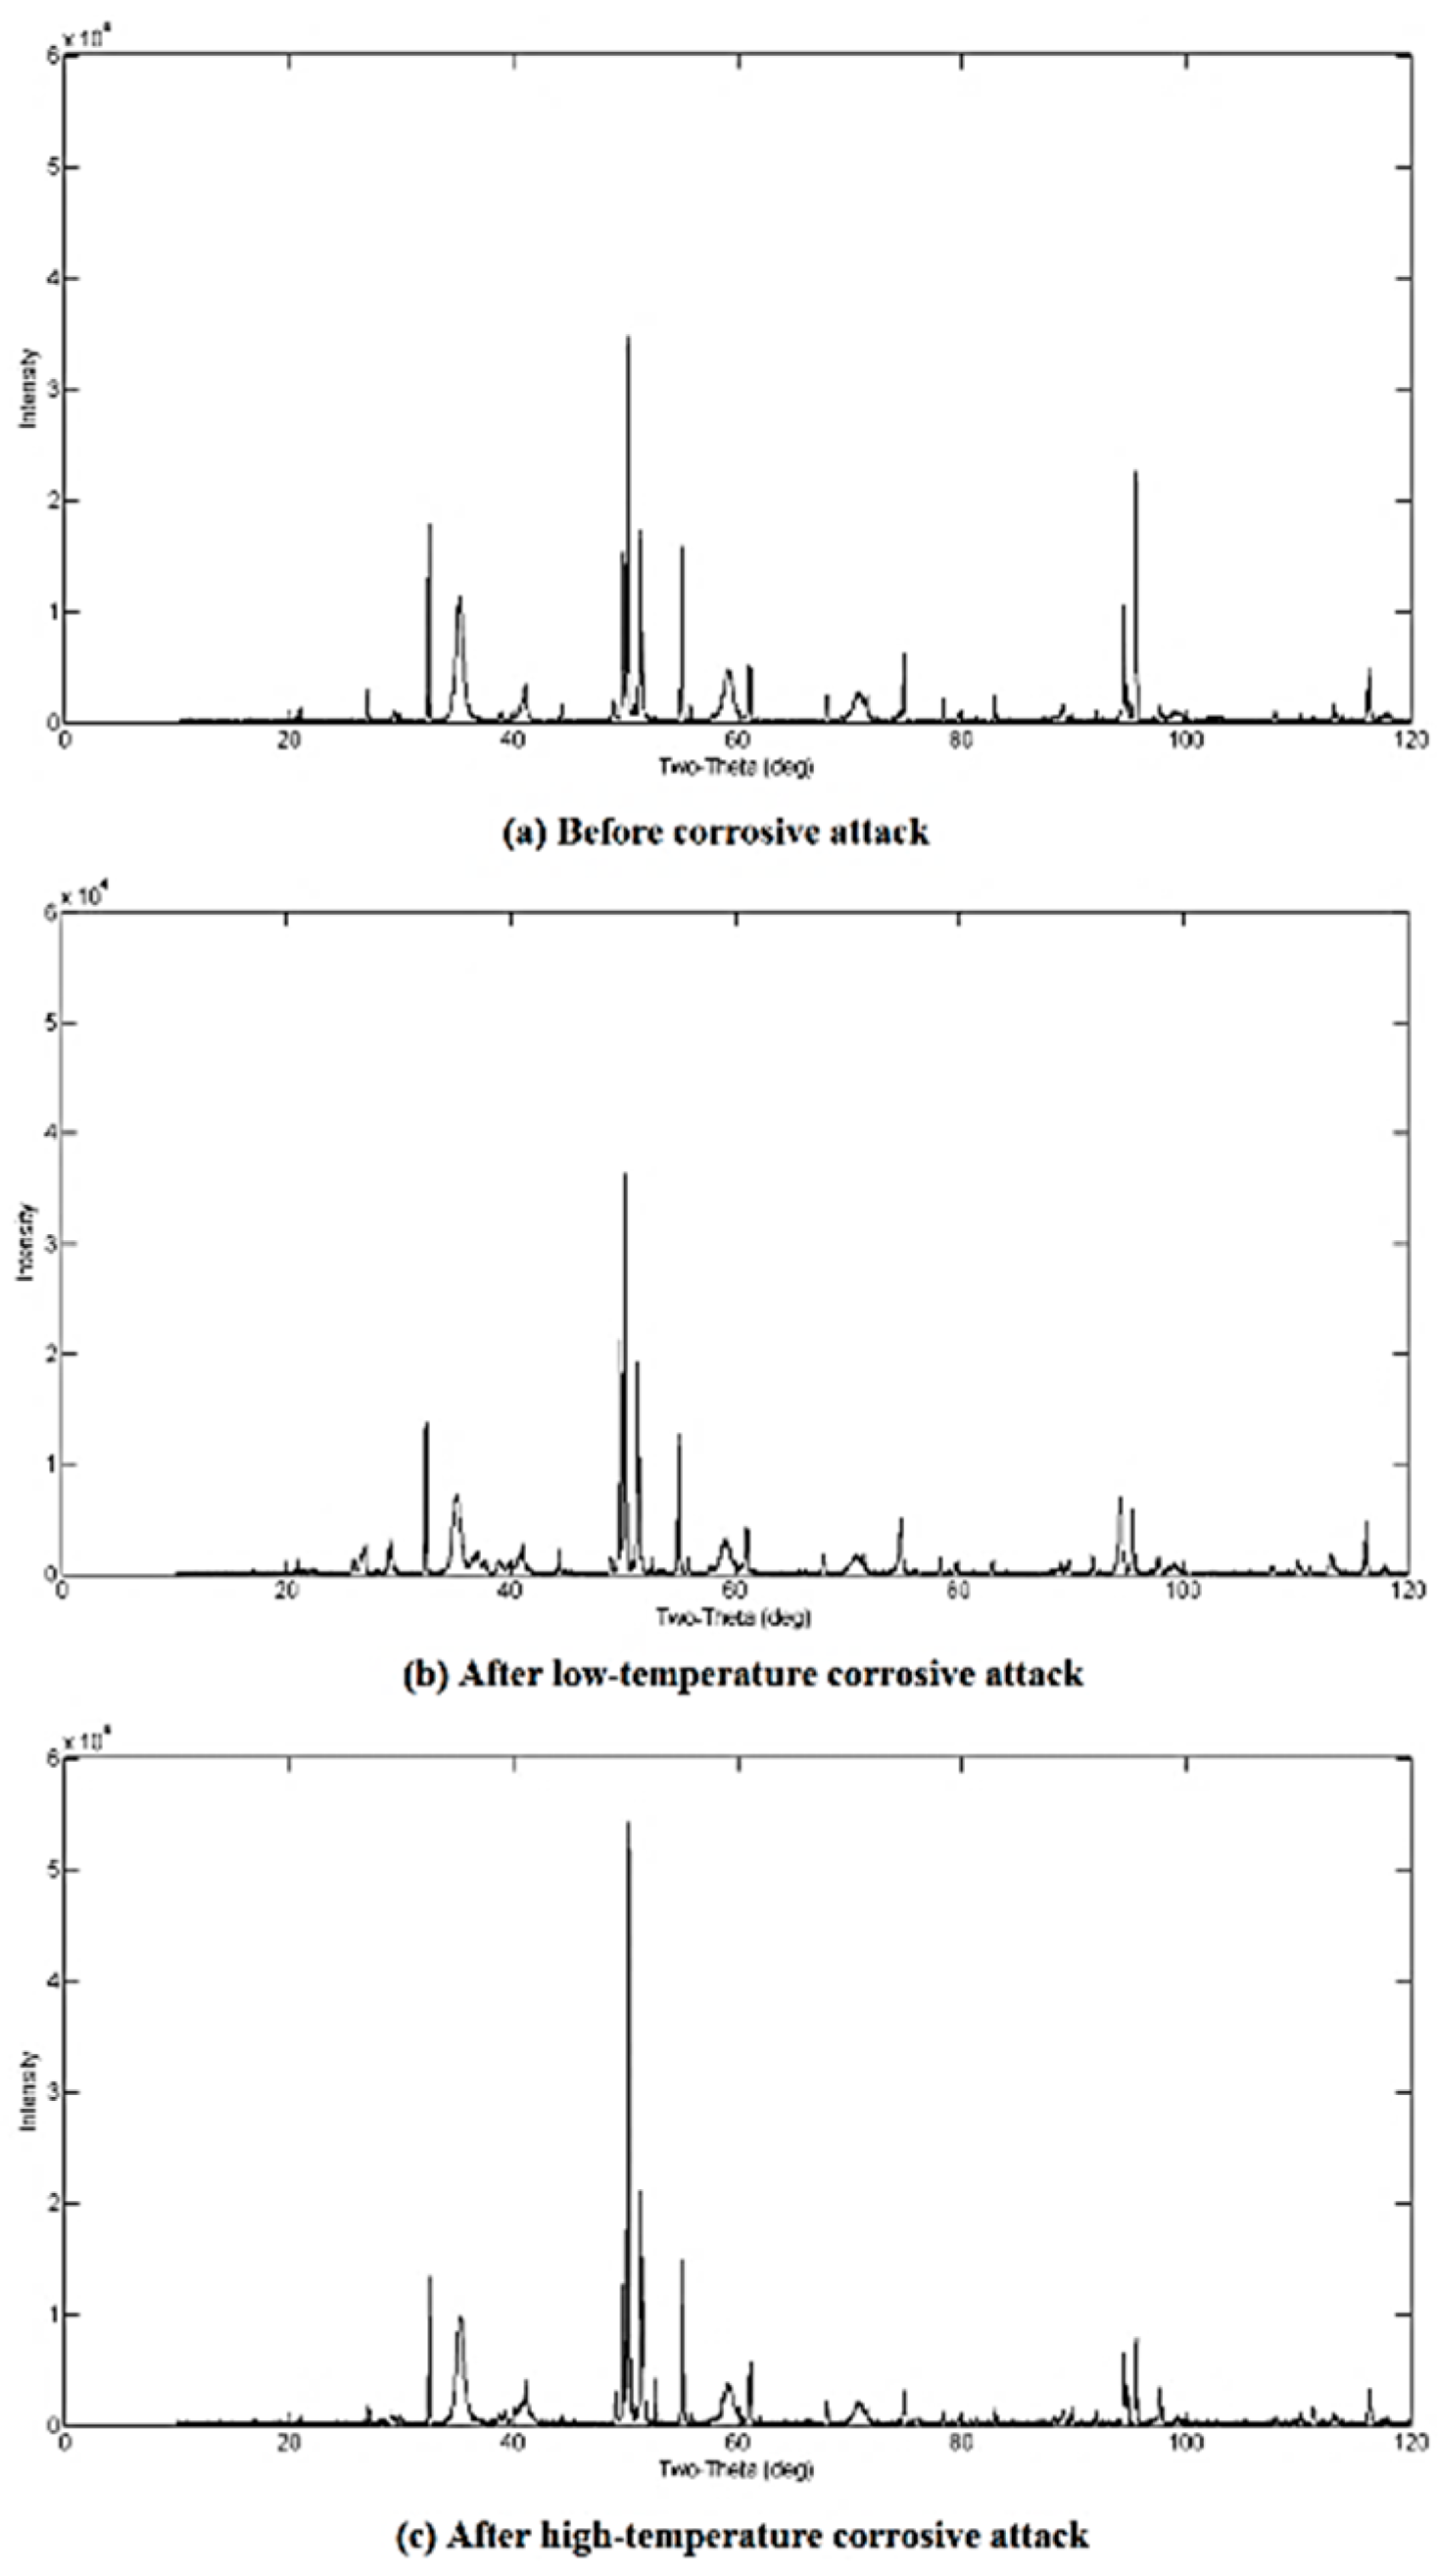
3.2. Qualitative XRD Analysis

XRD analysis was performed in order to qualify possible phase changes on the surface of the coated and bare steel samples associated with corrosion-oxidation. In this regard, the top surface of the samples was analyzed before and after the low- and high-temperature corrosive attack, and the positions of the diffraction peaks and their intensities were compared. This approach is widely used for the corrosion evaluation, and it was successfully utilized by Melendez and McDonald for the studies of some metal–matrix composite coatings [57]. All the samples with coatings did not experience the formation of new phases after low-temperature exposure in the contact with the unmolten salt. The XRD profiles of the coated samples confirmed that since the location of the peaks associated with the two-theta coordinates remained unchanged for the samples examined before and after low-temperature corrosive attack (see Figure A22, Figure A23, Figure A24, Figure A25, Figure A26 and Figure A27 and Figure A29, Figure A30 and Figure A31 in Appendix D).
After the high-temperature exposure in the molten salt, the aluminized samples with top SnO2 and ZrO2-based layers also did not experience the phase formation; their XRD profiles were similar for the samples examined before and after corrosion testing, although the intensity of some peaks changed (See Figure A23, Figure A24, Figure A30, and Figure A31 in Appendix D). It may be related to the slight surface oxidation of the aluminides with formation of the Al2O3 film. The XRD peaks that were due to the very thin Al2O3 films likely overlapped with other peaks that were due to the materials under this film; therefore, the XRD results may not be very clear or conclusive as it relates to the thin Al2O3 films. Generally, the aluminized coatings experience oxidation at temperatures of 600–1000 °C with formation of very thin Al2O3-based films. Higher temperatures will lead to greater oxidation of the aluminized coatings. These were observed by, and confirmed in, studies by other investigators [58,59,60]. In addition, due to the relatively low temperature (600 °C) for the formation, crystallization, and consolidation of thick layers of Al2O3, it was suspected that the Al2O3 film that was formed consisted of transition phases, which would not be clearly detected by XRD. Therefore, the XRD patterns, with the detailed indication of the phases, were not included in this manuscript. However, the results of the XRD analyses showed that the chromized low-carbon steel and 316 steel samples experienced phase changes at their surfaces after high-temperature corrosive attack. As shown in Figure A28 and Figure A32 in Appendix D, the predominant phase in the coatings after the high-temperature corrosive attack for both samples was chromium oxide Cr2O3 (which is also known as Eskolaite), and its formation was associated with the remarkable oxidation of the chromides in the coatings. As explained earlier, the presence of ions originated from the molten salt under the elevated temperature conditions (600 °C) stimulated the oxidation of chromium, which resulted in the observed phase change in the coating, which in turn, may be considered as a degradation of the thermal diffusion chromized coatings. However, the XRD data did not show the presence of the chromium salts, which may be associated with interaction of the chromide coatings with molten salts.
Regarding the uncoated steels (low-carbon steel and 316 stainless steel), new peaks corresponded to the formation of new phases can be observed on the diffractograms. Also the noticeable increase in the intensity of some peaks after high-temperature corrosive attack may be related to the formation of iron oxides (Fe2O3 and Fe3O4), and, probably, to the formation of iron chlorides and sulfates (see Figure A22 and Figure A29 in Appendix D). The suggested formation of new phases is supported by the data obtained by other researchers [7,10,12]. The obtained results of the XRD analysis correspond well to the data obtained from the microstructural examination of the studied materials. Since the intensity of the peaks was only the representative of the percentage of a particular phase in the coating, the intensity differed after long time exposure to the high-temperature environment. The XRD analysis of the coatings with particular identification of certain phases requires an additional work.

3.3. Mass Change after Corrosive Attack

The relative mass change after 168 h of exposure to the low- and high-temperature environments is shown on Figure 6. Each sample, on average, had about 225.7 ± 81.8 mg (n = 11) of the salt solution on their surfaces before the corrosive attack. The relative mass change for all samples, both for the control samples (bare steels) and the aluminized and boronized substrates, was negligible (less than 0.02%) in the case of the low-temperature corrosive conditions (Figure 6a). However, the relative mass change increased after the high-temperature corrosive attack. As shown in Figure 6b, the maximum mass change was recorded for the uncoated low carbon steel (approximately 1%). The mass change gradually increased at the exposure time increase. In addition to the uncoated low carbon steel, Figure 6b confirmed that the mass change for all other samples, as a result of the high-temperature corrosive attack, was low (significantly less than 1%). The top surface of the uncoated steels (control samples) experienced delamination of the rusting scale after the high-temperature corrosive attack (see Figure 4 and Figure 5 demonstrating the microstructures of the steels exposed and Figure A2 in Appendix A) that is especially related to the carbon steel sample.
The weight change in the samples typically corresponds to the mass loss due to corrosion (“dissolution”) of the material exposed to the salt at elevated temperatures and mass gain due to oxidation of the surface. The formation of the corrosion products with lower density may also affect the mass reduction. Moreover, the weight change may depend on whether or not the formed oxide or corrosion layers have a strong adhesion to the surface of samples. If the adhesion is not sufficient, delamination of the oxide layer will take place. In the case of the coated samples in this study (boronized, aluminized, and chromized samples), no delamination occurred. In the case of bare steels, especially for carbon steel exposed to the high-temperature corrosion, the scale layer flaked-off (delaminated) from the surface. Because of these two “concurrent” cases (mass loss due to corrosion and mass gain due to oxidation at elevated temperature), the values of the mass change for the uncoated samples cannot be considered as very accurate and may vary at different situations.

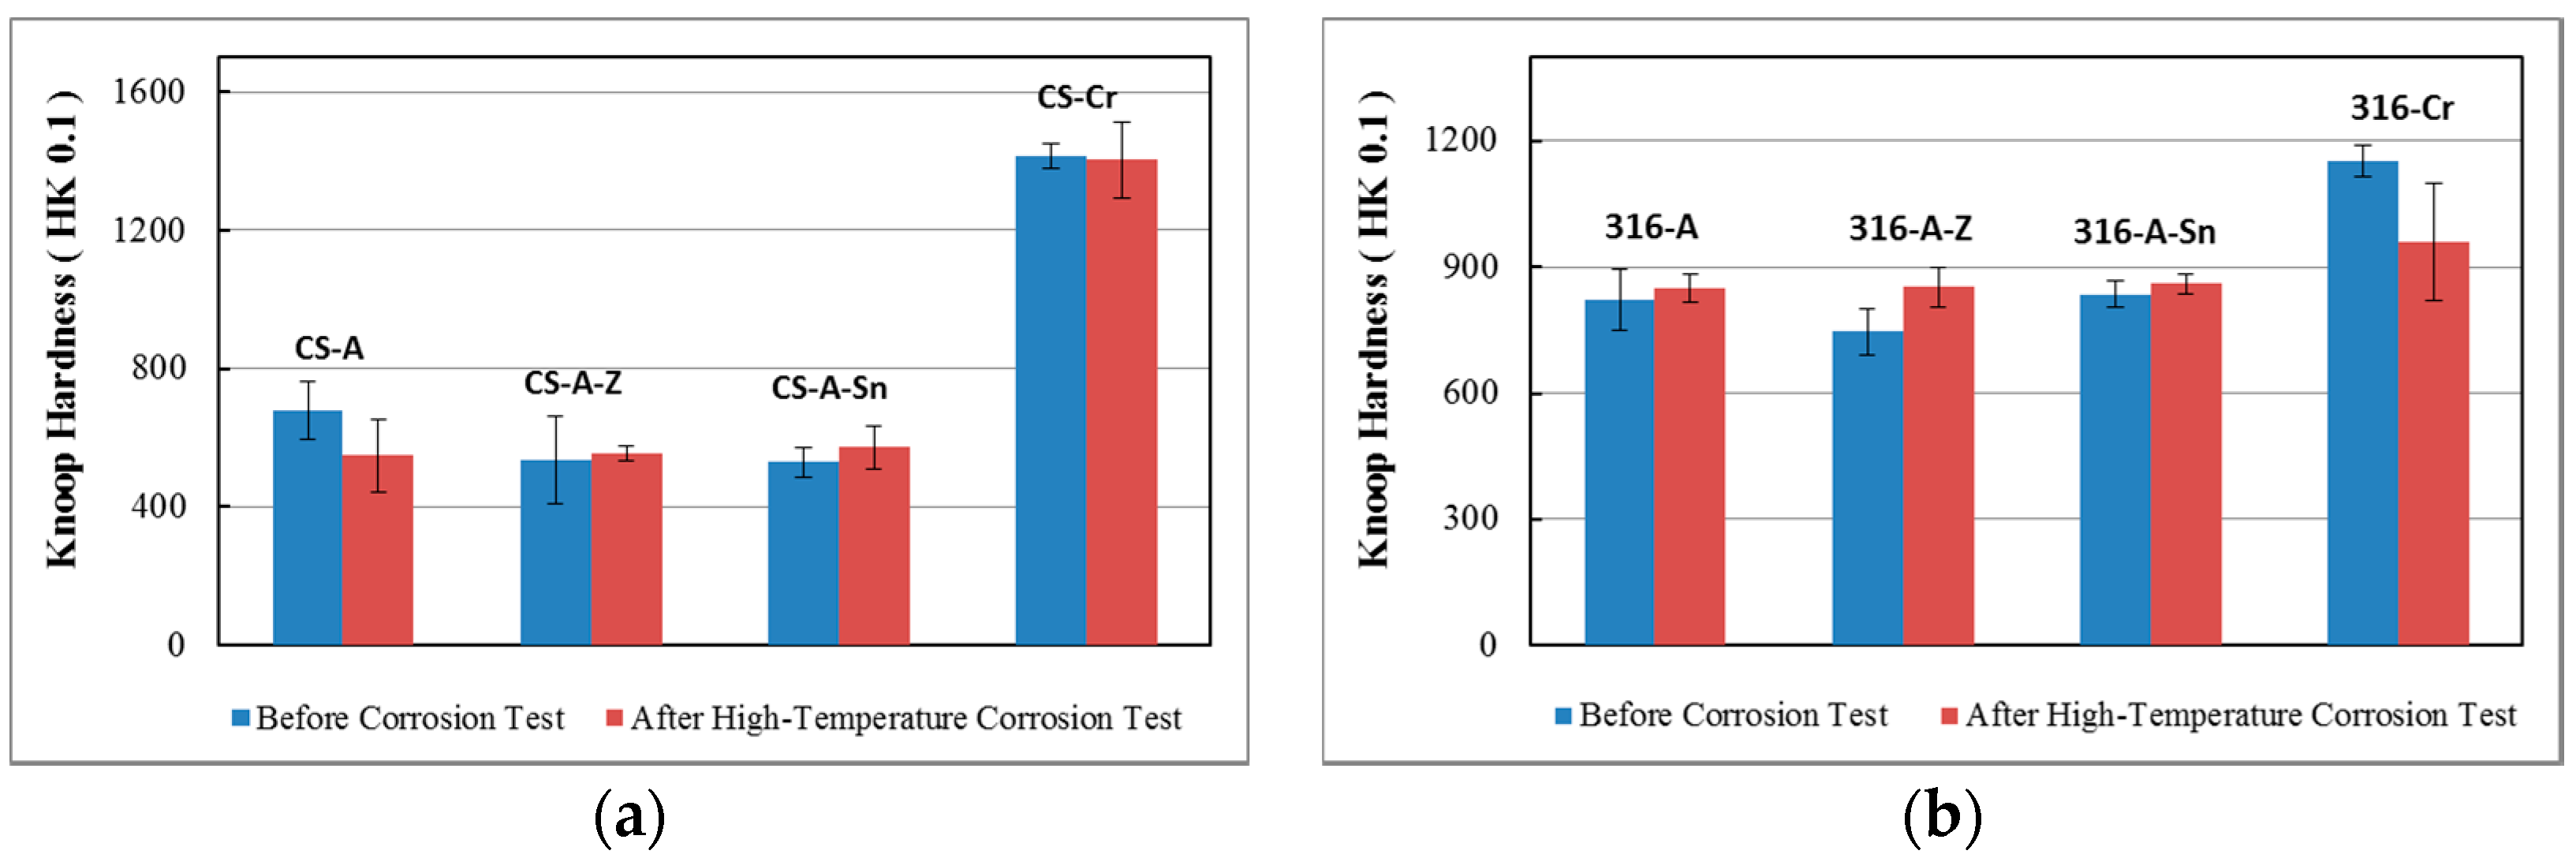
3.4. Hardness Evaluation

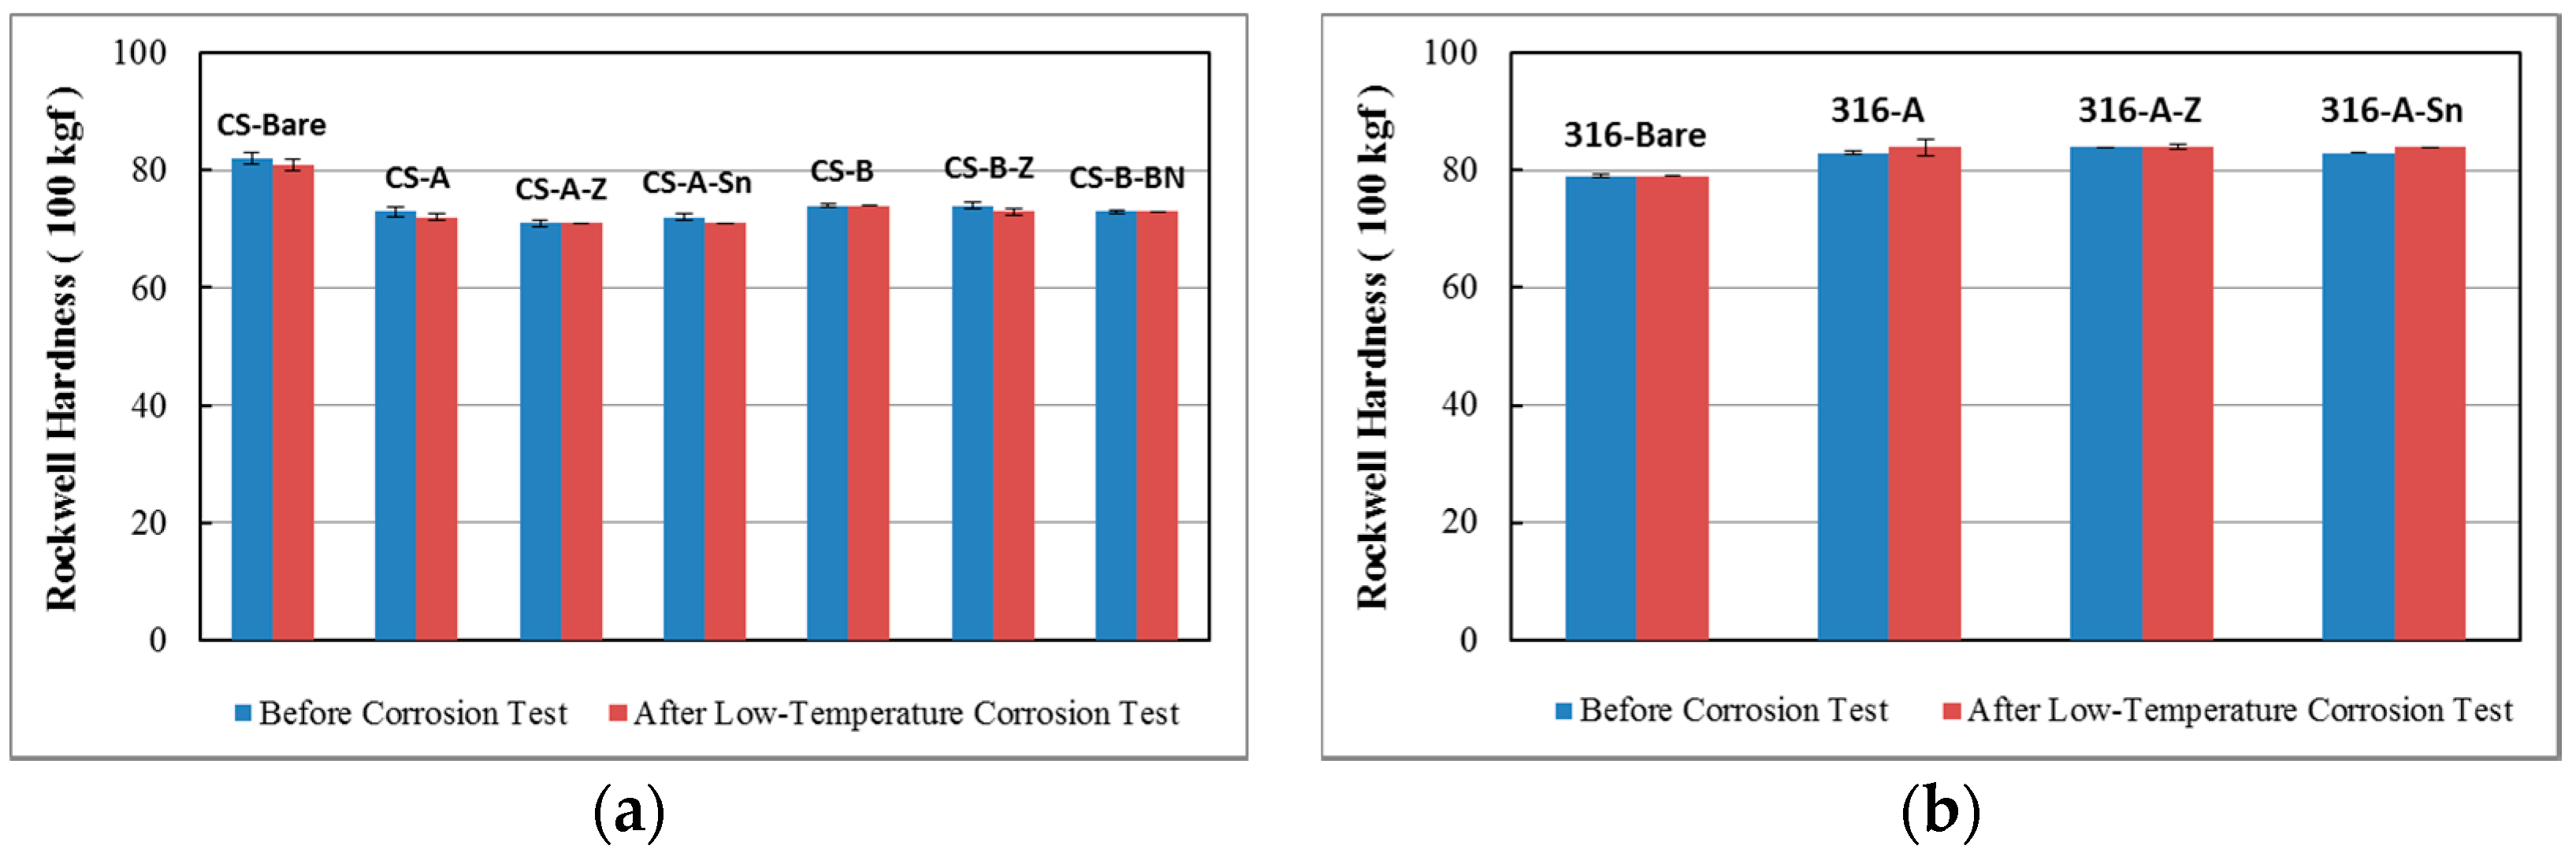
3.4.1. Hardness of the Substrates

The hardness of the samples was examined before and after the corrosion tests by employing two different methods of measuring the hardness, namely, the micro-indentation hardness test (Knoop test) and Rockwell hardness test. These tests were performed both on the cross-section of the original substrate, and at a specific location in the middle area of the case depth of the sample. Figure 7 shows the location of the indentation of the Knoop and Rockwell hardness tests on the original substrate.
The hardness determination results, e.g., Knoop micro-hardness and Rockwell B hardness, for the samples examined before and after corrosion-oxidation testing for 168 h are presented in Figure 8, Figure 9, Figure 10 and Figure 11. From a comparison of the hardness values based on HK 0.1 and HRB for the substrates, it was observed that the values did not change noticeably after low-temperature corrosive attack (Figure 8 and Figure 9). The difference between the values was within the standard deviation and standard error of the mean. However, in the case of high-temperature testing, some decrease of the hardness values could be observed for low carbon steel substrates (Figure 10 and Figure 11). The 316 stainless steel substrates did not experience significant reduction of hardness after 168 h of exposure. The decrease in the hardness values of the substrates, particularly low carbon steel, could be related to the grain growth after long exposure at high temperature. In fact, some grain growth in steels occurs both at thermal diffusion process and high-temperature corrosion testing, and this effect is especially observed in the substrate area close to the coating. As a sequence of the grain growth and related dislocations within the grains, the associated stresses result in the decrease of hardness and strength of the material [52]. The dependence of the mechanical properties reduction with the grain size increase is described by the Hall-Petch equation [52]:
σ y = σ 0 + k D
where σy and σ0 represent the yield stress and the intrinsic stress of the material, respectively, k is the strengthening coefficient, and D denotes the grain size. The intrinsic stress is defined as the initial stress for dislocation movements. According to the Hall-Petch equation, the grain size increase leads to decrease of the yield stress, and as a result, to decrease of hardness of the material. The experimental studies conducted by Busby et al. [61] confirmed the relation between yield stress and hardness of austenitic and ferritic steels. Although the stainless steel substrate did not experience the grain growth and related reduction of hardness after rather short (168 h) high temperature exposure, some grain growth and related hardness reduction of steels may be expected in the long term exposures adhered to the industrial applications. Moreover, the coarsening and possible phase transformation may occur both during the thermal diffusion process and at long exposure at elevated temperatures, and they would affect the hardness of the area close to the coating. However, the determination of the phase transformation within the carbon steel substrates requires additional study with detailed XRD analyses.

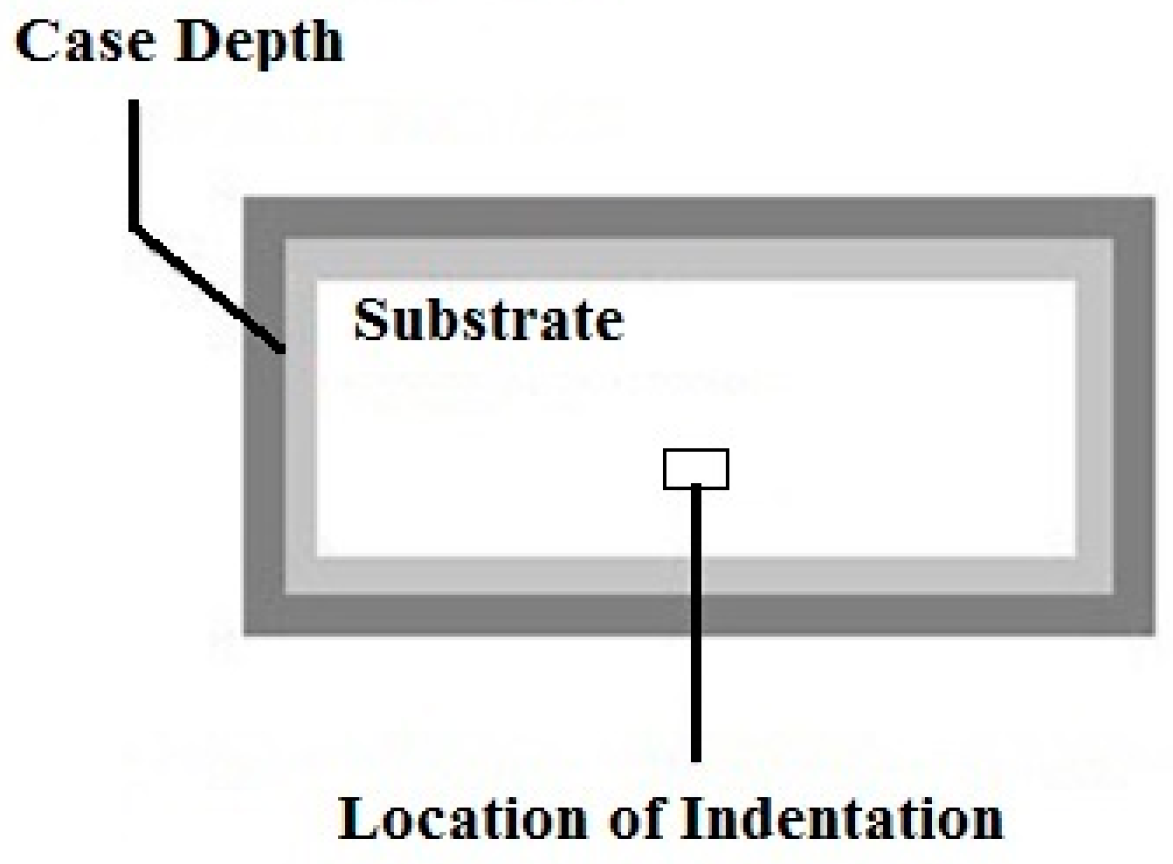
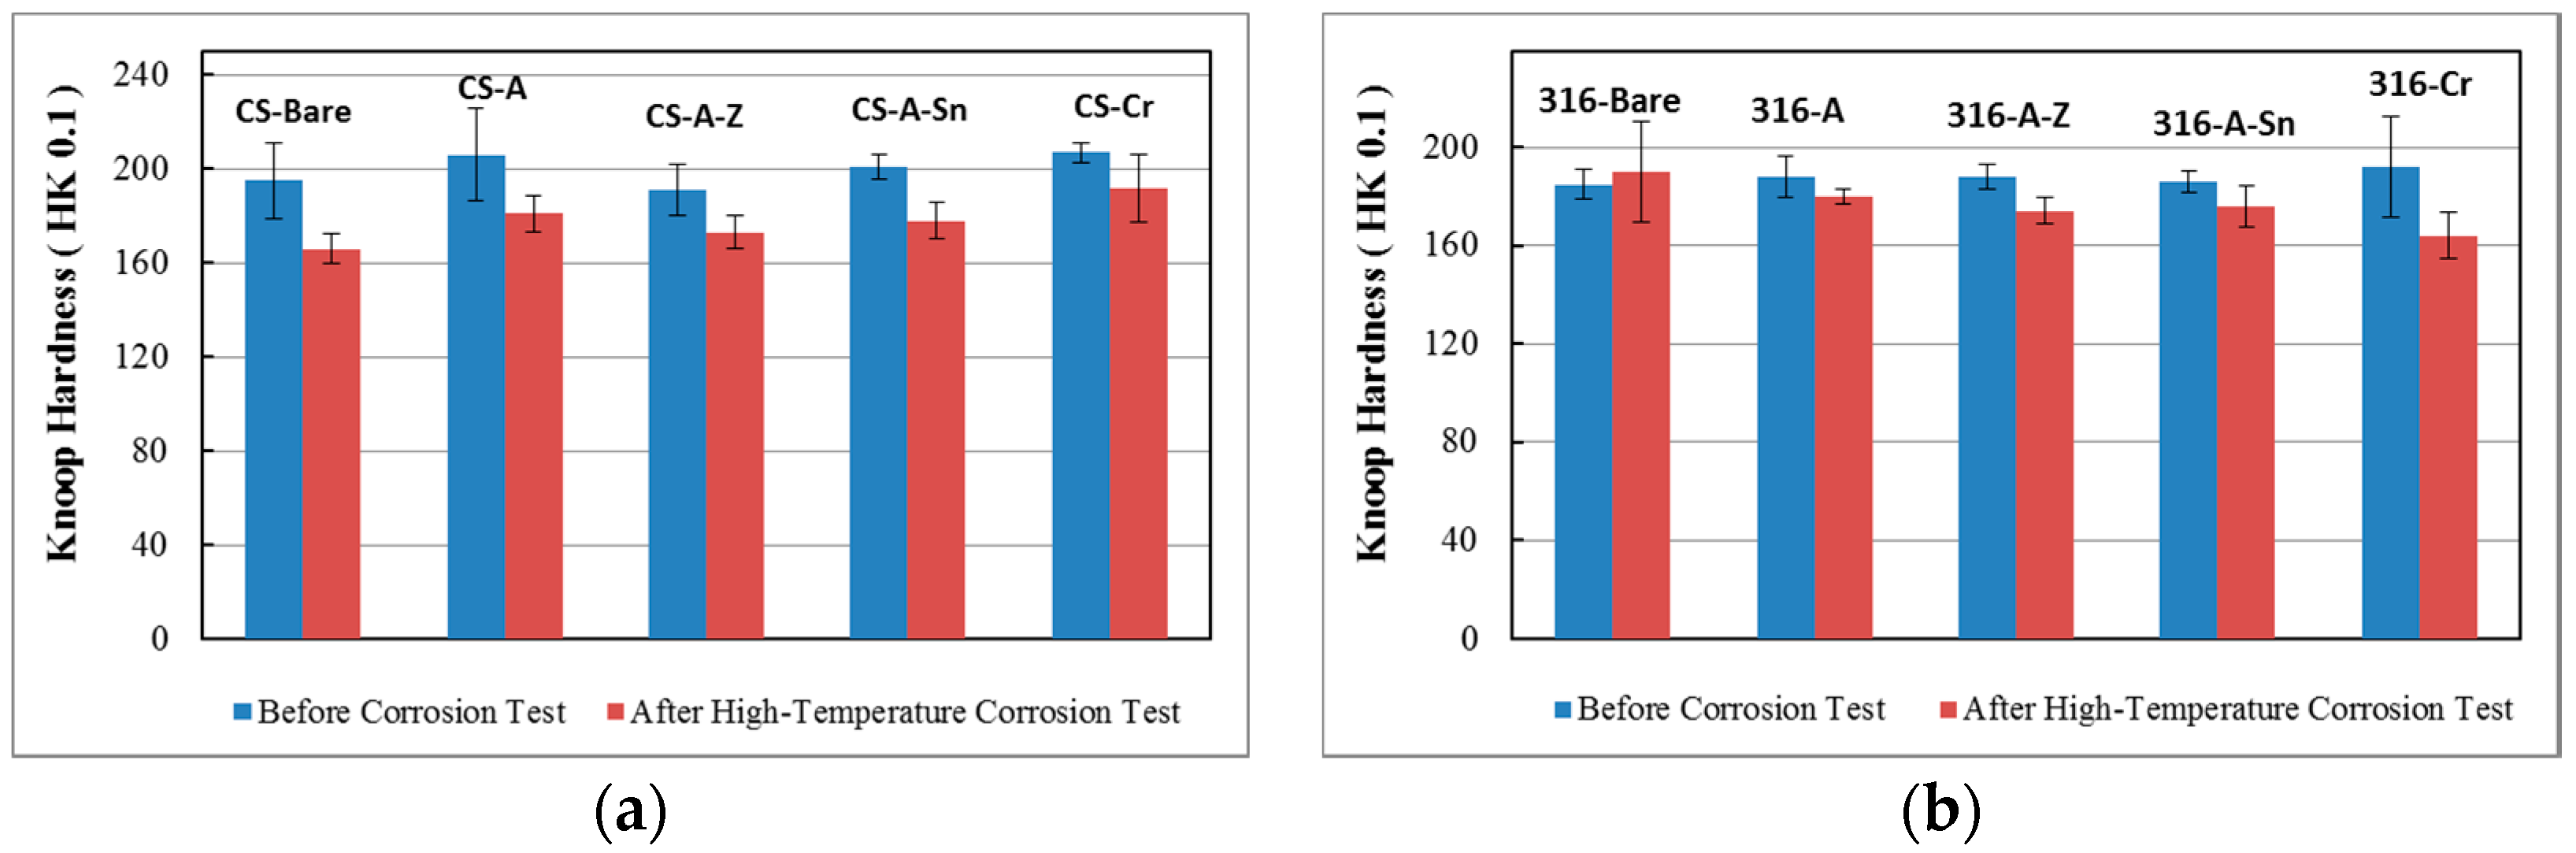
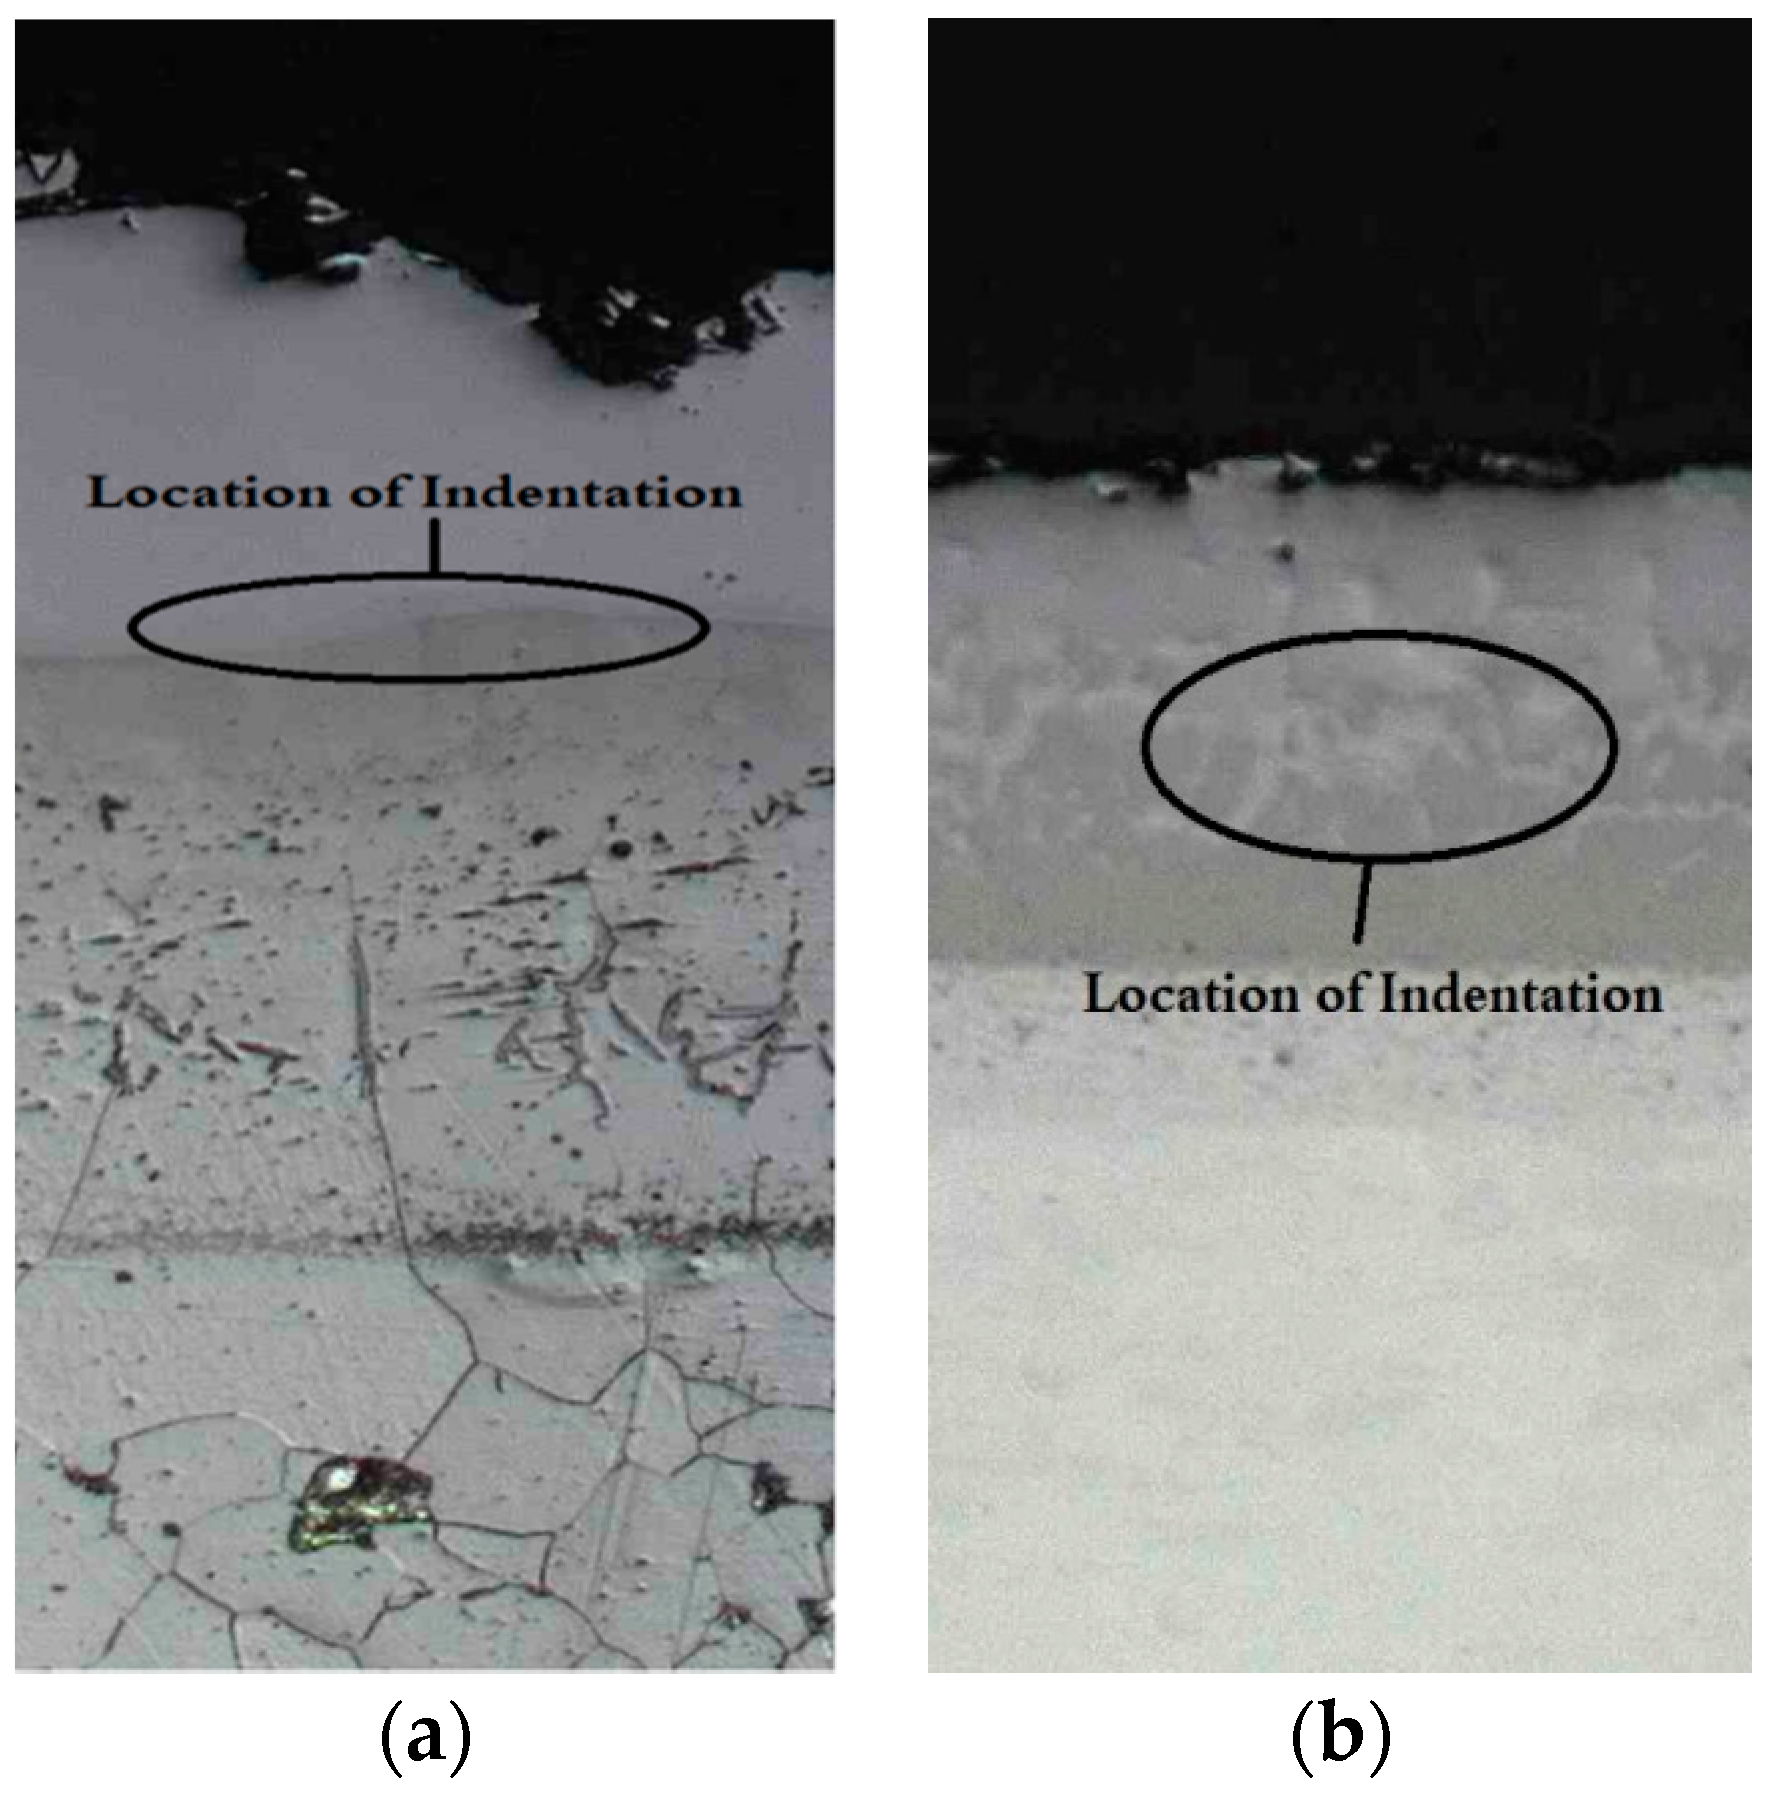
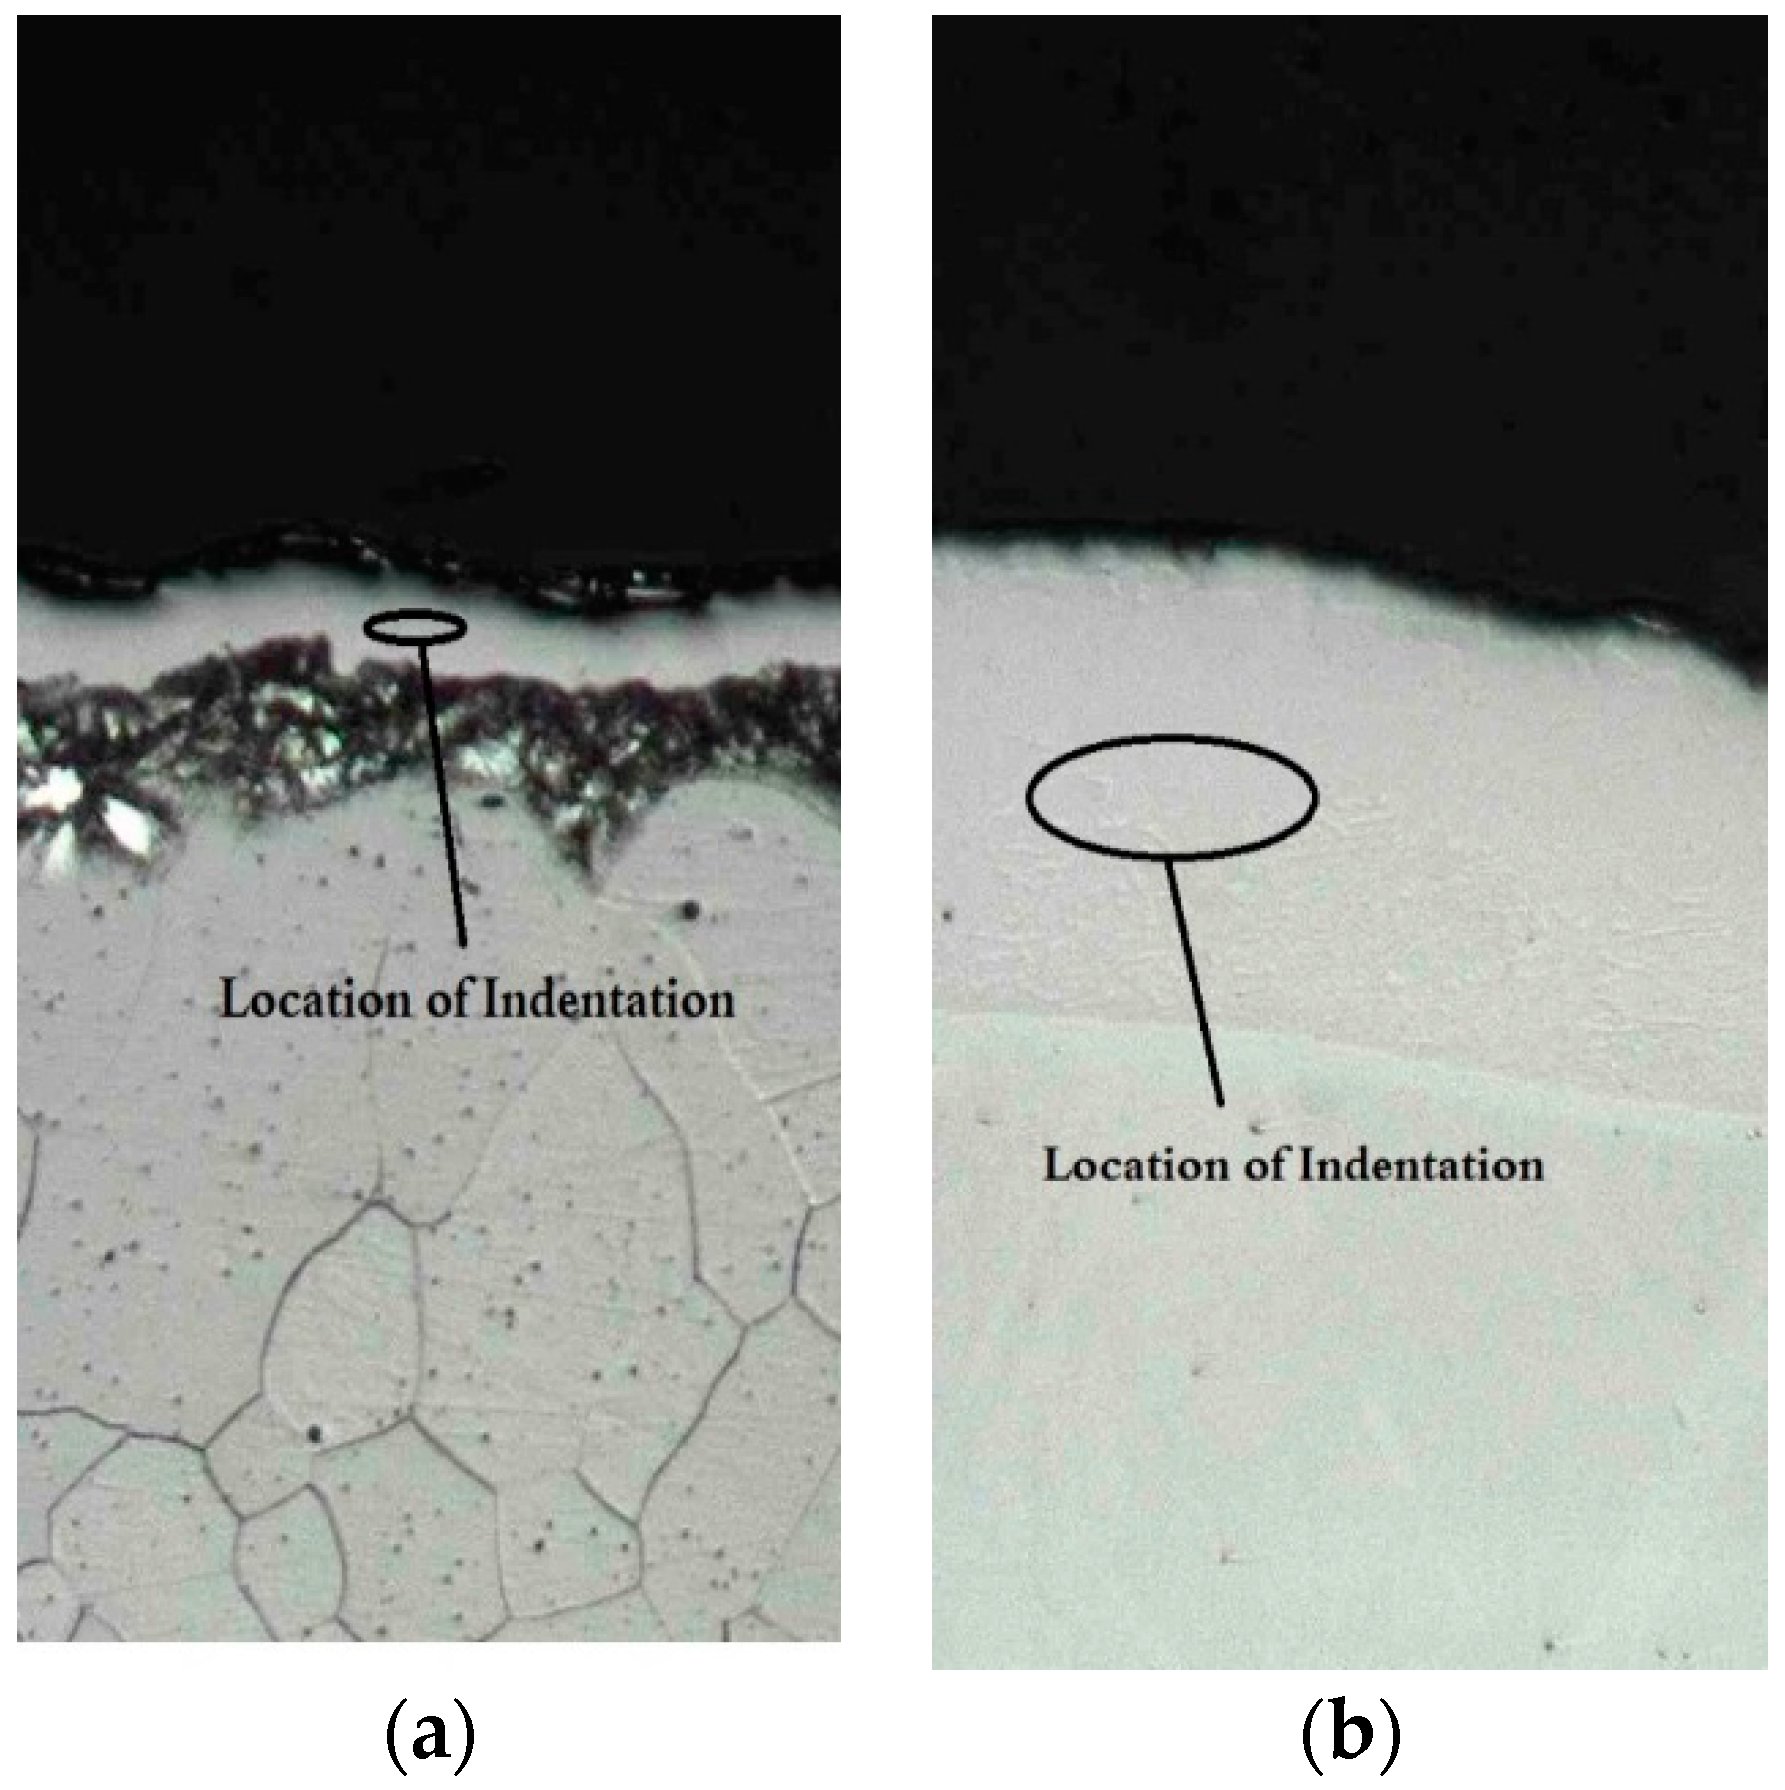
3.4.2. Hardness of the Case Depth

The hardness of the case depth of the samples was examined by employing a micro-indentation hardness test (Knoop test). This method of determining the hardness is recognized as the optimal test for measuring the coating characterization, according to extensive studies on aluminized, boronized, and other coatings by thermal diffusion process [41,62]. Since the coatings studied in this work had multi-layered architectures consisting of layers with different phase compositions and structures, and therefore with different hardness, it is important to indicate the location of where the indenter was applied at the hardness determination. Because one of the aims of this study was to evaluate whether the coating hardness decreases or not after the corrosive attack, i.e., to evaluate the coating integrity as the capability to maintain the structure and properties during corrosion at elevated temperatures, it was decided to determine a “general hardness” of the coatings, but not to determine a hardness for each individual layer. In this regard, the Knoop diamond indenter was applied in the middle of the coatings. Figure 12, Figure 13 and Figure 14 demonstrate the locations of where the indenters were applied depending on the type of the coatings. For the aluminized coatings, the indenters were applied onto the junction of the Al-rich and the main aluminized layers (see Figure 12). Figure 13 showed the locations of the applied indenters for the chromized coatings; e.g., the indenter was applied onto the middle of the top Cr-rich layer in the case of the low carbon steel substrate and onto the middle of the chromide coating (onto the junction of two layers) in the case of the 316 stainless steel substrate. In the case of the boronized samples, the indenter was also applied in the middle of the coatings where both iron boride phases, FeB and Fe2B, coexist (see Figure 14). The hardness data for the middle of the coating for the considered materials was important, not only to compare the coatings’ integrity in general, but it is also related to the fact that this area, where two crystalline phases are in “contact”, was the weakest area with an elevated stress condition.
Comparing micro-hardness data for the coatings and for the substrates (see Figure 8, Figure 10, Figure 15 and Figure 16), it is clear that the coatings had significantly greater hardness values than the steels (both carbon steel and stainless steel). The hardness of the case depth for all the studied materials determined through the Knoop indentation remained on the original level after 168 h of low-temperature exposure being in contact with the unmolten salt (Figure 15). The hardness determination for the aluminized coatings examined after the high-temperature molten salt corrosion also demonstrated that these coatings had a high integrity and could successfully withstand the selected harsh conditions; their micro-hardness remained on the original level (Figure 16). Similar results were obtained for the chromized coating applied onto carbon steel. However, the results obtained for the chromized stainless steel 316 showed that the coating hardness decreased noticeably (Figure 16). The reduction of hardness of the chromized coating was likely related to the lower stability of the chromides under the corrosive conditions considered in this study. It is likely that the stress generated in the chromized coating structure at oxidation at elevated temperatures (600 °C and higher) with a rather thick Cr2O3 layer formation (see the data of the XRD analysis) led to the hardness reduction. This may correspond to the fact that the phase transformation and new phase formation may further affect the hardness of the materials [52]. Overall, the obtained results related to the hardness data and their comparison for the samples examined before and after corrosion testing suggested that the aluminized samples have a higher potential withstanding against the corrosive conditions (e.g., in high-temperature molten salt), which are expected in recovery boilers.

4. Conclusions

Corrosion resistance of low carbon steel and 316 stainless steel with thermal diffusion coatings (boronized, aluminized, and chromized), including the coatings with additional layers from inert ceramics, such as ZrO2, SnO2, and BN, have been studied, for the first time, in the molten salt oxidation conditions simulated industrial corrosive conditions in recovery boilers and some other corrosive environments in pulp and paper processing. The systematic studies included comparison of the appearance, mass change, microstructure examination (cross-sections), phase analysis (XRD of the surface), and hardness of the coated steels vs. uncoated (bare) steels have been conducted. Based on the results, the most important findings of the current study are highlighted below:
The samples from the coated steels did not have any blistering, surface cracks, coating delamination, and peeling after low- and high-temperature exposures in corrosive-oxidation conditions, although surface discoloration could be observed for most of samples. In contrary, the top surface of the bare steels experienced more visible oxidation with partial delamination after the corrosive attack, particularly, low carbon steel substrates after high-temperature exposure in the molten salt. The coated samples had a negligible weight change (significantly less than 1%) after the high-temperature molten salt corrosive attack.
The results of the microstructural and XRD analyses suggested that the aluminized samples had high corrosion resistance in both low- and high-temperature molten salt oxidation environments. The high-temperature environment seemed to stimulate the continuation of the thermal diffusion process and resulted in some changes in the thickness of the layers within the case depth but without total thickness reduction and without micro-cracks and delamination in the aluminide layers. The surface oxidation of the aluminized coatings with the formation of a very thin chemically inert Al2O3 skin further promoted corrosion resistance of these coatings. Additional top layers that were applied (e.g., SnO2, ZrO2, and BN) inhibited the interaction of the coatings with the corrosive salts, especially at elevated temperature. The boronized and chromized samples were not affected by the low-temperature test conditions; however, the chromide coatings experienced some phase changes after the high-temperature exposure that is confirmed by the data of the comparative XRD analysis. Although bare 316 stainless steel resisted the low-temperature contact with the salt, it experienced interaction with molten salt at high temperature that was confirmed by the microstructural and XRD analyses (visible formation of thin layer of the products of corrosion). Moreover, low carbon steel samples had visible corrosion even at low-temperature, and the formation of the thick (more than 50 µm) corrosion-oxidation layer with subsequent delamination was clearly observed.
The hardness of the case depth of the aluminized and boronized samples remained on the original level (as before testing), which confirmed the coatings’ integrity under the selected simulated testing conditions. However, the hardness of the case depth of the chromized samples decreased, which likely occurred due to possible phase change of the chromides after high temperature exposure. The hardness of the substrate decreased after the high-temperature corrosive attack for almost all samples that can be explained by the grain growth in the steels.
The studied coatings, particularly, aluminized coatings, demonstrated high integrity in the simulating unmolten salt and molten salt oxidation corrosive conditions. The protection of steels employing the aluminized coatings is defined by the inertness of aluminides, by the inert Al2O3-oxidation film formation at elevated temperatures, and by the diffusion-related bonding between the protective layers and the substrate materials. A lower-roughness aluminized coating on stainless steel is preferable for corrosion protection. Multi-layer coating architectures are favorable for corrosion protection.
The tested materials, especially aluminized steels, can be recommended for application in high-temperature molten salt corrosion environments in the pulp and paper processing. The thermal diffusion technology, when the multi-layered coating structure is formed through one processing “step”, can be successfully employed for manufacturing of the industrial components, including long recovery boiler tubing.

Author Contributions

Conceptualization, Amirhossein M., André M. and E.M.; Methodology, Amirhossein M., André M., E.M. and G.L.M.; Formal Analysis, Amirhossein M., André M., E.M. and G.L.M.; Investigation, Amirhossein M., André M. and E.M.; Writing-Original Draft Preparation, Amirhossein M. and E.M.; Writing-Review & Editing, André M. and E.M.; Supervision, André M.

Funding

This research received no external funding.

Conflicts of Interest

The authors declare no conflicts of interest.

Appendix A

Figure A1 and Figure A2 shows the evolution of the top surfaces of the samples after low-temperature (220 °C) and high-temperature (600 °C) corrosive attack. Each image is labeled based on the coating material. In this figure, the changes of the samples as (a) represented before the corrosion tests, (b) after 24 h, (c) after 48 h, (d) after 96 h, and (e) after 168 h of exposure to the simulated corrosive environment are shown. Even though the samples were washed after the test, some of the sample surfaces were likely still tainted with residual salt material. The black mark on the top right- or left-hand side of the samples was painted to distinguish the surface that was exposed to the hot corrosive environment.
Figure A1. Photographs of the samples (A) 316-Bare, (B) 316-A, (C) 316-A-Sn, (D) 316-A-Z, (E) CS-Bare, (F) CS-A, (G) CS-A-Sn, (H) CS-A-Z, (I) CS-B, (J) CS-B-BN, and (K) CS-B-Z: (a) before salt corrosion testing; (b) after 24 h; (c) after 48 h; (d) after 96 h; and (e) after 168 h of exposure in low-temperature (at 220 °C) corrosive environment. We moved the words in the original column (left) and re-edited the title, pls confirm.
Coatings 08 00257 g0a1aCoatings 08 00257 g0a1b
Figure A2. Photographs of the samples (A) 316-Bare, (B) 316-A, (C) 316-A-Sn, (D) 316-A-Z, (E) 316-Cr, (F) CS-Bare, (G) CS-A, (H) CS-A-Sn, (I) CS-A-Z, and (J) CS-Cr: (a) before corrosion testing; (b) after 24 h; (c) after 48 h; (d) after 96 h; and (e) after 168 h of exposure in high-temperature (at 600 °C) corrosive environment.
Coatings 08 00257 g0a2aCoatings 08 00257 g0a2b

Appendix B

The microstructure images of the samples before and after 168 h of exposure to the low-temperature corrosive attack are presented here.
Figure A3. Microscopic images of the cross-section of CS-Bare (a) before and (b) after the low-temperature corrosive attack after 168 h.
Coatings 08 00257 g0a3
Figure A4. Microscopic images of the cross-section of CS-B (a) before and (b) after the low-temperature corrosive attack after 168 h.
Coatings 08 00257 g0a4
Figure A5. Microscopic images of the cross-section of CS-B-BN (a) before and (b) after the low-temperature corrosive attack after 168 h.
Coatings 08 00257 g0a5
Figure A6. Microscopic images of the cross-section of CS-B-Z (a) before and (b) after the low-temperature corrosive attack after 168 h.
Coatings 08 00257 g0a6
Figure A7. Microscopic images of the cross-section of CS-A (a) before and (b) after the low-temperature corrosive attack after 168 h.
Coatings 08 00257 g0a7
Figure A8. Microscopic images of the cross-section of CS-A-Sn (a) before and (b) after the low-temperature corrosive attack after 168 h.
Coatings 08 00257 g0a8
Figure A9. Microscopic images of the cross-section of CS-A-Z (a) before and (b) after the low-temperature corrosive attack after 168 h.
Coatings 08 00257 g0a9
Figure A10. Microscopic images of the cross-section of 316-Bare (a) before and (b) after the low-temperature corrosive attack after 168 h.
Coatings 08 00257 g0a10
Figure A11. Microscopic images of the cross-section of 316-A (a) before and (b) after the low-temperature corrosive attack after 168 h.
Coatings 08 00257 g0a11
Figure A12. Microscopic images of the cross-section of 316-A-Sn (a) before and (b) after the low-temperature corrosive attack after 168 h.
Coatings 08 00257 g0a12
Figure A13. Microscopic images of the cross-section of 316-A-Z (a) before and (b) after the low-temperature corrosive attack after 168 h.
Coatings 08 00257 g0a13

Appendix C

The microstructure images of the samples before and after 168 h of exposure to the high-temperature corrosive attack are presented here.
Figure A14. Microscopic images of the cross-section of CS-A (a) before and (b) after the high-temperature corrosive attack after 168 h.
Coatings 08 00257 g0a14
Figure A15. Microscopic images of the cross-section of CS-A-Sn (a) before and (b) after the high-temperature corrosive attack after 168 h.
Coatings 08 00257 g0a15
Figure A16. Microscopic images of the cross-section of CS-A-Z (a) before and (b) after the high-temperature corrosive attack after 168 h.
Coatings 08 00257 g0a16
Figure A17. Microscopic images of the cross-section of CS-Cr (a) before and (b) after the high-temperature corrosive attack after 168 h.
Coatings 08 00257 g0a17
Figure A18. Microscopic images of the cross-section of 316-A (a) before and (b) after the high-temperature corrosive attack after 168 h.
Coatings 08 00257 g0a18
Figure A19. Microscopic images of the cross-section of 316-A-Sn (a) before and (b) after the high-temperature corrosive attack after 168 h.
Coatings 08 00257 g0a19
Figure A20. Microscopic images of the cross-section of 316-A-Z (a) before and (b) after the high-temperature corrosive attack after 168 h.
Coatings 08 00257 g0a20
Figure A21. Microscopic images of the cross-section of 316-Cr (a) before and (b) after the high-temperature corrosive attack after 168 h.
Coatings 08 00257 g0a21

Appendix D

XRD profiles of the top surface of the samples before and after low- and high-temperature corrosive attack.
Figure A22. Qualitative XRD analysis of the surface of CS-Bare (a) before corrosive attack, (b) after low-, and (c) high-temperature corrosive attack.
Coatings 08 00257 g0a22aCoatings 08 00257 g0a22b
Figure A23. Qualitative XRD analysis of the surface of CS-A-Sn (a) before corrosive attack, (b) after low-, and (c) high-temperature corrosive attack.
Coatings 08 00257 g0a23
Figure A24. Qualitative XRD analysis of the surface of CS-A-Z (a) before corrosive attack, (b) after low-, and (c) high-temperature corrosive attack.
Coatings 08 00257 g0a24
Figure A25. Qualitative XRD analysis of the surface of CS-B (a) before corrosive attack, (b) after low-temperature corrosive attack.
Coatings 08 00257 g0a25
Figure A26. Qualitative XRD analysis of the surface of CS-B-BN (a) before corrosive attack, (b) after low-temperature corrosive attack.
Coatings 08 00257 g0a26
Figure A27. Qualitative XRD analysis of the surface of CS-B-Z (a) before corrosive attack, (b) after low-temperature corrosive attack.
Coatings 08 00257 g0a27
Figure A28. Qualitative XRD analysis of the surface of CS-Cr (a) before corrosive attack, (b) after high-temperature corrosive attack.
Coatings 08 00257 g0a28
Figure A29. Qualitative XRD analysis of the surface of 316-Bare (a) before corrosive attack, (b) after low-, and (c) high-temperature corrosive attack.
Coatings 08 00257 g0a29
Figure A30. Qualitative XRD analysis of the surface of 316-A-Sn (a) before corrosive attack, (b) after low-, and (c) high-temperature corrosive attack.
Coatings 08 00257 g0a30
Figure A31. Qualitative XRD analysis of the surface of 316-A-Z (a) before corrosive attack, (b) after low-, and (c) high-temperature corrosive attack.
Coatings 08 00257 g0a31
Figure A32. Qualitative XRD analysis of the surface of 316-Cr (a) before corrosive attack, (b) high-temperature corrosive attack.
Coatings 08 00257 g0a32

References

  1. Darmawan, A.; Hardi, F.; Yoshikawa, K.; Aziz, M.; Tokimatsu, K. Enhanced process integration of black liquor evaporation, gasification, and combined cycle. Appl. Energy 2017, 204, 1035–1042. [Google Scholar] [CrossRef]
  2. Tran, H.N. Upper furnace deposition and plugging. In Kraft Recovery Boilers; Adams, T.N., Ed.; Tappi Press: Atlanta, GA, USA, 1997; pp. 245–282. [Google Scholar]
  3. Tran, H.N.; Barham, D.; Hupa, M. Fireside corrosion in Kraft recovery boilers—An overview. Mater. Preform. 1988, 27, 40–45. [Google Scholar]
  4. Naqvi, M.; Yan, J.; Dahlquist, E. Black liquor gasification integrated in pulp and paper mills: A critical review. Bioresour. Technol. 2010, 101, 8001–8015. [Google Scholar] [CrossRef] [PubMed]
  5. Ji, X.; Bie, H.; Zhang, Y.; Chen, P.; Fang, W.; Bie, R. Release of K and Cl and emissions of NOx and SO2 during reed black liquor combustion in a fluidized bed. Energy Fuels 2017, 31, 1631–1637. [Google Scholar] [CrossRef]
  6. Li, S.; Themelis, N.; Castaldi, M. High-temperature corrosion in waste-to-energy boilers. J. Therm. Spray Technol. 2007, 16, 104–110. [Google Scholar]
  7. Riedl, R.; Dahl, J.; Obernberger, I.; Narodoslawsky, M. Corrosion in fire tube boilers of biomass combustion plants. In Proceedings of the China International Corrosion Control Conference, Beijing, China, 26–28 October 1999; p. 90129. [Google Scholar]
  8. Grabke, H.J.; Spigel, M.; Zahs, A. Role of alloying elements and carbides in the chlorine-induced corrosion of steels and alloys. Mater. Res. 2004, 7, 89–95. [Google Scholar] [CrossRef] [Green Version]
  9. Grabke, H.J.; Reese, E.; Spigel, M. The effects of chlorides, hydrogen chloride, and sulfur dioxide in the oxidation of steels below deposits. Corros. Sci. 1995, 37, 1023–1043. [Google Scholar] [CrossRef]
  10. Sorell, G. The role of chlorine in high temperature corrosion in waste-to-energy plants. Mater. High Temp. 1997, 14, 207–220. [Google Scholar] [CrossRef]
  11. Buscaglia, V.; Nanni, P.; Bottino, C. The mechanism of sodium sulphate-induced low temperature hot corrosion of pure iron. Corros. Sci. 1990, 311, 327–349. [Google Scholar] [CrossRef]
  12. He, J.; Xiong, W.; Zhang, W.; Li, W.; Long, K. Study on the high-temperature corrosion behavior of superheater steels of biomass-fired boiler in molten alkali salts’ mixtures. Adv. Mech. Eng. 2016, 8, 1687814016678163. [Google Scholar] [CrossRef]
  13. Xu, S.; Wang, C.; Wang, W. Failure analysis of stress corrosion cracking in heat exchanger tubes during start-up operation. Eng. Fail. Anal. 2015, 51, 1–8. [Google Scholar] [CrossRef]
  14. Barbosa, C.; De Barros, S.K.; De Cerqueira Abud, I.; Do Nascimento, J.L.; De Carvalho, S.S. Failure analysis of an aqua tubular boiler tube. J. Fail. Anal. Prev. 2012, 12, 654–659. [Google Scholar] [CrossRef]
  15. Ahmad, J.; Purbolaksono, J.; Beng, L.C. Thermal fatigue and corrosion fatigue in heat recovery area wall side tubes. Eng. Fail. Anal. 2010, 17, 334–343. [Google Scholar] [CrossRef]
  16. Roberge, P.R. Handbook of Corrosion Engineering, 2nd ed.; McGraw-Hill Education: New York, NY, USA, 2012; ISBN 9780071750370. [Google Scholar]
  17. Levy, A.V. The erosion-corrosion behavior of protective coatings. Surf. Coat. Technol. 1988, 36, 387–406. [Google Scholar] [CrossRef]
  18. Wang, D.; Bierwagen, G.P. Sol-gel coatings on metals for corrosion protection. Prog. Org. Coat. 2009, 64, 327–338. [Google Scholar] [CrossRef]
  19. Cha, S.C.; Gudenau, H.W.; Bayer, G.T. Comparison of corrosion behaviour of thermal sprayed and diffusion-coated materials. Mater. Corros. 2002, 53, 195–205. [Google Scholar] [CrossRef]
  20. Günthner, M.; Kraus, T.; Krenkel, W.; Motz, G.; Dierdorf, A.; Decker, D. Particle-filled PHPS silazane-based coatings on steel. Appl. Ceram. Technol. 2009, 6, 373–380. [Google Scholar] [CrossRef]
  21. Movchan, B.A.; Yu, Y.K. High-temperature protective coatings produced by EB-PVD. J. Coat. Sci. Technol. 2014, 1, 96–110. [Google Scholar]
  22. Drozdz, M.; Kyziol, K.; Grzesik, Z. Chromium-based oxidation-resistant coatings for the protection of engine valves in automotive vehicles. Mater. Technol. 2017, 51, 603–607. [Google Scholar]
  23. Panjan, P.; Drnovšek, A.; Kovač, J. Tribological aspects related to the morphology of PVD hard coatings. Surf. Coat. Technol. 2018, 343, 138–147. [Google Scholar] [CrossRef]
  24. Chicatun, F.; Cho, J.; Schaab, S.; Brusatin, G.; Colombo, P.; Roather, J.A.; Boccaccini, A.R. Carbon nanotube deposits and CNT/SiO2 composite coatings by electrophoretic deposition. Adv. Appl. Ceram. 2007, 106, 186–195. [Google Scholar] [CrossRef]
  25. Musil, J.; Vlcek, J.; Zeman, P. Hard amorphous nanocomposite coatings with oxidation resistance above 1000 °C. Adv. Appl. Ceram. 2008, 107, 149–154. [Google Scholar] [CrossRef]
  26. Tuthill, A.H. Stainless Steels and Specialty Alloys for Modern Pulp and Paper Mills; Nickel Development Institute (NiDI): Toronto, ON, Canada, 2002; pp. 47–50. [Google Scholar]
  27. Rao, S.; Frederick, L.; McDonald, A. Resistance of nanostructured environmental barrier coatings to the movement of molten salts. J. Therm. Spray Technol. 2012, 21, 887–899. [Google Scholar] [CrossRef]
  28. Heath, G.R.; Heimgartner, P.; Irons, G.; Miller, R.; Gustafsson, S. An assessment of thermal spray coating technologies for high temperature corrosion protection. Mater. Sci. Forum 1997, 251–254, 809–816. [Google Scholar] [CrossRef]
  29. Fauchais, P.; Montavon, G. Thermal and cold spray: Recent developments. Key Eng. Mater. 2008, 384, 1–59. [Google Scholar] [CrossRef]
  30. Davis, J. Handbook of Thermal Spray Technology; ASM International: Materials Park, OH, USA, 2004; pp. 1–36. [Google Scholar]
  31. Nelson, G.; Nychka, J.; McDonald, A.G. Flame spray deposition of titanium alloy-bio-active glass composite coatings. J. Therm. Spray Technol. 2011, 20, 1339–1351. [Google Scholar] [CrossRef]
  32. Davis, J. Surface Engineering for Corrosion and Wear Resistance, 1st ed.; ASM International: Materials Park, OH, USA, 2001; pp. 1–43. [Google Scholar]
  33. Dearnley, P. Surface engineering with diffusion technologies. In Introduction to Surface Engineering; Cambridge University Press: Cambridge, UK, 2017; pp. 35–115. [Google Scholar]
  34. Mittemeijer, E.J.; Somers, M.A.J. Thermochemical Surface Engineering of Steels, 1st ed.; Elsevier-Woodhead Publishing: Cambridge, UK, 2014. [Google Scholar]
  35. Choy, K.L. Chemical vapor deposition of coatings. Prog. Mater. Sci. 2003, 48, 57–170. [Google Scholar] [CrossRef]
  36. Budinski, K.G. Surface Engineering for Wear Resistance; Prentice Hall: Englewood Cliffs, NJ, USA, 1988. [Google Scholar]
  37. Takadoum, J. Materials and Surface Engineering in Tribology; Wiley: London, UK, 2010. [Google Scholar]
  38. Liu, X.; Wang, H.; Li, D.; Wu, Y. Study on kinetics of carbide growth by thermal diffusion Process. Surf. Coat. Technol. 2006, 201, 2414–2418. [Google Scholar] [CrossRef]
  39. Nicholls, J.R. Designing oxidation-resistant coatings. JOM 2000, 52, 28–35. [Google Scholar] [CrossRef]
  40. Medvedovski, E. Formation of corrosion-resistant thermal diffusion boride coatings. Adv. Eng. Mater. 2016, 18, 11–33. [Google Scholar] [CrossRef]
  41. Medvedovski, E.; Chinski, F.; Stewart, J. Wear- and corrosion-resistant boride-based coatings obtained through thermal diffusion CVD processing. Adv. Eng. Mater. 2014, 16, 713–728. [Google Scholar] [CrossRef]
  42. Medvedovski, E.; Jiang, J.; Robertson, M. Iron boride-based thermal diffusion coatings for tribo-corrosion oil production applications. Ceram. Int. 2016, 42, 3190–3211. [Google Scholar] [CrossRef]
  43. Bangaru, N.V.; Krutenat, R.C. Diffusion coatings of steels: Formation mechanism and microstructure of aluminized heat-resistant stainless steels. J. Vac. Sci. Technol. B 1984, 2, 806–815. [Google Scholar] [CrossRef]
  44. Fitzer, E.; Maurer, H.J. Diffusion and precipitation phenomena in aluminized and chromium-aluminized iron- and nickel-base alloys in materials and coatings to resist high temperature corrosion. In Materials and Coatings to Resist High Temperature Corrosion; Holmes, D.R., Rahmel, A., Eds.; Applied Science Publishers Ltd.: London, UK, 1978; pp. 253–269. [Google Scholar]
  45. Wang, D. Corrosion behavior of chromized and/or aluminized 214Cr-1Mo steel in medium—BTU coal gasifier environments. Surf. Coat. Technol. 1988, 36, 49–60. [Google Scholar] [CrossRef]
  46. Bai, C.; Ger, M.; Wu, M. Corrosion behaviors and contact resistances of the low-carbon steel bipolar plate with a chromized coating containing carbides and nitrides. Int. J. Hydrogen Energy 2009, 34, 6778–6789. [Google Scholar] [CrossRef]
  47. Meier, G.H.; Cheng, C.; Perlkins, R.A.; Bakker, W. Diffusion chromizing of ferrous alloys. Surf. Coat. Technol. 1989, 39–40, 53–64. [Google Scholar] [CrossRef]
  48. Cheetham, A.K.; Day, P. Solid State Chemistry: Techniques; Oxford Science Publications: Oxford, UK, 1991. [Google Scholar]
  49. Donald, H.; Jenkins, B. Thermodynamics of the relationship between lattice energy and lattice enthalpy. J. Chem. Educ. 2005, 82, 950–952. [Google Scholar]
  50. Ladd, M. Crystal Structures: Lattices and Solids in Stereoview; Horwood Series in Chemical Science; Elsevier: Chichester, UK, 1999. [Google Scholar]
  51. Grabke, H.J.; Schutze, M. Oxidation of Intermetallics; WILEY-VCH Verlag GmbH: Berlin, Germany, 1998. [Google Scholar]
  52. Callister, W.; Rethwisch, D. Fundamentals of Material Science and Engineering: An Integrated Approach, 5th ed.; John Wiley & Sons, Inc.: Marblehead, MA, USA, 2011; pp. 170–199. [Google Scholar]
  53. Shrier, L.; Burstein, G.; Jarman, R. Corrosion: Metal/Environment Reactions, 3rd ed.; Butterworth-Heinemann, Elsevier: Oxford, UK, 1994. [Google Scholar]
  54. Ehrburger, P.; Baranne, P.; Lahaye, J. Inhibition of the oxidation of carbon-carbon composite by boron oxide. Carbon 1986, 24, 495–499. [Google Scholar] [CrossRef]
  55. Fehlner, F.P. Low Temperature Oxidation, the Role of Vitreous Oxides; John Wiley & Sons, Inc.: Hoboken, NJ, USA, 1986. [Google Scholar]
  56. Seitz, F. On the porosity observed in the Kirkendal effect. Acta Metall. 1953, 1, 355–369. [Google Scholar] [CrossRef]
  57. Melendez, M.; McDonald, A. Development of WC-based metal matrix composite coatings using low-pressure cold gas dynamic spraying. Surf. Coat. Technol. 2013, 214, 101–109. [Google Scholar] [CrossRef]
  58. Pint, B.A.; Zhang, Y.; Tortorelli, P.F.; Haynes, J.A.; Wright, I.G. Evaluation of iron-aluminide CVD coatings for high temperature corrosion protection. Mater. High Temp. 2001, 18, 185–192. [Google Scholar] [CrossRef]
  59. Agüero, A.; Muelas, R.; Pastor, A.; Osgerby, S. Long exposure steam oxidation testing and mechanical properties of slurry aluminide coatings for steam turbine components. Surf. Coat. Technol. 2005, 200, 1219–1224. [Google Scholar] [CrossRef]
  60. Pérez, F.J.; Hierro, M.P.; Pedraza, F.; Carpintero, M.C.; Gómez, C.; Tarín, R. Effect of fluidized bed CVD aluminide coatings on the cyclic oxidation of austenitic AISI 304 stainless steel. Surf. Coat. Technol. 2001, 145, 1–7. [Google Scholar] [CrossRef]
  61. Busby, J.; Hash, M.; Was, G. The relationship between hardness and yield stress in irradiated austenitic and ferritic steels. J. Nucl. Mater. 2005, 336, 267–278. [Google Scholar] [CrossRef]
  62. Bahadur, A.; Mohanty, O. Structural studies of hot dip aluminized coatings on mild steel. Mater. Trans. 1991, 32, 1053–1061. [Google Scholar] [CrossRef]
Figure 1. Microstructure image of aluminized (a) low carbon steel, and (b) 316 stainless steel.
Coatings 08 00257 g001
Figure 2. Microstructure image of chromized (a) low carbon steel, and (b) 316 stainless steel.
Coatings 08 00257 g002
Figure 3. Microstructure image of boronized low carbon steel.
Coatings 08 00257 g003
Figure 4. Microstructure images of the cross-section of CS-Bare (a) before, and (b) after the high-temperature corrosive attack after 168 h.
Coatings 08 00257 g004
Figure 5. Microstructure images of the cross-section of 316-Bare (a) before, and (b) after the high-temperature corrosive attack after 168 h.
Coatings 08 00257 g005
Figure 6. Relative mass change of samples after (a) low-temperature, and (b) high-temperature corrosive attack after 168 h.
Coatings 08 00257 g006
Figure 7. Location of the indentation on the original substrate.
Coatings 08 00257 g007
Figure 8. Comparison of Knoop hardness of the original substrate before and after the low-temperature corrosive attack for (a) low carbon steel, and (b) 316 stainless steel substrates.
Coatings 08 00257 g008
Figure 9. Comparison of Rockwell hardness of the original substrate before and after the low-temperature corrosive attack for (a) low carbon steel, and (b) 316 stainless steel substrates.
Coatings 08 00257 g009
Figure 10. Comparison of Knoop hardness of the original substrate before and after the high-temperature corrosive attack for (a) low carbon steel, and (b) 316 stainless steel substrates.
Coatings 08 00257 g010
Figure 11. Comparison of Rockwell hardness of the original substrate before and after the high-temperature corrosive attack for (a) low carbon steel, and (b) 316 stainless steel substrates.
Coatings 08 00257 g011
Figure 12. Location of the area where the micro-indentation hardness test was conducted for the aluminized coatings (a) low carbon steel, and (b) 316 stainless steel substrates.
Coatings 08 00257 g012
Figure 13. Location of the area where the micro-indentation hardness test was conducted for the chromized coatings (a) low carbon steel, and (b) 316 stainless steel substrates.
Coatings 08 00257 g013
Figure 14. Location of the area where the micro-indentation hardness test was conducted for the boronized low carbon steel.
Coatings 08 00257 g014
Figure 15. Comparison of Knoop hardness of the case depth before and after the low-temperature corrosive attack for (a) coated low carbon steel, and (b) coated 316 stainless steel substrates.
Coatings 08 00257 g015
Figure 16. Comparison of Knoop hardness of the case depth before and after the high-temperature corrosive attack for (a) coated low carbon steel, and (b) coated 316 stainless steel substrates.
Coatings 08 00257 g016
Table 1. Composition of the simulated salt mixture.
ChemicalWeight Percent (%)
KCl10.2
Na2CO311.5
Na2SO473.9
K2SO44.4
Table 2. List of the samples exposed to low-temperature and high-temperature corrosive attack.
Test Type1234567891011
High Temperature Corrosion TestUncoated Samples (Control Sample)Aluminized SamplesBoronized Samples
CS-Bare316-BareCS-ACS-A-SnCS-A-Z316-A316-A-Sn316-A-ZCS-BCS-B–BNCS-B-Z
High Temperature Corrosion TestUncoated Samples (Control Sample)Aluminized SamplesChromized Samples
CS-Bare316-BareCS-ACS-A-SnCS-A-Z316-A316-A-Sn316-A-ZCS-Cr316-Cr
Table 3. Average roughness of the substrates after the high-temperature corrosive attack.
Coating InformationCS-BareCS-ACS-A-SnCS-A-ZCS-Cr316-Bare316-A316-A-Sn316-A-Z316-Cr
Average roughness (Ra) (µm)2.626.46.226.323.051.411.261.371.363
Standard deviation (n = 3)±0.2±0.1±0.28±0.06±0.06±0.32±0.07±0.24±0.18±0.44

