Article

Porosity Characterization and Its Effect on Thermal Properties of APS-Sprayed Alumina Coatings

Institute of Materials Engineering, TU Dortmund University, Leonhard-Euler-Str. 2, D-44227 Dortmund, Germany
*
Author to whom correspondence should be addressed.
Coatings 2019, 9(10), 601; https://doi.org/10.3390/coatings9100601
Submission received: 2 July 2019 / Revised: 19 September 2019 / Accepted: 20 September 2019 / Published: 24 September 2019

Abstract

:
In the thermal spraying process, the porosity of ceramic coatings contributes directly to the efficiency of the thermal insulation. The size, shape, and distribution of the pores determine the level of both thermal and sintering resistance. In this work, three different atmospheric plasma sprayed (APS) alumina coatings were fabricated with the same spraying parameters using alumina powders with fine, medium, and coarse particle size. The microstructure of the obtained coatings was analyzed regarding the obtained total porosity, pore size, and pore shape. It was found that it is expedient to divide the pore size range into fine, medium, and large sizes. The shape was characterized with regard to the circularity aspect. In this way, all types of cracks can be considered as oblate pores and were included in the calculation of the total porosity. In the case of using fine feedstock powder, the densest coatings were produced among all coatings, and the fraction of fine pores and cracks are thereby substantially higher. However, the total porosity increases with increasing feedstock powder size. A connection was also made between thermal insulation and porosity fraction which includes fine pores and cracks.

1. Introduction

Thermal spraying technique is designed to add additional thermal and mechanical properties to base substrate materials. The applied coating enables the substrates to operate in harsh conditions. Ceramic coatings, for example, are particularly suitable for the use as very good thermal and electrical insulators. However, atmospheric plasma spraying (APS) is the most appropriate process, due to the high temperatures that the plasma jet provides, and is used for melting, and thus depositing, ceramic materials [1]. Ceramic coatings also improve the resistance of steel components against corrosion, wear, and erosion. For these reasons, they have been widely investigated [2,3,4,5]. This kind of coatings found their use in automotive and aerospace industries, where internal components normally operate in extreme temperatures [6].
Pores and cracks with various sizes and morphologies are inherent features of thermally sprayed coatings, which are generated during the deposition process and entrapped between the splats. The microstructure of ceramic coatings, in particular, exhibit defects such as globular pores, delaminations or interlamellar pores, and micro-cracks which compose the coating’s porosity. Incomplete contact between contiguous splats and the presence of unmelted particles result in the formation of large globular pores [7]. Delaminations in form of crack-like pores between lamella arise because of the rapid splat solidification and high velocity impingement of the molten particles. The relaxation of tensile quenching stresses leads to the formation of fine cracks [8,9]. Characterizing these various pores is important, as they influence ceramic coating properties and its behavior in service, particularly, the thermal conductivity [10,11].
Generally, the level of the obtained porosity in plasma sprayed ceramic coatings may vary from less than 2 vol.% to more than 20 vol.%. The level of porosity depends on the type and morphology of the utilized feedstock powder and particle size as well as the used spray parameters [12,13,14]. In a wet environment, open pores and cracks may cause local corrosion in the substrate [6]. However, the presence of such microstructural features with defined levels enhances the thermal insulation of the coating as well as increases its thermal shock resistance [1,15,16]
Many researchers have studied the effect of porosity on thermal conductivity either by carrying out theoretical calculations or by conducting experiments. They referred to the fact that total porosity plays only a secondary role, whereas the size, shape, and spatial distribution of the pores play the primary role in determining the properties of a coating [17,18]. Chi et al. and Cernuschi et al. [19,20] reported that the morphology of pores in porous coatings highly affects the thermal conductivity.
Wang et al. [21] built a finite element model, and investigated the effect of pores and splat interfaces on thermal conductivity. In his model, pores considered as spherical whereas pore orientation and distribution were estimated. They predicted a reduction up to 50% in the thermal conductivity due to the variation in porosity levels. Cernuschi et al. [22] modeled the thermal conductivity of plasma sprayed thermal barrier coatings and determined shape and orientation of the pores as well as the porosity fractions. They concluded that thermal conductivity of the coating is affected by porosity in different ways and this effect depends on the morphology and orientation of the pores. Furthermore, Wang et al. [23] have reported that sizes and shapes of pores affect significantly the effective thermal conductivity of ceramic coatings. They found that oblate narrow pores with low roundness (indicated by the circularity factor) show higher thermal resistance than spheroidal pores.
As can be seen, several studies have reported the effect of pores and cracks on thermal properties of thermally sprayed ceramic coatings through porosity characterization. However, very few information is available related to the effect of porosity fractions, in terms of size and shape, on thermal insulation of plasma sprayed ceramic coatings. The present work is based on the study of microstructures of APS alumina coatings using three feedstock powders of different particle size. The influence of the particle size on the particle in-flight temperature and velocity as well as the coating’s microstructural features and properties of the coating were investigated. The microstructural features of alumina coatings including total porosity, fractions of porosity and crack network were analyzed quantitatively by means of an image processing tool. The work focuses on the accurate measurement of porosity fractions based on a clear criterion that distinguishes each porosity component. Moreover, coating properties such as hardness, phase composition, and thermal insulation were evaluated and related to the quantified microstructural features.

2. Materials and Processes

2.1. Samples Preparation and Deposition Process

Three sets of steel substrates with nominal dimensions with a diameter of 40 mm and a thickness of 5 mm were grit blasted on one side using alumina (EFK-14). This procedure was followed by an ultrasonic cleaning for the APS deposition. Three commercial alumina powders (fused and crushed, high purity; 99.5%) of different particle sizes: fine powder, Amperit 740.000 (+5–22 µm); medium powder, Amdry 6062 (+22–45 µm); and coarse powder, Amperit 740.002 (+45–90 µm), H.C. Stark, Germany, were deposited on the grit blasted side of the steel substrates. The median size (vol.50%) of these powders are 14.00, 35.88, and 77.7 µm, respectively.
SEM images of the utilized powders and their particle size distributions are shown in Figure 1. An Oerlikon Metco F4-MB gun, with a nozzle with a 6 mm internal diameter and a single powder feeder, was used for this study. All spray parameters were kept constant for the three powders in order to investigate the influence of the starting powder’s particle size on porosity fractions in the resulted coatings. Additional samples were produced from the three powders using the same spray parameters but with variant number of spray passes. The number of spray passes was maintained so that all coatings have almost the same coating’s thickness. These additional coatings were used for the thermal insulation test. The used APS process parameters are given in Table 1.

2.2. Porosity Analysis

To quantitatively evaluate the porosity of the produced depositions, cross-sectional metallographic samples were prepared for the investigations. A series of SEM images with different magnification factors for each cross-section were taken by a field-emission scanning electron microscope (Joel, JSM-7001F FESEM). For the porosity measurements, ten images along the cross-section were taken randomly, central to the coating’s thickness, for a cross-section of each coating type. The images were magnified with a magnification factor of 1000×, which enables the detection of 0.1 µm-sized features. The image brightness was reduced, whereas the contrast was increased to facilitate the image analysis software to accurately detect the porosity. Additionally, a very low accelerating voltage (1.0 kV) and a low probe current (8–10 µA) were used so that the contrast between the pores and coating’s matrix was enhanced. Furthermore, backscattering electrons feature were used to enhance the quality of the obtained SEM images. An image analysis was performed using Jimage J1.49r software (provided by the National Institutes of Health, Bethesda, MD, USA) [24] on SEM images at 1000×. Image filtering was applied to remove noise followed by image segmentation by thresholding, which have produced binary images; the zero-threshold level (black) was assigned to the pores and the one level (white) was assigned to the alumina solid state. Subsequently, the pores were measured and categorized according to three area ranges: Fine (0–1 µm2), medium (1–10 µm2), and large (>10 µm2). Moreover, the medium pore size range (1–10 µm2) for the porosity of the three coatings was further classified in terms of their circularity (Cir. <0.5), where circularity is a measuring unit of pore spheroids. The more a pore becomes spherical, the circularity approaches unity and when pores become more elongated or narrow, circularity decreases. The circularity is defined as [24]
Cir. = 4π (A/p2)
where “A” is the pore area and “p” is the pore perimeter. Various shapes of pores and cracks of different sizes in a cross-sectional SEM image for typical ceramic coating are identified in Figure 2, whereas the process of pore classification is shown in Figure 3.

2.3. Characterization

A thermal spray sensor (AccuraSpray G3, Tecnar Co., St-Bruno-de-Montarville, QC, Canada) was used to measure the temperature and velocity of in-flight particles prior the process of samples deposition. The system—the thermal sensor—was positioned so that measurements are taken exactly at the spray distance listed in Table 1.
The additionally produced samples, which represent the three powders and have the same coating thickness, were used in the thermal insulation test. Coating surface was subjected to an increasing heat source (oven) up to 950 °C with a rate of 15 °C per minute, and a holding time of 60 min. The temperature on both sides of samples that represent the three types of coatings were simultaneously measured by means of two thermocouples.
Microhardness measurements were carried out at room temperature on polished cross-sections that represent the three as-sprayed coatings using a Vickers micro-indenter (Leco M-400, Ebersbach an der Fils, Germany). The indentations were performed with a load of 2.94 N for a dwell time of 15 s. Standard spacing was used between the indentations (at least three times the diagonal) to ensure that no further stresses were produced by the interaction between the consecutive indentations.

3. Results and Discussion

3.1. Image Processing Analysis

The SEM images of the as-sprayed coatings were used to analyze the porosity of the coatings produced from the three powders.
The porosity level variation in the three coatings is shown in Figure 4. It can be observed that fine pores with an almost spherical shape are uniformly distributed along the coating produced from the fine powder. As the particle size increases with medium and coarse powders, more pores of larger sizes are visible and the porosity distribution becomes nonuniform. The image analysis performed on SEM images of coating’s cross sections showed that the average total porosity of fine-, medium-, and coarse-powder coatings are 0.93%, 2.47%, and 5.55% of coating area, respectively. It should be noted here that, in the present work, the measurement unit used is the area percentage (area %), which is almost the same as the volume percentage (vol.%). The lower levels of measured porosities (especially for the fine-powder coating) could be related to the high melting degree of the deposited particles and also to the metallurgical preparation process of the cross sections used to get SEM images in which part of the open porosity disappeared, leading to under evaluate the porosity measurement. Taking this into consideration, the porosity measurements are in agreement with the reported data for porosity range of ceramic coatings [12,13,14].
In general, the total porosity levels for all coatings increases when increasing the feedstock powder particle size is increased. This increase is mainly due to the simultaneous increase of both the number and size of large pores, whereas fine and medium pores decrease.
As all spray parameters were kept constant for the three powders, fine-powder particles were exposed to a higher in-flight temperature and velocity (2620 °C, 415 m/s on average) than medium- and coarse-powder particles (2530 °C and 365 m/s, and 2390 °C and 330 m/s on average, respectively).
Also, thickness measurements of the three coatings revealed that coarse-powder produce thicker coatings than medium- and fine-powders (average thicknesses were 668, 475, and 180 µm, respectively).
The porosity of the three coatings was evaluated quantitatively and classified into three area ranges. Subsequently, the average of each pore range was calculated. The porosity evaluation was based on ten measurements of ten different SEM images for each coating sample. Given the average of each pore range and average total porosity for each sample, the fraction of each pore range was calculated. Additionally, the medium pore range (1–10 µm2) for each sample was also classified according to the pore’s circularity.
For the medium pore range of each coating type, the shape of the pores is crucial with regard to the thermal insulation property as pores with a low circularity (circularity <0.5) highly contribute to the thermal insulation property in comparison to pores with a high circularity (circularity >0.5). These measurements are visualized in Figure 5. It can be seen that the fine-powder coating possesses a higher percentage of fine-pores and medium-pores ranges (34.4% and 62.3%, respectively) than the medium-powder and coarse-powder coatings (15% and 45%, and 6% and 27%, respectively). While more than 60% of the medium-pore range for fine-powder coatings exhibit a circularity of <0.5, medium-powder and coarse-powder coatings exhibit less than half (48.2% and 48%, respectively) of medium-pore range with the same circularity.
In contrast, coarse-powder coatings possess a higher percentage of large-pore ranges (67%) than medium-powder and fine-powder coatings (40% and 3.3%, respectively).
The measurements above for porosity fractions (considering medium- and coarse-powder coatings) are well in agreement with the recorded literature data [25,26]. Deshpande et al. [25] prepared APS alumina and YSZ coatings by powders of different size distributions and morphologies. They reported that for the APS alumina coatings prepared by 15–50 µm particle size and spherical morphology powder, the crack network and fine pores together represent only one-third of the total porosity.
Huang et al. [26] prepared different YSZ coatings using different spray parameters and measured the total porosity and number of pores in a prespecified scanning area. They also classified pores in terms of aspect ratio (big & small pores) and orientation (horizontal & vertical) to investigate their influence on thermal conductivity of the coatings. They reported that large pores (pore area greater than 2 µm2) represent ~80% of the total porosity, whereas only 20% is the porosity fraction of small pores (pore area less than 2 µm2).
Table 2 lists porosity fractions measured through the present work compared to literature data.

3.2. Microhardness

Microhardness tests showed the effect of the coating porosity on microhardness values of the three coatings. Table 3 lists the average microhardness values of the three coatings along with the deviations of these measurements. In comparison to medium- and coarse-powder coatings, fine-powder coatings have the highest microhardness value due to their denser microstructure and lower total porosity. It is noticeable that the deviation value associated with the average microhardness value for the coarse-powder coating is higher than that of the medium- and fine-powder coatings. This can be attributed to the nonuniform distribution of large- and medium-range pores along the coating. In contrast, fine-powder coatings possess the lowest deviation in microhardness value, due to the relative low distribution of pore-size and the very low fraction of large-range pores (3.3%).

3.3. Phase Analysis

To justify the different ranges of the pore size distribution in the coatings, the phase composition of the three coatings was investigated and the measurements are given in Figure 6. The three as-sprayed coatings consist of a mixture of α-Al2O3 and γ-Al2O3. However, the main phase was the γ-phase, with the α phase only occurring as a secondary phase. The α-phase is associated with un-melted sprayed powder particles or with melted particles cooled at a low rate. Generally, a high cooling rate leads to a high composition of a γ-phase [27]. The broad, flat area on the curve representing the fine-powder coating (Figure 6c) indicates that larger amounts of particles were fully melted and their phase changed into a γ phase when compared to medium- and coarse-powders. This implies that higher fraction of fine-powder particles was fully melted when impinging at the substrate than those in medium- and coarse-powders, which is represented by the γ-phase.
Un-melted and partially melted particles of coarse- and medium-powders within the coatings were the source of large pores formations. Therefore, the α-phase, which represents these particles in coarse- and medium-powder coatings (Figure 6a,b), has a higher level in the composition than that of fine-powder coatings (Figure 6c).

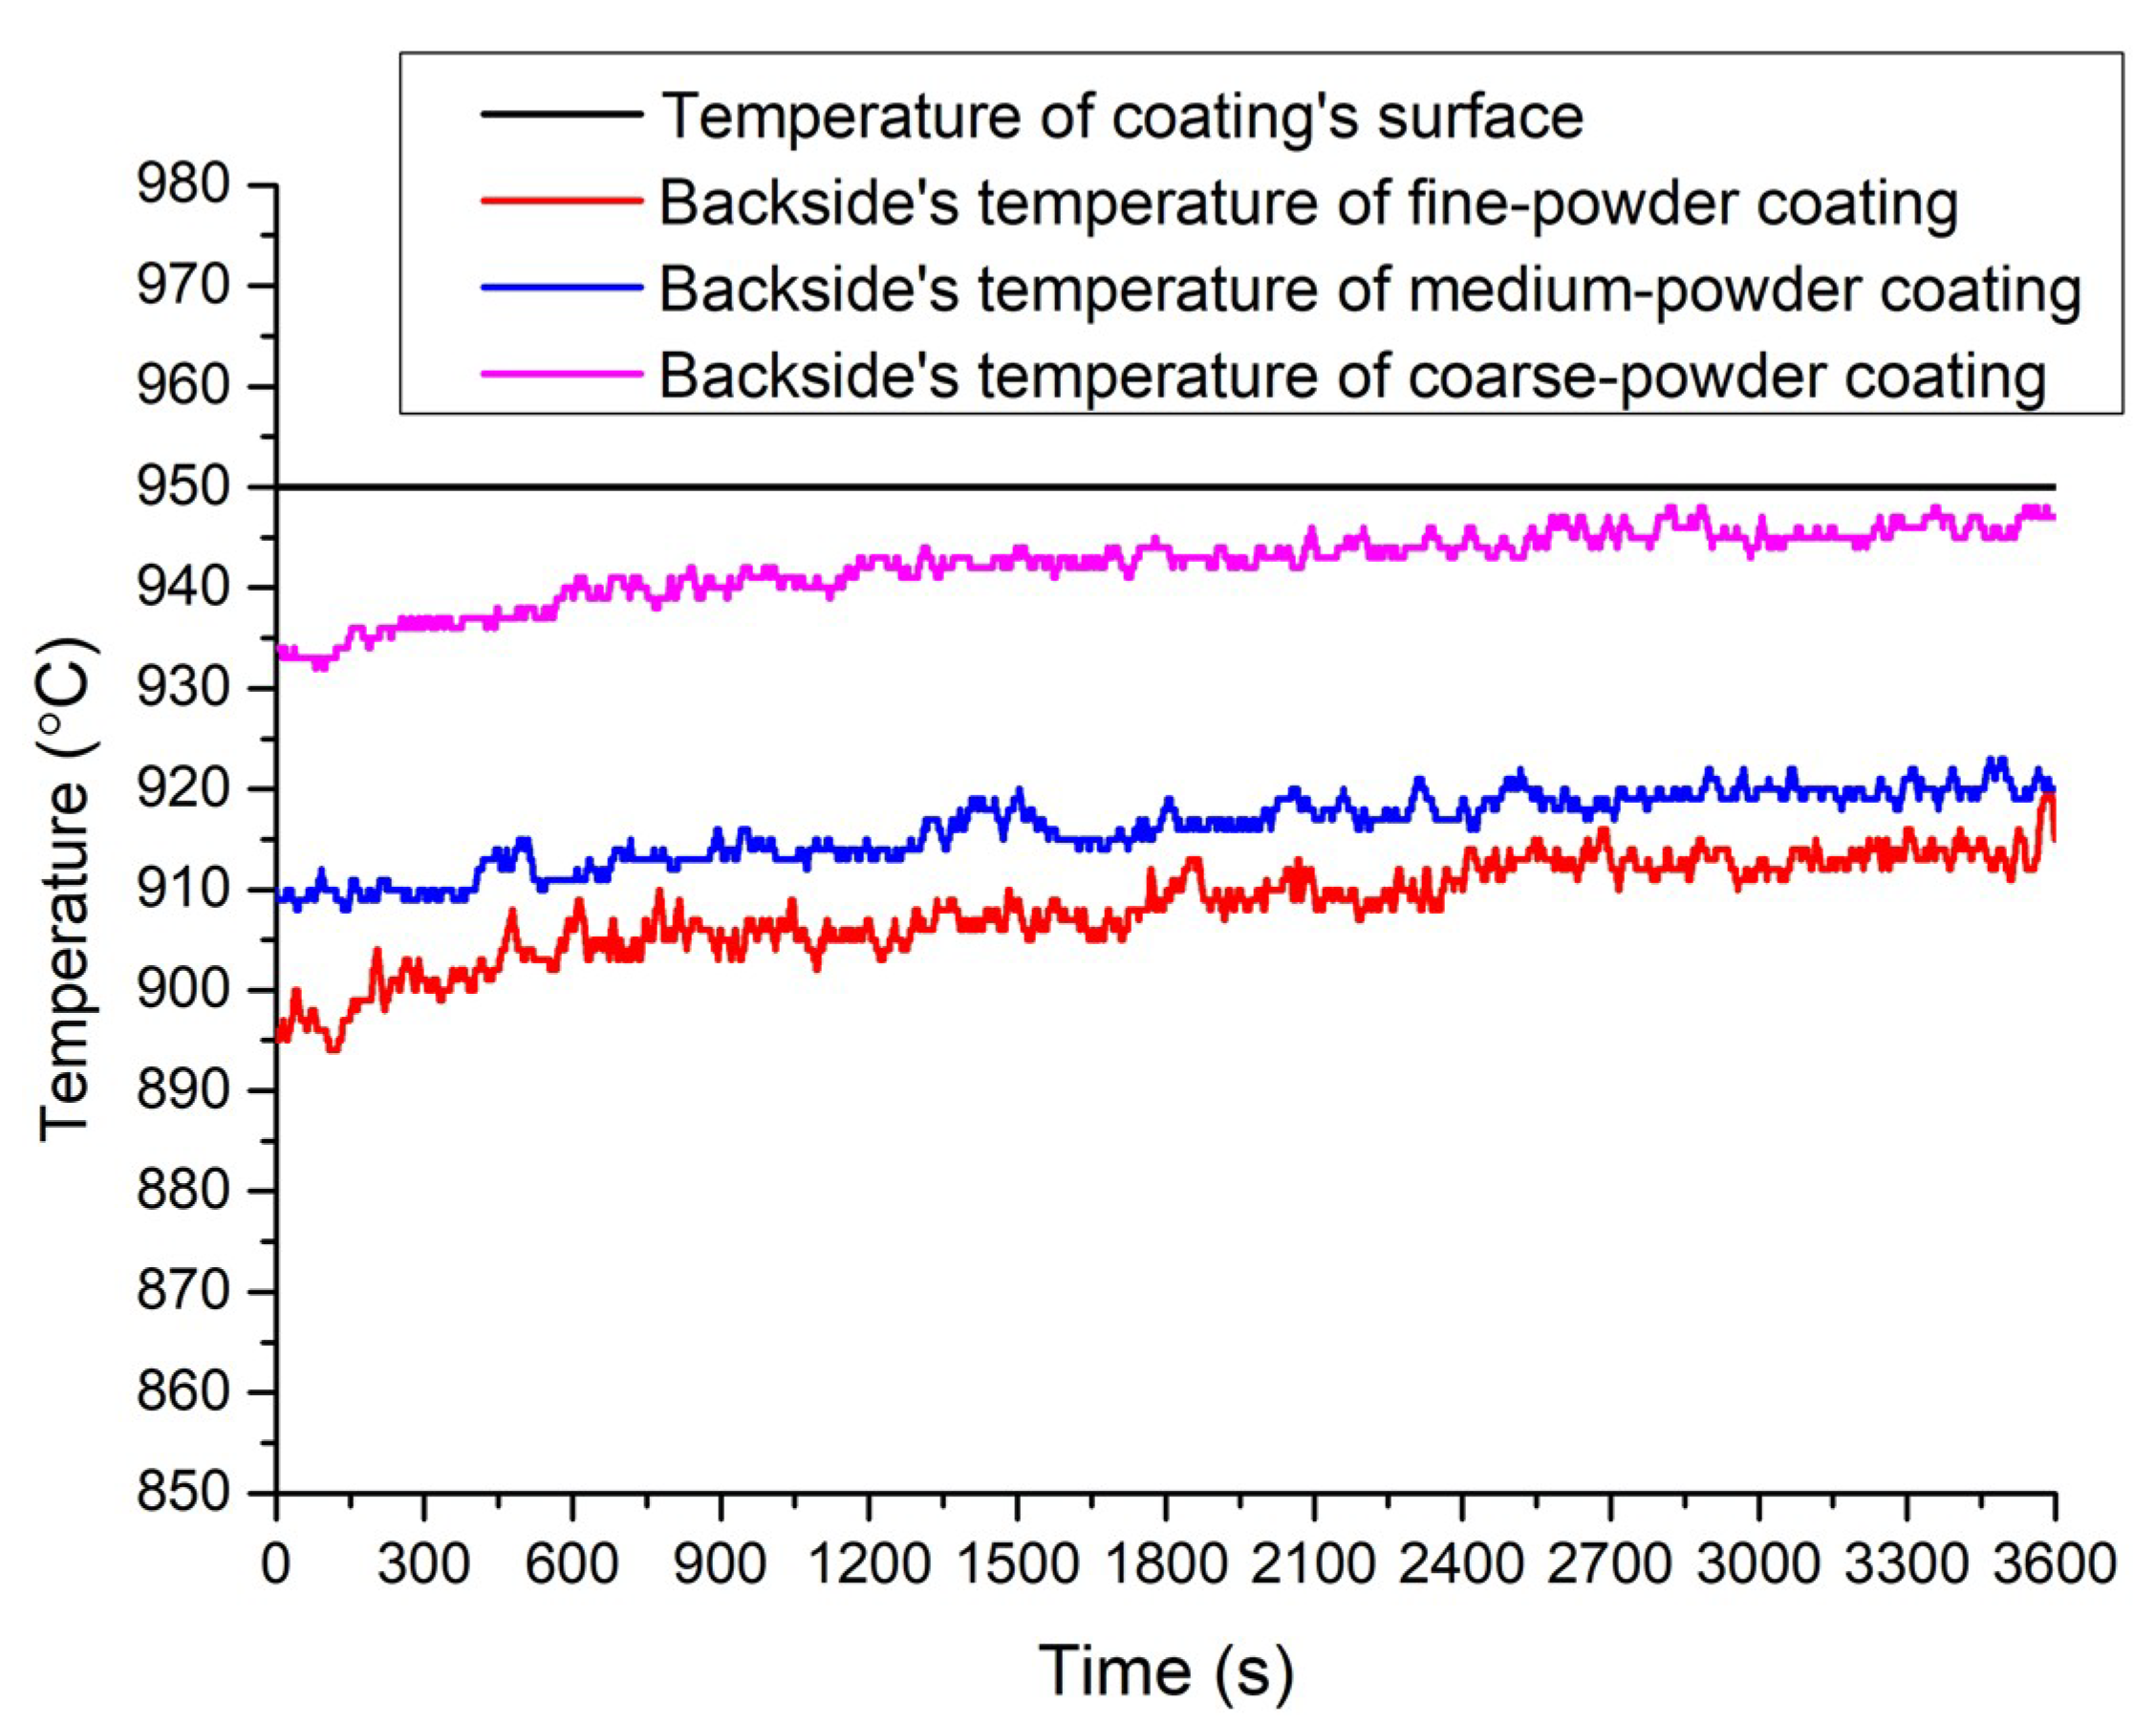
3.4. Thermal Insulation

The thermal insulation test applied on coatings of the same thickness (200 ± 10 µm) and produced from the three powders is shown in Figure 7. It can be seen that the fine-powder coating possesses a comparable thermal insulation value when compared to the medium-powder coatings, although its total porosity (0.93%) is much lower than the total porosity of medium-powder coatings (2.47%). At the same time, coarse-powder coating exhibits the lowest thermal insulation although it has the highest porosity content among other coatings. This can be attributed to the high porosity fraction of large pores (67%) and to the low porosity fraction of medium-size pores (13%) that has a circularity factor less than 0.5.
As the porosity of fine-powder coatings consists mainly from pores and cracks of fine- and medium-range (96.7%), and it can be concluded that these ranges of pore sizes and shapes contribute largely to the thermal insulation property and play the primary role in determining thermal insulation value of coatings. The high thermal insulation exhibited by fine-powder coatings can be related to the greater number of interfaces between the pores and the matrix of the coating [16]. In addition, the relative high thermal insulation of fine-powder coatings can be related to the higher fine pore density (number of fine pores per unit area), as can be noticed in SEM images in Figure 4.
Furthermore, large pores and medium pores of circularity >0.5 are of low significance and play only a secondary role in determining the thermal insulation property of coatings, although their presence in medium- and coarse-powder coatings increases greatly the overall porosity.
This finding is consistent with the reported data for thermal conductivity of ceramic coatings. It has been reported that the number of pores plays a significant role in reducing the thermal conductivity of ceramic coatings [26]. They measured the thermal conductivity of plasma sprayed YSZ coatings and found that thermal conductivity is reduced from 1.4 to 0.8 W/(m·K), for coatings of higher pore number, although all coatings were having almost the same total porosity. This implies that a coating with big number of fine pores has lower thermal conductivity than a coating with small number of large pores.

4. Conclusions

In this study, it was shown that the particle size of the feedstock starting powder has a fundamental effect on the porosity level as well as pore-size distribution, pore shape, and distribution of the overall porosity which highly influence the ultimate thermal coating properties, such as the thermal insulation and strain tolerance. According to the obtained results, the following conclusions can be drawn.
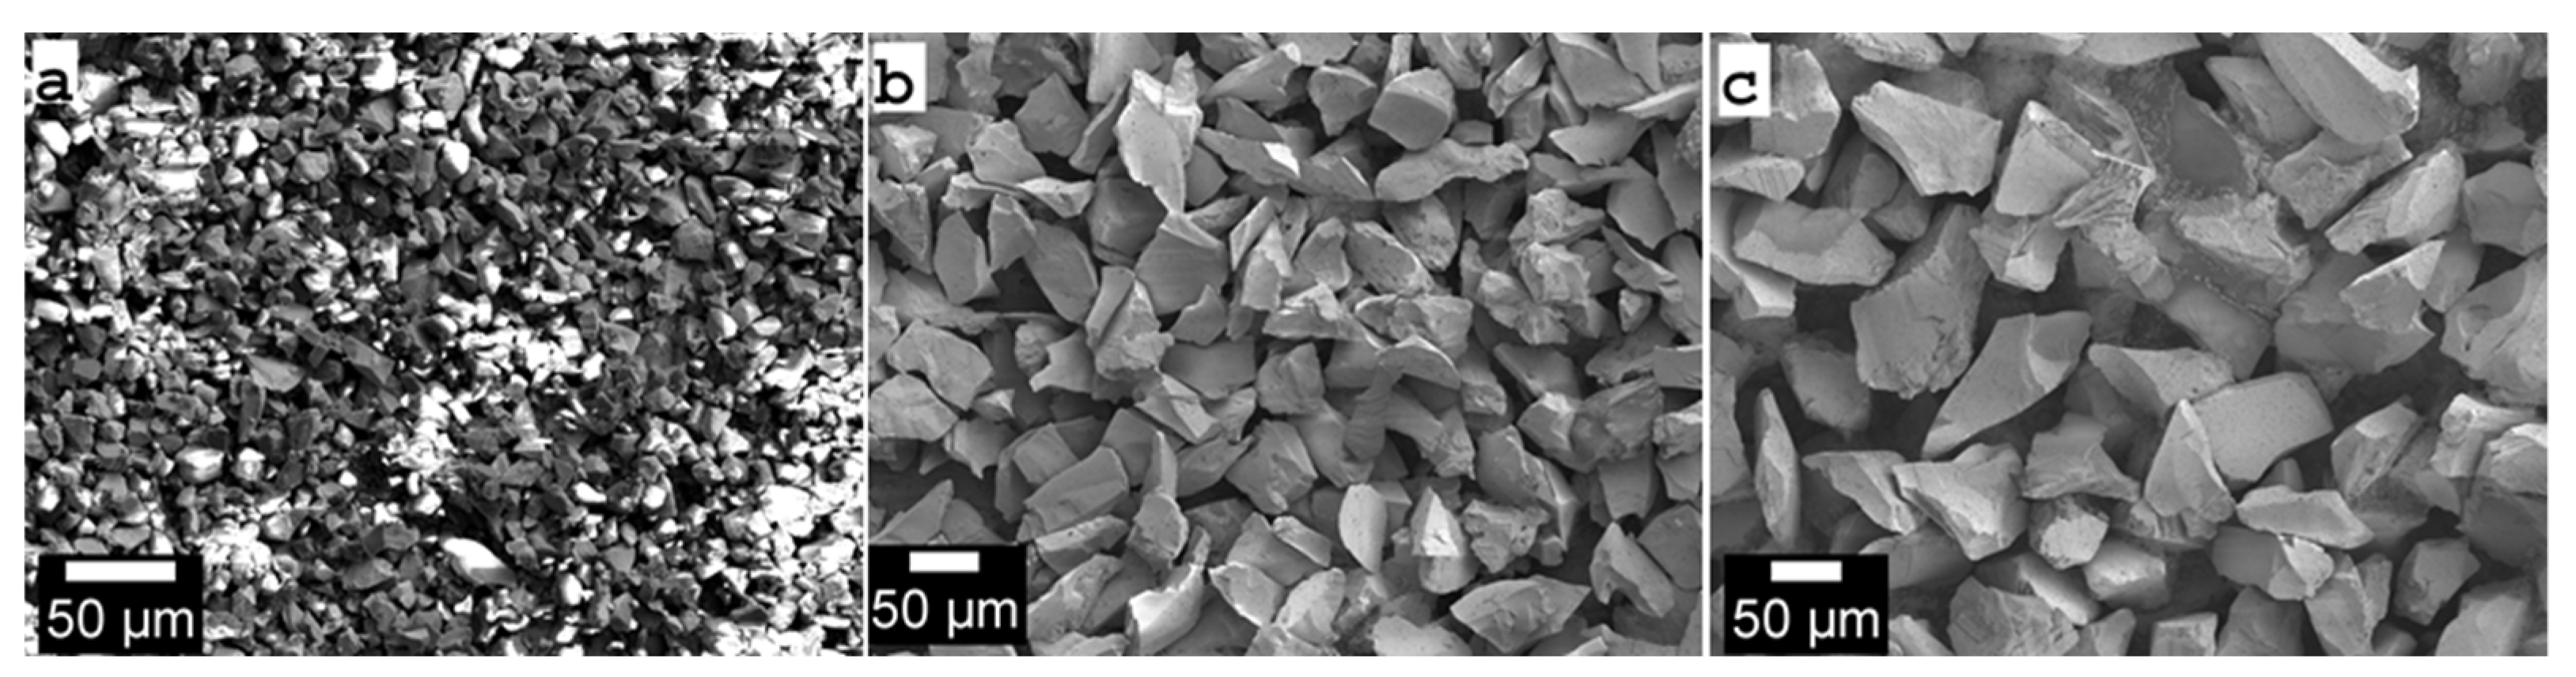
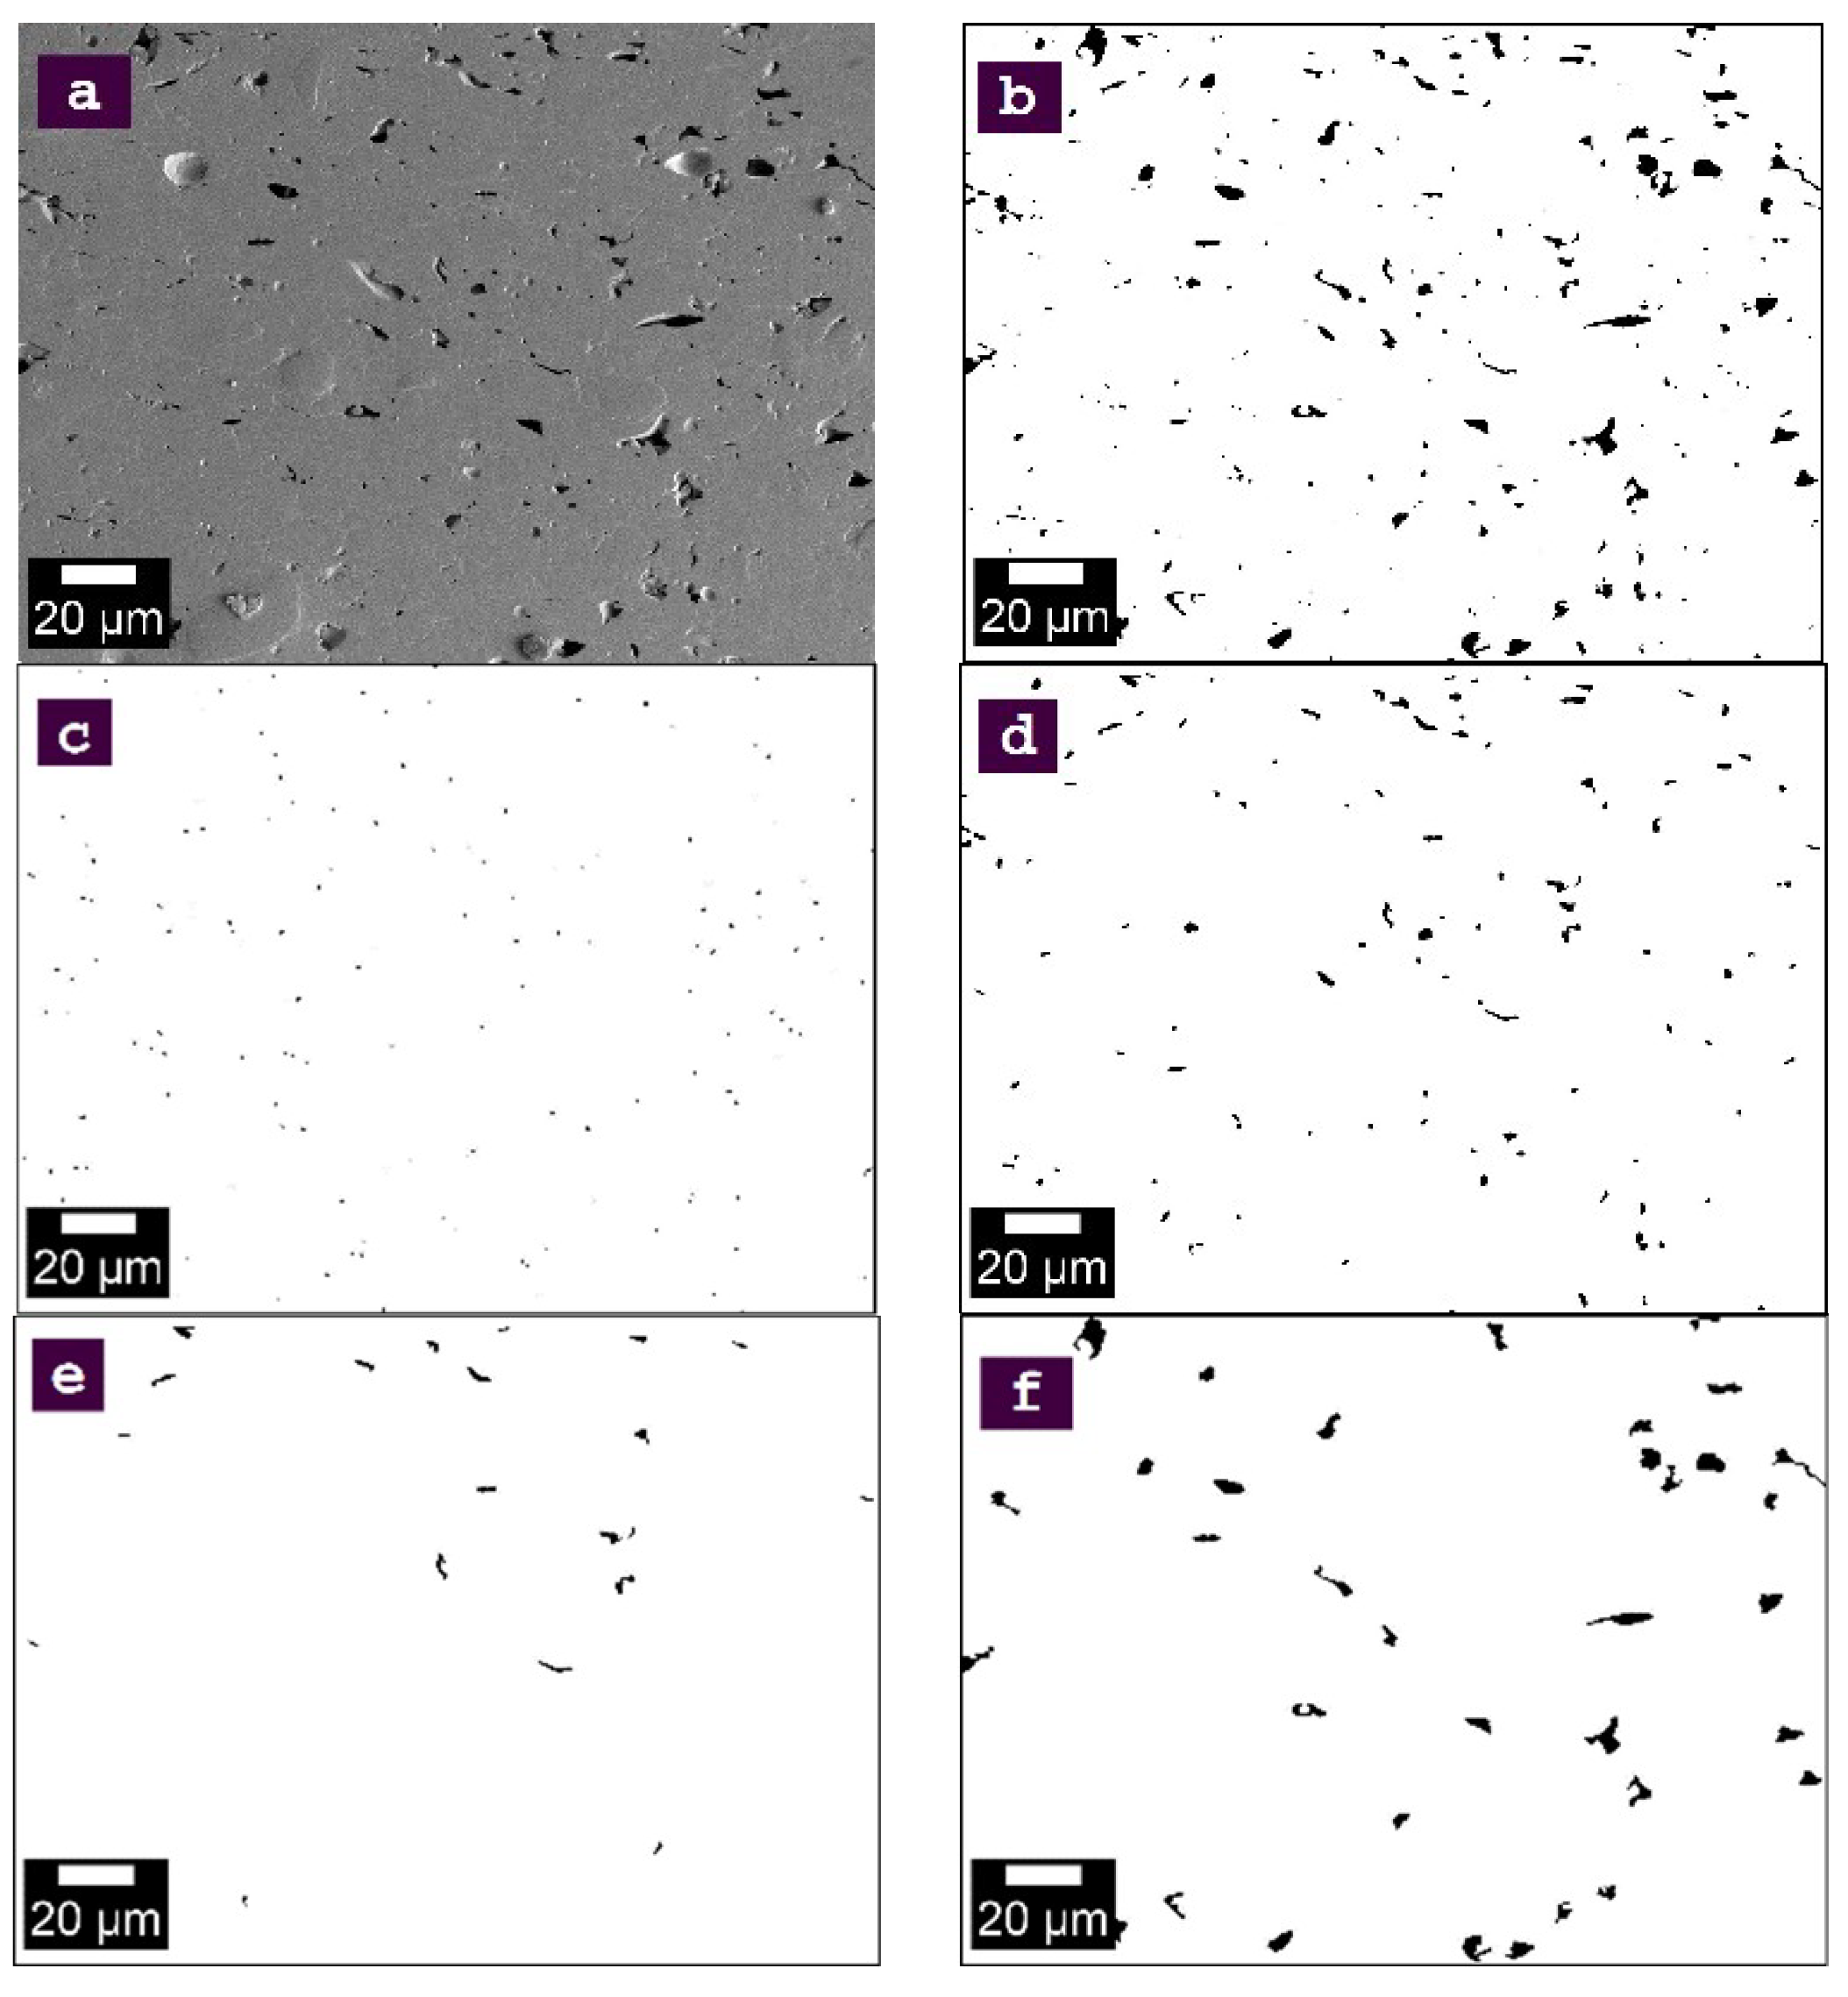
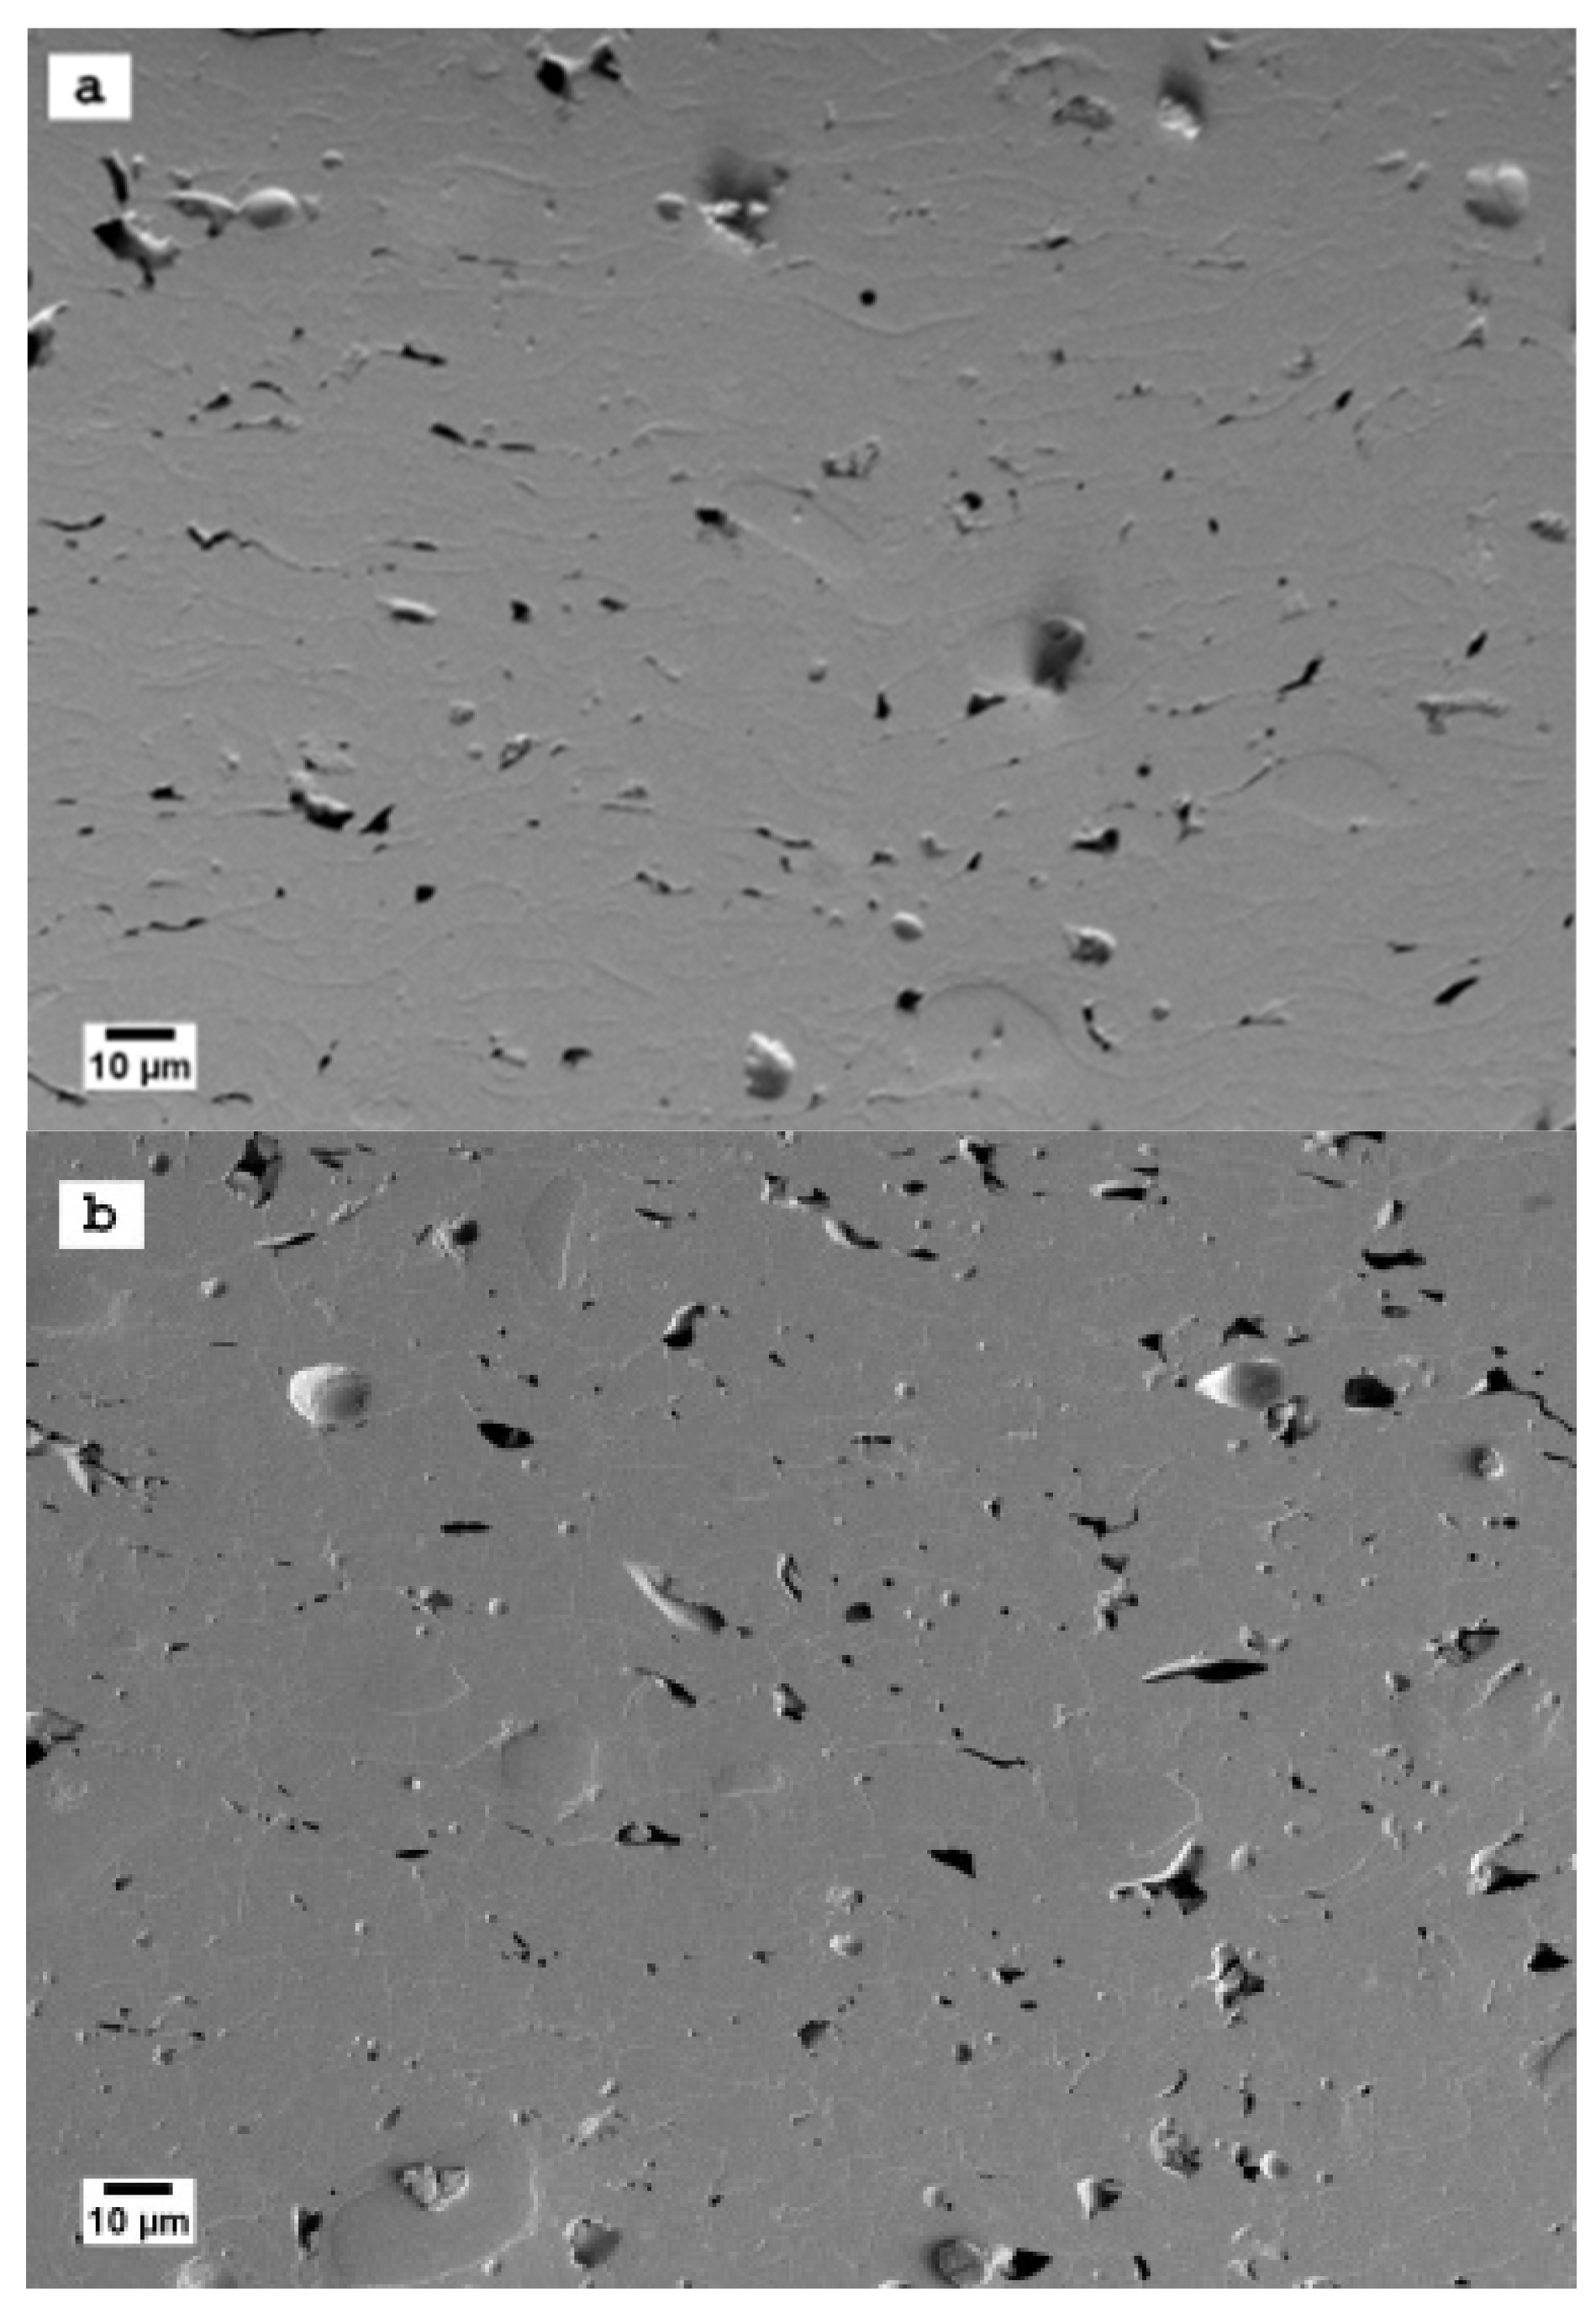
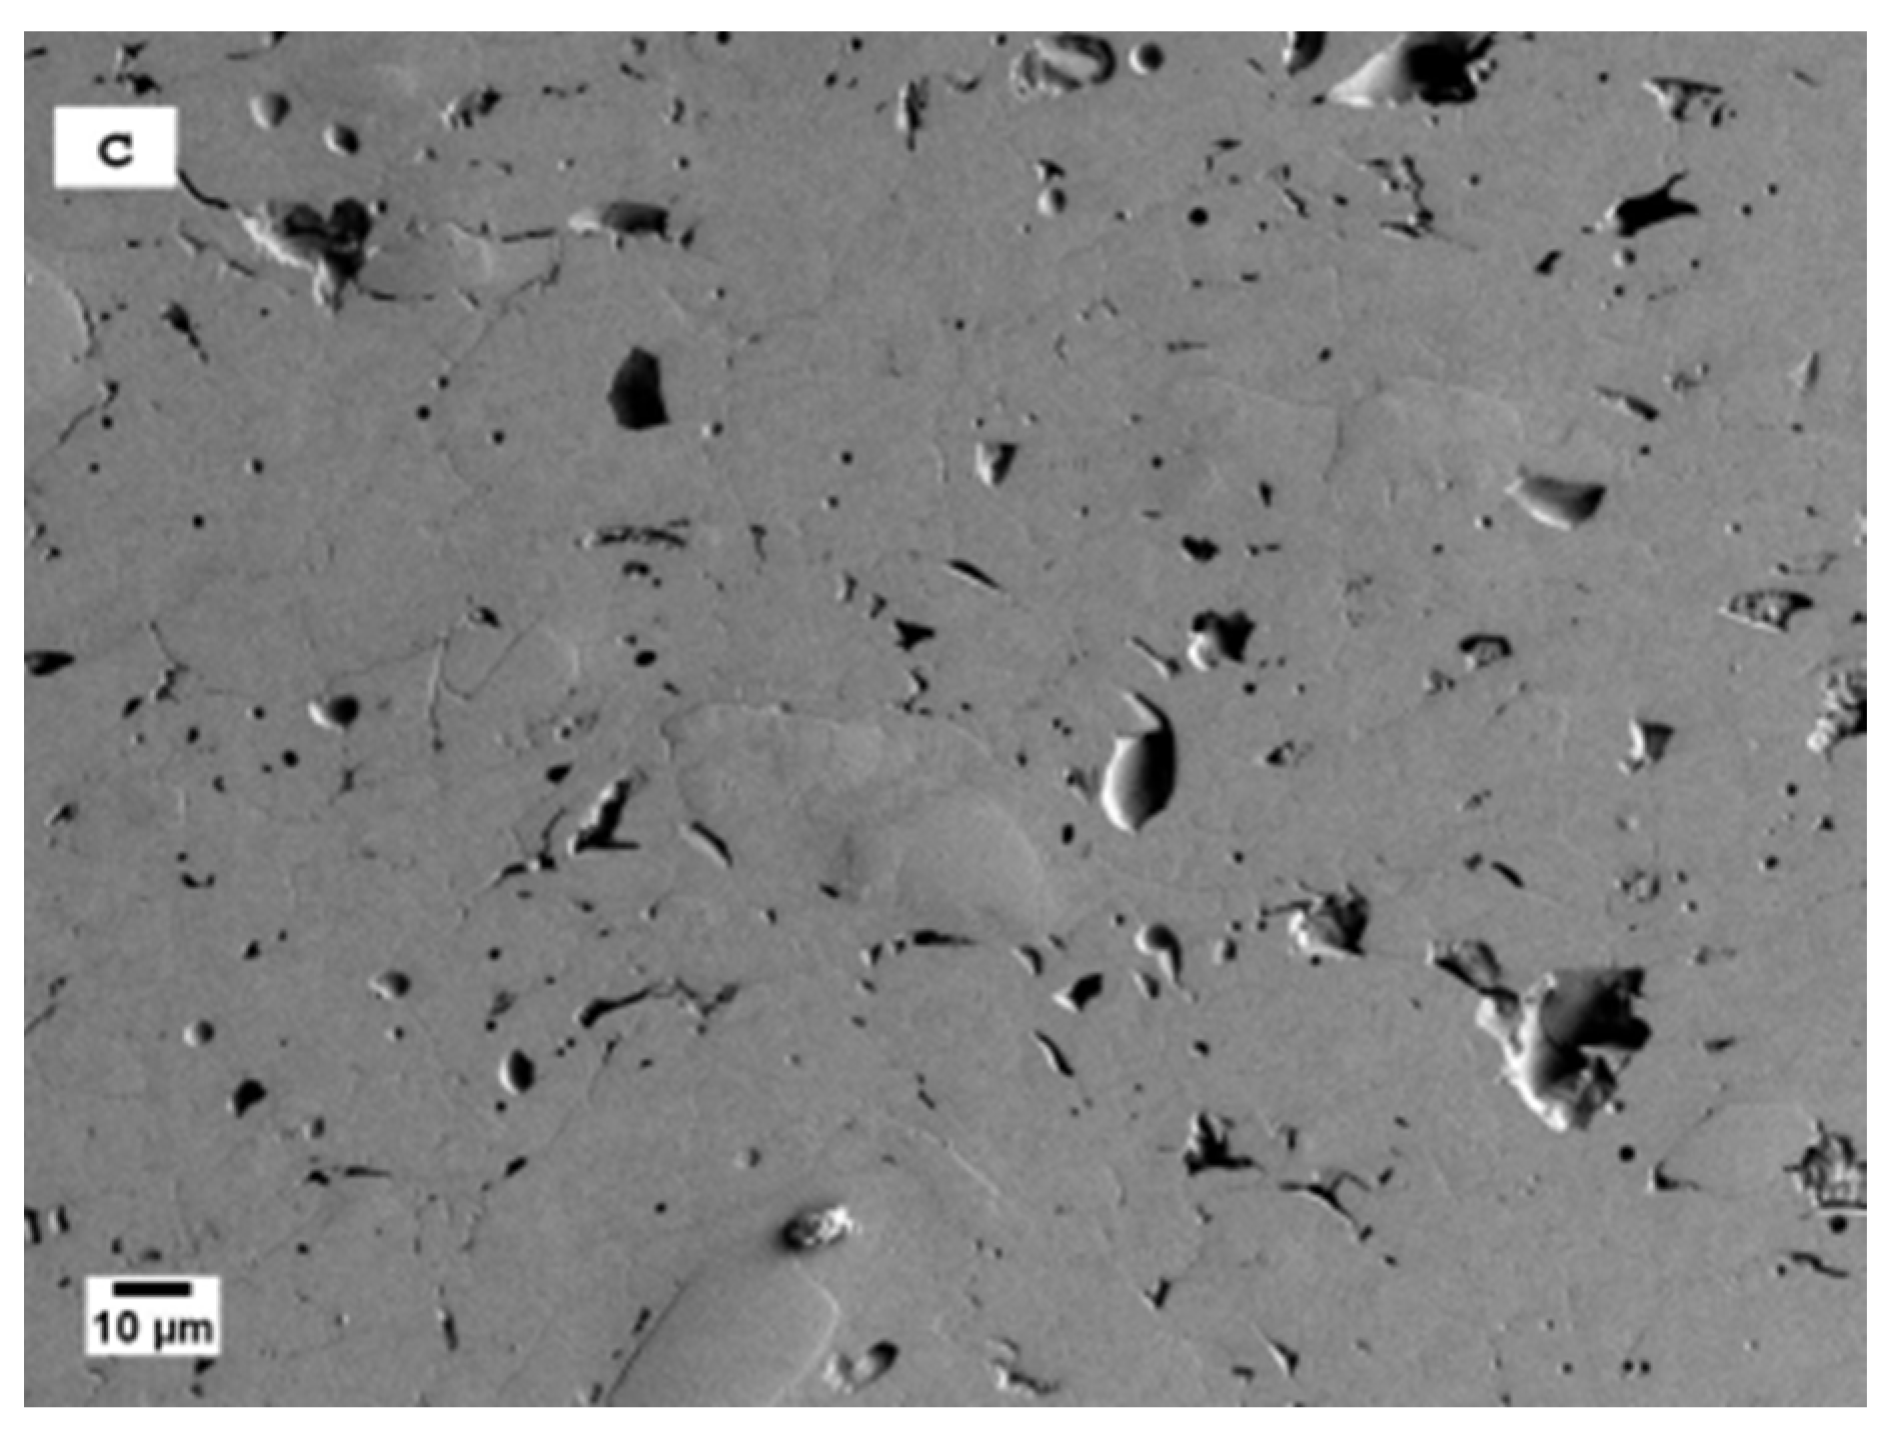
  • Coatings produced by fine-powders (i.e., fine particle size) exhibit more uniform pore distribution than coatings produced using medium- and coarse-powders. The pore size was in the range from few tenth nanometers to approximately 10 µm2. More than 95% of this range contributes highly to the coating’s thermal insulation property due to the uniform distribution, pore size, and pore shape.
  • As the starting powder’s particle size increases, the percentage of fine and medium pore size ranges (0–1 and 1–10 µm2) decreases, whereas the percentage of large pore-size ranges (>10 µm2) increases. The increment in large pores greatly increases the total porosity with relatively low contribution to the coating’s thermal insulation.
  • APS coatings fabricated by fine-powders have higher micro hardness values than coatings fabricated by medium- and coarse-powders due to their denser coatings. At the same time, fine-powder coatings exhibit thermal insulation value comparable to thermal insulations of coatings produced by medium-powders despite of higher total porosity owned by medium-powder coatings. This is due to the higher contribution of the “effective porosity” in fine-powder coatings, represented by fine pores and cracks, and their homogeneous distribution within the coatings. In addition, coarse-powder coatings exhibit the lowest thermal insulation although it has the highest porosity content among other coatings.

Author Contributions

Conceptualization, O.K. and M.A.; Methodology, O.K.; Validation, O.K. and M.A.; Formal Analysis, O.K.; Investigation, O.K.; Resources, O.K.; Data Curation, O.K.; Writing—Original Draft Preparation, O.K.; Writing—Review and Editing, O.K and M.A.; Visualization, O.K.; Supervision, W.T.; Project Administration, O.K.; Funding Acquisition, W.T.

Funding

This research received no external funding.

Acknowledgments

We acknowledge financial support by Technische Universität Dortmund/TU Dortmund University within the funding program Open Access Publishing.

Conflicts of Interest

The authors declare no conflicts of interest.

References

  1. Davis, J.R. Handbook of Thermal Spray Technology; ASM International Materials Park: Las Vegas, NV, USA, 2009. [Google Scholar]
  2. Pavitra, B.; Padture, P.; Alexandre, V. Improved interfacial mechanical properties of Al2O3—13 wt. % TiO2 plasma-sprayed coatings derived from nanocrystalline powders. Acta Mater. 2003, 51, 2959–2970. [Google Scholar]
  3. Singh, V.; Sil, A.; Jayaganthan, R. A study on sliding and erosive wear behavior of atmospheric plasma sprayed conventional and nanostructured alumina coatings. Mater. Des. 2011, 32, 584–591. [Google Scholar] [CrossRef]
  4. Tingaud, O.; Bertrand, P.; Bertrand, G. Microstructure and tribological behavior of Suspension plasma sprayed Al2O3 and Al2O3–YSZ composite coatings. Surf. Coat. Technol. 2010, 205, 1004–1008. [Google Scholar] [CrossRef]
  5. Li, C.; Yang, G.; Ohmori, A. Relationship between particle erosion and lamellar microstructure for plasma-sprayed alumina coatings. Wear 2006, 260, 1166–1172. [Google Scholar] [CrossRef]
  6. Morks, M.; Cole, I.; Corrigan, C.; Kobayashi, A. Electrochemical characterization of plasma sprayed alumina coatings. J. Surf. Eng. Mater. Adv. Technol. 2011, 1, 107. [Google Scholar] [CrossRef]
  7. Herman, H.; Sampath, S. Metallurgical and Ceramic Protective Coatings; Stern, K.H., Ed.; Chapman & Hall: London, UK, 1996; p. 263. [Google Scholar]
  8. Girolamo, G.; Brentari, A.; Blasi, C.; Serra, E. Microstructure and mechanical properties of plasma sprayed alumina-based coatings. Ceram. Int. 2014, 40, 12861–12867. [Google Scholar] [CrossRef]
  9. Schlichting, K.; Padture, N.; Klemens, P. Thermal conductivity of dense and porous yttria stabilized zirconia. J. Mater. Sci. 2001, 36, 3003–3010. [Google Scholar] [CrossRef]
  10. Pawlowski, L. The relationship between structure and dielectric properties in plasma sprayed alumina coating. Surf. Coat. Technol. 1988, 35, 285–298. [Google Scholar] [CrossRef]
  11. Beauvais, S.; Guipont, V.; Jeandin, M.; Juve, D.; Treheux, D.; Robisson, A.; Saenger, R. Influence of defect orientation on electrical insulating properties of plasma-sprayed alumina coatings. J. Electroceram. 2005, 15, 65–74. [Google Scholar] [CrossRef]
  12. Matejka, D.; Benko, B. Plasma Spraying of Metallic and Ceramic Materials; John Wiley & Sons: New York, NY, USA, 1989. [Google Scholar]
  13. Thirumalaikumarasamya, D.; Shanmugama, K.; Balasubramanianb, V. Influences of Atmospheric Plasma Spraying Parameters on the Porosity Level of Alumina Coating on AZ31B Magnesium Alloy Using Response Surface Methodology; Chinese Materials Research Society: Beijing, China, 2012. [Google Scholar]
  14. Pawlowski, L. The Science and Engineering of Thermal Spray Coatings, 2nd ed.; John Wiley & Sons: Chichester, UK, 2008. [Google Scholar]
  15. Padture, N.P.; Gell, M.; Jordan, E.H. Materials science—Thermal barrier coatings for gas-turbine engine applications. Science 2002, 296, 280–284. [Google Scholar] [CrossRef]
  16. Chen, N.; Song, X.; Liu, Z.; Lin, C.; Zeng, Y.; Huang, L.; Zheng, X. Quantitative analysis of the relationship between microstructures and thermal conductivity for YSZ coatings. J. Therm. Spray Technol. 2017, 26, 745–754. [Google Scholar] [CrossRef]
  17. Sevostianov, I.; Kachanov, M. Plasma sprayed Ceramic Coatings; Anisotropic elastic and conductive properties in relation to the microstructure; cross-property correlations. Mater. Sci. Eng. 2001, 297, 235–243. [Google Scholar] [CrossRef]
  18. Ravichandran, K.; Dutton, R.; Semiatin, S. Thermal conductivity of plasma-sprayed monolithic and multilayer coatings of alumina and yttria-stabilized zirconia. Ceram. Soc. 1999, 82, 673–682. [Google Scholar] [CrossRef]
  19. Chi, W.; Sampath, S.; Wang, H. Microstructure-thermal conductivity relationships for plasma-sprayed yttria-stabilized zirconia coatings. J. Am. Ceram. Soc. 2008, 91, 2636–2645. [Google Scholar] [CrossRef]
  20. Cernuschi, F.; Golosnoy, I.O.; Bison, P.; Moscatelli, A.; Vassen, R.; Bossmann, H.P.; Capelli, S. Microstructural characterization of porous thermal barrier coatings by IR gas porosimetry and sintering forecasts. Acta Mater. 2013, 61, 248–262. [Google Scholar] [CrossRef]
  21. Wang, Z.; Kulkarani, A.; Deshpande, S.; Nakamura, T.; Herman, H. Effects of pores and interfaces on effective properties of plasma sprayed zirconia coatings. Acta Mater. 2003, 51, 5319–5334. [Google Scholar] [CrossRef]
  22. Cernuschi, F.; Ahmaniemi, S.; Vuoristo, P.; Mantyla, T. Modelling of thermal conductivity of porous materials: Application to thick thermal barrier coating. J. Eur. Ceram. Soc. 2004, 24, 2657–2667. [Google Scholar] [CrossRef]
  23. Wang, Y.; Liu, H.; Ling, X.; Weng, Y. Effects of pore microstructure on the effective thermal conductivity of thermal barrier coatings. Appl. Therm. Eng. 2016, 102, 234–242. [Google Scholar] [CrossRef]
  24. ImageJ. Available online: https://imagej.nih.gov/ij/ (accessed on 20 September 2019).
  25. Deshpande, S.; Kulkarni, A.; Sampath, S.; Herman, H. Application of image analysis for characterization of porosity in thermal spray coatings and correlation with small angle neutron scattering. Surf. Coat. Technol. 2004, 187, 6–16. [Google Scholar] [CrossRef]
  26. Huang, Y.; Hu, N.; Zeng, Y.; Song, X.; Lin, C.; Liu, Z.; Zhang, J. Effect of different types of pores on thermal conductivity of YSZ thermal barrier coatings. Coatings 2019, 9, 138. [Google Scholar] [CrossRef]
  27. McPherson, R. Formation of metastable phases in flame- and plasma-prepared alumina. J. Mater. Sci. 1973, 8, 851–858. [Google Scholar] [CrossRef]
Figure 1. SEM images showing the morphology of fused and crushed alumina powders: (a) fine particle size (+5–22 µm), (b) medium particle size (+22–45 µm), and (c) coarse particle size (+45–90 µm).
Coatings 09 00601 g001
Figure 2. Cross-sectional SEM image showing the shapes and relative sizes (area) of pores and cracks; fine: <1 µm2; medium: 1 to 10 µm2; and large: >10 µm2.
Coatings 09 00601 g002
Figure 3. Pore classification process: (a) SEM gray image, (b) total porosity (binary image), (c) fine pores, (d) medium pores, (e) medium pores with a circularity <0.5, and (f) large pores.
Coatings 09 00601 g003
Figure 4. Cross-sectional SEM micrographs of as-sprayed alumina coatings indicating the coating porosity and cracks deposited with: (a) fine powder, (b) medium powder, and (c) coarse powder.
Coatings 09 00601 g004aCoatings 09 00601 g004b
Figure 5. Relative pore range contributions out of total porosity.
Coatings 09 00601 g005
Figure 6. X-ray powder diffraction (XRD) patterns of APS alumina coatings deposited with (a) coarse-powder, (b) medium-powder, and (c) fine-powder particle sizes.
Coatings 09 00601 g006
Figure 7. Comparison of thermal insulation of as-sprayed alumina coatings produced by fine, medium, and coarse particle size for a hold time of 60 min.
Coatings 09 00601 g007
Table 1. Atmospheric plasma sprayed (APS) process parameters for alumina powders.
ParameterValue
Current [A]600
Voltage [V]74 ± 3
Argon [L·min−1]41
Hydrogen [L·min−1]12
Power carrier gas [NLPM]3.4
Nozzle diameter [mm]6
Spray distance [mm]120
Step height [mm]4
Number of spray passes [mm]10
Table 2. Measurements of porosity fractions from literature compared to present work measurements for coatings prepared by medium and coarse particle size.
Porosity FractionRef. [25]
15–50 µm
Ref. [26]
Powder Size Not Specified
This Study
25–45 µm45–90 µm
Large pores≈65%80% (>2 µm2)40%67%
Fine + Medium pores≈35%n/a *55%33%
Medium poresn/a *n/a *45%27%
Fine poresn/a *20% (<2 µm2)15%6%
* = not applicable.
Table 3. Average microhardness measurements and associated deviations.
Coating ofAverage Microhardness (HV0.3)Deviation
Fine-powder94416.2
Medium-powder88132.3
Coarse-powder82971.4

