Life under Continuous Streaming: Recrystallization of Low Concentrations of Bacterial SbpA in Dynamic Flow Conditions


1
Institute for Biophysics, Department of Nanobiotechnology (DNBT), BOKU University for Natural Resources and Life Sciences, Muthgasse 11 (Simon Zeisel Haus), A-1190 Vienna, Austria
2
Research Institute of Molecular Pathology (IMP), Campus-Vienna-Biocenter 1, 1030 Vienna, Austria
*
Authors to whom correspondence should be addressed.
Coatings 2019, 9(2), 76; https://doi.org/10.3390/coatings9020076
Submission received: 6 November 2018
/
Revised: 13 January 2019
/
Accepted: 24 January 2019
/
Published: 27 January 2019
(This article belongs to the Special Issue Polycrystalline Coatings)
Abstract
:The well-known bacterial S-layer protein SbpA from Lysinibacillus sphaericus CCM2177 induces spontaneous crystal formation via cooperative self-assembly of the protein subunits into an ordered supramolecular structure. Recrystallization occurs in the presence of divalent cations (i.e., Ca2+) and finally leads to producing smooth 2-D crystalline coatings composed of squared (p4) lattice structures. Among the factors interfering in such a process, the rate of protein supply certainly plays an important role since a limited number of accessible proteins might turn detrimental for film completion. Studies so far have mostly focused on high SbpA concentrations provided under stopped-flow or dynamic-flow conditions, thus omitting the possibility of investigating intermediate states, in which dynamic flow is applied for more critical concentrations of SbpA (i.e., 25, 10, and 5 µg/mL). In this work, we have characterized both physico-chemical and topographical aspects of the assembly and recrystallization of SbpA protein in such low concentration conditions by means of in situ Quartz Crystal Microbalance with Dissipation (QCMD) and atomic force microscopy (AFM) measurements, respectively. On the basis of these experiments, we can confirm how the application of a dynamic flow influences the formation of a closed and crystalline protein film from low protein concentrations (i.e., 10 µg/mL), which otherwise would not be formed.
1. Introduction
The fabrication of a polycrystalline coating on a solid support implies, from a merely experimental point of view, the combined employment of proper technical approaches and suitable (bio)materials that do enable the preparation of such structured films [1]. The formation of coatings expressing different crystallinity properties (mono vs. poly, semi-crystallinity, etc.) has extensively been reported in the literature for diverse starting materials such as polymers, noble metals, ionic salts, or proteins [2,3,4,5,6,7]. Regarding the particular use of peptides/proteins as film building blocks, there exist well-known examples which induce spontaneous crystal formation via cooperative self-assembly of those protein subunits into an ordered superstructure [8,9]. This is the case of Class II hydrophobins [10], Annexin A5 [11,12], and bacterial S-layer proteins [13] which give raise to ultrathin active coatings of only a few nanometers thick and well-defined lattice parameters. The final success of the assembly, including the achievement of a fully closed layer as well as performance of the technological application these systems are designed for, involves a list of factors playing a rather critical role. Among others, when attending to the underlying surface, one could cite as crucial considerations the protein-to-substrate affinity or the choice of the supporting element’s geometry, thus giving rise to samples in either two (flat surfaces) or three dimensions (i.e., colloidal particles) [14,15]. Some additional considerations to bear in mind are, for instance, the protein concentration to be employed, the choice of optimal environmental conditions, and some others that might interfere on the different levels of the crystallization process (e.g., buffer choice, salt content, etc.).
The present study deals with the adsorption and film formation of the well-known SbpA bacterial S-layer protein from Lysinibacillus sphaericus CCM2177. In the presence of divalent cations (most generally Ca2+), this protein builds smooth 2-D crystalline coatings composed of squared (p4) lattice structures. The nanostructure of the protein layer is responsible for some of the practical properties of these biomimetic films, like its described non-fouling activity [16] of high technological usefulness [17,18]. In recent years, several studies have addressed some general questions from the assembly and recrystallization of SbpA; namely, the influence of the substrate wettability [19] or the surface chemistry [20], and the use of alternative divalent cations [21]. Recent studies have provided a more dynamic insight on the SbpA S-layer formation process in order to develop optimal crystallization models. In these cases, the experiments were either performed in stopped flow mode, with a limited number of accessible protein as the experiment goes by for the lowest concentrations employed [22], or by just keeping a continuous flow of quite high concentrations (50 µg/mL) of SbpA, thus ensuring a quick completion of the process that could be visualized only under high-speed and high-resolution techniques [23]. These studies covered rather extreme situations in which the S-layer formation takes place but omitted the possibility of investigating intermediate states, where a continuous supply of SbpA is applied for sufficiently low concentrations.
In this work, Quartz Crystal Microbalance with Dissipation (QCMD) and Atomic Force Microscopy (AFM) have been used to resolve and quantify topographical and physico-chemical aspects of the assembly and recrystallization of SbpA on hydrophobic silicon dioxide surfaces. The use of low protein concentrations (25, 10, and 5 µg/mL) continuously pumped at a constant flow rate into the reaction chamber as the experiment takes place, enabled the observation of thin crystalline coatings not seen under other experimental (stopped flow) conditions for same starting SbpA protein solutions. These results successfully complement previous research on this topic and allow a good comparison between S-layer formation kinetics for varying physico-chemical environments.
2. Materials and Methods
2.1. Materials
Bacterial surface layer protein SbpA from Lysinibacillus sphaericus CCM2177 was first isolated and then purified as 1 mg/mL solution as detailed in the Supplementary Materials file. Before each experiment, the obtained protein solution was diluted using the appropriate amount of recrystallization buffer down to the following protein concentrations: 100, 50, 25, 10 and 5 µg/mL, corresponding to molarity values of 0.8, 0.4, 0.2, 0.08, and 0.04 µM, respectively. Protein recrystallization buffer was composed of 0.5 mM Trizma base (Sigma-Aldrich, Vienna, Austria) and 10 mM CaCl2 (98%, Sigma-Aldrich) and previously adjusted to pH 8.
2.2. Methods
2.2.1. Quartz Crystal Microbalance with Dissipation (QCMD)
QCMD experiments were performed in a QSense® Analyzerinstrument (QSense, Biolin Scientific, Vastra Frölunda, Sweden). Prior to their use, SiO2 coated quartz sensors (QSX 303, QSense, Biolin Scientific, Vastra Frölunda, Sweden) were turned into hydrophobic by Chemical Vapor Deposition (CVD) of 1H,1H,2H,2H perfluorododecyltricholosilane (Sigma Aldrich) atmosphere, then cleaned with sonication in Ultrapure water and ethanol, dried in N2, and inserted into the corresponding chamber.
Variations in frequency (∆f) and dissipation (∆D) parameters were measured by triplicate for S-layer formation at 25 °C. Injections of SbpA protein, the rinsing steps as well as the addition of the different buffers were performed by means of a peristaltic pump (Ismatec, Wertheim, Deutschland). The employed continuous flow rate was of 25 µL/min for SbpA protein incubation process, and of 300 µL/min in stopped-flow mode (pump stopped at the complete filling of the chamber volume) for the rest of the injections. Data were collected from several overtones (n = 3, 5, 7…13) throughout the QCMD experiment. In this work, we present the results from overtone n = 3. Complementarily, ∆D vs. ∆f plots (Df plots) represent the simultaneous dissipation and frequency changes at a certain time, which provide a more detailed view on the viscoelastic evolution of films per mass unit (∆m) change. The shape of the Df plot characterizes the processes unequivocally, making it possible to assess differences between the respective systems. QCMD data were processed with Origin software (version 8.5, OriginLab, Northampton, MA, USA).
2.2.2. Atomic Force Microscopy
AFM experiments were performed on 1H,1H,2H,2H-perfluorododecyltricholosilane-modified silicon wafers (IMEC, Leuven, Belgium), following the same procedure as for QCMD sensors, with a Multimode-AFM (Bruker AXS, Santa Barbara, CA, USA) controlled by a Nanoscope V and equipped with a J-scanner. A fluid chamber fed by a programmable “Aladdin” syringe pump (World Precision Instruments, Sarasota, FL, USA) with a flow rate of 25 µL/min was used for performing real-time measurements. This system was sealed by a silicone O-ring. Silicon-nitride probes (DNP-S, Bruker, USA) were employed in the experiments and their spring constant was calibrated in-situ (0.3 N/m) at the beginning of each measuring session by thermal tune method. Prior to their use in the AFM liquid chamber, the cantilevers were cleaned with UV/Ozone for 20 min. The fluid chamber, tubing, and O-rings were washed overnight with 2% SDS, followed by a gentle rinse with Milli-Q water and drying with nitrogen gas. The liquid chamber offers a volume of 35 ± 5 μL and presents a radius of 0.40 ± 0.05 cm. Therefore, the active area of the surface where the protein crystal can grow is around 0.5 cm2. Before each experiment, the functionalized surfaces were rinsed again with ethanol and Milli-Q water, dried under nitrogen and immediately inserted into the fluid chamber. Once mounted, the system was filled with recrystallization buffer and kept until stabilization of the deflection signal.
AFM images were obtained by triplicate in tapping mode, at low forces to prevent sample damage and at scan rates lower than 2 Hz. The proportional (PG) and integral (IG) gains were individually optimized for each set of experiments. All the AFM images were processed with the Nanoscope program (v1.40, Bruker) while domain size calculation was performed by Zen Blue Edition software (v2.3, Carl Zeiss GmbH, Oberkochen, Germany).
3. Results and Discussion
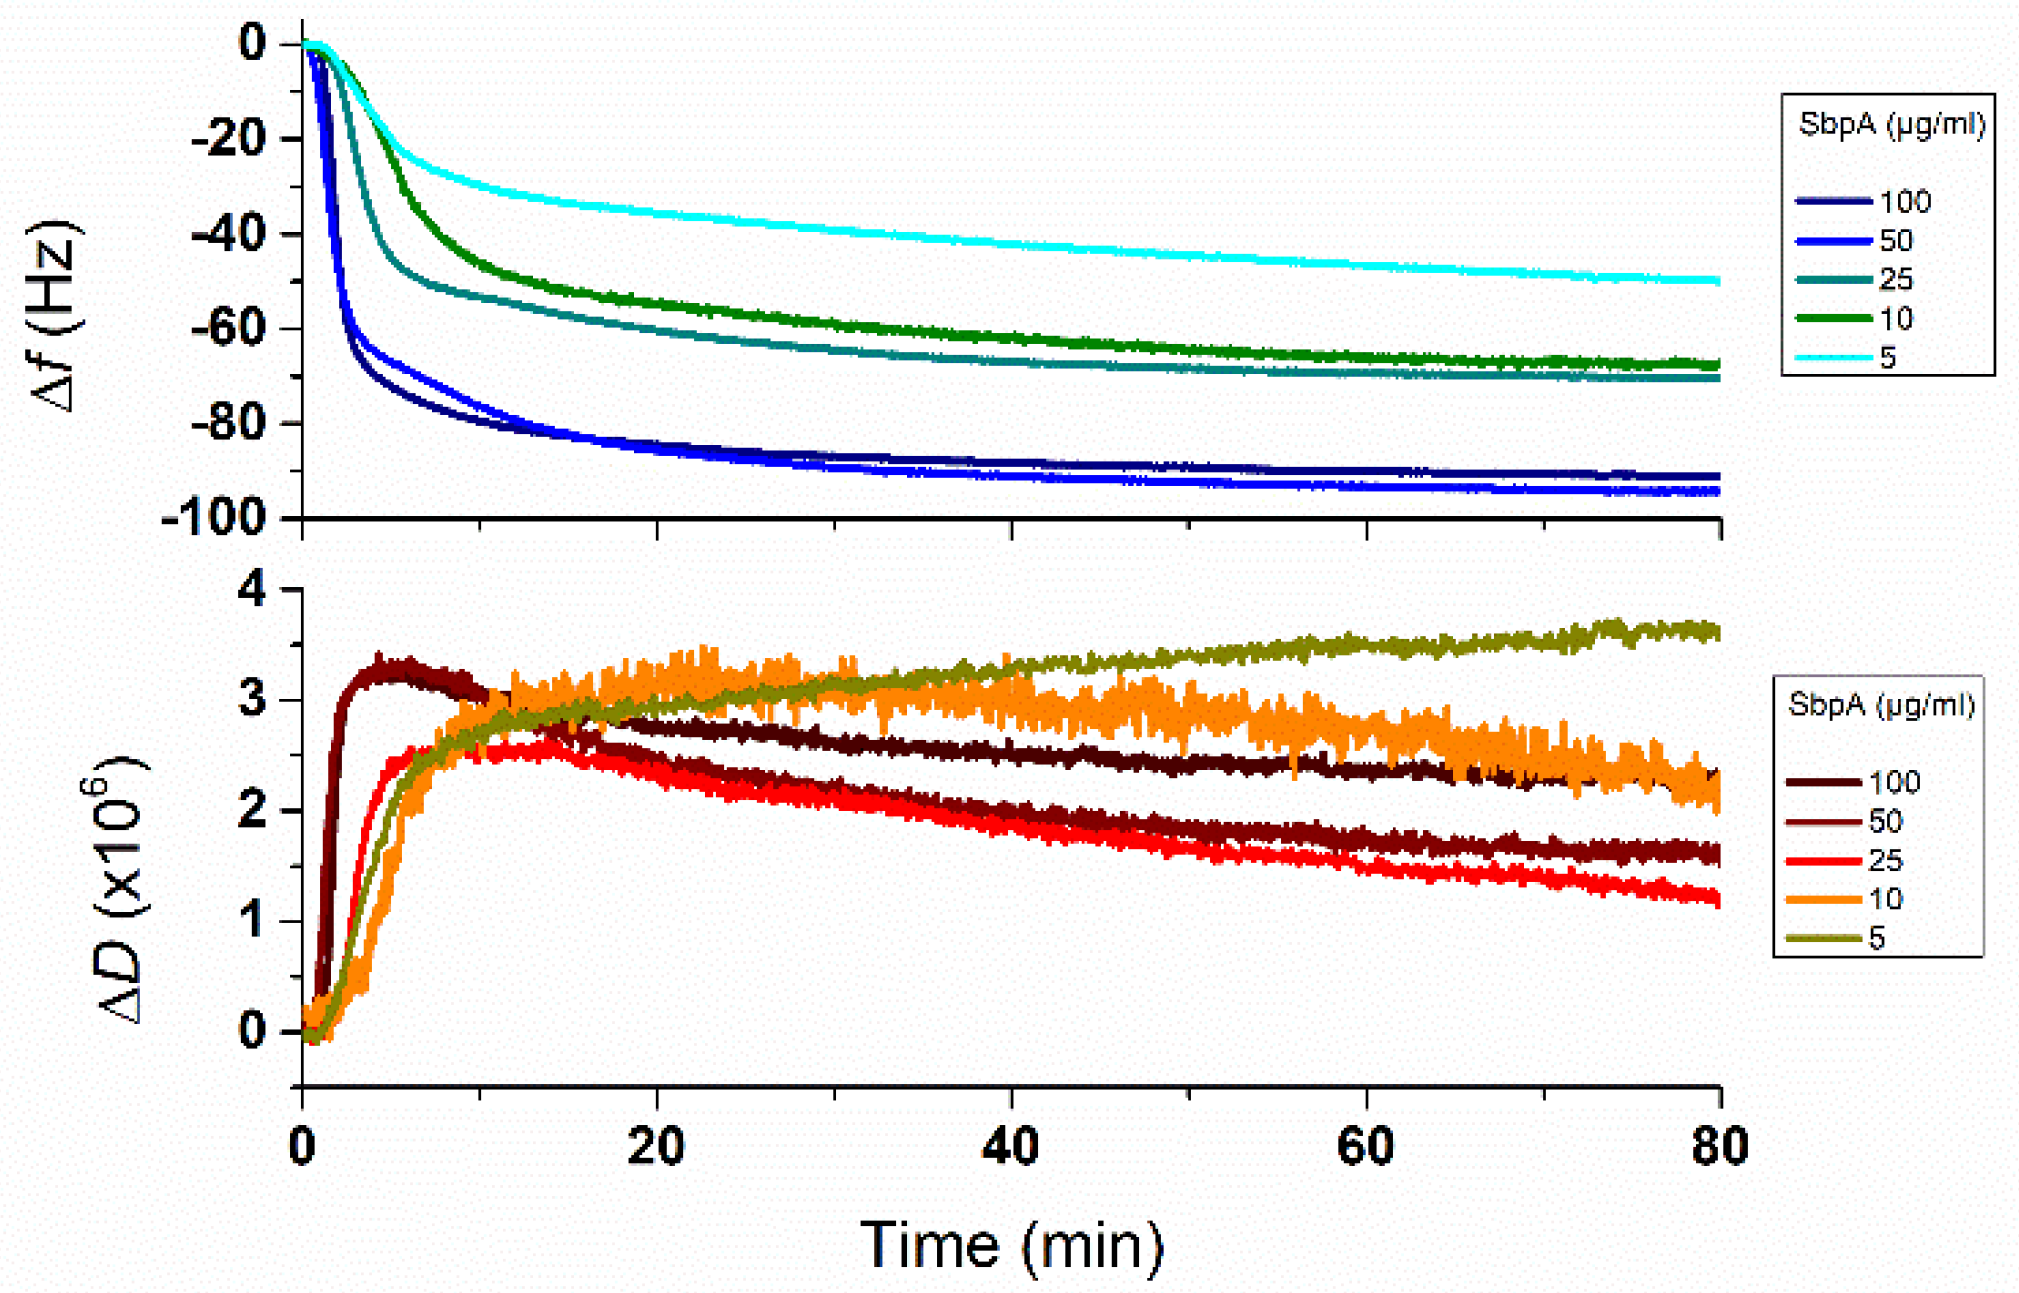
The assembly of a SbpA protein S-layer onto fluorinated hydrophobic SiO2 surfaces under continuous flow conditions was initially followed by means of QCMD. This technique allows a quantitative real-time monitoring of the process in terms of bound protein mass as well as film viscous properties, according to the variations recorded for frequency (Δf) and dissipation (ΔD) factors, respectively [19]. Figure 1 depicts the results obtained for the injection of five SbpA concentrations: 100, 50, 25, 10, and 5 µg/mL. The plot was adapted to directly show the adsorption of SbpA from the moment the protein enters the fluid chamber and onwards.
As expected, results show how the higher the protein bulk concentration injected the larger the adsorbed mass is measured, as well as the faster the adsorption process completion is observed (indicated by the plateau achieved in ∆f values, Figure 1). Indeed, for the highest concentrations (100 and 50 µg/mL) the adsorption process takes place very rapidly, and in approximately 20–25 min it is nearly over (ca. >85% of the total mass is bound). Such an observation resembles to what has been already described by our group for stopped-flow conditions and same type of underlying substrates [19,22,24]. However, as main difference, the much larger flow rate employed in those stopped-flow experiments (300 µL/min) allowed for a faster completion of the protein adsorption (see also Supplementary Materials , Figure S1) if compared to current experiments (25 µL/min). Back to QCMD results depicted in Figure 1, the maximum protein amount adsorbed varied rather accordingly for the lowest range of SbpA concentrations injected (25, 10 and 5 µg/mL). Quite surprisingly, 25 and 10 µg/mL solutions led to very similar films with a total frequency decay of around 60 Hz, which is about a 70% of the maximum value that was achieved for the highest concentrations under same experimental conditions. For both 25 and 10 µg/mL samples a final plateau could also be observed, which represents the completion of the adsorption process. In turn, when injecting a protein concentration of 5 µg/mL, the protein adsorption seemed to be still running quite actively, though very slow, even at the very end of the analysis time-window.
A closer look over the initial slopes of the frequency vs. time values also permitted quantifying the concentration-dependent kinetics of the protein-surface interaction, based on the ease to diffuse and attach to the underlying hydrophobic substrate. The resulting slope values from the representative experiment shown in Figure 1 as well as those from its stopped-flow partner (extracted from Figure S1, see Supplementary Materials), are collected in Table 1.
As already explained, the large difference between values is principally caused by the 12-fold higher flow rate (300 vs. 25 µL/min) employed for the chamber filling on the stopped flow experiments. This factor causes that a much larger amount of protein enters the QCMD chamber in very short time, compared to a continuous feeding. Such a 12-fold difference is roughly translated as a 3-fold decrease in the slopes between setups, and the trend is maintained along the full concentration range, with the exception of the lowest amounts of SbpA injected.
Additionally, the analysis of the dissipation results (Figure 1, bottom) can be tackled from a similar concentration-wise perspective as the one used for frequency variations above. Thus, the highest protein concentrations employed allowed for the observation of the characteristic transition peak which sets the sudden shift towards a more elastic film, after the quite steep initial increase of the viscous properties (∆D) as the first SbpA proteins attached [19,24]. Because of the slow feeding, the usual sharp peak appeared in the shape of a broad shoulder instead. Such a transition towards decreasing values of ΔD (higher elastic component) has been previously explained as the clear indication of a gradual structural rearrangement (re-orientation) of already deposited SbpA units, with the help of divalent cations, to build the crystalline domains featuring S-layers [19]. Such a behavior is observed for SbpA solutions between 100 and 10 µg/mL but does not apply when moving to concentrations further below. Again, injection of the 5 µg/mL solution seemed not to supply enough protein in order to cover the S-layer formation, despite the continuous pumping. The constant growth in ΔD for this low concentration stays closer to what usually obtained for amorphous protein film formations [25].
Another approach based on the QCMD results for the follow-up of the assembly process would be the so-called Df (ΔD vs. Δf) plots. By means of these, the mass-dependent elasticity variation of the film is depicted, the time elapsed being an intrinsic parameter, as shown in Figure 2 for the entire range of concentrations applied.
Attending to the color map in the figure, one can rather easily observe how fast the SbpA assembly proceeds. For a better interpretation of these results, colored arrows on top highlight the respective position in terms of D and f after 10, 20, and 30 min of incubation. This time range (30 min) comprises the window in which the largest extension of the process is usually occurring. In these first steps, the simultaneous frequency and dissipation variation follows a clear linear trend as the coating gets formed. The relative values of such first D vs. f slopes provide a quantitative method to evaluate the film formation for each of the systems under study. Hence, concentrations ≥10 µg/mL present almost identical slopes (0.065, 0.059, and 0.060), while for 5 µg/mL SbpA this value raises up to 0.096. According to this result, in those cases where S-layer formation is observed to be successfully completed, the path followed is similar and independent from the starting concentration: the initial protein binding induces a synchronized increase in the viscous component (larger ∆D), until structural rearrangement through orientation of SbpA subunits occurs and then the crystallinity-derived film stiffening takes place. The main difference results from the abovementioned transition peak due to the film shifting towards a more elastic state corresponds in this case to the appearance of a negative Df slope. The stripped boxes in Figure 2 provide an approximate view over such D–f paired values already belonging to that part of the S-layer formation process.
Complementarily to these QCMD studies, AFM imaging of the SbpA self-assembly was performed in situ by means of tapping-mode measurements. The applied measuring conditions were identical to those in which QCMD experiments were performed, so comparative results could be obtained. Micrographs showing the time evolution of the corresponding sample topography under injection of 25, 10, and 5 µg/mL SbpA solutions are collected in Figure 3. Micrographs from assemblies at higher concentrations (100 and 50 µg/mL) are omitted because of their invariance, which is explained by the fast completion of the coating.
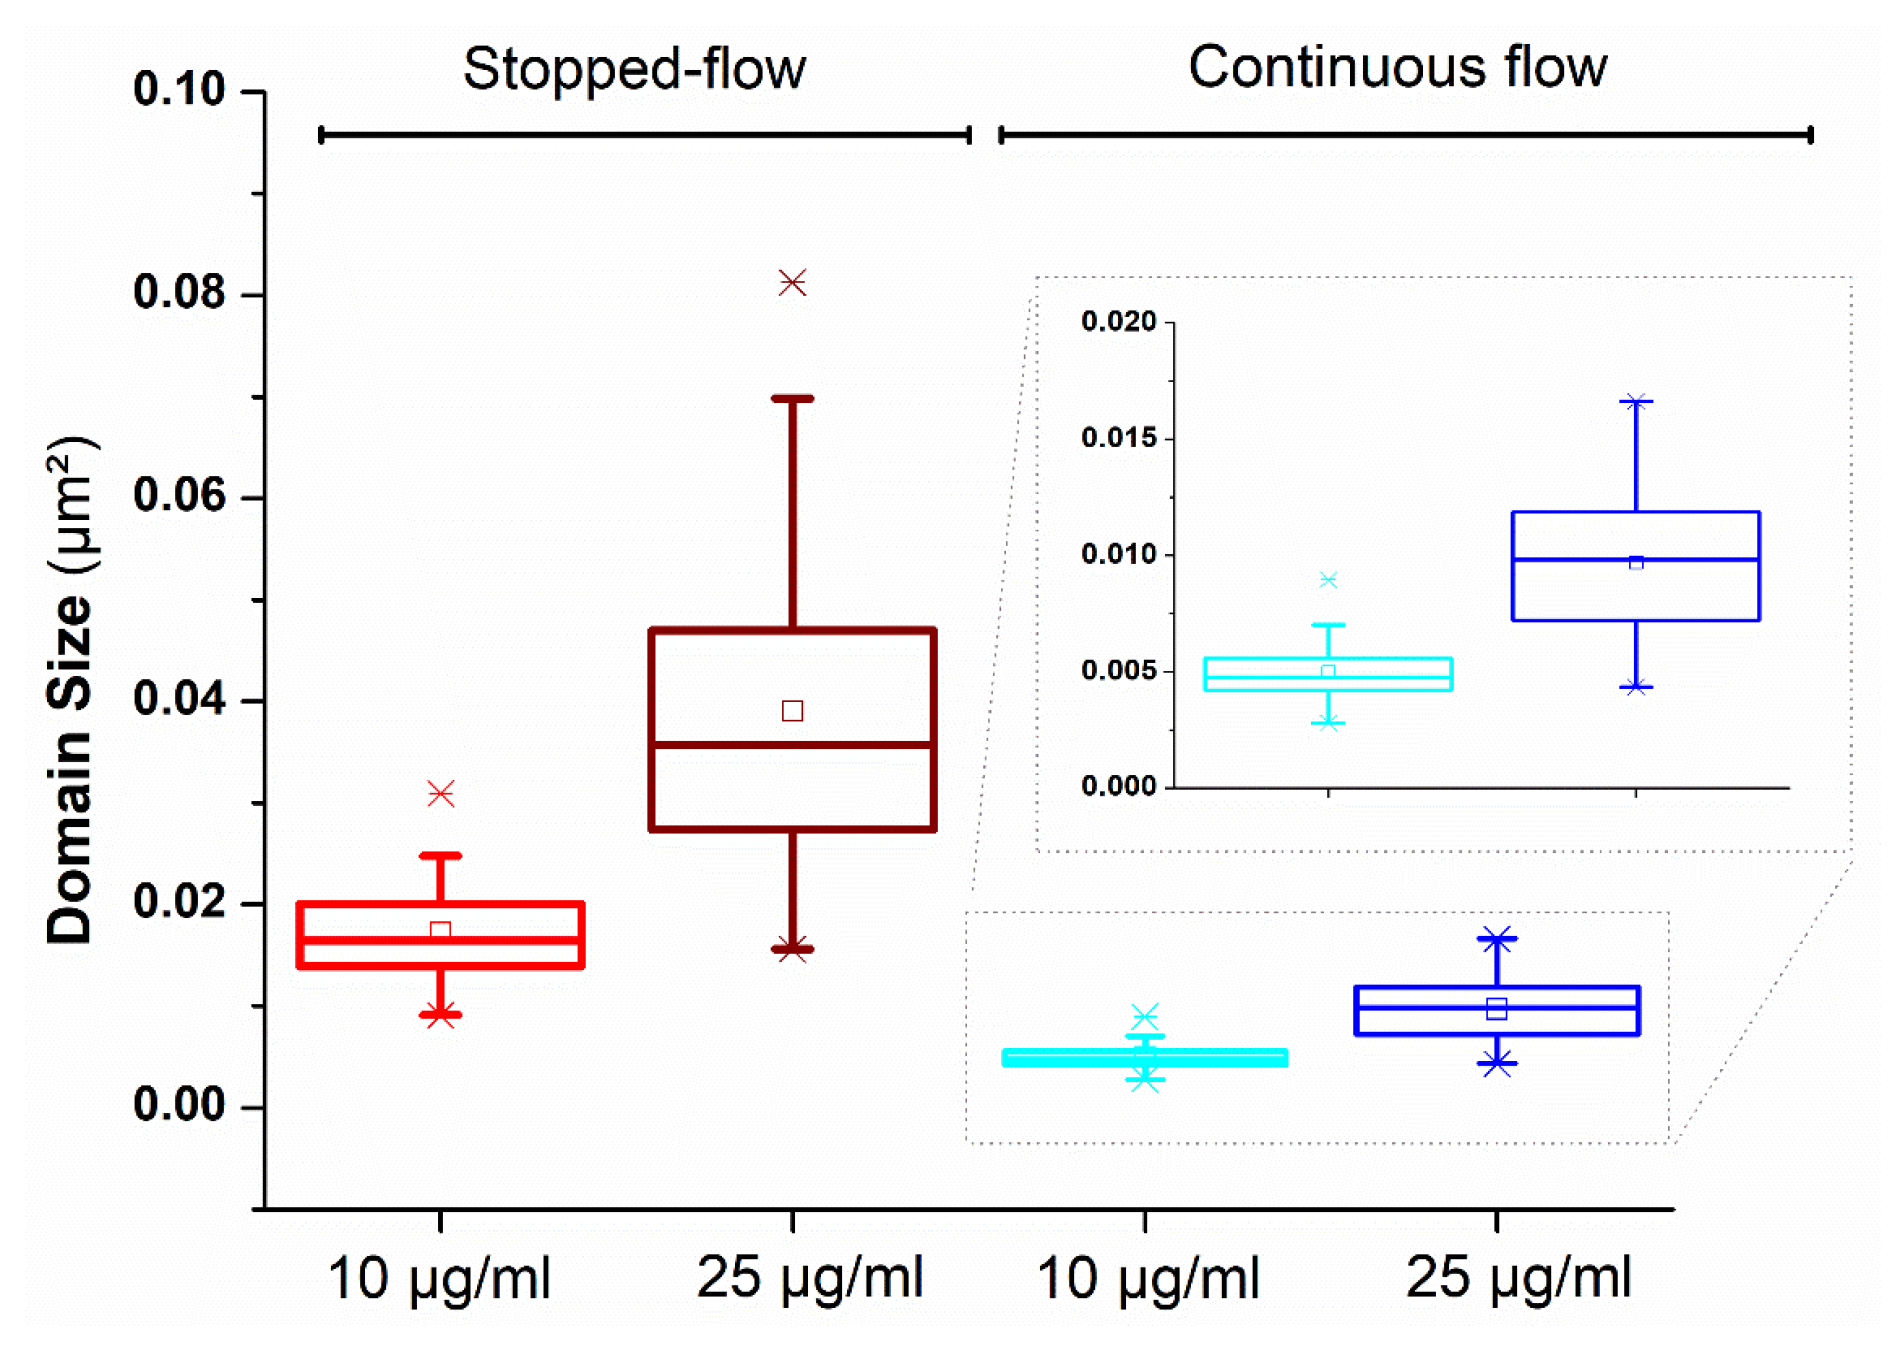
A quick comparison between systems revealed some significant variations: at the shortest incubation time, only the 25 µg/mL sample presented multi-granular adsorption (Figure 3a), which induced the formation of plenty of nucleation points for S-layer assembly as the reaction went by. Indeed, incubation for another 15 min showed full completion of the surface coverage, and only an evolution in the packing of the formed film (Figure 3b–e). Such a trend is almost identically followed by the 10 µg/mL solution of SbpA. However, the main difference is that, if compared with the previous system, the first topography image after 15 min presented only a few spots of bound protein on the substrate (Figure 3f). Then, at t = 30 min, the process already resembles that of its higher concentration homologous, and SbpA protein covers the entire area of interest. Injection of a 5 µg/mL solution of SbpA brought very small adsorption, and only after 120 min (Figure 3n) some aggregates appeared. In order to better appreciate the real difference that employment of a continuous flow induces when compared to stopped-flow conditions, the inset images in Figure 3 show the topographical analysis for same scan areas and identical incubation times. The variation observed for 10 µg/mL samples, where constant protein feeding enables a higher attachment rate and close packing of the layer, is of particular interest. From these insets, the domain dimensions are also shown to be affected by the applied experimental conditions, even in the case of identical concentrations. The full set of statistically calculated S-layer domain sizes is collected in Table 2 and depicted in Figure 4.
From these values, the difference between systems and conditions is quite remarkable. Hence, the large amount of SbpA into the incubation chamber in stopped flow conditions originates from the presence of big domains (up to 4-fold bigger for 25 µg/mL solutions) in comparison to their continuous flow homologues. For a lower SbpA concentration the gap between stopped-flow and continuous flow remains, but to lesser extent (ca. 3-fold). Under continuous protein feeding, it is important to note the variation between domain dimensions, which drops to half for a similar variation in concentration. Also, the shape of the respective boxplot distributions differs, with the probability of finding larger domains for higher SbpA concentrations being higher.
Overall, the role of the experimental conditions applied has been again shown to induce a relevant impact on the assembly and recrystallization of SbpA bacterial protein S-layers. This was already described for factors such as the substrate wettability, substrate active volume, or even other types of divalent cations [19,21,26]. In this case, constant protein feeding allows lowering the protein bulk concentration required to form a homogeneous and well-packed S-layer where the featuring crystallinity can still be present, especially if compared to experiments performed in stopped-flow conditions. Finally, the combined use of QCMD and AFM techniques is confirmed as a very powerful tool to characterize the formation of such films.
Supplementary Materials
The following are available online at https://www.mdpi.com/2079-6412/9/2/76/s1, Figure S1: Representative QCMD experiments monitoring the in situ frequency (top) and dissipation (bottom) factor time evolution at stopped-flow conditions, after a one-shot protein injection (300 µL/min, 90 s). Each color represents the respective SbpA concentrations employed: 0.8, 0.2, 0.08, and 0.04 µM which correspond to 100, 25, 10, and 5 (in µg/mL). Adsorption values from 50 µg/mL SbpA are omitted because of better visualization purposes, since they almost overlap those from 100 µg/mL.
Author Contributions
Conceptualization, J.I. and J.L.T.-H.; methodology, J.I. and A.M.-C.; validation, J.I., A.M.-C. and J.L.T.-H.; formal analysis, J.I.; investigation, J.I. and A.M.-C.; resources, J.L.T.-H.; data curation, J.I.; writing—original draft preparation, J.I.; writing—review and editing, J.I. and J.L.T.-H.; supervision, J.L.T.-H.; project administration, J.L.T.-H.; funding acquisition, J.L.T.-H.
Funding
This work was partially financed by the Austrian Science Fund (FWF) (No. P29562-N28).
Acknowledgments
Authors acknowledge Jacqueline Friedmann for technical support and Andreas Weber for supportive proof-read of the manuscript.
Conflicts of Interest
The authors declare no conflict of interest.
References
- Tjong, S.C.; Chen, H. Nanocrystalline materials and coatings. Mater. Sci. Eng. R Rep. 2004, 45, 1–88. [Google Scholar] [CrossRef] [Green Version]
- Buchan, I.; Ryder, M.R.; Tan, J.C. Micromechanical behavior of polycrystalline metal–organic framework thin films synthesized by electrochemical reaction. Cryst. Growth Des. 2015, 15, 1991–1999. [Google Scholar] [CrossRef]
- Grimberg, A.; Avni, R.; Grill, A. Preparation of polycrystalline silicon coatings from trichlorosilane. Thin Solid Films 1982, 96, 163–167. [Google Scholar] [CrossRef]
- Qiao, C.; Zhao, J.; Jiang, S.; Ji, X.; An, L.; Jiang, B. Crystalline morphology evolution in PCL thin films. J. Polym. Sci. Part B Polym. Phys. 2005, 43, 1303–1309. [Google Scholar] [CrossRef]
- Reddy, H.; Guler, U.; Chaudhuri, K.; Dutta, A.; Kildishev, A.V.; Shalaev, V.M.; Boltasseva, A. Temperature-dependent optical properties of single crystalline and polycrystalline silver thin films. ACS Photonics 2017, 4, 1083–1091. [Google Scholar] [CrossRef]
- Saju, K.K.; Reshmi, R.; Jayadas, N.H.; James, J.; Jayaraj, M.K. Polycrystalline coating of hydroxyapatite on TiAl6V4 implant material grown at lower substrate temperatures by hydrothermal annealing after pulsed laser deposition. Proc. Inst. Mech. Eng. Part H 2009, 223, 1049–1057. [Google Scholar] [CrossRef] [PubMed]
- Schäfer, L.; Fryda, M.; Stolley, T.; Xiang, L.; Klages, C.P. Chemical vapour deposition of polycrystalline diamond films on high-speed steel. Surf. Coat. Technol. 1999, 116–119, 447–451. [Google Scholar] [CrossRef]
- Hamley, I.W. Nanotechnologie mit weichen materialien. Angew. Chem. 2003, 115, 1730–1752. [Google Scholar] [CrossRef]
- McManus, J.J.; Charbonneau, P.; Zaccarelli, E.; Asherie, N. The physics of protein self-assembly. Curr. Opin. Colloid Interface Sci. 2016, 22, 73–79. [Google Scholar] [CrossRef] [Green Version]
- Szilvay, G.R.; Paananen, A.; Laurikainen, K.; Vuorimaa, E.; Lemmetyinen, H.; Peltonen, J.; Linder, M.B. Self-assembled hydrophobin protein films at the air-water interface: Structural analysis and molecular engineering. Biochemistry 2007, 46, 2345–2354. [Google Scholar] [CrossRef]
- Oling, F.; Bergsma-Schutter, W.; Brisson, A. Trimers, dimers of trimers, and trimers of trimers are common building blocks of Annexin A5 two-dimensional crystals. J. Struct. Biol. 2001, 133, 55–63. [Google Scholar] [CrossRef] [PubMed]
- Richter, R.P.; Him, J.L.K.; Tessier, B.; Tessier, C.; Brisson, A.R. On the kinetics of adsorption and two-dimensional self-assembly of Annexin A5 on supported lipid bilayers. Biophys. J. 2005, 89, 3372–3385. [Google Scholar] [CrossRef] [PubMed]
- Sleytr, U.B.; Schuster, B.; Egelseer, E.M.; Pum, D. S-layers: Principles and applications. FEMS Microbiol. Rev. 2014, 38, 823–864. [Google Scholar] [CrossRef] [PubMed]
- Caruso, F.; Möhwald, H. Protein multilayer formation on colloids through a stepwise self-assembly technique. J. Am. Chem. Soc. 1999, 121, 6039–6046. [Google Scholar] [CrossRef]
- Niemeyer, C.M. Nanoparticles, proteins, and nucleic acids: Biotechnology meets materials science. Angew. Chem. Int. Ed. 2001, 40, 4128–4158. [Google Scholar] [CrossRef]
- Iturri, J.; Moreno-Cencerrado, A.; Toca-Herrera, J.L. Cation-chelation and pH induced controlled switching of the non-fouling properties of bacterial crystalline films. Colloids Surf. B 2017, 158, 270–277. [Google Scholar] [CrossRef] [PubMed]
- Moreno-Cencerrado, A.; Iturri, J.; Pecorari, I.; DM Vivanco, M.; Sbaizero, O.; Toca-Herrera, J.L. Investigating cell-substrate and cell-cell interactions by means of single-cell-probe force spectroscopy. Microsc. Res. Tech. 2017, 80, 124–130. [Google Scholar] [CrossRef] [PubMed]
- Moreno-Flores, S.; Küpcü, S. 2D protein arrays induce 3D in vivo-like assemblies of cells. Soft Matter 2015, 11, 1259–1264. [Google Scholar] [CrossRef]
- Iturri, J.; Vianna, A.C.; Moreno-Cencerrado, A.; Pum, D.; Sleytr, U.B.; Toca-Herrera, J.L. Impact of surface wettability on S-layer recrystallization: A real-time characterization by QCMD. Beilstein J. Nanotechnol. 2017, 8, 91–98. [Google Scholar] [CrossRef]
- Lopez, A.E.; Moreno-Flores, S.; Pum, D.; Sleytr, U.B.; Toca-Herrera, J.L. Surface dependence of protein nanocrystal formation. Small 2010, 6, 396–403. [Google Scholar] [CrossRef]
- Iturri, J.; Breitwieser, A.; Pum, D.; Sleytr, U.; Toca-Herrera, J. Electrochemical-QCMD control over S-layer (SbpA) recrystallization with Fe2+ as specific ion for self-assembly induction. Appl. Sci. 2018, 8, 1460. [Google Scholar] [CrossRef]
- Moreno-Cencerrado, A.; Iturri, J.; Toca-Herrera, J.L. In-situ 2D bacterial crystal growth as a function of protein concentration: An atomic force microscopy study. Microsc. Res. Tech. 2018, 81, 1095–1104. [Google Scholar] [CrossRef] [PubMed]
- Stel, B.; Cometto, F.; Rad, B.; De Yoreo, J.J.; Lingenfelder, M. Dynamically resolved self-assembly of S-layer proteins on solid surfaces. Chem. Commun. 2018, 54, 10264–10267. [Google Scholar] [CrossRef] [PubMed]
- López, A.E.; Pum, D.; Sleytr, U.B.; Toca-Herrera, J.L. Influence of surface chemistry and protein concentration on the adsorption rate and S-layer crystal formation. Phys. Chem. Chem. Phys. 2011, 13, 11905–11913. [Google Scholar] [CrossRef] [PubMed]
- Hellstrand, E.; Grey, M.; Ainalem, M.L.; Ankner, J.; Forsyth, V.T.; Fragneto, G.; Haertlein, M.; Dauvergne, M.T.; Nilsson, H.; Brundin, P.; et al. Adsorption of α-synuclein to supported lipid bilayers: Positioning and role of electrostatics. ACS Chem. Neurosci. 2013, 4, 1339–1351. [Google Scholar] [CrossRef] [PubMed]
- Iturri, J.; Moreno-Cencerrado, A.; Toca-Herrera, J.L. Polyelectrolyte brushes as supportive substrate for bacterial S-layer recrystallization: Polymer charge and chain extension factors. Colloids Surf. A 2017, 526, 56–63. [Google Scholar] [CrossRef]
Figure 1.
Representative Quartz Crystal Microbalance with Dissipation (QCMD) experiments monitoring the in situ frequency (top) and dissipation (bottom) factor time evolution. Each color corresponds to the respective SbpA concentrations (in µg/mL) supplied by continuous feeding (25 µL/min).
Figure 1.
Representative Quartz Crystal Microbalance with Dissipation (QCMD) experiments monitoring the in situ frequency (top) and dissipation (bottom) factor time evolution. Each color corresponds to the respective SbpA concentrations (in µg/mL) supplied by continuous feeding (25 µL/min).

Figure 2.
Df plots (∆D vs. ∆f) showing the assembly of SbpA from different concentrations. The color map indicates the time elapsed since protein enters the chamber. Colored arrows point to the values corresponding to 10, 20, and 30 min of incubation. Dashed boxes approximatively highlight the region after the transition peak. Such a region corresponds to negative slopes from the Df plot, due to hardening of the film as more mass is incorporated.
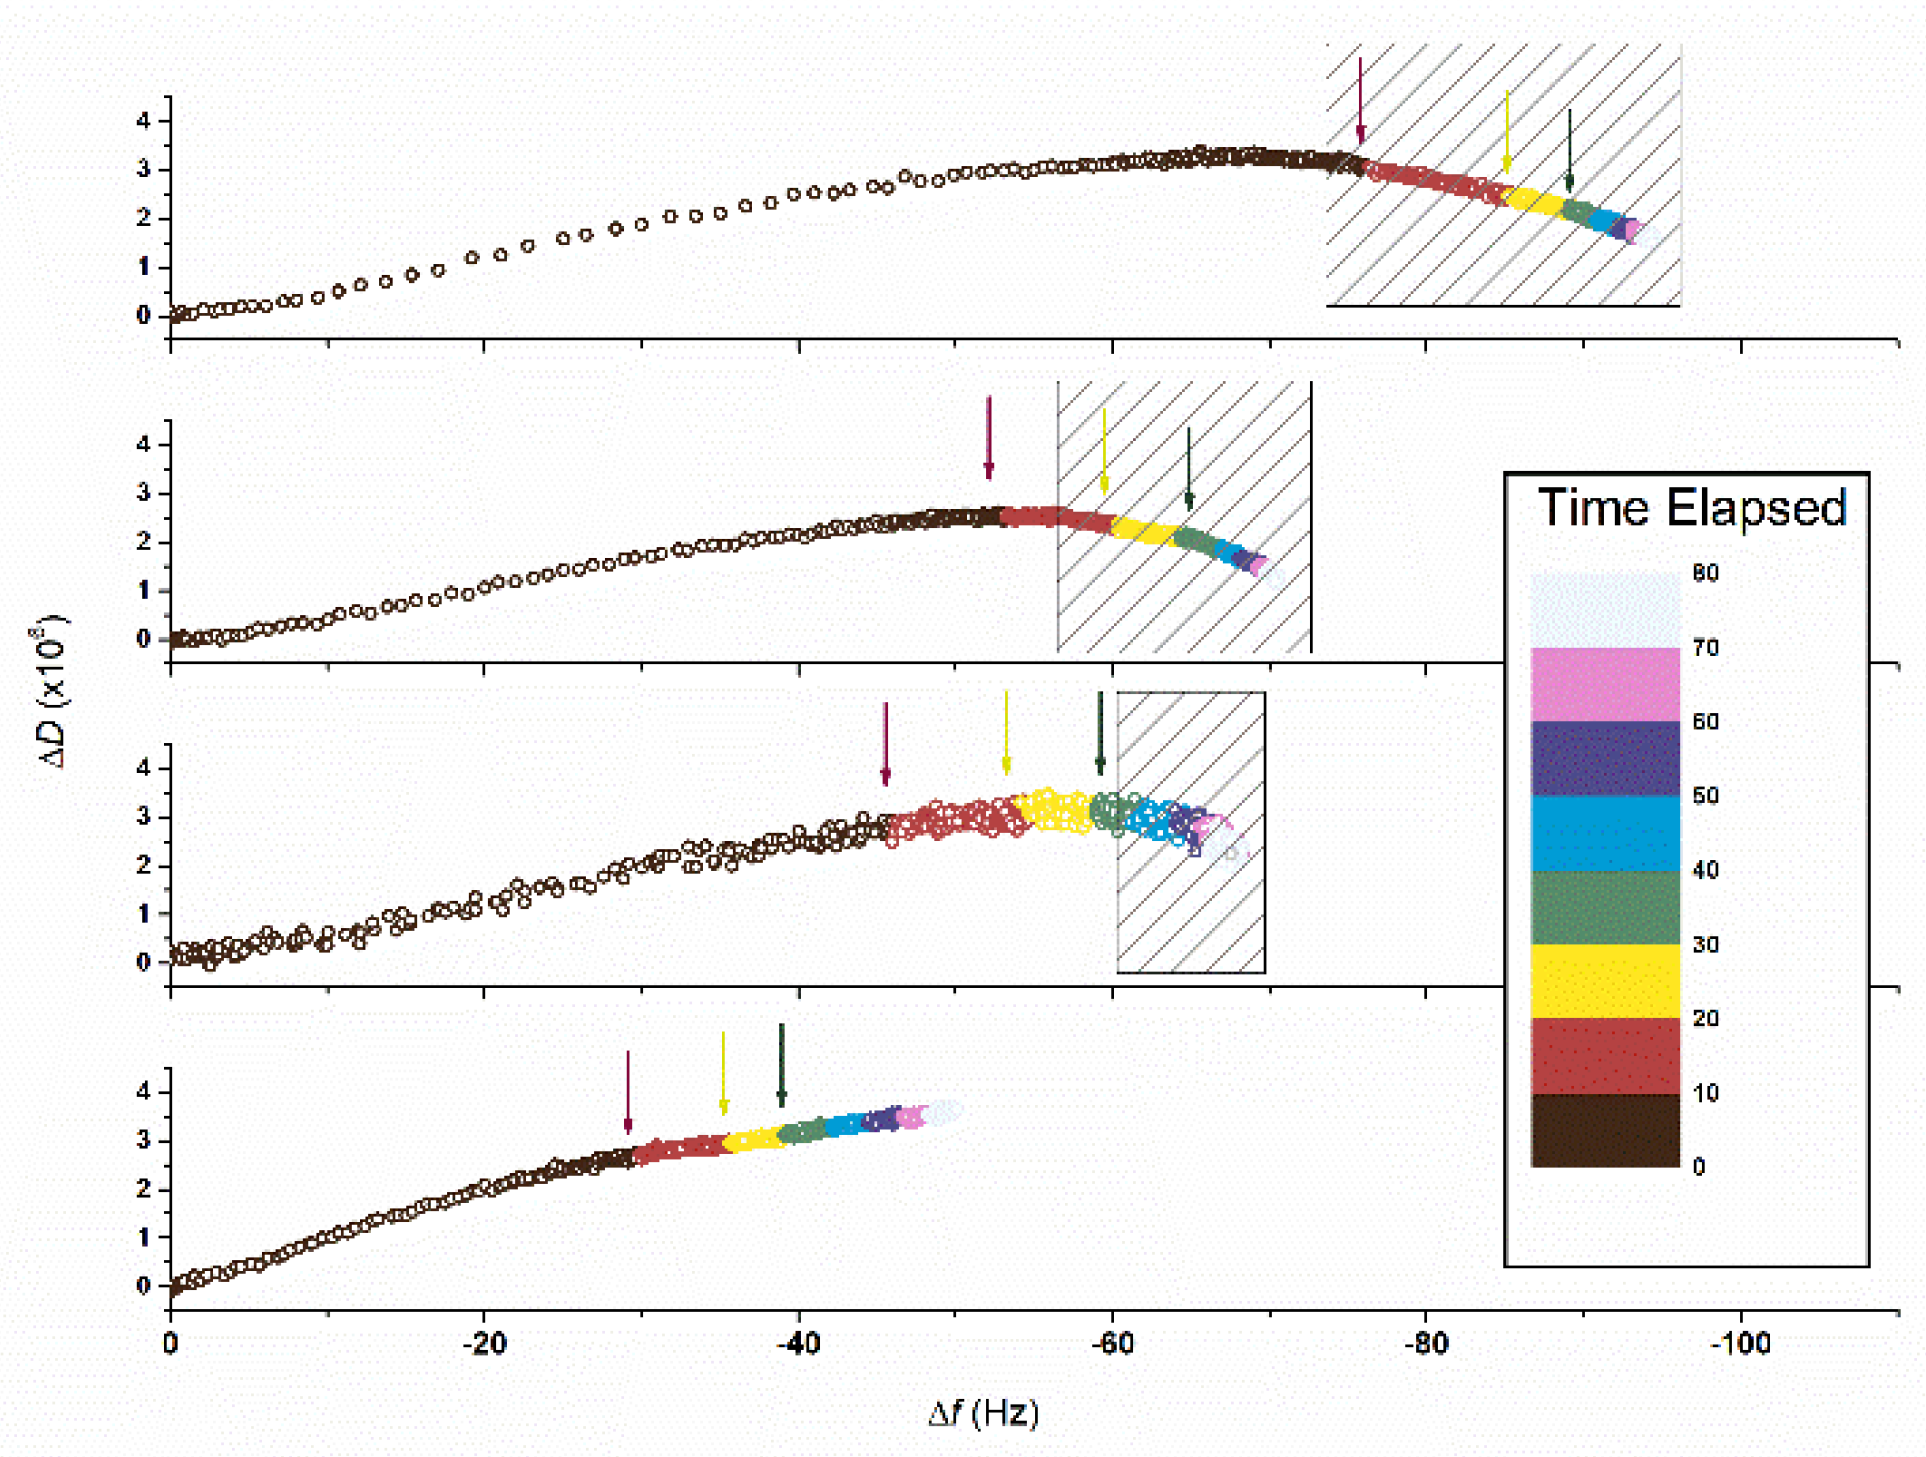
Figure 3.
Atomic Force Microscopy height images for the SbpA S-layer formation from (a–e) 25 µg/mL, (f–j) 10 µg/mL, and (k–o) 5 µg/mL solutions in continuous flow conditions. The sequence reflects (left to right) the film topography observed after 15, 30, 60, 120, and 180 min since SbpA injection begins. Insets show the corresponding image (same time-lapse and measuring scales) when operating under stopped-flow conditions.

Figure 4.
Boxplot showing the SbpA S-layer domain dimension values after an incubation of 30 min. The number of domains considered for the statistical analysis was N = 50. The square (□) in the box plot represents the mean value, the box-splitting horizontal line gives the median, and the upper and lower value are indicative of the achievement of either the 99% or 1% of the population, respectively. Crosses indicate the highest and lowest values measured. The inset on the right magnifies the boxplots from experiments in dynamic flow mode.

Table 1.
Frequency vs. time slope value variation for different concentrations of SbpA and injection methods.
Table 1.
Frequency vs. time slope value variation for different concentrations of SbpA and injection methods.
| SbpA Concentration (µg/mL) | Slope (Hz/min) | |
|---|---|---|
| Stopped-Flow | Continuous Flow | |
| 100 | −150 | −45 |
| 50 | −101 | −35 |
| 25 | −45 | −17 |
| 10 | −16 | −8 |
| 5 | −7 | −5 |
Table 2.
SbpA S-layer mean domain dimension values for 10 and 25 µg/mL concentrations (N = 50) under both stopped-flow and continuous-flow conditions. The error value (SE) corresponds to the Mean Standard Error.
Table 2.
SbpA S-layer mean domain dimension values for 10 and 25 µg/mL concentrations (N = 50) under both stopped-flow and continuous-flow conditions. The error value (SE) corresponds to the Mean Standard Error.
| SbpA (µg/mL) | Stopped-Flow | Continuous Flow | ||
|---|---|---|---|---|
| Size (µm2) | SE | Size (µm2) | SE | |
| 25 | 0.0390 | 7 × 10⁻⁴ | 0.0097 | 4 × 10⁻⁴ |
| 10 | 0.0172 | 2 × 10⁻³ | 0.0049 | 2 × 10⁻⁴ |
© 2019 by the authors. Licensee MDPI, Basel, Switzerland. This article is an open access article distributed under the terms and conditions of the Creative Commons Attribution (CC BY) license (http://creativecommons.org/licenses/by/4.0/).
Share and Cite
MDPI and ACS Style
Iturri, J.; Moreno-Cencerrado, A.; Toca-Herrera, J.L. Life under Continuous Streaming: Recrystallization of Low Concentrations of Bacterial SbpA in Dynamic Flow Conditions. Coatings 2019, 9, 76. https://doi.org/10.3390/coatings9020076
AMA Style
Iturri J, Moreno-Cencerrado A, Toca-Herrera JL. Life under Continuous Streaming: Recrystallization of Low Concentrations of Bacterial SbpA in Dynamic Flow Conditions. Coatings. 2019; 9(2):76. https://doi.org/10.3390/coatings9020076
Chicago/Turabian StyleIturri, Jagoba, Alberto Moreno-Cencerrado, and José Luis Toca-Herrera. 2019. "Life under Continuous Streaming: Recrystallization of Low Concentrations of Bacterial SbpA in Dynamic Flow Conditions" Coatings 9, no. 2: 76. https://doi.org/10.3390/coatings9020076
Note that from the first issue of 2016, this journal uses article numbers instead of page numbers. See further details here.