Article

Development and Regression Modeling of Dirt Resistive Latex Façade Paint

1
Institute of Chemical Engineering & Technology, University of the Punjab, Lahore 54590, Pakistan
2
Department of Chemical Engineering, Muhammad Nawaz Sharif University of Engineering & Technology, Multan 66000, Pakistan
3
Department of Quantitative Methods, University of Management & Technology, Lahore 54770, Pakistan
*
Authors to whom correspondence should be addressed.
Coatings 2019, 9(3), 150; https://doi.org/10.3390/coatings9030150
Submission received: 6 January 2019 / Revised: 14 February 2019 / Accepted: 19 February 2019 / Published: 26 February 2019

Abstract

:
A highly dirt-resistant paint for building façades without chemicals harmful to nature and the environment would resolve the unattractive disfigurement of building walls caused by dirt. The current ranking of Pakistan in terms of air pollution is 139th. A set of dirt-resistant paint formulae was constructed with the aid of computer programming. From this set, the best dirt-resistant paint formula was explored and identified. The final determination of the optimum formulation was based on statistically planned experiments conducted in the laboratory and in a natural environment. In order to achieve high-quality results, the best available laboratory equipment were used. The results obtained were analyzed and conclusions were drawn using appropriate statistical techniques. The procedure started with the selection of appropriate raw materials and generation of a target population of 543,143 paint formulations by adopting Basic Language computer programming. The average pigment volume concentration (PVC) percentage was computed using theory and found to be 54.98% for the target population paint formulations, verifying the literature results. Experimentation and statistical analysis were performed to compare the classical conventional agitator with the latest lab equipment such as a nano mill, and it was concluded that the nano mill performs better on average than the conventional agitator in the preparation of paint formulations. Hence, the sample of paint formulations was prepared on a nano mill and tested in the laboratory using advanced available technology for the analysis and comparison of paint properties to determine the best paint formulation. The results were analyzed using the Analysis of Variance (ANOVA) technique, and it was concluded that the newly developed paint has the highest dirt resistance on average. The final selected formula, No. 50 (the newly developed paint), was compared with the three best conventional paints available in the Pakistan market in a natural environment for a period of almost one year. A regression model was also constructed to study the effect of environmental factors like time, temperature, and humidity on the dirt resistance of paints. It was found that the newly developed paint formulation is the most environmentally friendly. It performs equally well as one conventional paint and has higher dirt resistance than two other conventional paint formulations containing harmful chemicals. The regression model of dirt resistance involving variables including time, temperature, and humidity shows that these factors significantly affect the dirt resistance of a given paint at a 5% level of significance. For a given paint, 95.34% of the variation in the dirt resistance is due to and explained by the given factors. The regression model is useful for predicting the average dirt resistance of a given paint with a certain level of confidence. The project exemplifies the work of applied research from conceptualization to successful commercialization in the paint industry.

1. Introduction

Paint is a liquid which spreads over a substrate in the form of thin layer and transforms into a solid adherent film [1]. Paint comprises many constituents including solvent, pigment, filler, additives, and binder. An important issue in today’s paint industry is to develop paint with dirt resistance properties. Dirt resistance has important applications in high-rise buildings where maintenance is not an easy task. The life of paint could be increased by improving dirt resistance [2]. Dirt is responsible for the growth of algae on surfaces [3]. Dirt present on façades’ painted surfaces promotes microorganism growth by providing them nutrients and proves helpful for fungal growth [4]. Airborne yeast, fungi, and algae spores find nutrients in the dirt adhering to façade paint. Spores multiply and form unsightly colonies [5]. An estimated loss of about one million dollars per year has been recorded caused by the deterioration of façade painted surfaces due to colonies [6].
Environmental pollutants have a negative impact on human health and may cause different diseases like cancer, neuron disorders, immune system malfunctioning, hormonal disorders, etc. [7]. There are severe threats to human life due to environmental pollution and weather changes [8]. Environmental stresses are increasing with industrial development because of air pollution. It is very essential to control pollution sources for a healthy and clean world [9].
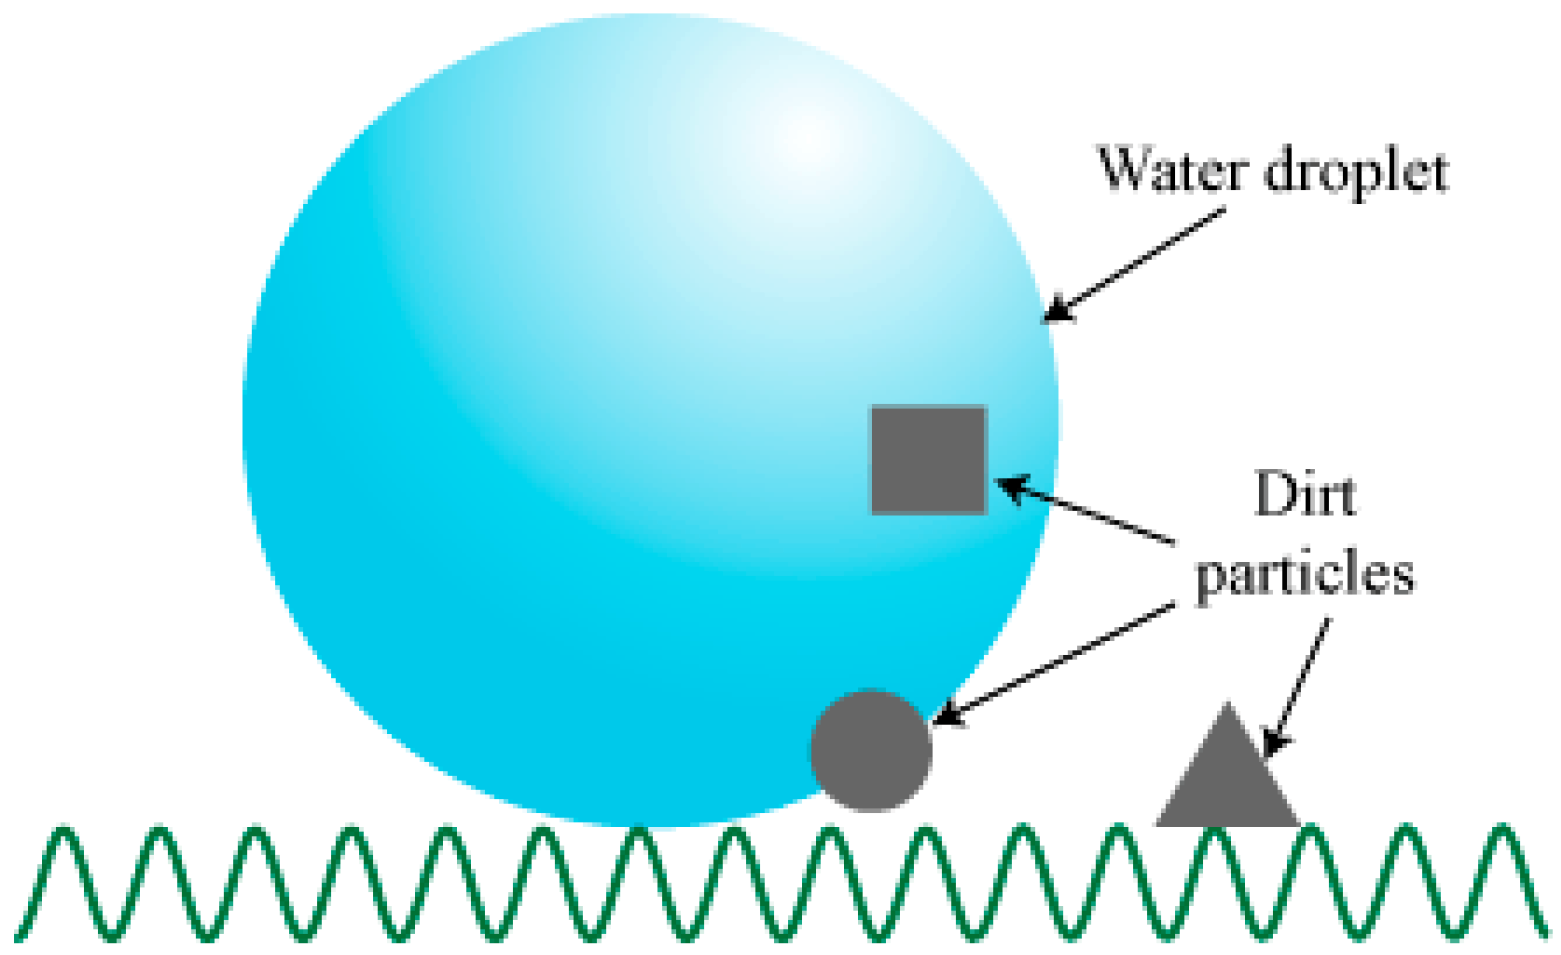
It has been observed that a waxy material present on leaves helps them to resist the penetration of dirt. If the surface of the paint film could be made similar to the surface of leaves then the chances of penetration of dirt particles would be less. Paints having a self-cleaning mechanism could keep the paint clean and dry. Figure 1 shows that the frictional force and interaction between water droplets and the surface of a paint film could be reduced by the flow of water droplets over the dirt particles, thus leaving a clean surface [10,11]. The deposition of dirt on a latex façade paint film also causes a color change of the paint film [12]. Dirt deposited on the surface of the paint is also a source of food for oligotrophic fungi over the surface of the paint [13,14,15,16,17,18,19].
The glass transition temperature (Tg) of the binder and the pigment volume concentration (PVC) play a vital role in improving dirt resistance in the paint film. It has been observed that the dirt resistance is significant for paints that are formulated using polymers with higher Tg. If the Tg of acrylics is the same then styrene-acrylic-based latex paints offer more dirt resistance compared to acrylic-based latex paints [20]. Dirt resistance also increases in the case of cross-linked binders [21].
Another effect of dirt over the surface of latex façade paint film is a decrease in reflection coefficient, solar heat reflectance, and temperature reduction performance in the case of cool white coatings. The reflection coefficient represents the quantity of electromagnetic wave reflection by a medium [22]. Solar heat reflectance explains the medium’s capability to reflect different sun wavelengths, which lowers the temperature of the painted surfaces [23]. It has also been observed that zinc oxide (ZnO) nanoparticles are efficient in the prevention of dirt accumulation over the surface of the paint [24].
It is internationally agreed that nanotechnology is a big revolution in production. Nanomaterials at present are being used in electronics and cosmetics. Many other sectors, for example, polymeric composite materials, are carrying out a lot of scientific and technological works and there are also plans for a wide range of projects using nanomaterials [25]. The promotion of nanostructured coatings has caught tremendous attention and interest [26,27]. All this is because of the unique properties that are at hand, offering possibilities of multifunctionality, reduction of thickness, and a great spectrum of applications relating technology [28,29].
However, recent works on nanoparticles introduced in thin layers showcase the potential risks of nanoparticle release and allow a more balanced benefit/risk analysis. For example, many studies highlight nanoparticle emissions from coatings, paints and tiles [30,31]. Cases of nanoparticle exposure in the field of occupational hygiene at coating production sites have been reported [32].
Many studies are being carried out internationally, keeping in view the hazards associated with the environment [33,34]. Studies are also being done with regards to nanoparticles present in the environment and instructions are being given regarding nano waste. Potential consumers are being made aware of the hazards of nanomaterials. Technology and industries play an effective role in this regard [35,36].
With the passage of time, atmospheric phenomena including humidity and temperature are major sources of dirt on façade paints. Multiple linear regression modeling is an appropriate technique to study the impact of two or more independent variables on a dependent variable [37]. In the present work, time (number of days), humidity, and temperature have been taken as the independent variables. The impact of these independent variables has been studied on the dirt collection index (Dc) taken as the dependent variable. Dc indicates the tendency of a surface to resist the accumulation of dirt. As such, Dc reveals average dirt resistance.
The current ranking of Pakistan in terms of air pollution is 139th [38]. The cadmium concentrations found in dust in Islamabad, the capital city of Pakistan, are 4.5–6.8 mg/kg, which is higher than those of many cities around the world [39,40,41]. Copper is present at levels from <6 to 412 mg/kg in dust in Pakistan and zinc is present at from >0.1 to 1193 mg/kg [42,43]. There is a high lead quantity found in the blood of 80% of the children of Karachi, Pakistan because of lead in the dusty air [44].
The present study comprises developing a new paint that could offer dirt resistance. In this work, different raw materials related to dirt resistance are suggested, including an advanced process of paint manufacturing. Dirt-resistive paint is developed and statistically modeled. The present study focuses on developing an environmentally friendly paint which may have the least negative impact on human health due to its dirt resistance.

2. Application of Visual Basic Programming for Generating a Target Population of Paints

In this section the procedure adopted for generating the population of paint formulae and selection of the random sample is discussed.

2.1. Selection of Experimental Materials

Detailed research was done to select appropriate raw materials with a view to the development of dirt- and algae-resistant façade paint without using algaecides. The experimental work comprised the selection of appropriate raw materials to develop paint formulae which are dirt and algae resistant. After appropriate raw material selection, the ranges of percentage use levels of all the raw materials were determined from the literature, as shown in Table 1.

2.2. Selection of Raw Material Groups

On the basis of these ranges, a countable infinite number of paint formulae were generated by Visual Basic (VB) programming. However, the target population was taken from them by following the procedure discussed below.
These ranges were divided into three equal groups, i.e., the lowest percentage range group, the middle range group, and the uppermost range group. These groups were named Groups 1, 2, and 3, respectively, as shown in Table 2.
The program of paint formulations in Visual Basic (VB) was based on the following steps. The ranges of raw materials as per the literature were taken with an interval of 0.001% going from minimum to maximum. This led to 20,001 values of H, 21,001 values of A, 5001 values of B, 10,001 values of AC and RC, 2201 values of D, 401 values of G, 10,001 values of I, 19,001 values of K, 901 values of E, 3001 values of J, and 501 values of F. The tables of these ranges consist of over 700 pages stored in an EXCEL sheet, out of which ten formulae are shown in Table 3.
One value from each group was selected randomly so that there were three different rows and twelve different columns corresponding to the twelve raw materials, as shown in Table 4.

2.3. Generation of the Paint Formulae Population

On the basis of Table 4, the population count consisting of the total possible number of formulae generated by VB programming was 312 = 531,441. As there were 531,441 formulations generated encompassing more than 20,000 sheets/pages on excel programming, ten paint formulae are shown in Table 5 as an illustration of the concept.

2.4. Computation of the Average PVC% for the Population

Before computing the average PVC% for the population, the adjustments were made as per the following formula in every raw material to get a total of 100 in each formula, as shown in Table 6.
(value of a raw material)/(total sum of a particular formula) × 100
The PVC% of a system is defined as the volume percentage of solid particles in the system after film formation:
PVC % = V p + V f V p + V f + V b × 100 %
where Vp = total volume of all pigments in the system; Vf = total volume of all fillers in the system; Vb = volume of the non-volatile part of the binders in the system.
Considering these 531,441 paint formulations as a population, the PVC% and mean PVC% values were computed using the formula given above. The average PVC% for the population was computed as 54.98%.

2.5. Preparation of Sample Paint In a Nano Mill and an Agitator Mill

In order to compare the processing mills, a sample of paint formulation was prepared in nano and agitator mills simultaneously. As an example, the preparation procedure for one formula is given below.

2.5.1. Procedure for the Nano Mill

In the nano mill, the pneumatic pump pressure was adjusted between 0.2 and 0.4 MPa. H, D, and G were placed in the agitated tank of the nano mill mixer and the revolutions per minute (RPM) was adjusted to 500 rpm. A, B, AC, and RC were added into the tank under constant agitation. The dispersion was continued for 5 min at 1000 rpm. The whole material was then shifted to the nano mill grinding chamber which was operated at 2500 rpm. The output of the nano mill was fed to the nano mill mixer, where the remaining raw materials (I, K, E, J, and F) were added successfully under agitation. The whole material was mixed for 5 min at 500 rpm.

2.5.2. Procedure for the Conventional Agitator Mill

In the conventional agitator mill, the process was started by placing H, D, and G in the agitated tank and adjusting the revolutions per minute (RPM) to 500 rpm. A, B, AC, and RC were added into the tank. Dispersion was continued for 15 min at 1400 rpm. The remaining raw materials (I, K, E, J, and F) were added successfully under agitation at 700 rpm. The whole material was mixed for 5 min.

2.6. Selection of Paint Samples for Comparison of Processing Mills

In order to determine the best processing mill, three paint samples were randomly selected and prepared 5 times on each of the two available mills as per the procedure described above. Paints were applied on panel cards to test their gloss using a Tri-Glossmaster, Sheen, London, UK, and their particle size using a Malvern Mastersizer, Malvern Instruments Ltd., Worcestershire, UK.
The results were analyzed using SPSS 22 [52] and are given in Table 7 and Table 8.
The following research hypotheses were to be tested:
  • Research hypothesis 1: The average gloss of a given paint is higher when prepared in a nano mill than when prepared in a conventional agitator mill.
  • Research hypothesis 2: The average particle size of a given paint is higher when prepared in a conventional agitator mill than when prepared in a nano mill.
Referring to Table 7, the results based on 10,000 bootstrap samples gave a p-value less than 0.05. Hence, it was concluded that the average gloss of paint is higher for those prepared in a nano mill than for those prepared in a conventional agitator mill at a 5% level of significance. There is 95% confidence that the mean gloss for nano mill paints is higher by at least 20.85 and at most 28.88 than the mean gloss for conventional agitator mill paints.
Referring to Table 8, the results based on 10,000 bootstrap samples gave a p-value less than 0.05. Hence, it was concluded that the average particle size of paint is smaller for paints prepared in a nano mill than for those prepared in a conventional agitator mill at the 5% level of significance. There is 95% confidence that the minimum particle size resulting from a conventional agitator mill exceeds by 2.32 that from a nano mill and that the maximum particle size resulting from a conventional agitator mill exceeds by 6.38 that from a nano mill.
On the basis of the above discussion, it was concluded that the nano mill outperforms the conventional agitator in the preparation of latex façade paint.

2.7. Lab Experimentation and Statistical Analysis to Determine Highly Dirt-Resistant Paint

In order to determine a highly dirt-resistant paint from the target population, due to certain constraints including cost, time, and resources available, a sample of 70 paint formulations (coded Formula 1 to Formula 70) was selected randomly from the given population of 531,441. These paints were prepared in a nano mill to compare the mean Dc values among the paint formulae population. Dirt collective index values (Dc values) were taken according to ASTM D-3719 [53]. The one-way Analysis of Variance (ANOVA) technique was used to compare the differences among the 70 sample paint formulations with respect to average Dc values, as shown in Table 9.
Since the p-value was less than 0.05, it was concluded that there was a significant difference among the population of paints with respect to mean Dc values at a 5% level of significance, and a hypothesis of equal Dc value means was rejected. In other words, the sample evidence supports the claim that there is a difference between at least two of the paint formulations in the population of paint formulae with respect to average dirt collective index values. Tukey’s test was used for the evaluation of significant differences among the mean Dc values.
It was concluded that the mean Dc value of paint formula No. 50 (referred to as the newly developed paint) was significantly the highest among those of all paint formulae. It had an estimated mean Dc value of 95.07. There is 95% confidence that the highest mean Dc value for the population of paint formulae lies in the interval (94.096, 97.345). The paint formulation (Formula 50) with the highest Dc value is given in Table 10.
This formula was then compared under natural weather conditions with the three best conventional paints available in the market in Pakistan.

3. Comparison of the Newly Developed Paint with Conventional Paints under Natural Atmospheric Conditions

Four slabs were painted with the newly developed paint and conventional paints. The slabs were placed in an open area where they were exposed to sunlight and a humid environment. The slabs were placed in external conditions for about one and a half years. Dc readings were taken according to ASTM D-3719 [53] at least every 10 days along with temperature and humidity (Pakistan Meteorological Department).

3.1. Results

The data generated on the newly developed paint and three conventional paints as per the experimentation described above were analyzed using SPSS 22 and Minitab-V-17 [54] and are discussed below. The following notation was used for analysis purposes.
Y= Dirt Collection Index, Dc
X1= Number of days
X2= Temperature, °C
X3= Humidity, %
X4= 1, Newly developed paint (NDP); = 0, other paint
X5= 1, Conventional paint A (CPA); = 0, other paint
X6= 1, Conventional paint B (CPB); = 0, other paint
In the multiple regression model, Y was taken to be the dependent variable while X1, X2, X3, X4, X5, and X6 were taken to be the independent variables.
The results are given below in Table 11, Table 12 and Table 13.

3.2. Conclusions

Referring to Table 11, Table 12 and Table 13, it was concluded that for the newly developed paint, the regression model of Dc values with relation to humidity, temperature, and time is significant at a 5% level of significance. The fitted regression model for the newly developed paint is given by
Y = 96.581 − 0.018463X1 + 0.0613X2 + 0.00867X3
The regression model given by Equation (3) was used to predict the average dirt resistance of the newly developed paint for given number of days, temperature, and humidity level.
The regression coefficients for dummy variables indicate the mean Dc values for the given paint types. For instance, the average Dc value of the newly developed paint is 1.005 units more than those of conventional paints.
The regression coefficients for X1, X2, and X3 indicate the average rates of change of the Dc value due to a unit change in the respective variable. For instance, there is a decrease of 0.1846 units in the average Dc value of a given paint after every 10 days. An increase of 10 °C in temperature increases the Dc value of a given paint by 0.613 units. An increase in 10 units of the humidity level increases the Dc value of the paint by 0.0867; however, this change is statistically insignificant.
Referring to Table 12, the adjusted R2 value (R2 (adj)) indicates the variation in the dependent variable explained by the fitted model for the population. It was concluded that 91.83% of the variation in the Dc value is due to the factors temperature, humidity, and number of days. In other words, the aforementioned atmospheric conditions significantly affect the dirt resistance of a given paint by 91.83%.
In this research, various innovative objectives were targeted and achieved in the context of façade paints. A target population of 513,441 paint formulae was actually generated by using theoretical references and the Visual Basic language. The mean PVC% was determined as 54.98% for the target population, verifying the literature reference [55] in this context. Experimentation to assess the performance of processing mills yielded the nano mill as the best processing mill for paint preparation.
By using random sampling, 70 sample paint formulations were selected for the comparison of paint formulae with the aim of high dirt resistance compared to the average. This yielded a highly dirt-resistant paint, referred to as the newly developed paint, with a true estimate of population mean Dc value as 95.07.
Lab experimentation was conducted again by incorporating statistical theory to compare the newly developed paint with conventional paint samples. The results were statistically analyzed, and it was concluded that the newly developed paint performed better on average than the conventional paints with respect to its dirt resistance properties.
A regression model for the newly developed paint was also developed to study and predict the average Dc value for any given level of temperature and humidity and for a certain time period. It was found that the fitted regression model based on atmospheric and time factors significantly explained the change in the Dc value of a given paint for the population of paints. This model for the newly developed paint is also useful for predicting the average Dc value of the newly developed paint for any given level of temperature and humidity and for a certain time period.

Author Contributions

Conceptualization, S.A.Q.; Methodology, S.A.Q., A.S. and A.I.; Software, S.A.Q. and M.M.B.; Validation, S.A.Q. and M.M.B.; Formal Analysis, S.A.Q. and M.M.B.; Investigation, S.A.Q. and M.M.B.; Resources, S.A.Q. and M.M.B.; Data Curation, S.A.Q. and M.M.B.; Writing—Original Draft Preparation, S.A.Q., A.S. and A.I.; Writing—Review and Editing, S.A.Q., A.S., A.I. and M.M.B.; Visualization, S.A.Q. and M.M.B.; Supervision, A.S., A.I. and M.M.B.; Project Administration, S.A.Q., A.S., A.I. and M.M.B.

Funding

This research received no external funding.

Acknowledgments

The support from Brighto Paints Private Limited Pakistan to conduct this research work is gratefully acknowledged.

Conflicts of Interest

The authors declare no conflict of interest.

Notation

AMagnesium silicate
BZinc oxide
ACAnatase titanium dioxide
RCRutile titanium dioxide
DDispersant
EHydrophobically modified alkali swellable emulsion
FMineral hydrocarbons and silicone-based surfactant
G2-amino-2-methyl-1-propanol
HReverse osmosis water
IStyrene acrylic
JPropylene glycol
KPolysiloxane emulsion
DFDegree of freedom
Adj SSAdjusted sum of squares
Adj MSAdjusted mean square
CoefCoefficient
SE CoefStandard error of coefficient
VIFVariance inflation factor

References

  1. Morgans, W.M. Outlines of Paint Technology, 3rd ed.; Griffin: London, UK, 1990. [Google Scholar]
  2. Vandezande, G. Improved dirt pickup resistance critical to future coating innovation. PCI, 1 May 2008. [Google Scholar]
  3. Wee, Y.C. Airborne algae around Singapore. Int. Biodeterior. Bull. 1982, 18, 1–5. [Google Scholar]
  4. Murtoniemi, T.; Hirvonen, M.R.; Nevalainen, A.; Suutari, M. The relation between growth of four microbes on six different plasterboards and biological activity of spores. Indoor Air 2003, 13, 65–73. [Google Scholar] [CrossRef] [PubMed]
  5. Turner, J.B. Introduction to Paint Chemistry and Principle of Paint Technology, 4th ed.; Chapman & Hall: London, UK, 1998. [Google Scholar]
  6. Winters, H. Latex paints. In Economic Microbiology. Microbial Biodeterioration; Rose, A.H., Ed.; Academic Press: Oxford, UK, 1981; Volume 6, pp. 307–321. [Google Scholar]
  7. Sanchez, W. Health and environmental risks associated with emerging pollutants and novel green processes. Environ. Sci. Pollut. Res. 2018, 25, 6085–6086. [Google Scholar] [CrossRef] [PubMed] [Green Version]
  8. Rene, E.R.; Shu, L.; Lens, P.N.; Jegatheesan, J.V. Tools, techniques, and technologies for pollution prevention, control, and resource recovery. Environ. Sci. Pollut. Res. 2018, 25, 5047–5050. [Google Scholar] [CrossRef] [Green Version]
  9. Nakano, T.; Shibata, Y.; Denison, M.; Weber, R. ESPR special issue on Asian environmental chemistry. Environ. Sci. Pollut. Res. 2018, 25, 7099–7100. [Google Scholar] [CrossRef] [PubMed] [Green Version]
  10. Department of Physics, The Chinese University of Hong Kong. Available online: http://www.hk-phy.org/atomic_world/lotus/lotus01_e.html (accessed on 24 February 2019).
  11. Barthlott, W.; Neinhuis, C. Purity of the sacred lotus, or escape from contamination in biological surfaces. Planta 1996, 202, 1–8. [Google Scholar] [CrossRef]
  12. Kitsutaka, K. Formula for the discoloration of external building materials. Durab. Build. Mater. Compon. 1993, 6, 707–714. [Google Scholar]
  13. Grant, C.; Hunter, C.A.; Flannigan, B.; Bravery, A.F. The moisture requirements of moulds isolated from domestic dwellings. Int. Biodeterior. 1989, 25, 259–284. [Google Scholar] [CrossRef]
  14. Ezeonu, I.M.; Noble, J.A.; Simmons, R.B.; Price, D.L.; Crow, S.A.; Ahearn, D.G. Effect of relative humidity on fungal colonization of fiberglass insulation. Appl. Environ. Microbiol. 1994, 60, 2149–2151. [Google Scholar] [PubMed]
  15. Viitanen, H. Factors affecting the development of biodeterioration in wooden constructions. Mater. Struct. 1994, 27, 483–493. [Google Scholar] [CrossRef]
  16. Chang, J.C.S.; Foarde, K.K.; Vanosdell, D.W. Growth evaluation of fungi (Penicillium and Aspergillus Spp.) on ceiling tiles. Atmos. Environ. 1995, 29, 2331–2337. [Google Scholar] [CrossRef]
  17. Chang, J.C.S.; Foarde, K.K.; Vanosdell, D.W. Assessment of fungal (Penicillium chrysogenum) growth on three HVAC duct materials. Environ. Int. 1996, 22, 425–431. [Google Scholar] [CrossRef]
  18. Flannigan, B.; Morey, P.R. Control of moisture problems affecting biological indoor air quality. In ISIAQ-Guideline. Task Force I; International Society of indoor Air Quality and Climate: Ottawa, ON, Canada, 1996. [Google Scholar]
  19. Foarde, K.K.; Vanosdell, D.W.; Chang, J.C.S. Evaluation of fungal growth on fiberglass duct materials for various moisture, soil, use, and temperature conditions. Indoor Air 1996, 6, 83–92. [Google Scholar] [CrossRef]
  20. Baumstark, R.; Costa, C.; Schwartz, M. Comparative studies of acrylic paints. Surf. Coat. Int. Part A Coat. J. 2004, 87, 218–225. [Google Scholar]
  21. Wicks, Z.W., Jr.; Jones, F.N.; Papas, S.P.; Wicks, D.A. Organic Coatings: Science and Technology, 3rd ed.; Wiley: Hoboken, NJ, USA, 2007. [Google Scholar]
  22. Reflection Coefficient. Available online: https://en.wikipedia.org/wiki/Reflection_coefficient (accessed on 20 February 2019).
  23. Reflective Surfaces (Climate Engineering). Available online: https://en.wikipedia.org/wiki/Reflective_surfaces_(climate_engineering) (accessed on 20 February 2019).
  24. Roach, P.; Shirtcliffe, N.J.; Newton, M. Progress in superhydrophobic surface development. Soft Matter 2008, 224–240. [Google Scholar] [CrossRef]
  25. Klaus, F.; Stoyko, F.; Zhong, Z. Polymer Composites from Nano to Macro-Scale; Springer: New York, NY, USA, 2005. [Google Scholar]
  26. Morgeneyer, M.; Shandilya, N.; Chen, Y.M.; Bihan, O. Use of a modified taber abrasion apparatus for investigating the complete stress state during abrasion and in-process wear particle aerosol generation. Chem. Eng. Res. Des. 2015, 93, 251–256. [Google Scholar] [CrossRef]
  27. Gohler, D.; Stintz, M.; Hillemann, L.; Vorbau, M. Characterization of nanoparticle release from surface coatings by the simulation of a sanding process. Ann. Occup. Hyg. 2010, 54, 615–624. [Google Scholar] [CrossRef] [PubMed]
  28. Saji, V.S. The impact of nanotechnology on reducing corrosion cost, corrosion protection and control using nanomaterials. In Woodhead Publishing Series in Metals and Surface Engineering; Elsevier: Philadelphia, PA, USA, 2012; pp. 3–15. [Google Scholar] [CrossRef]
  29. Abdel, S.H.M.; Tiginyanu, I. Nanocoatings and Ultra-Thin Films: Technologies and Applications; Woodhead Publishing: Cambridge, UK, 2011. [Google Scholar]
  30. Morgeneyer, M.; Aguerre-Chariol, O.; Bressot, C. Stem imaging to characterize nanoparticle emissions and help to design nanosafer paints. Chem. Eng. Res. Des. 2018, 136, 663–674. [Google Scholar] [CrossRef]
  31. Bressot, C.; Aubry, A.; Pagnoux, C.; Chariol, A.O.; Morgeneyer, M. Assessment of functional nanomaterials in medical applications: Can time mend public and occupational health risks related to the products’ fate? J. Toxicol. Environ. Health Part A 2018, 81, 957–973. [Google Scholar] [CrossRef] [PubMed]
  32. Bressot, C.; Shandilya, N.; Jayabalan, T.; Fayet, G.; Voetz, M.; Meunier, L.; Le Bihan, O.; Aguerre-Chariol, O.; Morgeneyer, M. Exposure assessment of nanomaterials at production sites by a short time sampling (STS) approach strategy and first results of measurement campaigns. Process Saf. Environ. Prot. 2018, 116, 324–332. [Google Scholar] [CrossRef]
  33. Warheit, D.B. Hazard and risk assessment strategies for nanoparticle exposures: How far have we come in the past 10 years? F1000Research 2018, 7, 376. [Google Scholar] [CrossRef] [PubMed]
  34. Bressot, C.; Shandilya, N.; Nogueira, E.S.D.; Cavaco-Paulo, A.; Morgeneyer, M.; Le Bihan, O.; Chariol, A.O. Exposure assessment-based recommendations to improve nanosafety at nanoliposome production sites. J. Nanomater. 2015, 2015, 931405. [Google Scholar] [CrossRef]
  35. Shatkin, J.A. Risk analysis for nanotechnology: Risk analysis for nanotechnology: State of the science and implications. Nanotechnol. Health Environ. Risks 2009, 56, 491–505. [Google Scholar]
  36. Morgeneyer, M.; Ramirez, A.; Poletto, M.; Smith, S.W.; Tweedie, R.; Heng, J.; Maass, S.; Bressot, C. Particle technology as a uniform discipline towards a holistic approach to particles, their creation, characterization, handling and processing. Chem. Eng. Res. Des. 2018. [Google Scholar] [CrossRef]
  37. Chatterjee, S.; Hadi, A.S. Regression Analysis by Example, 4th ed.; John Wiley & Sons, Inc.: Hoboken, NJ, USA, 2006. [Google Scholar]
  38. Environmental Performance Index. Available online: https://epi.envirocenter.yale.edu/epi-country-report/PAK (accessed on 20 February 2019).
  39. Faiz, Y.; Tufail, M.; Javed, M.T.; Chaudhry, M.M. Road dust pollution of Cd, Cu, Ni, Pb and Zn along Islamabad Expressway, Pakistan. Microchem. J. 2009, 92, 186–192. [Google Scholar] [CrossRef]
  40. Al-Khashman, O.A. The investigation of metal concentrations in street dust samples in Aqaba city, Jordan. Environ. Geochem. Health 2007, 29, 197–207. [Google Scholar] [CrossRef] [PubMed]
  41. Sezgin, N.; Ozcan, H.K.; Demir, G.; Nemlioglu, S.; Bayat, C. Determination of heavy metal concentrations in street dusts in Istanbul E-5 highway. Environ. Int. 2004, 29, 979–985. [Google Scholar] [CrossRef]
  42. Muhammad, S.; Shah, M.T.; Khan, S. Heavy metal concentrations in soil and wild plants growing around Pb-Zn sulfide terrain in the Kohistan region, northern Pakistan. Microchem. J. 2011, 99, 67–75. [Google Scholar] [CrossRef]
  43. Radojevic, M.; Bashkin, V.N. Practical Environmental Analysis; RSC Publishing: London, UK, 2006. [Google Scholar]
  44. Rahbar, M.H.; White, F.; Agboatwalla, M.; Hozhabri, S.; Luby, S. Factors associated with elevated blood lead concentrations in children in Karachi, Pakistan. Bull. World Health Organ. 2002, 80, 769–775. [Google Scholar] [PubMed]
  45. Cooke, G.D.; Welch, E.B.; Peterson, S.A.; Newroth, P.R. Copper sulfate. In Restoration and Management of Lakes and Reservoirs, 2nd ed.; Lewis Publishers: Boca Raton, FL, USA, 1993; pp. 247–257. [Google Scholar]
  46. Ramig, A.J.; Bowell, S.T. Mixtures of titanium dioxide and porous synthetic magnesium silicate in opacified emulsion paints. U.S. Patent 3,945,965, 1976. [Google Scholar]
  47. Eneh, O.C. A Guide for the Paint Maker, 2nd ed.; Welfare & Industrial Promotions (WIPRO) International: Enugu, Nigeria, 2016. [Google Scholar]
  48. Binnis, K. Corrosion-Inhibiting Titanium Dioxide Pigments. U.S. Patent 3,345,187, 1967. [Google Scholar]
  49. Manfred, S.; Baumstark, R. Formulation of aqueous architectural paints. In Water Based Acrylates for Decorative Coatings; Vincentz: Hannover, Germany, 2001; Volume 74, pp. 76–78. [Google Scholar]
  50. Han, H.W. External Wall Latex paint and Method for Preparing Same. China Patent CN 101338099A, 2007. [Google Scholar]
  51. Fang, X.P. Water Wall Paint for External Wall. China Patent CN 1,557,889A, 2004. [Google Scholar]
  52. IBM Corp. IBM SPSS Statistics for Windows, version 22.0; IBM Corp.: Armonk, NY, USA, 2013. [Google Scholar]
  53. ASTM D3719-00 Standard Test Method for Quantifying Dirt Collection on Coated Exterior Panels; ASTM International: Bethesda, MD, USA, 2000.
  54. Minitab 17 Statistical Software (Computer Software); Minitab, Inc.: State College, PA, USA, 2010.
  55. Yang, M.J.; Lu, W.K.; Chen, D.Q. Organosilicon Modified Propenoic Acid Emulsion Paint. China Patent CN 1217361A, 1997. [Google Scholar]
Figure 1. Self-cleaning effect on the surface of a leaf.
Coatings 09 00150 g001
Table 1. Percentage levels of raw materials.
Raw MaterialRange
A4%–25% [45]
B5%–10% [46]
AC and RC25%–35% [47]
D0.8%–3% [48]
E0.1%–1% [49]
F0.1%–0.6% [49]
G0.4%–0.8% [49]
H10%–30% [49]
I20%–30% [50]
J3%–6% [50]
K1%–20% [51]
Table 2. Raw material groups (in percentage/100 g).
Raw MaterialLowermost Range GroupMiddle Range GroupUppermost Range Group
H10–16.66716.668–23.33523.336–30
A4–1111.001–18.00118.002–25
B5–6.6676.668–8.3358.336–10
AC18.75–21.2521.251–23.75123.752–26.25
RC6.25–7.0837.084–7.9177.918–8.75
D0.8–1.5331.534–2.2672.268–3
G0.4–0.5330.534–0.6670.668–0.8
I20–23.33323.334–26.66726.668–30
K1–7.3337.334–13.66713.668–20
E0.1–0.40.401–0.7010.702–1
J3–44.001–5.0015.002–6
F0.1–0.2670.268–0.4350.436–0.6
Table 3. Raw material ranges (in percentage/100 g).
HABACRCDGIKEJF
104518.756.250.80.42010.130.1
10.0014.0015.00118.750756.250250.8010.40120.0011.0010.1013.0010.101
10.0024.0025.00218.75156.25050.8020.40220.0021.0020.1023.0020.102
10.0034.0035.00318.752256.250750.8030.40320.0031.0030.1033.0030.103
10.0044.0045.00418.7536.2510.8040.40420.0041.0040.1043.0040.104
10.0054.0055.00518.753756.251250.8050.40520.0051.0050.1053.0050.105
10.0064.0065.00618.75456.25150.8060.40620.0061.0060.1063.0060.106
10.0074.0075.00718.755256.251750.8070.40720.0071.0070.1073.0070.107
10.0084.0085.00818.7566.2520.8080.40820.0081.0080.1083.0080.108
10.0094.0095.00918.756756.252250.8090.40920.0091.0090.1093.0090.109
Table 4. Raw material value selection (in percentage/100 g).
HABACRCDGIKEJF
16.051052070.840.522020.373.820.25
23.1716.647.4722.87.8620.625.411.90.694.850.39
27.1623.969.3525.388.682.980.7929.919.820.84460.556
Table 5. Population count (in percentage/100 g).
HABACRCDGIKEJFTotal
16.11052070.840.522020.373.820.2585.85
16.11052070.840.522020.373.820.3985.99
16.11052070.840.522020.373.820.5686.16
16.11052070.840.522020.374.850.2586.88
16.11052070.840.522020.374.850.3987.02
16.11052070.840.522020.374.850.5687.19
16.11052070.840.522020.3760.2588.03
16.11052070.840.522020.3760.3988.17
16.11052070.840.522020.3760.5688.34
16.11052070.840.522020.693.820.2586.17
Table 6. Total sum to 100 of population count (in percentage/100 g).
HABACRCDGIKEJFTotalPVC%
18.711.655.8223.2968.1540.980.6123.32.330.434.450.2910053.38
18.6711.635.8223.2598.140.980.6123.262.330.434.440.4510053.38
18.6311.615.823.2148.1250.980.623.212.320.434.430.6510053.38
18.4711.515.7623.028.0570.970.623.022.30.435.580.2910053.38
18.4411.495.7522.9838.0440.970.622.982.30.435.570.4510053.38
18.4111.475.7422.9398.0290.960.622.942.290.425.560.6410053.38
18.2311.365.6822.727.9520.950.5922.722.270.426.820.2810053.38
18.211.345.6722.6837.9390.950.5922.682.270.426.810.4410053.38
18.1711.325.6622.6417.9240.950.5922.642.260.426.790.6310053.38
18.6311.615.823.218.1230.980.623.212.320.84.430.2910053.38
Table 7. Gloss test analysis results.
PropertyMean DifferenceBootstrap Sample Results
Std. Errorp-Value95% Confidence Interval
LowerUpper
Gloss (at 85° angle)24.922.05020.852728.8806
Table 8. Particle size analysis results.
PropertyMean DifferenceBootstrap Sample Results
Std. Errorp-Value95% Confidence Interval
LowerUpper
Particle size (μm)4.33931.04570.0012.323756.38765
Table 9. ANOVA.
Table 9. ANOVA.
SourceDFAdj SSAdj MSF-Valuep-Value
Formula69519375.2611.000.000
Error63043106.842
Total6999503
Table 10. Composition of the newly developed latex paint (in percentage/100 g).
IngredientsQuantity
H27.16
D0.84
G0.6
A10
B5
AC20
RC7
I20
J6
K2
E0.844
F0.556
Total100
Table 11. Analysis of variance.
SourceDFAdj SSAdj MSF-Valuep-Value
Regression6768.754128.126223.910
X11253.486253.486442.990
X2113.06813.06822.840
X310.8320.8321.450.23
X4115.1415.1426.460
X517.1697.16912.530.001
X619.1499.14915.990
Error11364.660.572
Total119833.414
Table 12. Model Summary.
R2R2 (adj)
92.24%91.83%
Table 13. Coefficients.
TermCoefSE CoefT-Valuep-ValueVIF
Constant95.5760.772123.770.0000
X1−0.018460.000877−21.050.00002.05
X20.06130.01284.780.00002.36
X30.008670.007191.210.231.37
X41.0050.1955.140.00001.5
X50.6910.1953.540.0011.5
X6−0.7810.195−40.00001.5

