Distribution of Al Element of Ti–6Al–4V Joints by Fiber Laser Welding


State Key Laboratory of Material Processing and Die & Mould Technology, School of Materials Science and Engineering, Huazhong University of Science and Technology, Wuhan 430074, China
*
Author to whom correspondence should be addressed.
Coatings 2019, 9(9), 566; https://doi.org/10.3390/coatings9090566
Submission received: 10 July 2019
/
Revised: 26 August 2019
/
Accepted: 3 September 2019
/
Published: 5 September 2019
(This article belongs to the Special Issue Laser Surface Modification of Metallic Materials)
Abstract
:In the process of laser welding, the uneven distribution of solute elements caused by element burning loss and flow of molten pool affects the quality of joints. In this paper, butt welding experiments were conducted on the 3 mm thick Ti–6Al–4V specimens with different preset ratios of Al and Si powders by using 4 kW fiber laser. The distribution of Al solute element and its influence on the microstructure and mechanical properties of the final weld joint were investigated. The results showed that the self-diffusion of Al element and the flow of molten pool affects the alloy elements distribution in laser welding. And the microhardness of the welded joint with Ti–6Al–4V and 90% Al + 10% Si powders was significantly higher than that with only Ti–6Al–4V, with the difference of about 130HV. At the same time, in the joint with 90% Al and 10% Si powders, the acicular α’ size was finer, and basketweave microstructure was present as well. This research is helpful to better understand the distribution of Al solute element and its influence on the joint quality during laser welding of Ti–6Al–4V alloy, which provides a certain reference for improving the weld or surface properties of Ti–6Al–4V alloy during laser processing.
1. Introduction
Laser Welding has been considered as one of the best welding processes for titanium alloys because of its high energy density, fast welding speed, small weld deformation, and flexible operating [1,2,3]. However, in this process, burning loss of some solute elements caused by the high laser intensity (106 W/cm2) may reduce joint performance [4,5].
When the high-energy laser beam focuses on the surface of the base metal, the keyhole is formed within a very short time, and the temperature is even higher than the boiling point of the base metal. Large amounts of vaporization of low-boiling alloy elements occur frequently, and the flow of molten pool would aggravate the burning loss [6] of alloy elements, which will result in the severe inhomogeneity of chemical composition around the weld [4,7]. The inhomogeneity may subsequently cause the microstructure transformation nonuniformity and ultimately affect the mechanical properties of the welded joints [8,9]. At present, the problem of elemental evaporation loss is solved industrially by increasing the content of low-boiling-point elements in the wire or powder feedstock or appropriately reducing the laser power. However, after the filling material enters the molten pool, the distribution of the filling elements in the weld may also have some unevenness due to the convection and agitation of the molten pool, which will affect the performance of the welded joint [10,11].
The distribution of solute elements must be affected by the flow of molten pool. A lot of research has been done to investigate the molten pool flow in laser welding [12,13,14,15,16]. Some researchers simulated the fluid flow in the melt-pool during laser welding and suggested that the Marangoni convection plays an important role in determining the molten metal flow in the weld pool [12,13,14]. However, these studies mainly focused on the effect of molten metal flow on the weld geometry and did not involve the distribution of alloying elements.
In the present work, different proportions of preset Al and Si powders were used for butt laser welding of Ti–6Al–4V alloy. Si powder was added to improve the fluidity of the molten pool. The distribution of Al solute element in welded joint was investigated, and the distribution law was analyzed based on the behavior of molten pool flow. Furthermore, influences of distribution of Al solute element on mechanical properties of joint were discussed.
2. Experimental
The Ti–6Al–4V alloy plates with a dimension of 112 mm × 108 mm × 3 mm were used as base metal, whose chemical compositions are shown in Table 1. Before welding, the Ti–6Al–4V alloy plates were polished with emery paper and ablated in aqueous solution of 3% HF + 35% HNO3 + 62% H2O to remove the oxide film, grease, and so on. The different ratios of Al and Si powders were preset. The specific process is as follows: the alloy powders were added to a 2% polyvinyl alcohol (PVA) solution, which was prepared into a slurry, which was then sprayed on the Ti–6Al–4V plates with a GSE-0410S*F75 spray gun (Foshan GAODESI Tools Co., Ltd., Foshan, China) to a thickness of about 0.1 mm. The preset powder ratios of different samples are shown in Table 2.
An IPG YLR-4000 fiber laser (Oxford, UK) with a maximum power of 4 KW was employed for the laser welding process. The wavelength of fiber laser is 1.07 µm, and the laser focus radius is 0.3 mm. The laser optic was monitored and controlled by an ABB IRB4400 industrial robot (ABB, Zurich, Switzerland). The Ti–6Al–4V alloy plates were welded with butt joint along the longitudinal direction. The assembly clearance was set to be zero. Welds were protected by argon on both sides of the plates during the welding process. The optimized process parameters obtained by laser welding tests are shown in Table 3.
After welding tests, the microstructure and mechanical properties of joints were investigated. The microstructures and distribution of the Al element of the joints were observed by three-dimensional (3D) super-depth digital microscope VHX-1000C (KEYENCE, Osaka, Japan) and energy dispersive spectrometry (EDS, inca-X-Max-20, OXFORD INSTRUMENT, Oxford, UK). Points were taken along and perpendicular to the welded joints, respectively. Then the microhardness of weld metal, heat affected zone (HAZ), and base metal were tested by a 432 svd microhardness Vickers machine with 1000 gf and 15 s. The tensile strength test was carried out by an AG-IC100KN electronic universal tester with tensile load 90 kN, and loading velocity was set at 2 mm/min. The welded joints fracture morphology was observed under scanning electronic microscopy (SEM, JEOL, Tokyo, Japan).
3. Results and Discussions
3.1. Morphology Analysis
The cross-sectional morphologies of the welded joints appeared as a characteristic nail head shape, as shown in Figure 1. All of the samples were the deep-penetration welds and exhibited no obvious difference in morphologies of heat-affected zone (HAZ). However, the weld width was slightly different, as shown in Figure 1. The weld width of sample II (2.40 mm) was relatively lower due to the high reflectivity and good thermal conductivity of Al. In addition, compared with Ti, the thermal conductivity of Al was much higher, which will ensure faster energy transfer in the molten pool of Ti–Al alloy. Local overheat of the keyhole surface formed by laser welding was also reduced. Thus, no obvious undercut and concave defects were found in the welded joints of the samples II and III.
3.2. Al Solute Element Distribution
With the help of point spectrum scan, ten points were selected from the top, middle, and bottom parts of the cross-sectional areas perpendicular to weld, respectively, and the same analysis was conducted along the weld. The distributions of Al element in the welded joints of three samples are shown in Figure 2.
From Figure 2a, it can be seen that the concentration trends of Al element in different regions were basically consistent in sample I. The concentration of the Al element tended to increase from the weld center to the fusion line, but tended to decrease crossing the fusion line to HAZ, especially in the top of the welded joint. The highest concentration peak appeared in the vicinity of the fusion line. It is known from Figure 2d that along the center line, the lowest concentration of Al element was in the middle of the welded joints.
As illustrated in Figure 2b, the highest concentration of Al element in sample II appeared in the center of the weld, which was gradually reduced along the direction of the base metal. Near the fusion line, the concentration of Al tended to ascend slightly, and then continued to decrease along the direction of the heat-affected zone. However, the concentrations of Al element changed mildly in the top and bottom parts of weld joints with respect to the middle part. Thus, the effect of the Al element transfer was greater than that of the diffusion in the top and bottom of the weld. As the laser welding process is a rapid melting and solidification process, a large number of aluminum powder were preset on the Ti–6Al–4V titanium specimen in sample II before the welding test. Hence, aluminum element content in the weld upper was higher, and the bottom part was also higher than that of sample I and sample III, which is shown in Figure 2d.
The basic trend of Al element concentration (Figure 2c) in the regions of the weld in sample III was similar to that in sample II. Due to the addition of Si element, which increased the fluidity of the molten pool, the movement of liquid metal in the molten pool was intense, which led to the distribution of Al element being more uniform along weld-width direction, and the range of Al element in the weld changed less than that in the sample II weld (see Table 4).
The change of Al solute element concentration in the welded joints indicated that burning loss of alloy elements is not the main reason for the uneven distribution of solute elements. Instead, the self-diffusion of solute elements and the flow of molten metal have a great influence on alloy elements distribution in laser welding. The convective motion of molten metal in the top and bottom is far more violent than that of the middle of welded joints. Due to the higher temperature, the solidification time in the top of the weld is longer. The violent movement of molten metal and the longer diffusion time make the distribution of solute elements more uniform in the top of welded joints. As a result, the motion of molten pool in laser deep-penetration welding is studied in this paper to explain the distribution rule of solute elements.
In laser welding of titanium alloy plate, the high-energy laser beam was applied on the surface-coating layer of titanium plate. Due to the large emissivity of Al, only part of the laser energy is absorbed by material. When the laser energy is sufficiently large, the temperature rises to the melting point of alloy elements. Then the surface material starts to melt, leading to intense evaporation and molten pool formation. Solute elements transfer mainly depends on violent convection in molten pool at the formation stage of keyhole in laser deep-penetration welding. As shown in Figure 3a, the surface with fluctuation of molten pool exhibited two convection rings [17,18], namely Marangoni flow [19], which was caused by the surface tension gradient. The velocity of high-energy laser beam welding is so fast, and then produces very high temperature gradient in the molten pool. The nonuniform distribution of the temperature field in the molten pool triggers a higher surface tension gradient of liquid metal. The surface tension gradient forces solute elements to be transported from the zone with lower surface-tension gradient to the higher one, resulting in the height difference of the liquid metal. In the vertical welding seam, the liquid metal in the middle of the molten pool flows directly to the free surface. The closer to the free surface, the higher flow rate the liquid metal has. The molten pool temperature around the keyhole is higher, and the surface-tension gradient of the liquid metal gradually decreases with increasing temperature, which means the surface tension gradient is lower in the center of the molten pool and relatively higher on the edge of the molten pool. Therefore, the liquid metal flows from center to the edge of the molten pool. Correspondingly, it is equally applicable to solute elements. Finally, the solute elements are formed in the high-concentration zone near the fusion line.
However, in the closure stage of keyhole, only one convection ring was observed in the top of the molten pool, as shown in Figure 3b. The main reason is that without laser heat source, residual heat still remained. Under the influence of the tension gradient caused by the temperature gradient, convection of the molten pool was maintained in the upside of the weld. However, the liquid metal flow velocity in the middle and bottom of the molten pool was very low, especially in the middle. There was not enough driving force to maintain the movement of liquid metal in the middle of the molten pool. Therefore, stationary state was observed. The intense convective motion of molten metal in the top and bottom is more violent than that in the middle. The influence of molten pool convection on solute elements transfer is greater than that of the solute diffusion, leading to the solute elements transfer from the weld center to the fusion line. However, the liquid metal in the middle of the welded molten pool is almost kept stationary. The solute elements are only transferred by diffusion, and the molten pool often starts solidifying from edge to the center. So solute elements of the middle often are enriched in the weld center. The flow of the molten pool can be significantly improved by adding Si, which makes the movement of the molten pool more violent, so that the distribution of the solute elements in the weld is more uniform.
3.3. Microstructure
The microstructure of the welded joint is shown in Figure 4. The Ti–6Al–4V -welded joints consisted of coarse β columnar grains and small acicular α martensite. The reason for the coarse β columnar phase formation is that the columnar grains are formed in the opposite direction of the heat flux, due to the low thermal conductivity and excessive thermal sensitivity of titanium alloy [20]. In welding, the β columnar grains in the middle of the weld are grown from the fusion line to the weld center, parallel to the direction of weld width. However, the top and bottom of the molten pool are in a relatively complex temperature and flow field, which leads to the growth of the β columnar grains different from the growth in the middle of the weld. As the top of the molten pool has large contact area with air, the heat exchange is relatively stronger, resulting in the β columnar grains in the top near the surface growing from the fusion line to the weld surface. At the bottom of the weld, the size of columnar structure is relatively fine due to the fast heat loss and short residence on high-temperature time during welding.
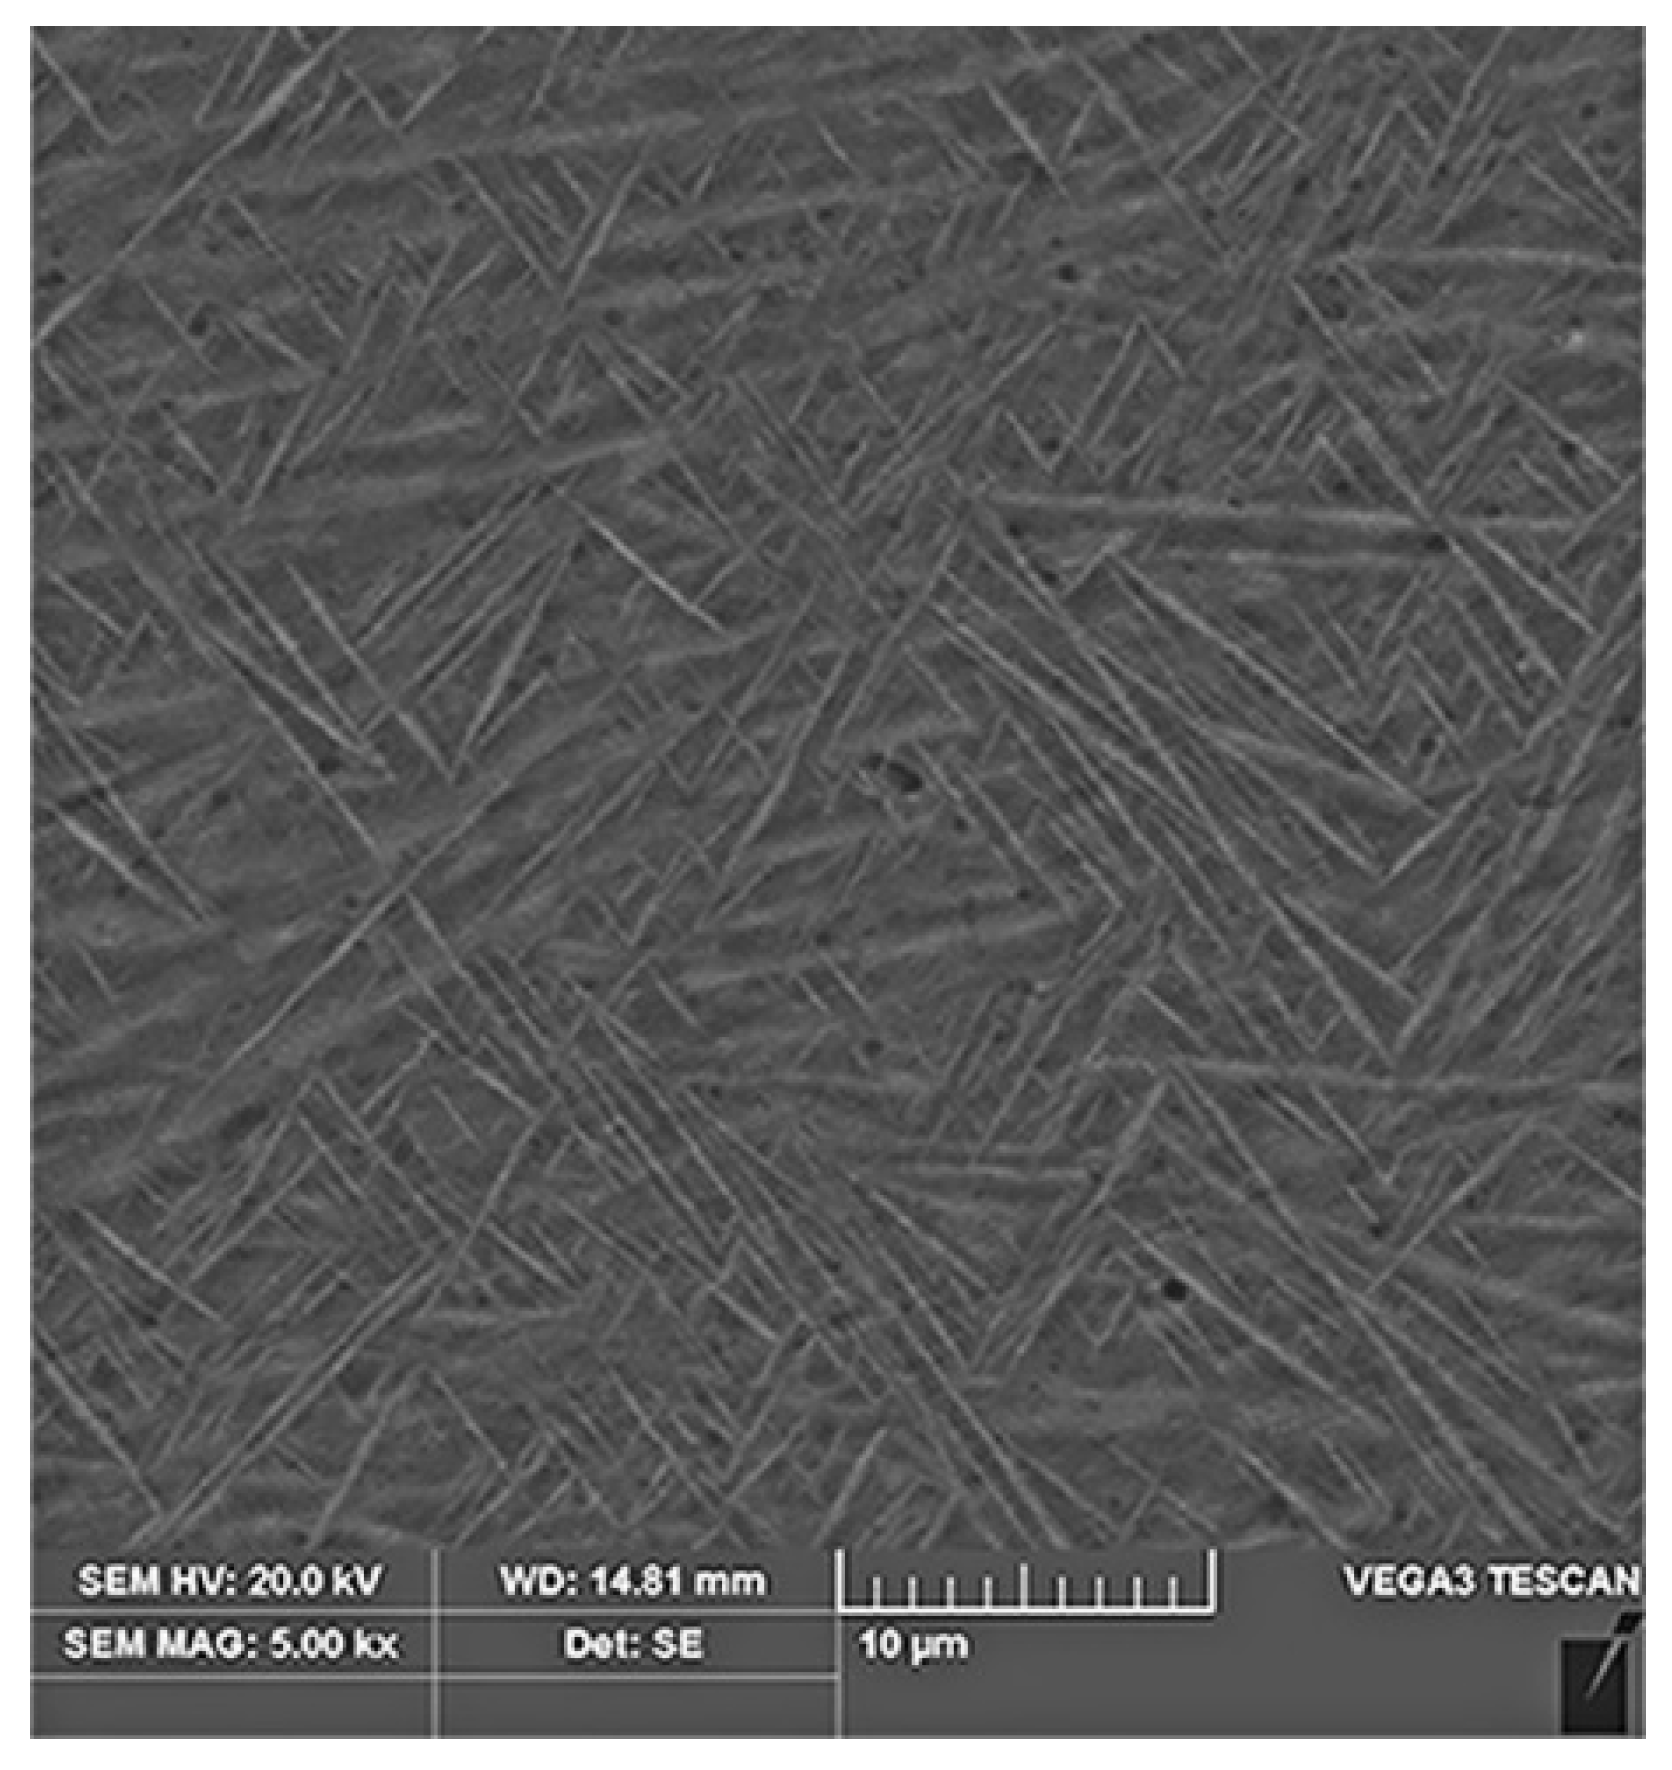
In the laser welding process, the welded metal was heated to above the phase transition temperature. During the rapid cooling process in the fusion zone, the alloy elements in β phase do not have enough time to transform into the α equilibrium phase by diffusion. The remote migration of β-phase atom brings about the shear transformation and generates the acicular martensite α’ (supersaturated solid solution of the alloy elements in the equilibrium phase). The α’ phase nucleates and grows both on the boundaries and on the inside of β phase at the same time. The single or parallel α’ phases are firstly formed, which spread throughout the entire grain until the grain boundary [21,22]. A series of smaller second-order α’ phases keep forming, before encountering the grain boundaries or the first-order α’ phases. Therefore, the weld shows a typical basketweave microstructure [23] (Figure 5). In conclusion, the length of acicular martensite α’ reflects the width of the β columnar grain to some extent, so different lengths of acicular martensite α’ in different regions of weld joints could be chosen as a way to measure the inhomogeneity of the welded joints.
Comparisons of the distribution of acicular martensite α’ length in the weld of the three samples are shown in Figure 6. The length of the acicular martensite decreased gradually from the top to bottom of the weld in sample I. The length of martensite in the middle of the weld was longer than that in other regions in sample II. In sample III, the longest α’ martensite was found in the bottom of the weld. The martensite length in the top was slightly longer than those in the middle. The result showed that with the addition of alloy powder, the length of acicular martensite in the top of the weld was obviously changed. However, the change in other regions was much smaller, and the minimum acicular martensite was found in sample III. As thermal conductivity of Al is higher than Ti, Al could speed up the cooling rate of the fusion zone, and when the β phase crystal transformed into martensite, nucleation increased. In addition, nucleus do not have enough time to grow up with high cooling speed until the completion of organization transformation, and finer acicular martensite structure can finally be formed [24]. All of those illustrate that the distribution of solute elements has an effect on the microstructure of the weld.
3.4. Mechanical Properties
Microhardness distribution profiles of the top, middle, and bottom of the weld along weld-width direction are shown in Figure 7. The addition of alloy powder changed the distribution of microhardness in the weld-width direction. The microhardness value exhibited a smooth transition, and the microhardness distribution along the weld width direction exhibited a “saddle shape” in each layer without any addition of alloy powder. The highest microhardness value was in the region near the fusion line. However, the change of microhardness of Ti–6Al–4V weld with 100% Al added showed a “convex shape” in each layer. The microhardness in the middle of weld first reached the peak value, and then decreased along the fusion line to the base metal. After adding Al and Si powder, different trends in different layers were found as follows: distribution of the hardness in the top exhibited “saddle shape”, and in the middle and bottom exhibited “convex shape”. The distribution of hardness of the weld is related to the distribution of the Al solute element. Thus, the distribution of the solute elements has a great influence on the hardness distribution of the weld.
On the other hand, the hardness value of the weld was significantly improved with the addition of alloy powder, especially in the top. The higher the content of Al, the greater the microhardness. The maximum hardness value of sample I was lower than that of sample II and III, and the differences were about 189 and 130 HV, respectively. The main reason is that during laser deep-penetration welding, the addition of Al element makes the grain finer. Moreover, large amounts of Al were dissolved in α phase, resulting in solid solution strengthening. Thus, the microhardness of the welded joints was improved.
Figure 8 shows the average tensile test results of each sample. It can be seen that the tensile strength was significantly decreased after adding different alloy powders. Adding 100% Al powder made the tensile strength decrease to only 180.95 MPa. The tensile strength of the welded joint with 90% Al and 10% Si added was about 410.55 MPa, but the tensile strength of the welded joint without any powder was 589.85 MPa. The reason for this phenomenon may be attributed to that the aluminum and titanium form hard-brittle Ti–Al phase, which will lead to the reduction of weld strength due to the uneven distribution. The addition of Si makes Al distribution and the Ti–Al-phase distribution uniform, which will strengthen the weld and improve the tensile strength.
All samples were fractured in the welded joints, and tensile fracture morphology is shown in Figure 9. It can be seen that the fracture surfaces were relatively homogeneous and perpendicular to the loading direction, without necking phenomenon. The macromorphology of the fracture surface in sample I exhibited an obvious “herringbone”, indicating the brittle fracture. The micromorphology showed a clear fan-shaped river pattern, which is the typical cleavage fracture. The macromorphology of the fracture surface in sample II was granular with few rough radiation shapes, indicating it was brittle fracture. And the fracture microstructure with discontinuous river pattern and the “tear ridge” crack expansion connection surface exhibited the characteristics of quasi-cleavage fracture. A row of round porosity was found in the middle of the weld, the walls of these porosities were in a wavy pattern, which indicates that those were the hydrogen holes. The porosities without a wavy pattern may have been the vapor pores. The porosity occupied a certain volume of the weld metal, which reduced the effective working area of the welding seam. These porosities can be stress concentration areas and even form cracks, leading to low tensile strength. In sample III, the fracture surface morphology was similar to that of sample II. The fracture was relatively flat and radial, and there were particles, showing a brittle fracture. Observing the microscopic morphology (Figure 9f), it was found that the fracture showed a rock-like pattern, indicating the characteristics along the fracture of the crystal.
4. Conclusions
- The distribution of solute elements in the laser welding seam is mainly determined by the flow of the molten pool and the self-diffusion. And the flow of molten pool has greater influence on the distribution of solute elements than the diffusion of the solute elements themselves. The addition of Si can significantly improve the fluidity of the molten pool, which makes the movement of the weld pool more intense, so that the distribution of the Al solute element in the weld is more uniform.
- In the study, the microstructure of the acicular martensite was explored, and the variation of the size was taken as a measurement of the nonuniform of the weld. The result showed that the grain size of weld with Al added was smaller than that without elemental added and with the smallest amount Al and Si added. The experimental results showed that the length of martensite in the top changed obviously and in the middle and bottom regions changed slightly.
- The addition of alloy powder not only changed the microhardness profiles of the weld, but also changed the distribution of the microhardness in different regions. Moreover, higher concentration of Al element may have resulted in higher microhardness, while the welded joint became more brittle and the tensile strength was lower. The addition of Si powder could avoid the decrease in joint tensile strength to some extent, but the strength was still lower than that of the welded joint without powder addition. Therefore, the tensile strength of sample III weld joint was the biggest in the case of powder addition, and its comprehensive mechanical properties were better.
Author Contributions
Conceptualization, A.H.; Methodology, A.H. and S.P.; Validation, A.H. and S.P.; Formal Analysis, J.Z. and R.H.; Investigation, J.Z. and R.H.; Writing-Original Draft Preparation, J.Z. and R.H.; Writing-Review and Editing, J.Z.
Funding
This research was funded by National Defense Independent Innovation Research Foundation of China, No. 201301.
Acknowledgments
The authors gratefully acknowledge State Key Laboratory of Material Processing and Die & Mould Technology for its technical and equipment support.
Conflicts of Interest
The authors declare no conflict of interest.
References
- Akman, E.; Demir, A.; Canel, T.; Sınmazçelik, T. Laser welding of Ti6Al4V titanium alloys. J. Mater. Process. Technol. 2009, 209, 3705–3713. [Google Scholar] [CrossRef]
- Bolzoni, L.; Ruiz-Navas, E.; Gordo, E. Feasibility study of the production of biomedical Ti–6Al–4V alloy by powder metallurgy. Mater. Sci. Eng. C 2015, 49, 400–407. [Google Scholar] [CrossRef] [PubMed]
- Kashaev, N.; Ventzke, V.; Fomichev, V.; Fomin, F.; Riekehr, S. Effect of Nd:YAG laser beam welding on weld morphology and mechanical properties of Ti–6Al–4V butt joints and T-joints. Opt. Lasers Eng. 2016, 86, 172–180. [Google Scholar] [CrossRef]
- Zhou, L.; Zhang, M.; Jin, X.; Zhang, H.; Mao, C. Study on the burning loss of magnesium in fiber laser welding of an Al-Mg alloy by optical emission spectroscopy. Int. J. Adv. Manuf. Technol. 2017, 88, 1373–1381. [Google Scholar] [CrossRef]
- Simonds, B.; Sowards, J.; Williams, P. Laser-induced fluorescence applied to laser welding of austenitic stainless steel for dilute alloying element detection. J. Phys. D Appl. Phys. 2017, 50. [Google Scholar] [CrossRef]
- Abe, Y.; Mizutani, M.; Kawahito, Y.; Katayama, S. Deep penetration welding with high power laser under vacuum. J. Laser Appl. 2010, 648–653. [Google Scholar] [CrossRef]
- Pastor, M.; Zhao, H.; Martukanitz, R.; Debroy, T. Porosity, underfill and magnesium loss during continuous wave Nd:YAG laser welding of thin plates of aluminum alloys 5182 and 5754. Weld. J. 1999, 78. [Google Scholar] [CrossRef]
- Fuerschbach, P.W.; Eisler, G.R. Effect of laser spot weld energy and duration on melting and absorption. Sci. Technol. Weld. Join. 2002, 7, 241–246. [Google Scholar] [CrossRef]
- Leo, P.; Renna, G.; Casalino, G.; Olabi, A.G. Effect of power distribution on the weld quality during hybrid laser welding of an Al–Mg alloy. Opt. Laser Technol. 2015, 73, 118–126. [Google Scholar] [CrossRef]
- Zhao, L.; Sugino, T.; Arakane, G.; Tsukamoto, S. Influence of welding parameters on distribution of wire feeding elements in CO2 laser GMA hybrid welding. Sci. Technol. Weld. Join. 2009, 14, 457–467. [Google Scholar] [CrossRef]
- Ju, H.; Lin, C.X.; Tian, Y.; Liu, Z.J.; Jiang, H.L.; Sun, D.P. Mechanical properties study of Fe-Mn-Si shape memory alloys welding seam formed by laser welding with filler powder. Materials 2018, 11, 1454. [Google Scholar] [CrossRef] [PubMed]
- Abderrazak, K.; Bannour, S.; Mhiri, H.; Lepalec, G.; Autric, M. Numerical and experimental study of molten pool formation during continuous laser welding of AZ91 magnesium alloy. Comput. Mater. Sci. 2009, 44, 858–866. [Google Scholar] [CrossRef]
- Suthakar, T.K.R.B.; Sankaranarayanasamy, K.; Naidu, B.G. Studies on weld shape formation and Marangoni convection in Nd:YAG laser welding. Int. J. Mechatron. Manuf. Syst. 2012, 5, 226–246. [Google Scholar] [CrossRef]
- Gao, Z.M.; Jiang, P.; Mi, G.Y.; Cao, L.C.; Liu, W. Investigation on the weld bead profile transformation with the keyhole and molten pool dynamic behavior simulation in high power laser welding. Int. J. Heat Mass Transf. 2018, 116, 1304–1313. [Google Scholar] [CrossRef]
- Peng, G.C.; Li, L.Q.; Xia, H.B.; Gong, J.F. Study on keyhole and melt flow behaviors of laser welding of aluminum under reduced ambient pressures. J. Phys. Conf. Ser. 2018, 1063, 012071. [Google Scholar] [CrossRef] [Green Version]
- Fotovvati, B.; Wayne, S.; Lewis, G.; Asadi, E. A review on melt-pool characteristics in laser welding of metals. Adv. Mater. Sci. Eng. 2018, 2018, 1–18. [Google Scholar] [CrossRef]
- Zou, J.; Wu, S.; He, Y.; Yang, W.; Xu, J.; Xiao, R. Distinct morphology of keyhole wall during high power fibre laser deep penetration welding. Sci. Technol. Weld. Join. 2015, 20, 655–658. [Google Scholar] [CrossRef]
- Zhang, G.; Wu, C.S.; Liu, Z. Experimental observation of both keyhole and its surrounding thermal field in plasma arc welding. Int. J. Heat Mass Transf. 2014, 70, 439–448. [Google Scholar] [CrossRef]
- Hanumanthu, R.; Stebe, K.J. Transient and persistent Marangoni–Bénard convection in the presence of surfactants. Colloids Surf. A Physicochem. Eng. Asp. 2011, 391, 51–61. [Google Scholar] [CrossRef]
- Wang, S.; Wu, X. Investigation on the microstructure and mechanical properties of Ti–6Al–4V alloy joints with electron beam welding. Mater. Des. 2012, 36, 663–670. [Google Scholar] [CrossRef]
- Zhang, Z.; Dong, S.; Wang, Y.; Xu, B.; Fang, J.; He, P. Microstructure characteristics of thick aluminum alloy plate joints welded by fiber laser. Mater. Des. 2015, 84, 173–177. [Google Scholar] [CrossRef]
- Guo, P.; Zhao, Y.; Zeng, W.; Hong, Q. The effect of microstructure on the mechanical properties of TC4-DT titanium alloys. Mater. Sci. Eng. A 2013, 563, 106–111. [Google Scholar] [CrossRef]
- Liang, S.X.; Yin, L.X.; Jiang, R.J.; Zhang, X.Y.; Ma, M.Z.; Liu, R.P. Strengthening mechanism of two-phase titanium alloys with basketweave microstructure. J. Alloy Compd. 2014, 603, 42–47. [Google Scholar] [CrossRef]
- Cai, Z.; Wang, R.; Zhang, C.; Peng, C.; Wang, L. Microstructure and properties of Al/Sip composites for thermal management applications. J. Mater. Sci. Mater. Electron. 2015, 26, 4234–4240. [Google Scholar] [CrossRef]
Figure 1.
The cross-sectional morphologies of the weld joints (a–c): (a) sample I; (b) sample II; (c) sample III.
Figure 1.
The cross-sectional morphologies of the weld joints (a–c): (a) sample I; (b) sample II; (c) sample III.

Figure 2.
The distribution of Al element in the weld joints of three samples (a–d): (a) along weld-width direction of sample I; (b) along weld-width direction of sample II; (c) along weld-width direction of sample III; (d) along the center line of there samples.
Figure 2.
The distribution of Al element in the weld joints of three samples (a–d): (a) along weld-width direction of sample I; (b) along weld-width direction of sample II; (c) along weld-width direction of sample III; (d) along the center line of there samples.
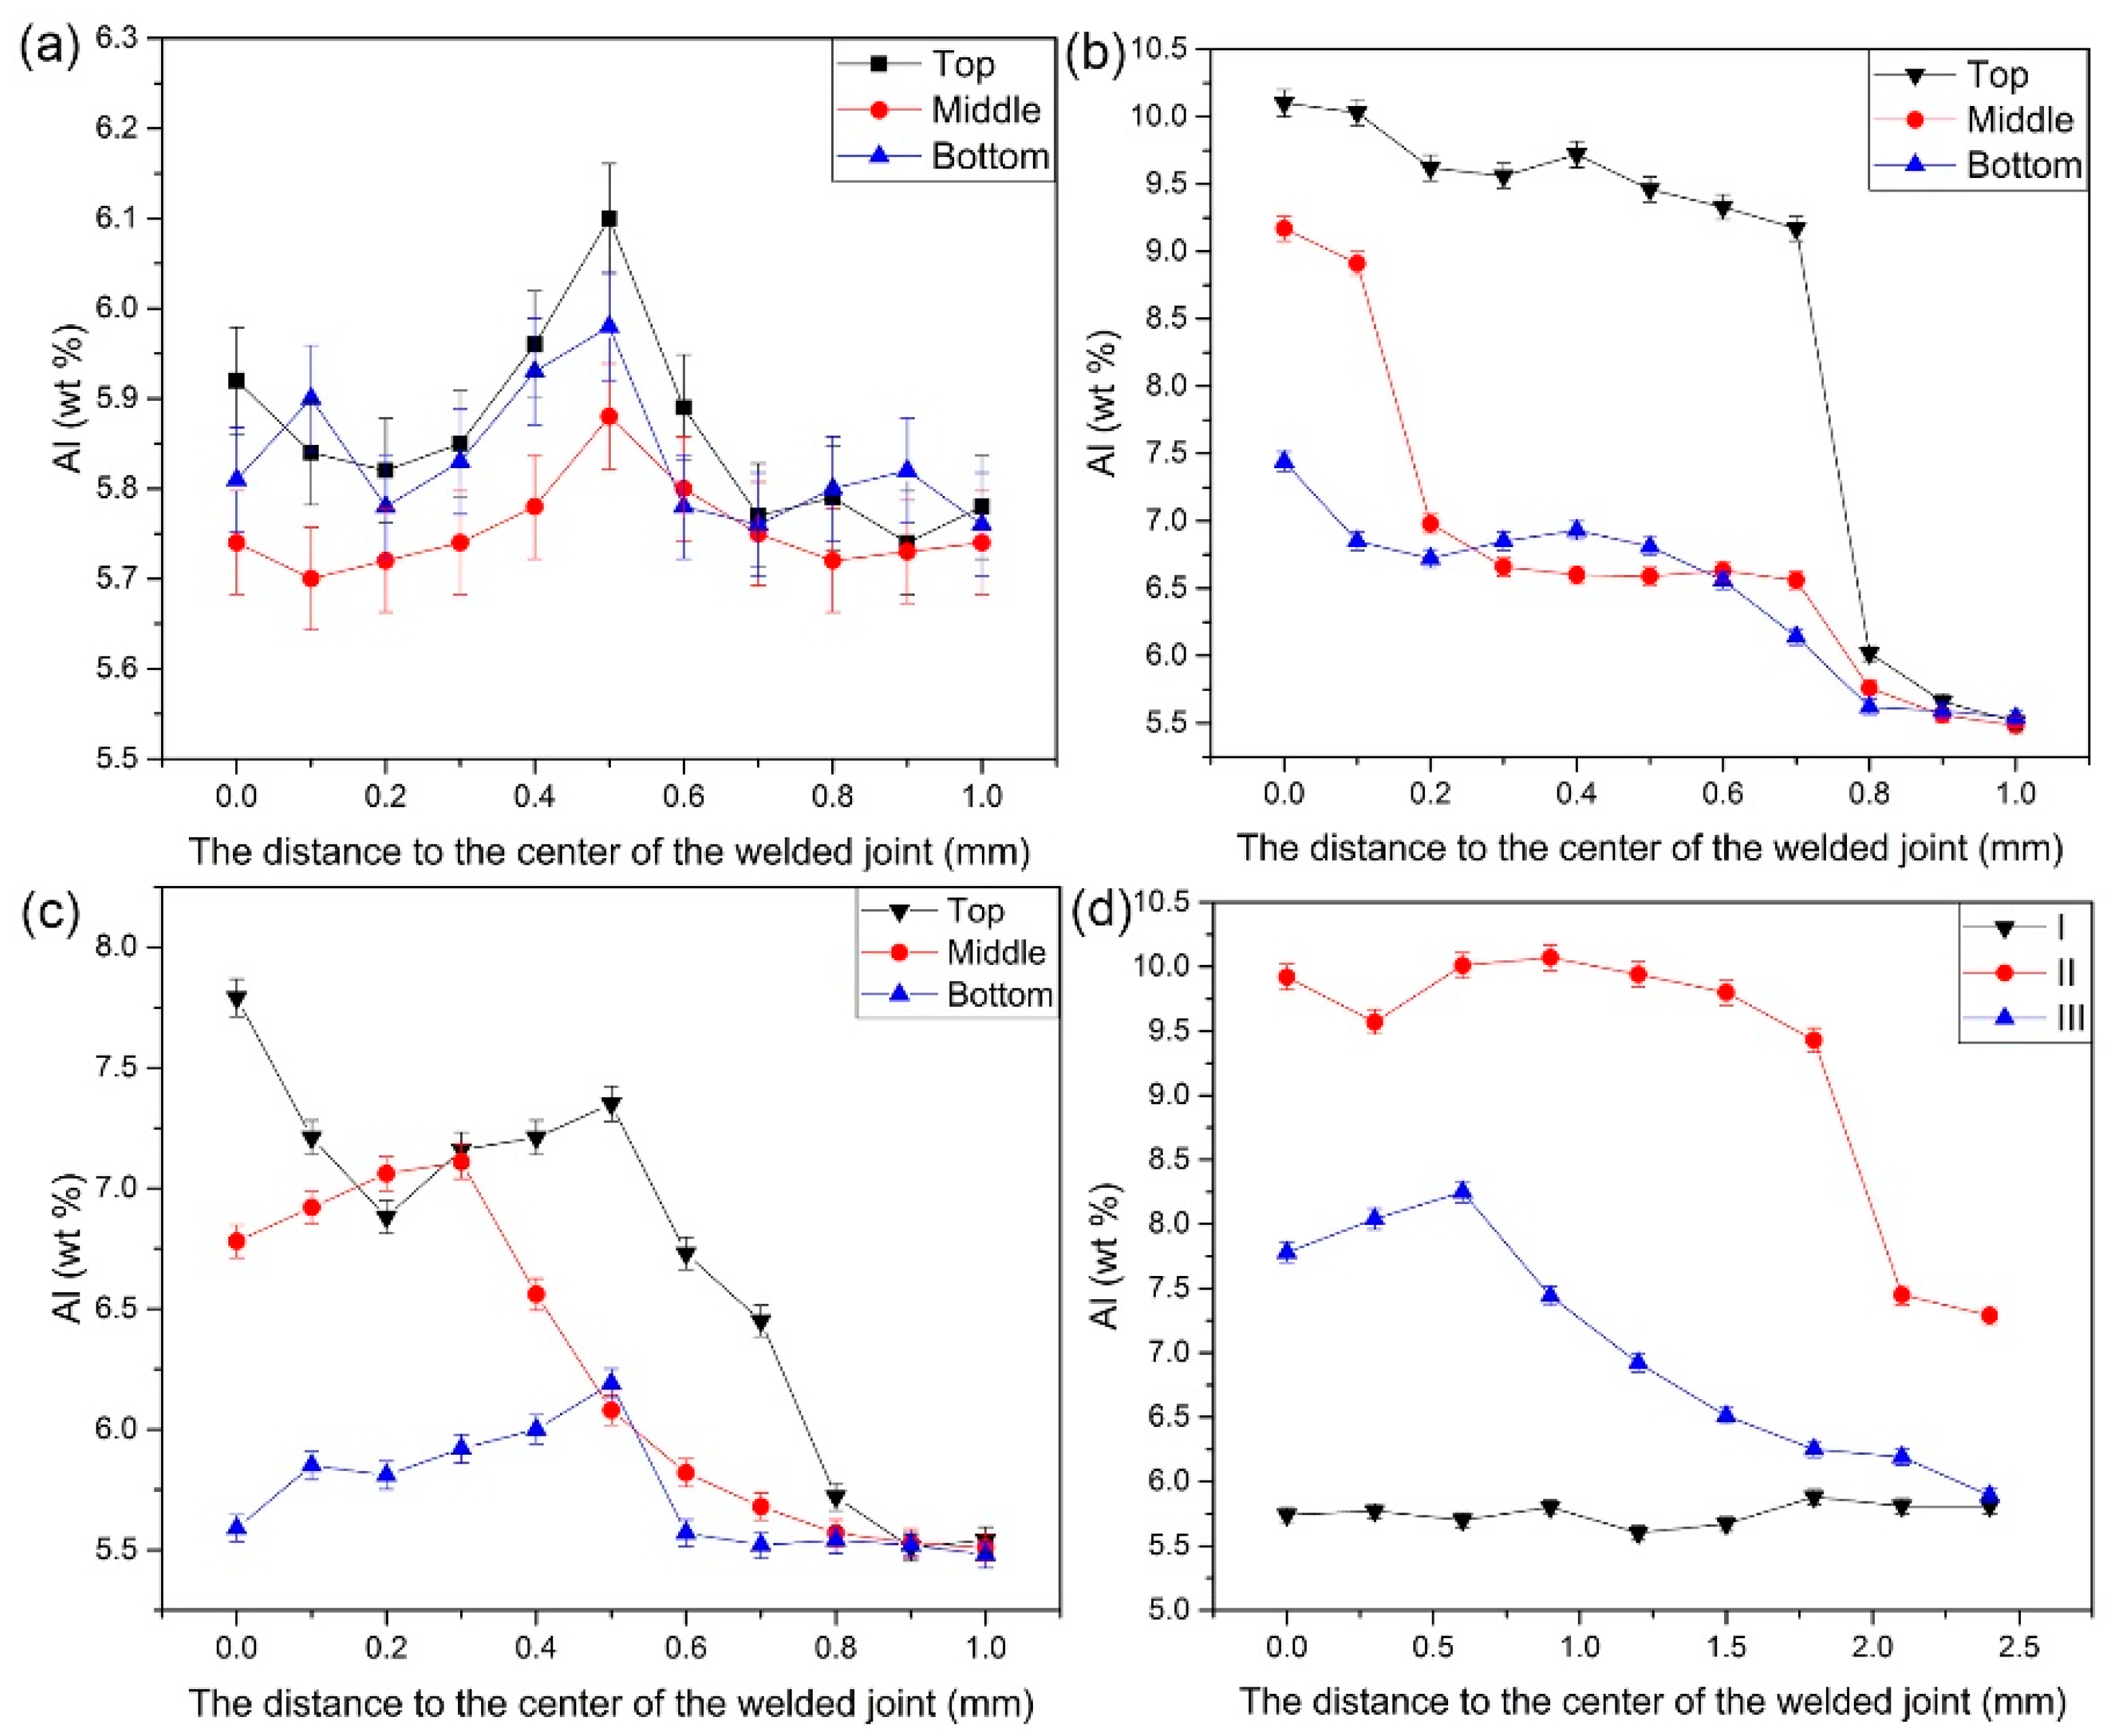
Figure 3.
Molten pool flow process schematic.

Figure 4.
The microstructure of the weld (a–c): (a) sample I; (b) sample II; (c) sample III.

Figure 5.
Basketweave microstructure.

Figure 6.
The comparison of longitudinal acicular martensite length.
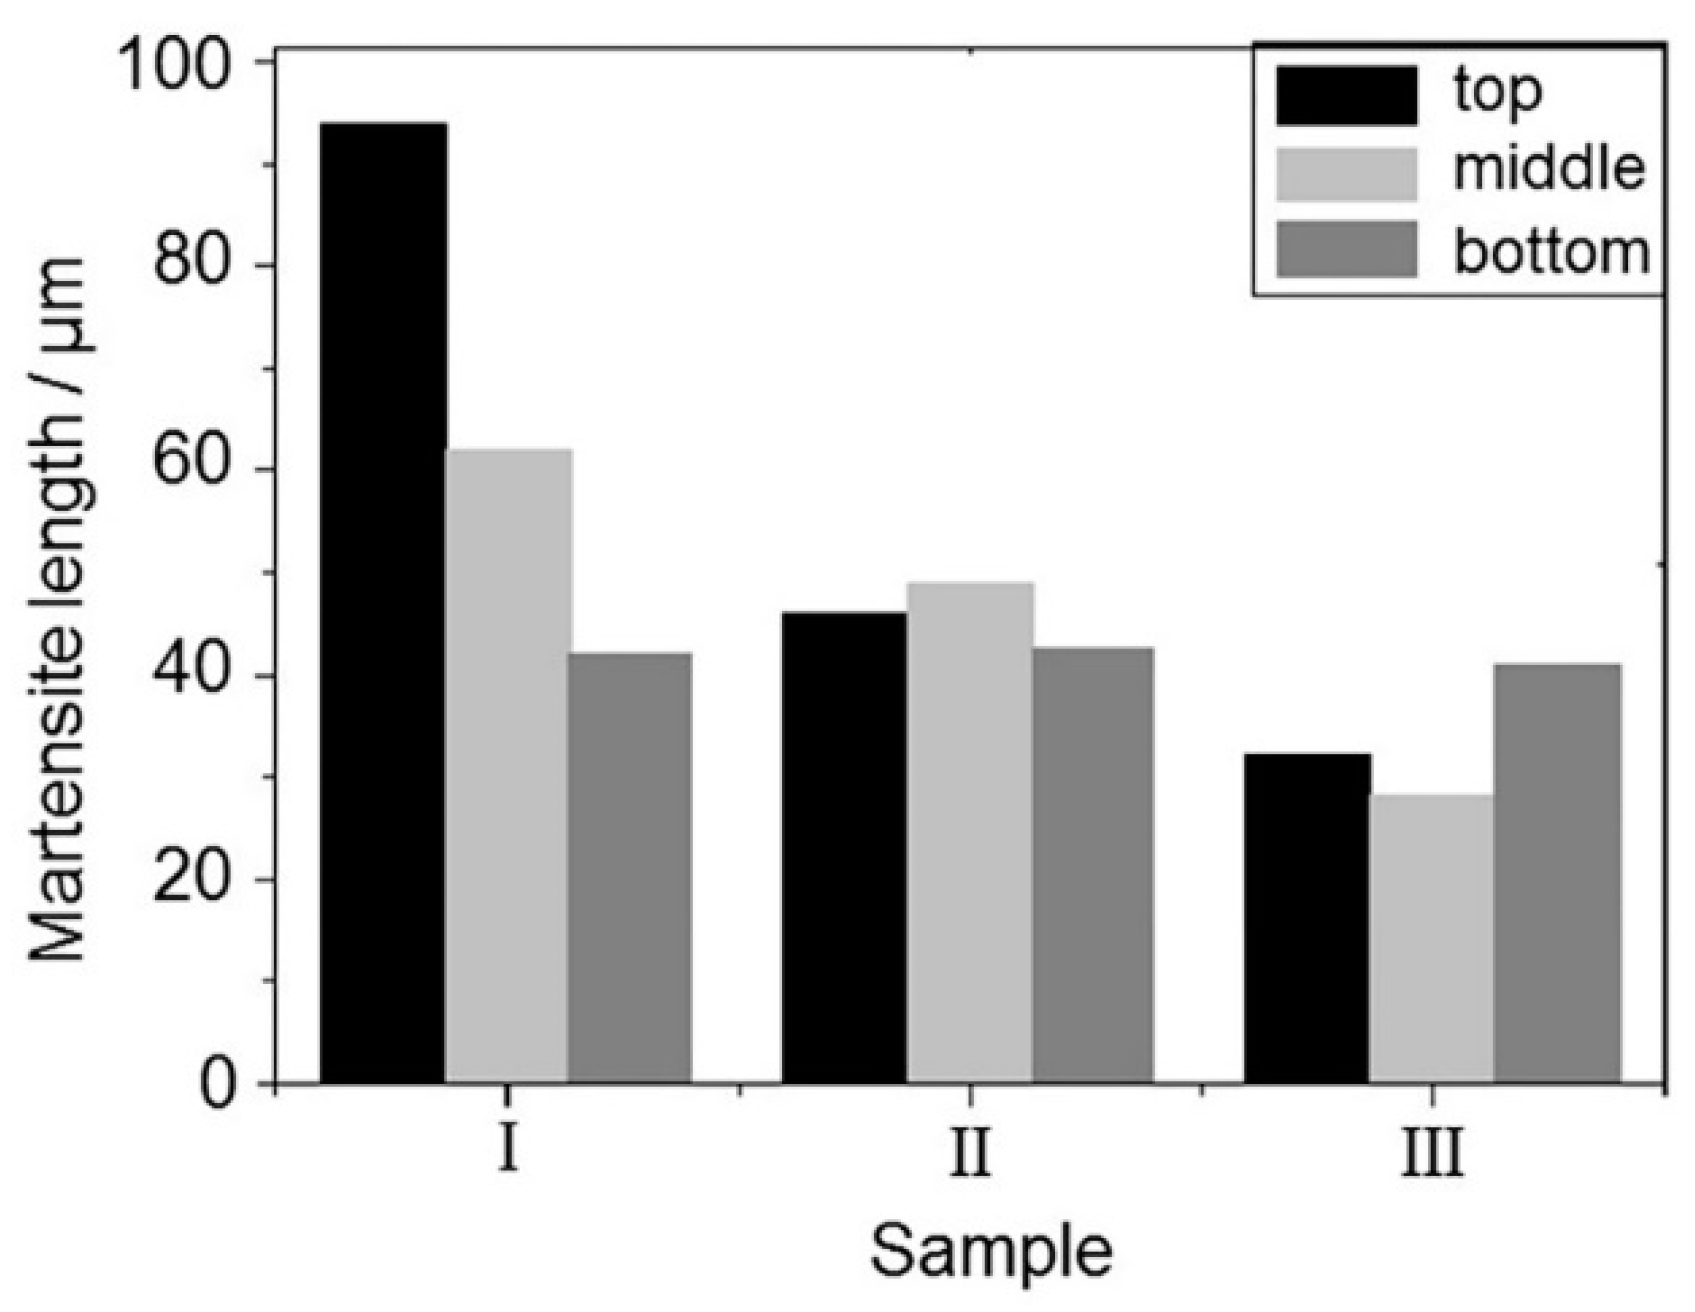
Figure 7.
Hardness distribution of the weld along weld-width direction (a–c): (a) sample I; (b) sample II; (c) sample III.
Figure 7.
Hardness distribution of the weld along weld-width direction (a–c): (a) sample I; (b) sample II; (c) sample III.

Figure 8.
The tensile strength of the welded joints.

Figure 9.
Weld fracture morphology (a–f): (a)/(b) macro/micro of sample I; (c)/(d) macro/micro of sample II; (e)/(f) macro/micro of sample III.
Figure 9.
Weld fracture morphology (a–f): (a)/(b) macro/micro of sample I; (c)/(d) macro/micro of sample II; (e)/(f) macro/micro of sample III.


Table 1.
Chemical compositions of base metal (wt.%).
| Al | V | Fe | C | N | H | O | Ti |
|---|---|---|---|---|---|---|---|
| 5.50–6.80 | 3.50–4.50 | ≤0.30 | ≤0.10 | ≤0.05 | ≤0.015 | ≤0.20 | Bal. |
Table 2.
Powder compositions (wt.%).
| Sample I | Sample II | Sample III |
|---|---|---|
| Without powder | 100% Al + 0% Si | 90% Al + 10% Si |
Table 3.
Laser welding process parameters.
| Power (kW) | Welding Speed (m/min) | Defocusing Amount (mm) | Gas Flow (m3/h) |
|---|---|---|---|
| 2.5 | 2.5 | 0 | 2 |
Table 4.
Difference in the Al content in the range of 0.5 mm from the center line of sample II and III welds (wt.%).
Table 4.
Difference in the Al content in the range of 0.5 mm from the center line of sample II and III welds (wt.%).
| Sample | Top | Middle | Bottom |
|---|---|---|---|
| II | 0.61 | 2.66 | 1.05 |
| III | 0.93 | 0.65 | 0.61 |
© 2019 by the authors. Licensee MDPI, Basel, Switzerland. This article is an open access article distributed under the terms and conditions of the Creative Commons Attribution (CC BY) license (http://creativecommons.org/licenses/by/4.0/).
Share and Cite
MDPI and ACS Style
Zhang, J.; Hu, R.; Pang, S.; Huang, A. Distribution of Al Element of Ti–6Al–4V Joints by Fiber Laser Welding. Coatings 2019, 9, 566. https://doi.org/10.3390/coatings9090566
AMA Style
Zhang J, Hu R, Pang S, Huang A. Distribution of Al Element of Ti–6Al–4V Joints by Fiber Laser Welding. Coatings. 2019; 9(9):566. https://doi.org/10.3390/coatings9090566
Chicago/Turabian StyleZhang, Jiajia, Renzhi Hu, Shengyong Pang, and Anguo Huang. 2019. "Distribution of Al Element of Ti–6Al–4V Joints by Fiber Laser Welding" Coatings 9, no. 9: 566. https://doi.org/10.3390/coatings9090566
Note that from the first issue of 2016, this journal uses article numbers instead of page numbers. See further details here.