Article

Preliminary Examinations for the Identification of U.S. Domestic and International Cotton Fibers by Near-Infrared Spectroscopy

Southern Regional Research Center (S.R.R.C.), Agricultural Research Service, U.S. Department of Agriculture (U.S.D.A.), New Orleans, LA, 70124 USA
*
Author to whom correspondence should be addressed.
Fibers 2014, 2(4), 264-274; https://doi.org/10.3390/fib2040264
Submission received: 22 May 2014 / Revised: 13 August 2014 / Accepted: 20 August 2014 / Published: 29 September 2014
(This article belongs to the Special Issue Cellulose Fibers)

Abstract

:
Cotton is and has been a large cash crop in the United States and abroad for many years. Part of the widespread interest and utility of this product is due to its attractive chemical and physical properties for use in textiles. The textile industry could benefit from the presentation of a quick, reliable method to classify U.S. from foreign cottons so that the appropriate tariffs can be levied for non-American cottons. In addition, there is some interest in avoiding cotton identity theft. Thus, an accurate and precise instrumental method would be of interest to correctly identify the country of origin of cotton. This study provides an analytical method to identify domestic and foreign cotton fibers using near-infrared (NIR) spectroscopy coupled with principal component analysis (PCA). Samples from American cottons were evaluated along with a representative amount of international samples. The results provide a proof of concept that indicates that PCA analysis can be used to separate the respective domestic and foreign cotton groups.

1. Introduction

Currently, the methods available to identify cotton are time-consuming, destructive and laborious. Previous methods that have been used include the burning test, solubility tests and staining tests [1]. The burning test is useful, but has the limitation of destroying the sample, and in the case of blended yarns, it allows the more flammable yarn to burn first. Furthermore, the burning test is used to roughly categorize fiber type, such as cotton, wool or man-made textiles. When used alone, the solubility tests have the limitation that they can only identify generic types of fiber [1]. Other cotton fiber identification methods include American Association of Textile Chemists and Colorists methods (TM020 and TM020A), which yield qualitative and quantitative methods, respectively [2]. In addition, cotton fiber identity theft is a large economic problem facing the U.S. [3]. Cotton identity theft is characterized by passing non-U.S. cotton off as American premium cottons to make a higher profit or to take advantage of trade regulations afforded to U.S. cottons [4]. Thus, current manual methods to identify cotton fiber involve a large degree of variability and are labor-intensive [3]. However, measurements to identify cotton fiber (U.S./domestic or non-U.S./international) are not available. Therefore, new techniques are needed to enable the user and governmental agencies to know the source of the cotton, domestic or international.
The NIR region encompasses the spectral range of 800–2500 nm (4000–12,500 cm−1), where the subregions are defined as first, second and third overtones and combination bands, which correspond to fundamental spectral bands in the mid-infrared region [5,6,7,8]. The primarily used NIR spectral region encompasses 1100–2500 nm. The primary absorbances observed in the NIR spectral region are for the chemical species CHi, NHi and OHi, although, in addition, the first, second and third overtones in the NIR region can be related to specific fundamental frequencies in the mid-infrared (MIR) spectral region. Furthermore, NIR spectroscopy offers many advantageous features, including little to no sample preparation, accuracy, precision, non-destruction of samples, ease of use, flexibility of multiple sampling systems (e.g., fiber optic probe, rotating sphere) and the option of analyzing different size samples of pepper (0.841-mm standard diameter), powder (0.177-mm standard diameter) and large, raw cotton samples, which is particularly useful for analyzing a heterogeneous sample, such as cotton.
Near-infrared (NIR) spectroscopy has been used extensively to discriminate/measure both qualitative and quantitative properties of natural fibers, synthetic fibers, textiles and textile auxiliaries. The advantages of using NIR to determine more than one key cotton parameter along with its precision and accuracy were reported by Camjani and Muller [9]. In a different textile study, NIR was applied toward the classification of carpet face fiber, which was instrumental in the success of the carpet recycling program [10]. Still other studies reported on the application of NIR aimed at determining fiber fineness, maturity, micronaire and fiber contaminants [11,12]. Another examination quite beneficial to the textile industry provided an overview on the analysis of textiles using NIR [13]. NIR spectroscopy has been used to quantitatively measure cotton quality parameters, both in and outside the laboratory [14,15,16,17,18,19,20]. Blend analyses, which include determining cotton content, have been performed with NIR spectroscopy [21,22]. Several authors have used NIR spectroscopy to study trash and contamination in cotton (both botanical and field trash/contamination in cotton) [23,24,25]. However, even with the breadth of studies mentioned here, no literature was found dedicated to identifying the source of origin for cotton samples.
Principal component analysis (PCA) is a chemometric method that involves the construction of linear multivariate models of complex data sets [26]. These models are developed based on principal components, which are eigenvectors. The PCA method models both relevant and random variations in the data set [27]. In addition, PCA can reveal relationships between observed and hypothetical variables, while most other chemometric methods are centered on relationships among observed variables only [28]. PCA interrelationships are signified graphically by the formation of coherent subgroups along the principal component axes.
Previously, PCA has been successfully used to classify white and colored Australian cottons using NIR and Raman spectroscopy [14,15]. The present study seeks to reveal the feasibility of using NIR spectroscopy and chemometrics, specifically PCA analysis, to discriminate between, separate and identify domestic and international cotton samples.

2. Experimental Section

2.1. Cotton Samples

A diverse sample set from several countries of origin was prepared, and a total of 205 raw cotton samples were analyzed. Samples of high, medium and/or low grade from foreign countries included Australia, Zimbabwe, Brazil, China, Japan, India, Pakistan, South Africa, Spain, Paraguay, Turkey, Tanzania and Zambia from crop years 2007 and 2009 (n = 54). U.S. cottons included in the study were from Texas, Georgia, Louisiana and Mississippi from crop years 2001–2004 and 2009 (n = 164). All samples were conditioned for a minimum of 24 h and measured at standard conditions (21 ± 1 °C and 65% ± 2% relative humidity (RH)). Five measurements were made on each sample, and the average spectra for each sample were obtained.

2.2. FT-NIR Spectroscopy

The FT-NIR spectra were acquired using a bench top Bruker MPA instrument equipped with an integrating sphere accessory (Bruker Optics, Billerica, MA, USA). Measurements were taken by placing the fiber on top of the integrating sphere with a weight placed on top to provide equivalent pressure across the sample surface. The spectra were collected over a spectral range of 4000–12,500 cm−1 (800–2500 nm), with a resolution of 8 cm−1 and 32 scans. NIR spectra were collected using the Bruker OPUS IDENT software package [29].

2.3. Chemometrics

NIR spectra were imported into the CAMO Unscrambler version 9.7, chemometric software package, (Camo, Woodbridge, NJ, USA). In the Unscrambler software, the spectral types were separated into groups representing U.S. (domestic) and international groups. Various preprocessing methods, including standard normal variate (SNV) with and without a second derivative, were investigated to normalize the spectral data. The principal component analysis was carried out using a full cross-validation with leave-one-out sampling to test the validity of the calibration model.

2.4. Fiber Physical Property Measurements

The primary fiber physical properties and quality attributes of each cotton sample were measured using the Uster® High Volume Instrument-1000 (HVI™-1000) and Uster® Advanced Fiber Information System (AFIS) (Uster Technologies, Inc., Knoxville, TN, USA). Vendor recommended protocols and procedures were used. For the HVI™ measurements, each sample was measured five times (5 replicates) and the average of each property reported. For the AFIS measurements, each sample was measured five times (5 replicates), 5000 fibers per rep (5 × 5000 measurement) and the average of each property reported.

3. Results and Discussion
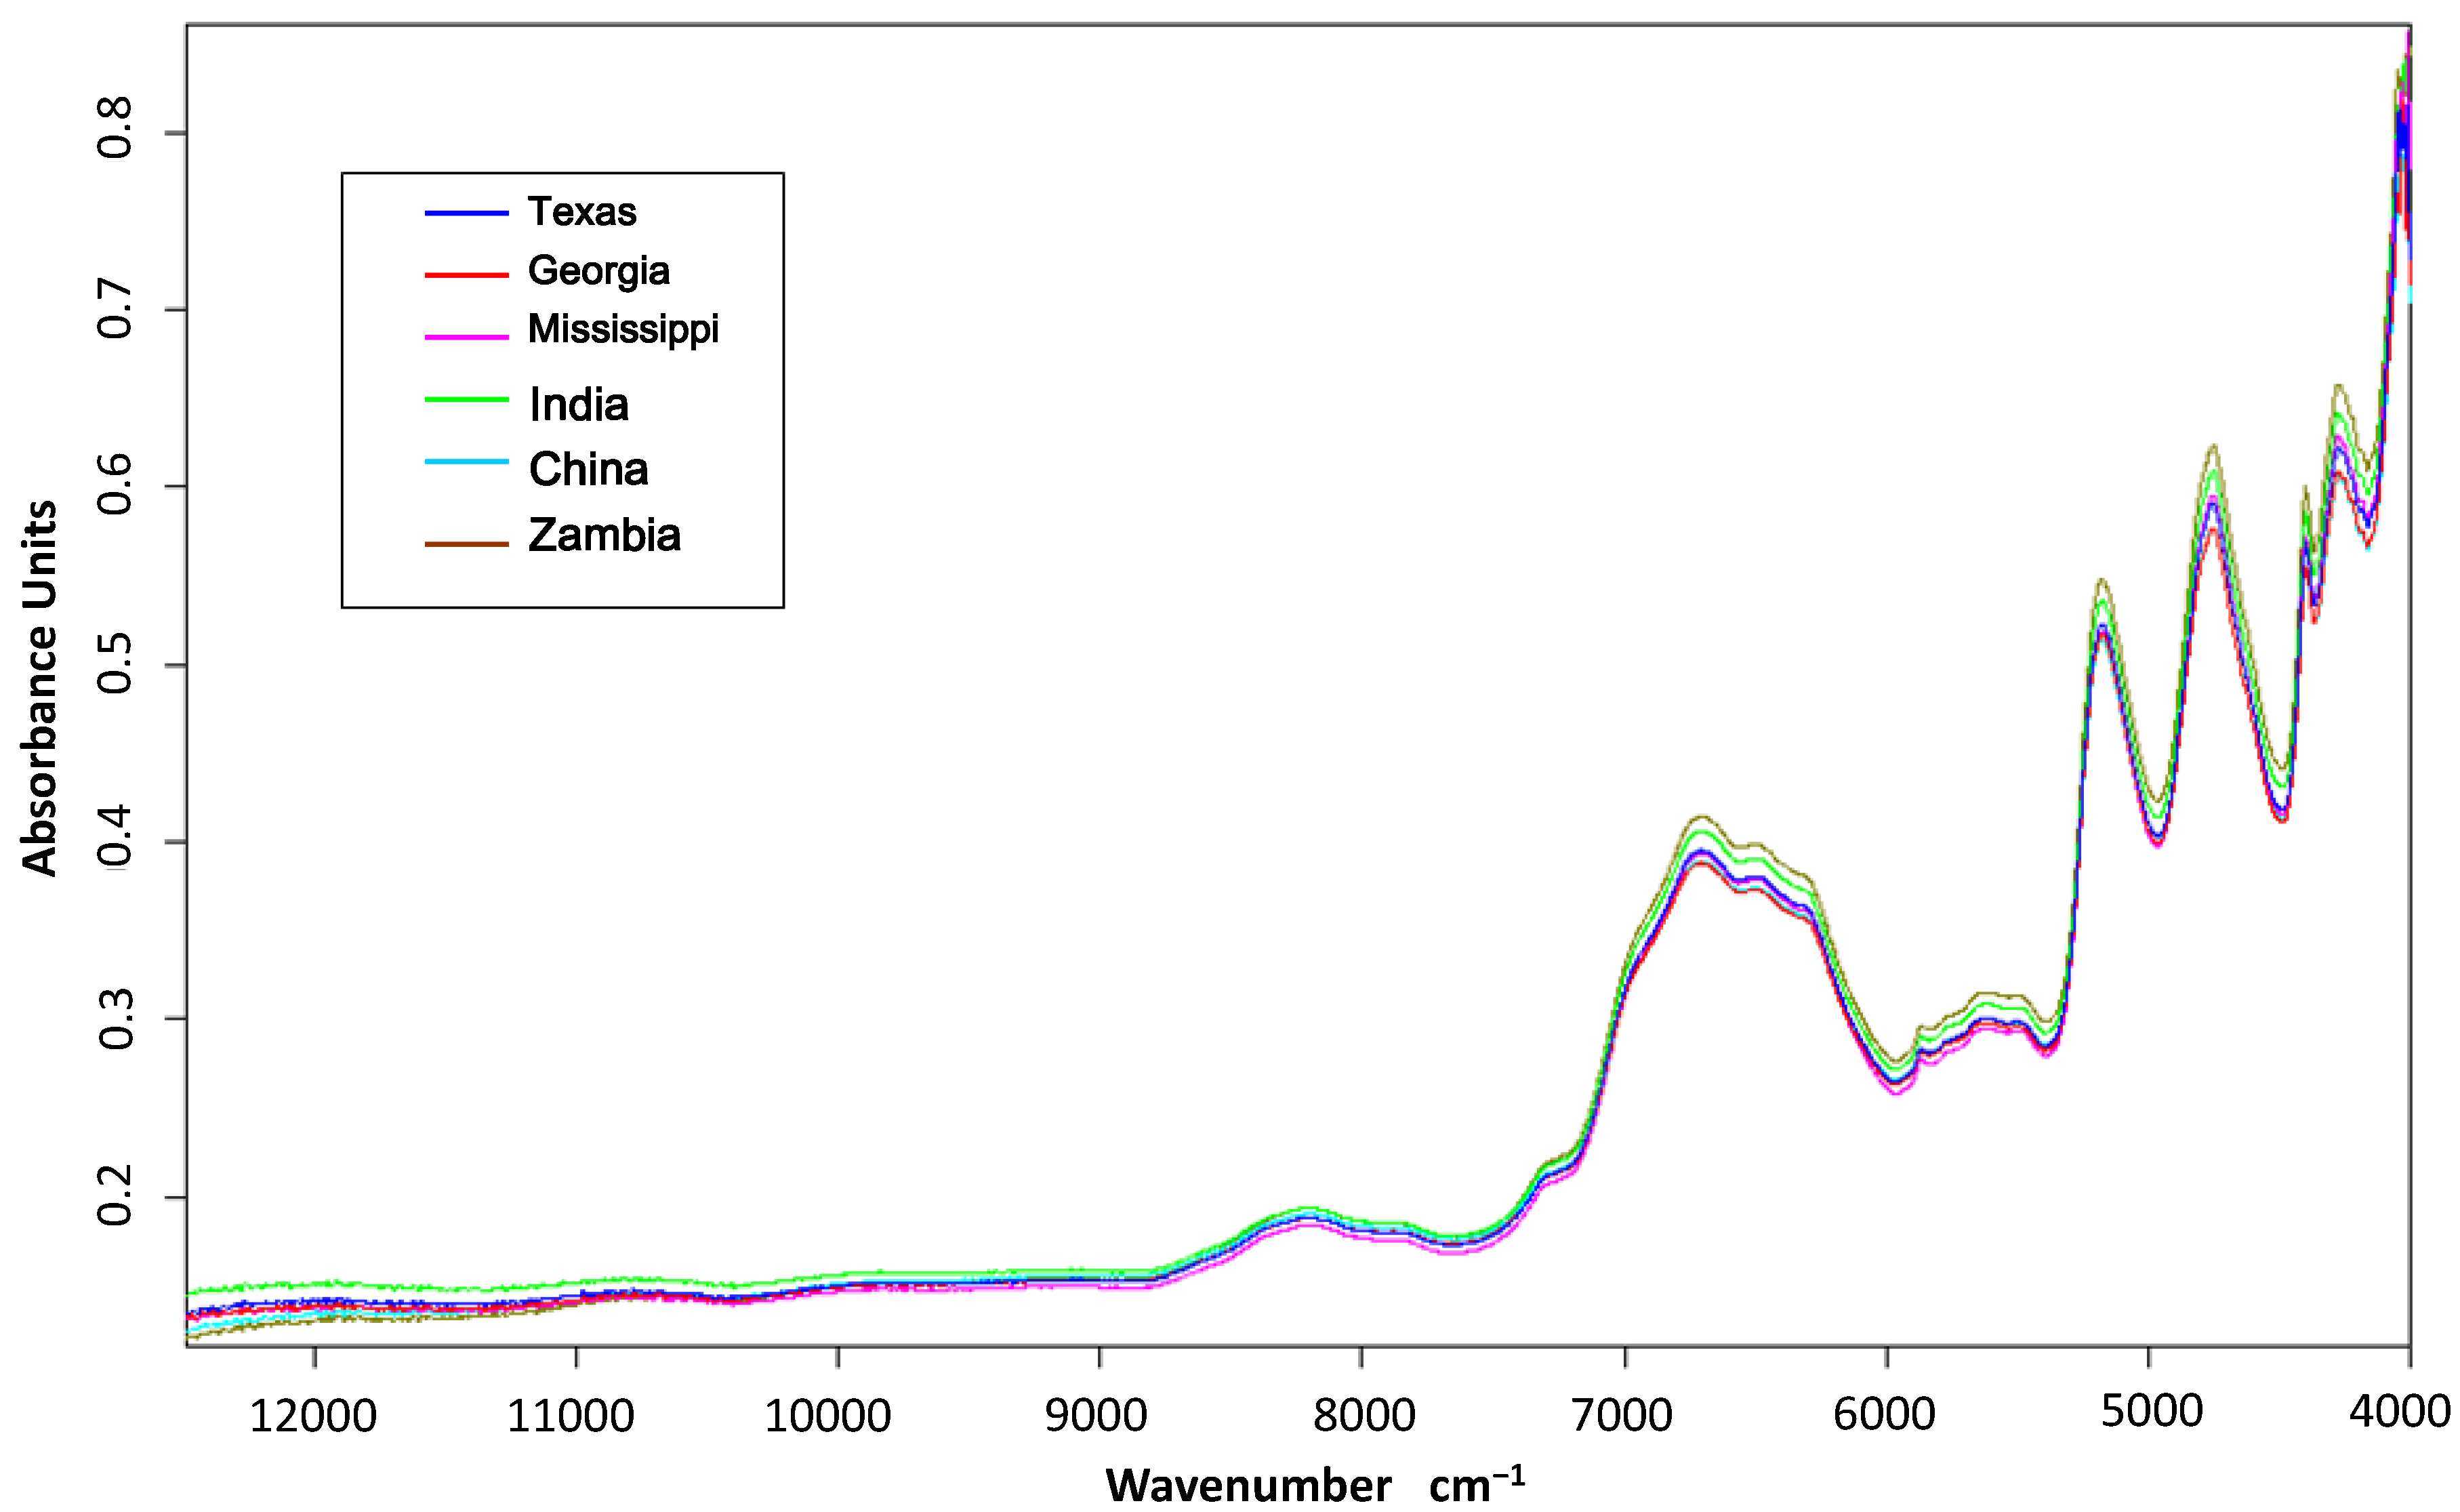
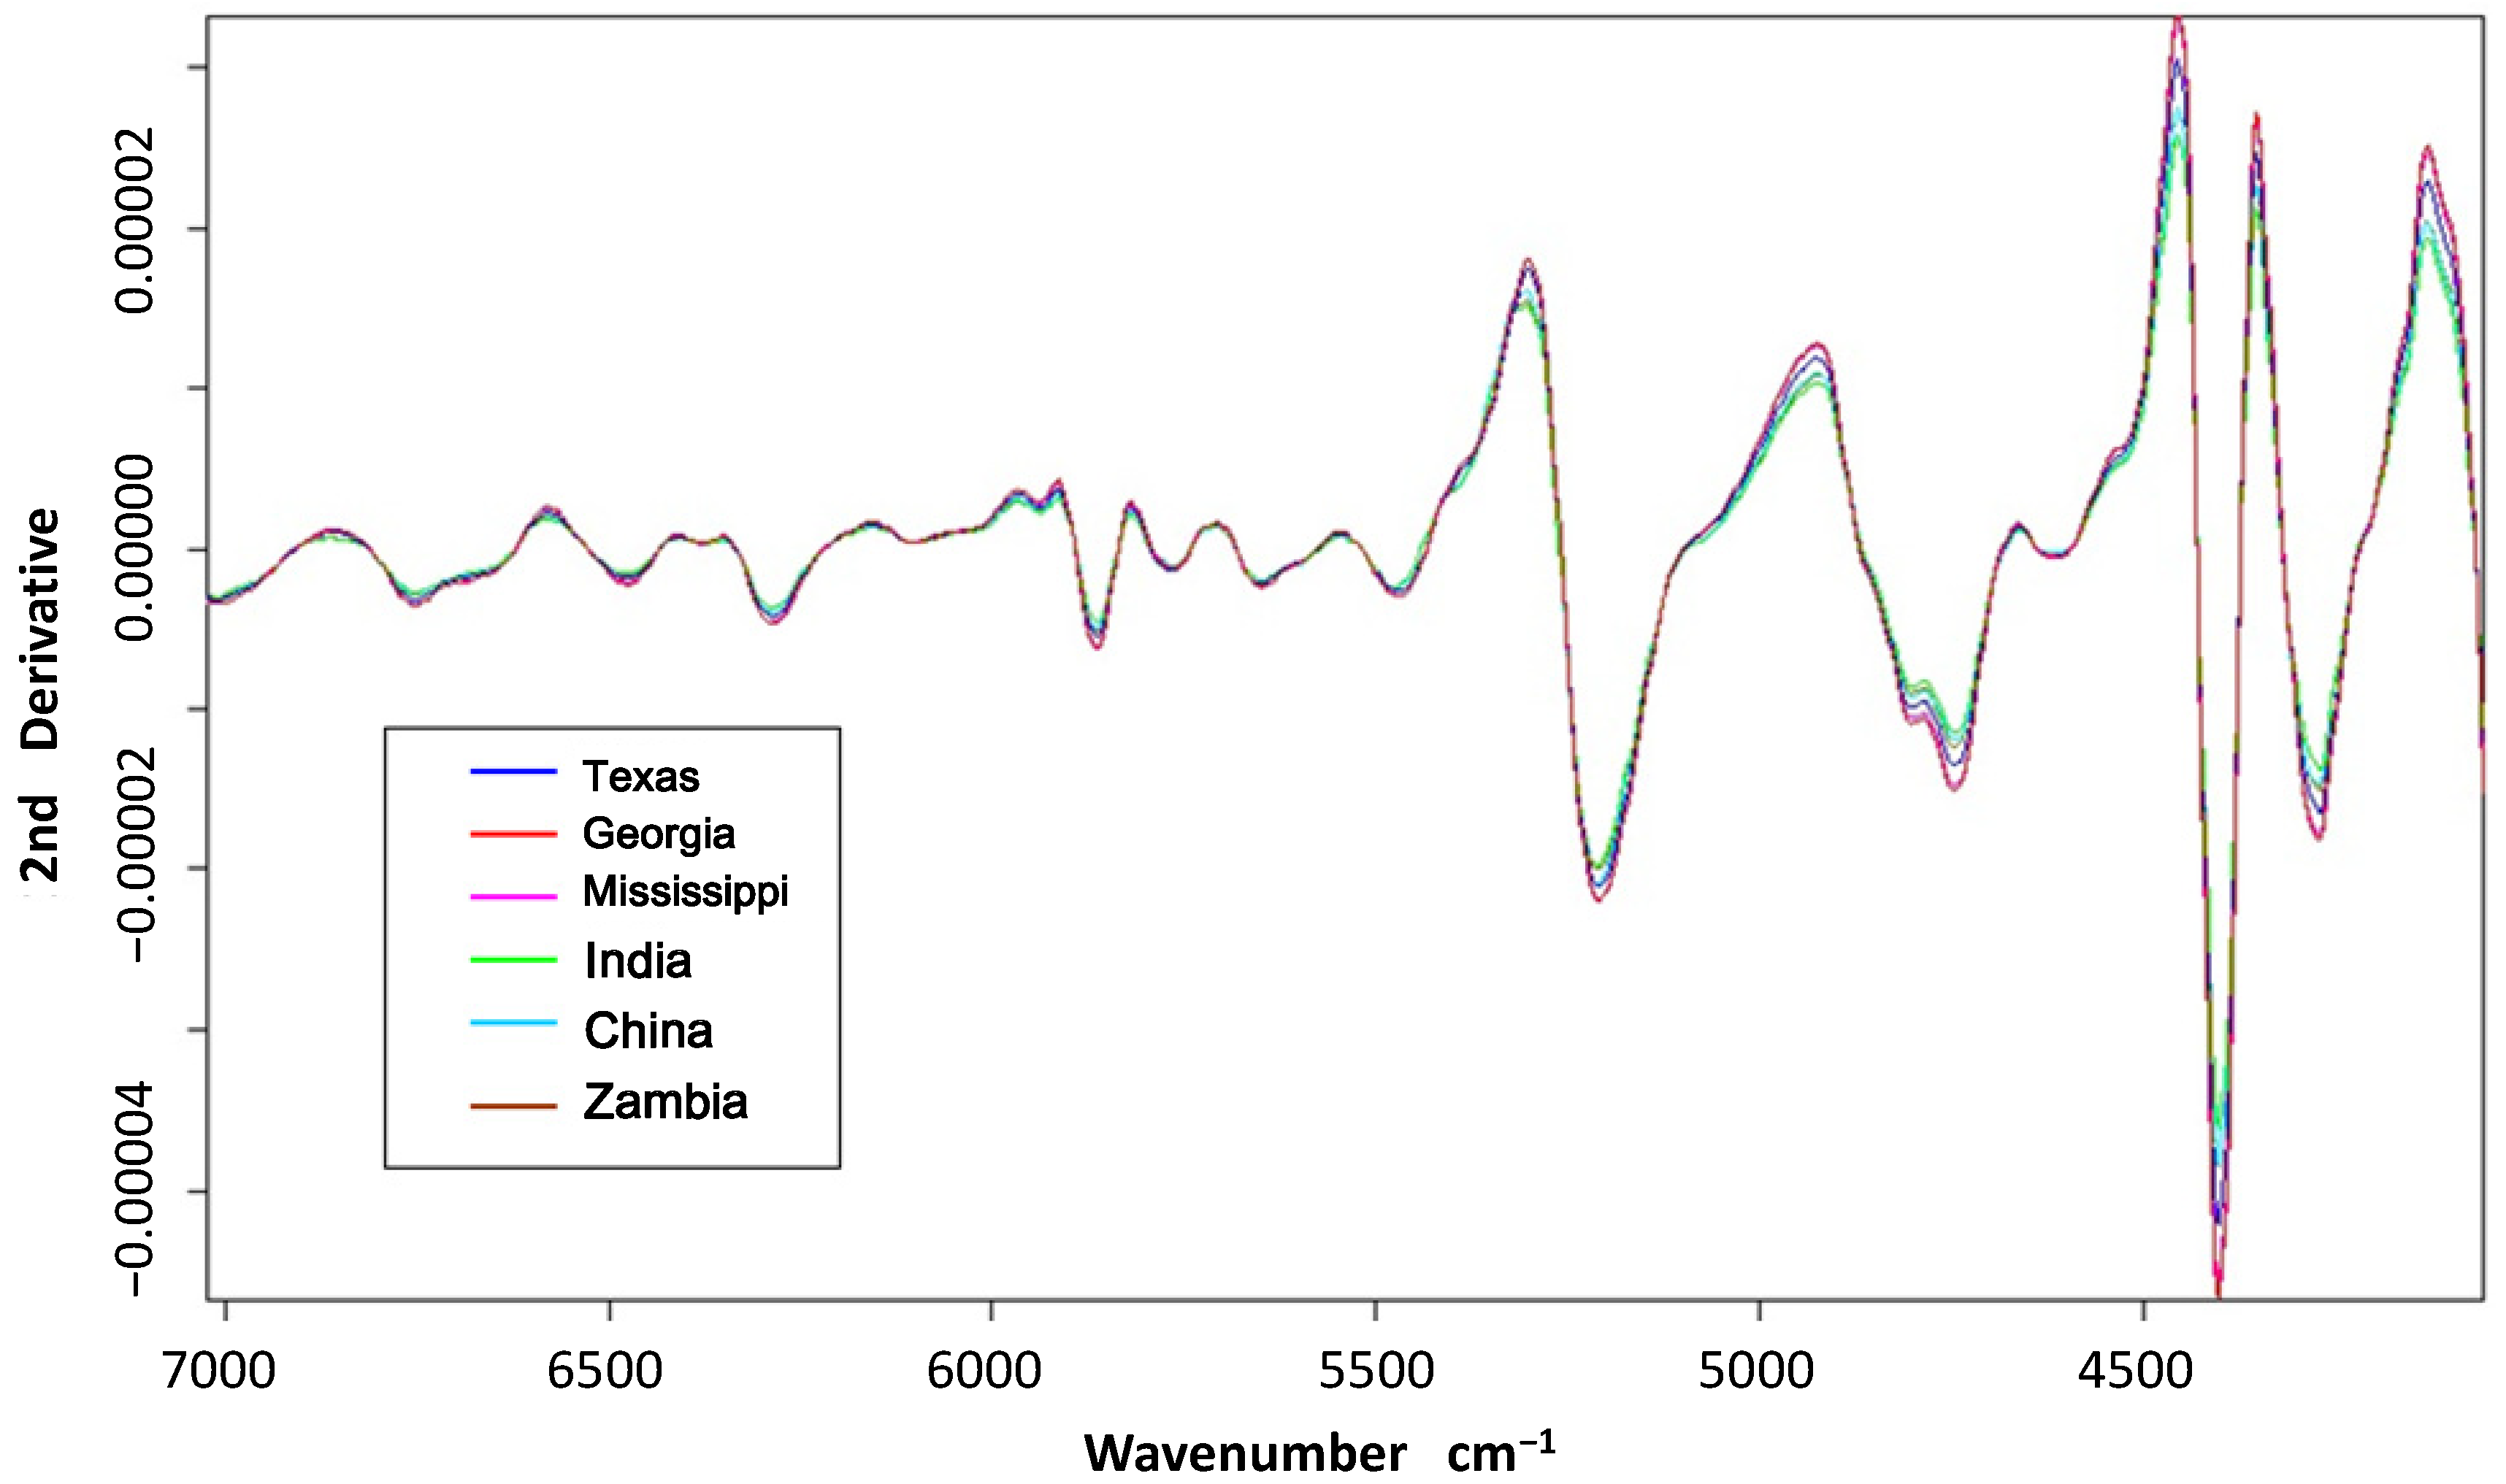
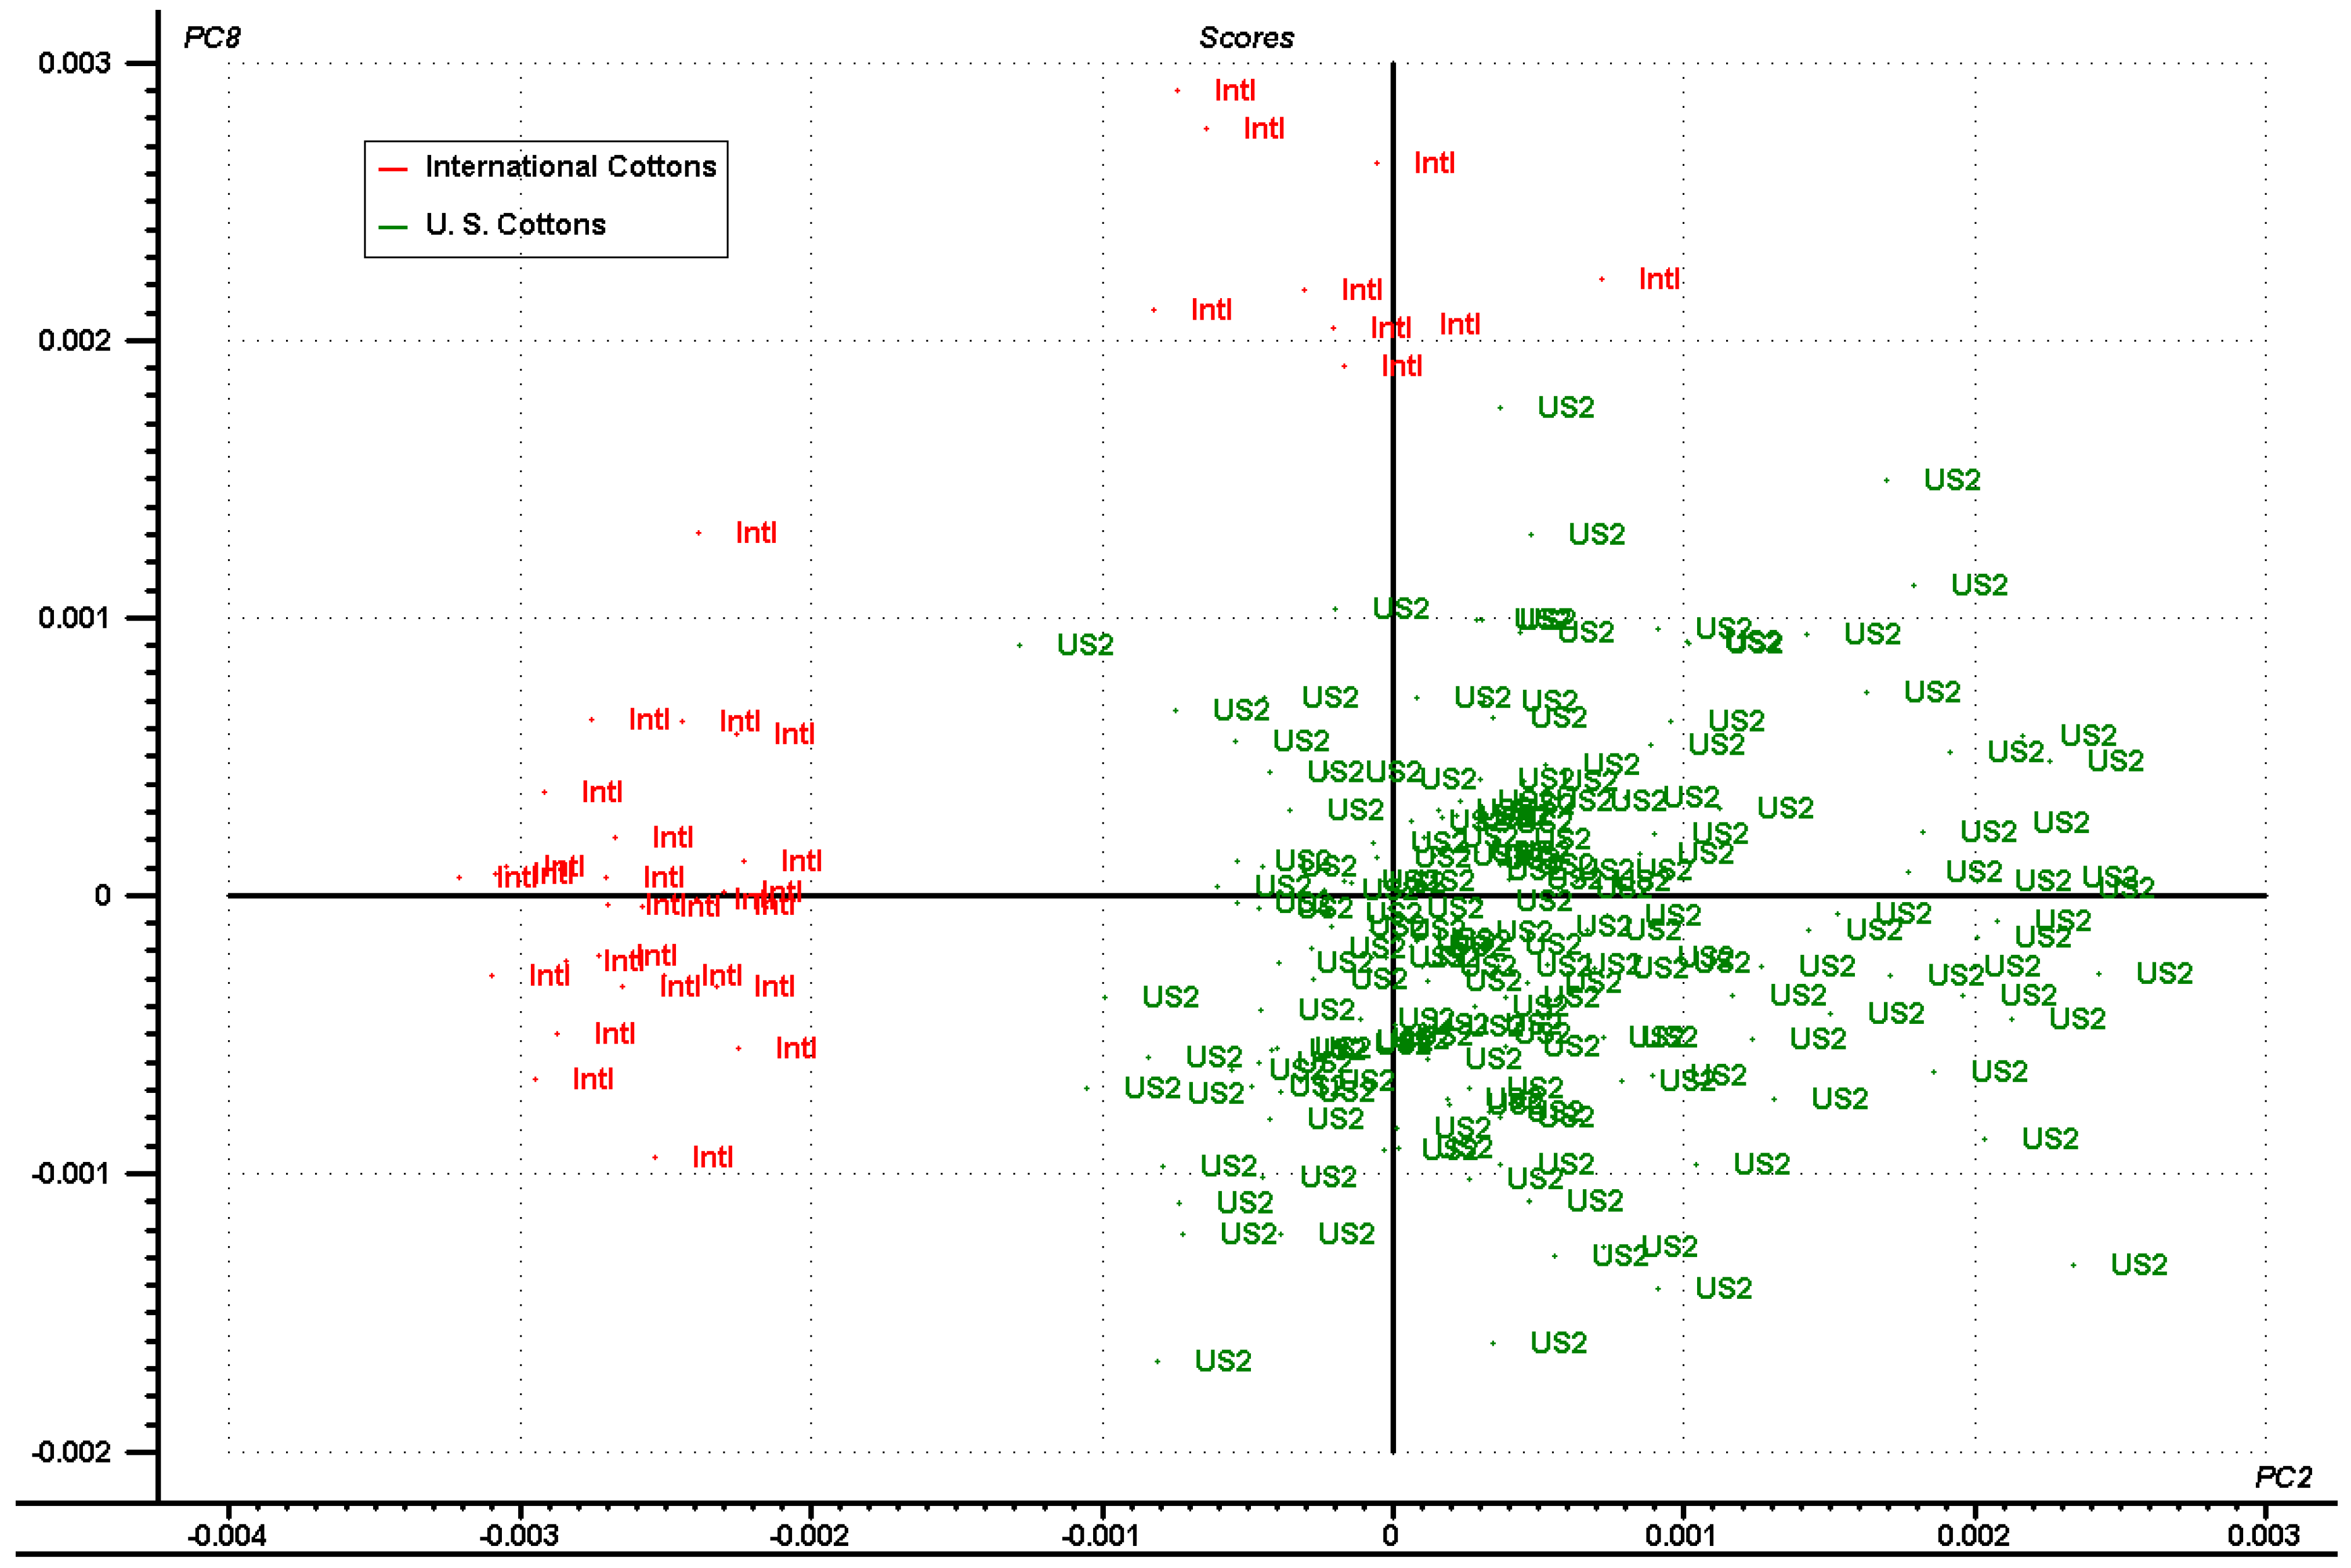
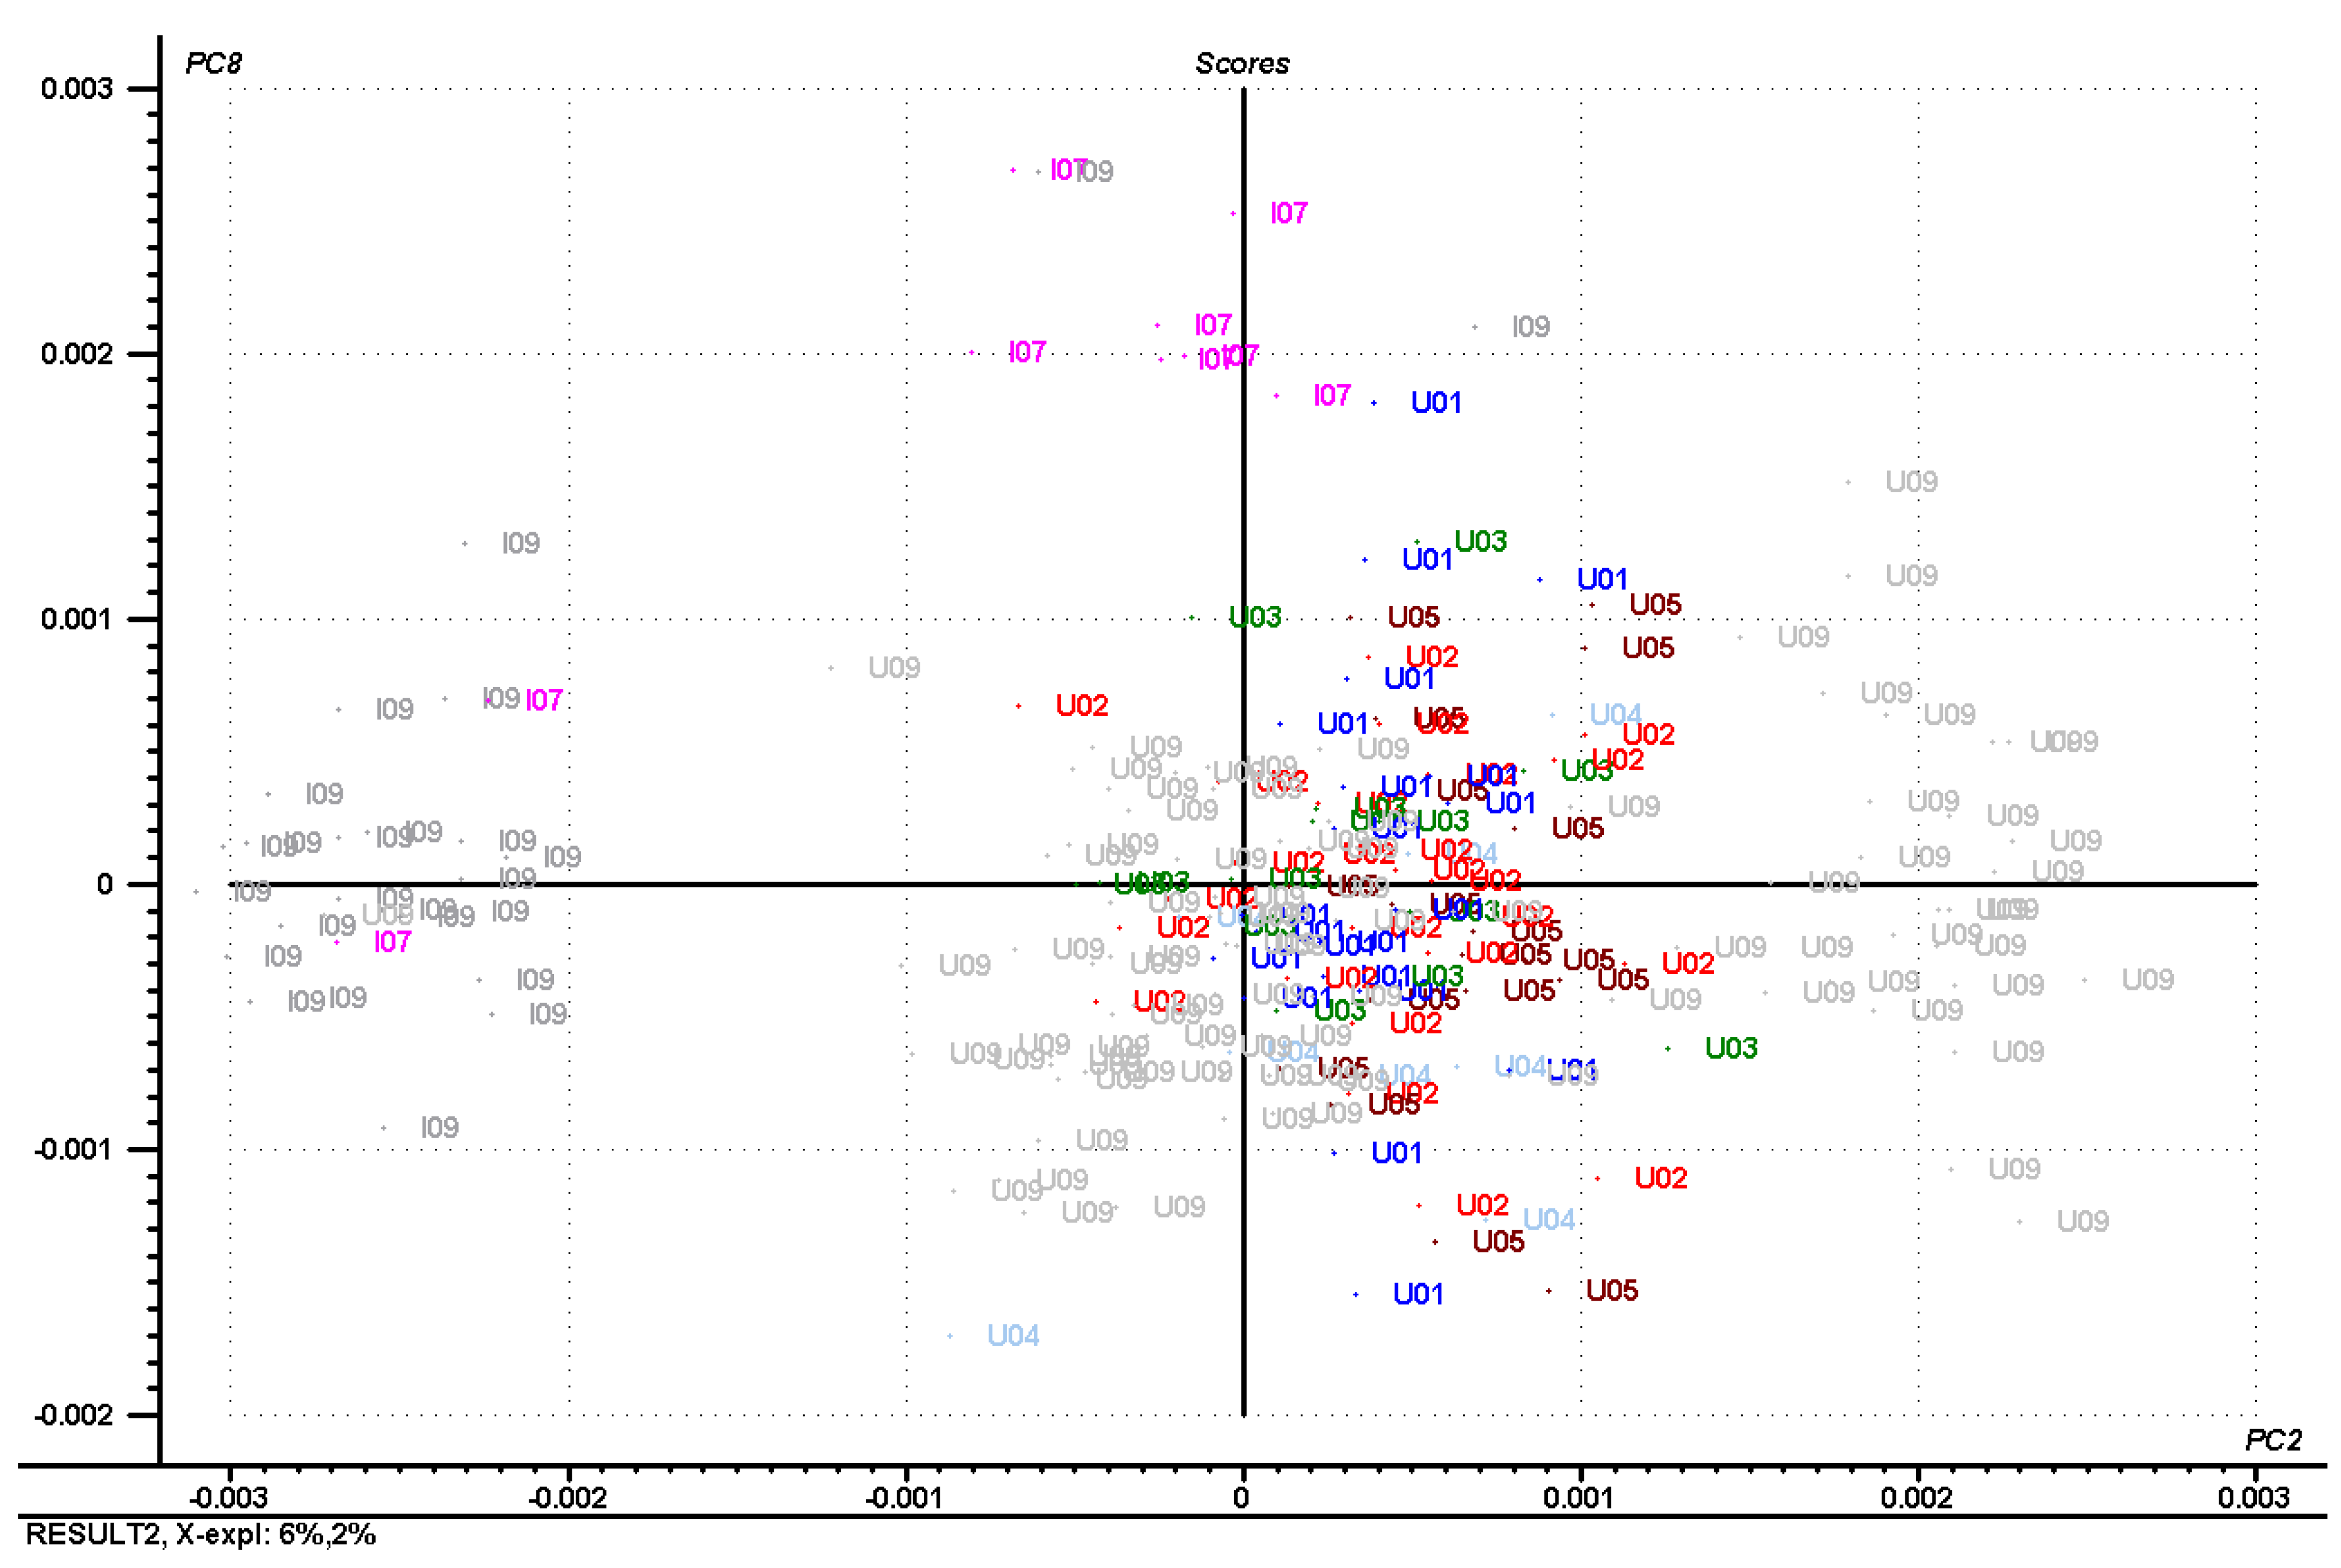
NIR Investigations

The NIR absorption spectra of several diverse international and domestic cottons are depicted in Figure 1. It is readily observed that the spectra are very similar, with potentially only minor spectral differences. This was to be expected based on the similar molecular makeup of the foreign and domestic cottons. The pre-processing manipulations attempting to separate the international and U.S. cottons were applied using the NIR absorbance spectra and the Bruker OPUS IDENT software program. OPUS IDENT software allowed for the creation of spectral libraries and sub-libraries, which could separate out sample spectral data. Based on our previous success of uniquely-identified cotton fiber and trash components frequently found comingled with cotton lint, the OPUS IDENT software was explored to try and classify U.S. and international cottons.
Figure 1. Representative NIR absorbance spectra of U.S. and international cottons.
Fibers 02 00264 g001
In order to obtain a robust OPUS IDENT spectral library of foreign and U.S. cottons, many samples had to be included. Thus, 122 samples of U.S. cottons were included in the calibration set, and 42 samples were included in the U.S. cotton prediction set. For the international cottons, 40 samples were included in the calibration set and 14 samples were included in the prediction set. In the U.S. sample sets, cotton samples were from Mississippi, Louisiana, Georgia and Texas. Representative samples included in the foreign cotton sample sets were India, China, Zambia, Paraguay, Pakistan and Zimbabwe, among others. In the spectral library, threshold values were calculated for the domestic and foreign cottons. These threshold values were calculated based on statistical measurements of the spectra. These statistical measurements, including calculating the Euclidean distances, were aimed at limiting the variability between reference spectra of different groups, while capitalizing on the similarities that existed between spectra in a specific group. The Euclidean distance was a measure of the similarity between the calibration spectra of a specific group in the library. In effect, calculating the Euclidean distances set up the confidence limit of the threshold values. If the individual reference spectra were below the confidence limit of the average reference spectra for a certain group (“hit quality”), the individual spectrum was said to be a member of that group. After the thresholds were determined for each respective group in the library, validating the library was necessary to determine how well the library members are separated [28]. All data points were included, and consequently, no data were considered as outliers.
Pre-processing of the spectral data is often performed to enhance minute/slight differences between samples. Many pre-processing methods were explored, including vector normalization, derivative math, as well as combinations of these two manipulations. Figure 2 depicts a representative group of spectra where second derivative math pre-processing was applied. Again, like the NIR absorbance spectra, minor differences were observed, but much spectral overlap and similarities between the foreign and domestic samples was also observed.
Figure 2. Representative NIR second derivative spectra of international and U.S. cottons.
Fibers 02 00264 g002
Thus, this OPUS IDENT method alone did not successfully classify domestic and foreign cottons due to the high spectral similarity of the NIR spectra. Thus a new method that could uniquely identify U.S. cottons from international cottons was investigated.
Principal component analysis was then applied to the NIR spectra as depicted in the score plot in Figure 3. The U.S. cottons are labeled US2, and the international cottons are labeled Intl. Based on this score plot, complete separation of international and U.S. cotton was observed. The principal component axes represented were eight and two. It appears that there are two groups of international cottons and one large group of U.S. cottons. Since the NIR OPUS IDENT spectral library could not be used to explain these differences observed with the PCA analysis, other explanations were explored.
Figure 3. PCA score plot of international (Intl) and U.S. (US2) cottons separated using NIR spectra with Norris gap second-derivative pre-processing.
Fibers 02 00264 g003
Figure 4 shows group separations of domestic and international cottons based on crop year. The U.S. cottons are represented by crop year 2001 (U01), 2002 (U02), 2003 (U03), 2004 (U04), 2005 (U05) and 2009 (U09). The international cottons are represented by crop years 2007 (I07) and 2009 (I09). As can be seen in Figure 4, I09 is along the western axis (PC2), I07 is located at the northern y-axis (PC8) and U09 exists along the eastern and center axes (PC2). In addition, a cluster of samples exist between the center and western axis. However, these distinctions were not definitive. Therefore, seed crop years are not the defining factor for the separation of the foreign and domestic groups due to the overlap observed for these groups. Thus, to further elucidate potential sources for these observed separations/differences, the impact of standard fiber physical property measurements were performed on all samples.
Figure 4. PCA score plot of international cottons (I07 and I09) and U.S. cottons (U01, U02, U03, U04, U05 and U09 separated by crop year for NIR data with Norris gap second-derivative pre-processing.
Fibers 02 00264 g004
The physical properties and contaminants were analyzed using the Uster® Advanced Fiber Information System (AFIS) and Uster® High Volume Instrument (HVI). HVI and AFIS data for the domestic and international cottons were included in this study to investigate whether the country of origin of cottons can be determined using conventional techniques. The AFIS data are presented in Table 1. Briefly, representative AFIS parameters include seed coat nep count (SCN), mean length by number in inches (L(n)), coefficient of variation of mean length by number in % (L(n)CV), short fiber content by number in % (SFC(n)), mean length by weight in inches (L(w)), coefficient of variation of mean length by weight in % (L(w)CV), short fiber content by weight in % (SFC(w)), upper quartile length by weight in inches (UQL(w)) and visible foreign matter in % (VFM). A few minor differences in mean values were observed between the domestic cottons and the international cottons. For example, the AFIS numerical data suggest that the international cottons, on average, tend to have more trash/trash components (e.g., dust, VFM) associated with them. However, all samples were within one standard deviation for each AFIS fiber property. A closer look at the principal component relationships with the AFIS parameters was investigated. No clear trends were observed between trash/trash components and PC2 and PC8 (significant overlap).
An investigation of the potential relationships between HVI parameters and the NIR spectral principal components was performed. Table 2 shows the numerical HVI data for domestic and international cottons. Representative HVI parameters include the uniformity index (UI) and the upper half mean length (UHML). Overall, the international cottons had higher mean values for micronaire, short fiber index (SFI), Rd (brightness) and +b (yellowness) values. The U.S. cottons exhibited higher mean values for elongation, trash count and trash area. However, as observed for the AFIS data, all samples were within one standard deviation for each HVI fiber property. The AFIS trash data seem to be opposite that of the HVI trash data when comparing domestic and international cottons, and no clear characterization of domestic from foreign cottons was observed.
Table 1. Advanced Fiber Information System (AFIS) Data for U.S. and international cottons. Seed coat nep count (SCN), mean length by number in inches (L(n)), coefficient of variation of mean length by number in % (L(n)CV), short fiber content by number in % (SFC(n)), mean length by weight in inches (L(w)), coefficient of variation of mean length by weight in % (L(w)CV), short fiber content by weight in % (SFC(w)), upper quartile length by weight in inches (UQL(w)) and visible foreign matter in % (VFM).
ParameterU.S. cottonsInternational cottons
RangeMean ± SDRangeMean ± SD
Nep count12–1124212.77 ± 207.8457–527214.3 3 ± 78.73
SCN count0–3914.12 ± 11.208–7524.14 ± 12.70
L(n)0.55–1.170.86 ± 0.150.68–0.950.83 ± 0.06
L(n) CV8.9–6344.00 ± 13.0040.4–53.744.79 ± 2.80
L(n) SFC3–49.920.83 ± 128015.3–34.721.38 ± 4.05
L(w)0.76–1.271.03 ± 0.100.88–1.10.99 ± 0.05
L(w) CV20.3–44.6031.40 ± 6.5829.2–39.933.45 ± 2.14
L(w) SFC0.7–23.907.13 ± 5.114.3–14.67.61 ± 2.06
UQL (w)0.99–1.431.21 ± 0.081.07–1.321.18 ± 0.06
Trash count0–15638.93 ± 35.2811–27079.04 ± 59.47
Dust count6–836189.67 ± 170.5472–2189516.98 ± 484.16
VFM0.01–2.930.77 ± 0.670.2–6.371.73 ± 1.38
Fineness130.6–236174.60 ± 26.79151.8–199170.04 ± 10.33
Maturity Ratio0.7–1.070.91 ± 0.110.88–1.010.94 ± 0.03
Table 2. High Volume Instrument (HVI) data for U.S. and international cottons. UHML, the upper half mean length; UI, uniformity index; SFI, short fiber index; Rb, brightness value; +b, yellowness value.
ParameterU.S. cottonsInternational cottons
RangeMean ± SDRangeMean ± SD
Micronaire2.86–5.404.04 ± 0.633.73–5.374.52 ± 0.42
Maturity0.81–0.890.86 ± 0.020.86–0.910.88 ± 0.01
UHML1.04–1.211.12 ± 0.041.00–1.241.12 ± 0.06
UI80.66–85.3883.06 ± 0.9878.22–83.9482.05 ± 1.37
SFI6.12–11.327.74 ± 0.855.84–15.828.70 ± 2.15
Strength24.66–33.8629.47 ± 1.8922.76–31.6428.26 ± 1.96
Elongation4.12–10.056.08 ± 1.372.71–5.404.33 ± 0.65
Rd65.45–76.2671.86 ± 2.6168.59–82.3477.42 ± 3.62
+b6.72–12.949.01 ± 1.427.72–11.399.43 ± 0.75
Trash Count23.20–99.0056.03 ± 17.897.40–85.0033.69 ± 21.58
Trash Area0.34–1.380.79 ± 0.250.10–1.460.44 ± 0.36
Therefore, in this study, the observed NIR principal component separation between the international and domestic cotton were not a result of commonly-measured fiber properties and contaminants, based on HVI and AFIS results.

4. Conclusions

A program was implemented to determine the feasibility of applying NIR spectroscopy and chemometrics to classify cottons based on their production in the U.S. (domestic cottons) or outside the U.S. (international cottons). NIR spectroscopy and principal component analyses (PCA) were employed to determine the feasibility of separating a diverse set of cottons into “domestic” and “international” groupings. As a proof of concept, PCA analysis combined with second derivative pre-processing successfully separated and identified the domestic and international cottons. Crop year, HVI parameters and AFIS parameters were investigated to determine their effect on the separation of domestic and international cottons. None of these comparisons were successful at describing the complete separation of U.S. and international cottons.

Acknowledgments

The authors would like to acknowledge Mia Schexnayder-Davis and Karl Jackson in preparing and running all samples.

Author Contributions

The co-author, James Rodgers, contributed to this project by interpreting data and experimental results and writing various sections of this manuscript. The corresponding author ran the experiments and took the lead on writing the paper.

Conflicts of Interest

The authors declare no conflict of interest.

Disclaimer

The use of a company or product name is solely for the purpose of providing specific information and does not imply approval or recommendation by the United States Department of Agriculture to the exclusion of others.

References

  1. Joseph, M. Introductory Textile Science, 5th ed.; The Dryden Press: New York, NY, USA, 1986. [Google Scholar]
  2. AATCC Technical Manual. American Association of Textile Chemists and Colorists; Research Triangle Park: Morrisville, NC, USA, 2012. [Google Scholar]
  3. Farag, R.; Elmogahzy, Y.; Celikbag, Y. The Detection of Cotton Identity Theft: Evaluation of Product’s Durability. In Proceedings of the Beltwide Cotton Conference, New Orleans, LA, USA, 4–7 January 2010; National Cotton Council of America: Memphis, TN, USA, 2010; p. 1674. [Google Scholar]
  4. Elmogahzy, Y.; Farag, R. Developing Scientific Approaches for Preventing Cotton Variety Identity Theft; Annual Report; National Textile Center: Spring house, PA, USA, 2008. [Google Scholar]
  5. Burns, D. Modern Near Infrared Reflectance Analysis; ACS Short Course: New Orleans, LA, USA, 1985. [Google Scholar]
  6. Handbook of Near-Infrared Analysis, 2nd ed.; Burns, D.; Ciurczak, E. (Eds.) Marcel Dekker, Inc.: New York, NY, USA, 2001.
  7. Mirabella, F.M., Jr. Internal Reflection Spectroscopy; Marcel Dekker: New York, NY, USA, 1993. [Google Scholar]
  8. Perkampus, H. NIR Spectroscopy. In Encyclopedia of Spectroscopy; VCH: New York, NY, USA, 1993; pp. 387–388. [Google Scholar]
  9. Camajani, N.; Muller, D. Textile Analysis by FT-NIR: Fourier Transform near Infrared-Red Spectroscopy. In Proceedings of the Textile Applications of Near Infrared Technology: AATCC Symposium., Ramada Plaza Hotel, Asheville, NC, USA, 27–28 June 1996; pp. 1–12.
  10. Rodgers, J. Influences of carpet and instrumental parameters on the identification of carpet face fiber by NIR. Am. Assoc. Text. Chem. Color. Rev. 2002, 2, 27–32. [Google Scholar]
  11. Thibodeaux, D.P. NIR as a Tool for Measuring Cotton Quality. In Proceedings of the International Cotton Conference, Bremen, Germany, 12–14 March 1992; pp. 27–38.
  12. Montalvo, J.; Von Hoven, T. Chapter 25: Analysis of cotton. In Near-Infrared Spectroscopy in Agriculture; Agronomy Monograph No. 44, 67; Roberts, C., Workman, J., Reeves, J., Eds.; American Society of Agronomy: Madison, WI, USA, 2004; pp. 671–728. [Google Scholar]
  13. Ghosh, S.; Rodgers, J. NIR analysis of textiles. In Handbook of Near-Infrared Analysis, 3rd ed.; Burns, D., Ciurczak, E., Eds.; CRC Press: Boca Raton, FL, USA, 2008; pp. 485–520. [Google Scholar]
  14. Liu, Y. Vibrational spectroscopic investigation of Australian cotton cellulose fibres. Part 1. A Fourier transform Raman study. Analyst 1998, 123, 633–636. [Google Scholar]
  15. Liu, Y. Vibrational spectroscopy investigation of Australian cotton cellulose fibres. Part 2. A Fourier transform near-infrared preliminary study. Analyst 1998, 123, 1725–1728. [Google Scholar]
  16. Montalvo, J.; Faught, S.; Buco, S. A comparative study of NIR diffuse reflectance of cottons grouped according to fiber cross-sectional dimensions. Part III: Experimental. Appl. Spectrosc. 1991, 45, 795–807. [Google Scholar]
  17. Rodgers, J.; Montalvo, J.; Davidonis, G.; Thibodeaux, D. Near infrared measurement of cotton fiber micronaire, maturity and fineness—A comparative investigation. Text. Res. J. 2010, 80, 780–793. [Google Scholar] [CrossRef]
  18. Rodgers, J.; Fortier, C.; Montalvo, J.; Cui, X. Near infrared measurement of cotton fiber micronaire by portable near infrared instrumentation. Text. Res. J. 2010, 80, 1503–1515. [Google Scholar] [CrossRef]
  19. Rodgers, J.; Kang, S.; Fortier, C.; Cui, X.; Davidonis, G.; Clawson, E.; Boquet, D.; Pettifrew, W. Preliminary field measurement of cotton fiber micronaire by portable NIR. Spectrosc. 2010, 25, 38–44. [Google Scholar]
  20. Thomasson, J.; Shearer, S. Correlation of NIR data with cotton quality characteristics. Trans. ASAE 1995, 38, 1005–1010. [Google Scholar] [CrossRef]
  21. Rodgers, J.; Beck, K. Rapid Determination by NIR of the Cotton Content of Blend Fabrics after Dyeing. In Proceedings of the Beltwide Cotton Conferences, New Orleans, LA, USA, 4–7 January 2005; pp. 2731–2736.
  22. Tincher, W.; Luk, A. NIRS analysis of cotton/polyester yarns. Text. Chem. Color. 1985, 17, 25–29. [Google Scholar]
  23. Fortier, C.; Rodgers, J.; Santiago Cintron, M.; Cui, X.; Foulk, J. Identification of cotton and cotton trash components by Fourier transform near-infrared spectroscopy. Text. Res. J. 2011, 81, 230–238. [Google Scholar] [CrossRef]
  24. Fortier, C.; Rodgers, J.; Foulk, J.; Whitelock, D. Near-infrared classification of cotton lint, botanical and field trash. J. Cotton Sci. 2012, 16, 72–79. [Google Scholar]
  25. Taylor, R. Cotton Trash and Contamination Measurements for Quality Classification using Near Infrared Reflectance. In Proceedings of the Beltwide Cotton Conference, Saint Louis, MO, USA, 6–10 January 1980.
  26. Thielemans, A.; Massert, D.L. The use of principal component analysis as a display method in the interpretation of analytical chemical, biochemical, environmental, and epidemiological data. Chimia 1985, 39, 236–242. [Google Scholar]
  27. Gemperline, P. Practical Guide to Chemometrics, 2nd ed.; CRC Taylor and Francis Group: Boca Raton, FL, USA, 2006. [Google Scholar]
  28. Tabachnick, B.G.; Fidell, L.S. Using Multivariate Statistics; Harper and Row, Publishers, Inc.: New York, NY, USA, 1983. [Google Scholar]
  29. Bruker Optics. IDENT Software Instruction Manual; Bruker Optics: Billerica, MA, USA, 2004. [Google Scholar]

