Article

Fabrication and Characterization of Polymer Optical Fibers Doped with Perylene-Derivatives for Fluorescent Lighting Applications

1
Department of Applied Physics I, University of the Basque Country (UPV/EHU), Engineering School of Bilbao, Plaza Ingeniero Torres Quevedo, 1, E-48013 Bilbao, Spain
2
Department of Applied Mathematics, University of the Basque Country (UPV/EHU), Engineering School of Bilbao, Rafael Moreno “Pitxitxi” 3 Pasealekua, E-48013 Bilbao, Spain
3
Institute of Microelectronic Technology, University of the Basque Country (UPV/EHU), Engineering School of Bilbao, Plaza Ingeniero Torres Quevedo, 1, E-48013 Bilbao, Spain
4
Department of Communications Engineering, University of the Basque Country (UPV/EHU), Engineering School of Bilbao, Plaza Ingeniero Torres Quevedo, 1, E-48013 Bilbao, Spain
5
Instituto de Ciencia y Tecnología de Polímeros, Consejo Superior de Investigaciones Científicas (ICRP-CSIC), Juan de la Cierva 3, 28006 Madrid, Spain
*
Author to whom correspondence should be addressed.
Fibers 2017, 5(3), 28; https://doi.org/10.3390/fib5030028
Submission received: 23 June 2017 / Revised: 21 July 2017 / Accepted: 25 July 2017 / Published: 31 July 2017
(This article belongs to the Special Issue Fabrication of Special Optical Glass and Polymer Fibres)

Abstract

:
Four different dye-doped polymer optical fibers (POFs) have been fabricated following a two-step fabrication process of preform extrusion and fiber drawing, using poly-(methyl methacrylate) (PMMA) as host material and dye derivatives from perylene and naphtalimide as active dopants. The side illumination technique (SIT) has been employed in order to determine some optical properties of the fabricated fibers, such as the side illumination coupling efficiency, optical loss coefficients, and their performance under solar simulator excitation. The aim of this work is to investigate the performance of the manufactured fibers for fluorescent lighting applications, specially targeting on fluorescent fiber based solar concentrators.

1. Introduction

POFs are well known in the field of short-range data transmission links and in a wide variety of sensing applications, due to their photo-mechanical properties. They are lightweight, thin, and flexible, which permits easy manipulation by the user [1,2]. Moreover, the waveguide structure provides several advantages in comparison to bulk material, such as optical confinement in the core, easy coupling to fiber-optic communication links and symmetric output of the beam profile. The possibility of embedding dopant molecules with large absorption and emission cross-sections into polymer hosts, such as PMMA and polystyrene (PS), makes doped POFs ideal for the generation and amplification of intense light, and therefore, suitable for achieving efficient fluorescent lighting applications in the visible region [3,4,5,6,7]. Recently, nanoscale polymeric fibers, with diameters comparable or even smaller than the wavelength of light, are being studied for novel application in the field of nanophotonics. These nanofibers, manufactured using fabrication techniques such as electrospinning, have been gaining great attention due to their potential as reduced photonic structures [8,9,10,11,12,13,14,15].
In recent years, the need for collecting sunlight in an efficient and, especially, economical way has become one of the main goals of the photovoltaic-energy research field. Recent studies showed that the concentration of light using layers of transparent medium containing luminescent species could possibly be a good approach [16]. However, the main drawback of the conventional planar luminescent solar concentrators (LSC) lies in the limitation in the coupling between the fluorescent layer and the solar cells, and in the difficulty in wiring for light transportation. In order to overcome these disadvantages, a new concept of LSC based on fluorescent doped-POFs appears to be a competent solution: fluorescent fiber solar concentrator (FFSC). The cylindrical geometry of the fibers permits an easy coupling to solar cells or to other passive fibers for light guiding, which allows spatial separation between the light harvesting system and the final light-to-electricity conversion system. Theoretical studies have been carried out involving comparisons between cylindrical and planar LSCs [17,18,19]. Doped polymeric nanofibers are also employed in order to improve the efficiency of the organic photovoltaic cells [20].
In order to achieve high light concentration efficiencies, some criteria should be met regarding the dopant material: broad absorption and emission bands with minimum reabsorption losses, near unity quantum yields (QY), and long-term stability [21]. Some organic dyes, such as derivatives from perylene dye, exhibit near unity QY and have been demonstrated to be long-term stable in PMMA [22,23,24]. However, few studies in fibers with different dopants have been carried out yet [25,26].
Motivated by the aforementioned scenarios, this paper provides an overview of the fabrication process of four polymer optical fibers doped with perylene and naphtalimide derivatives, and a characterization of the optical properties of the manufactured fibers, focusing on their possible fluorescent light applications, with especial attention to their potential as FFSC. In this work, the materials and methods employed for the fiber fabrication are presented in detail, from the preform fabrication to the fiber drawing process, and an analysis of the optical properties of the fabricated four dye-doped fibers is shown. It has been demonstrated that half of the light that reaches the fiber sideway is coupled into it, leading to side illumination coupling efficiencies of around 50%. The optical attenuation curves have also been measured, obtaining values of 0.05 cm−1 for one of the samples, being comparable to those previously reported in dye-doped fibers. Finally, a study of the power-saturation fiber length and of the photo-stability of the fibers has been carried out, demonstrating interesting results for FFSC applications.

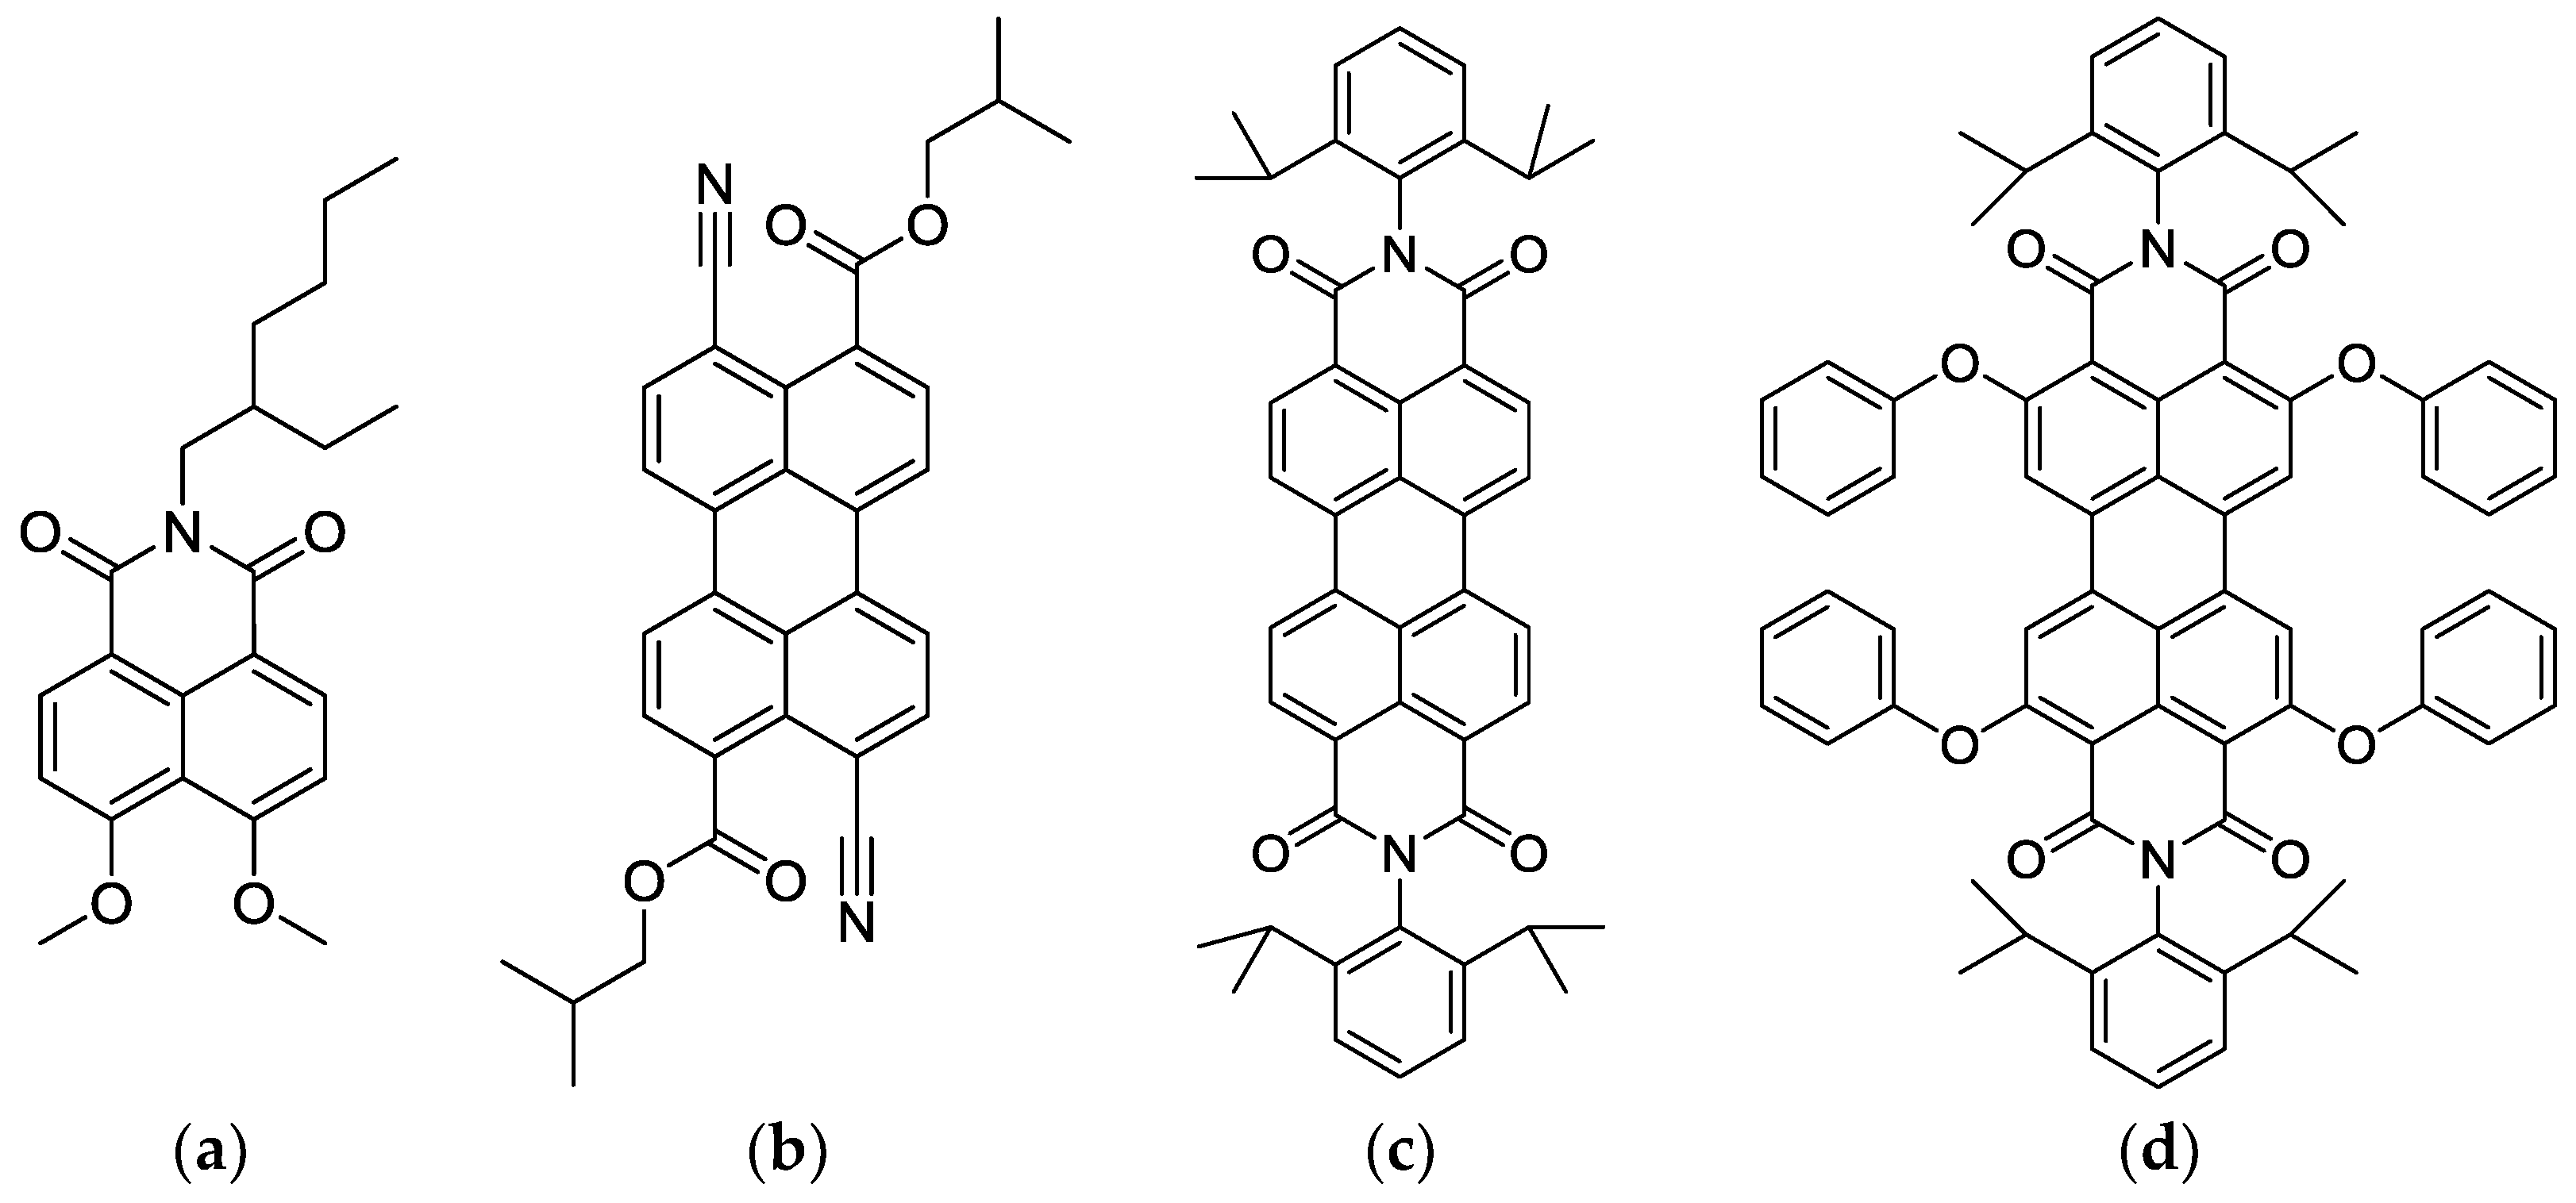
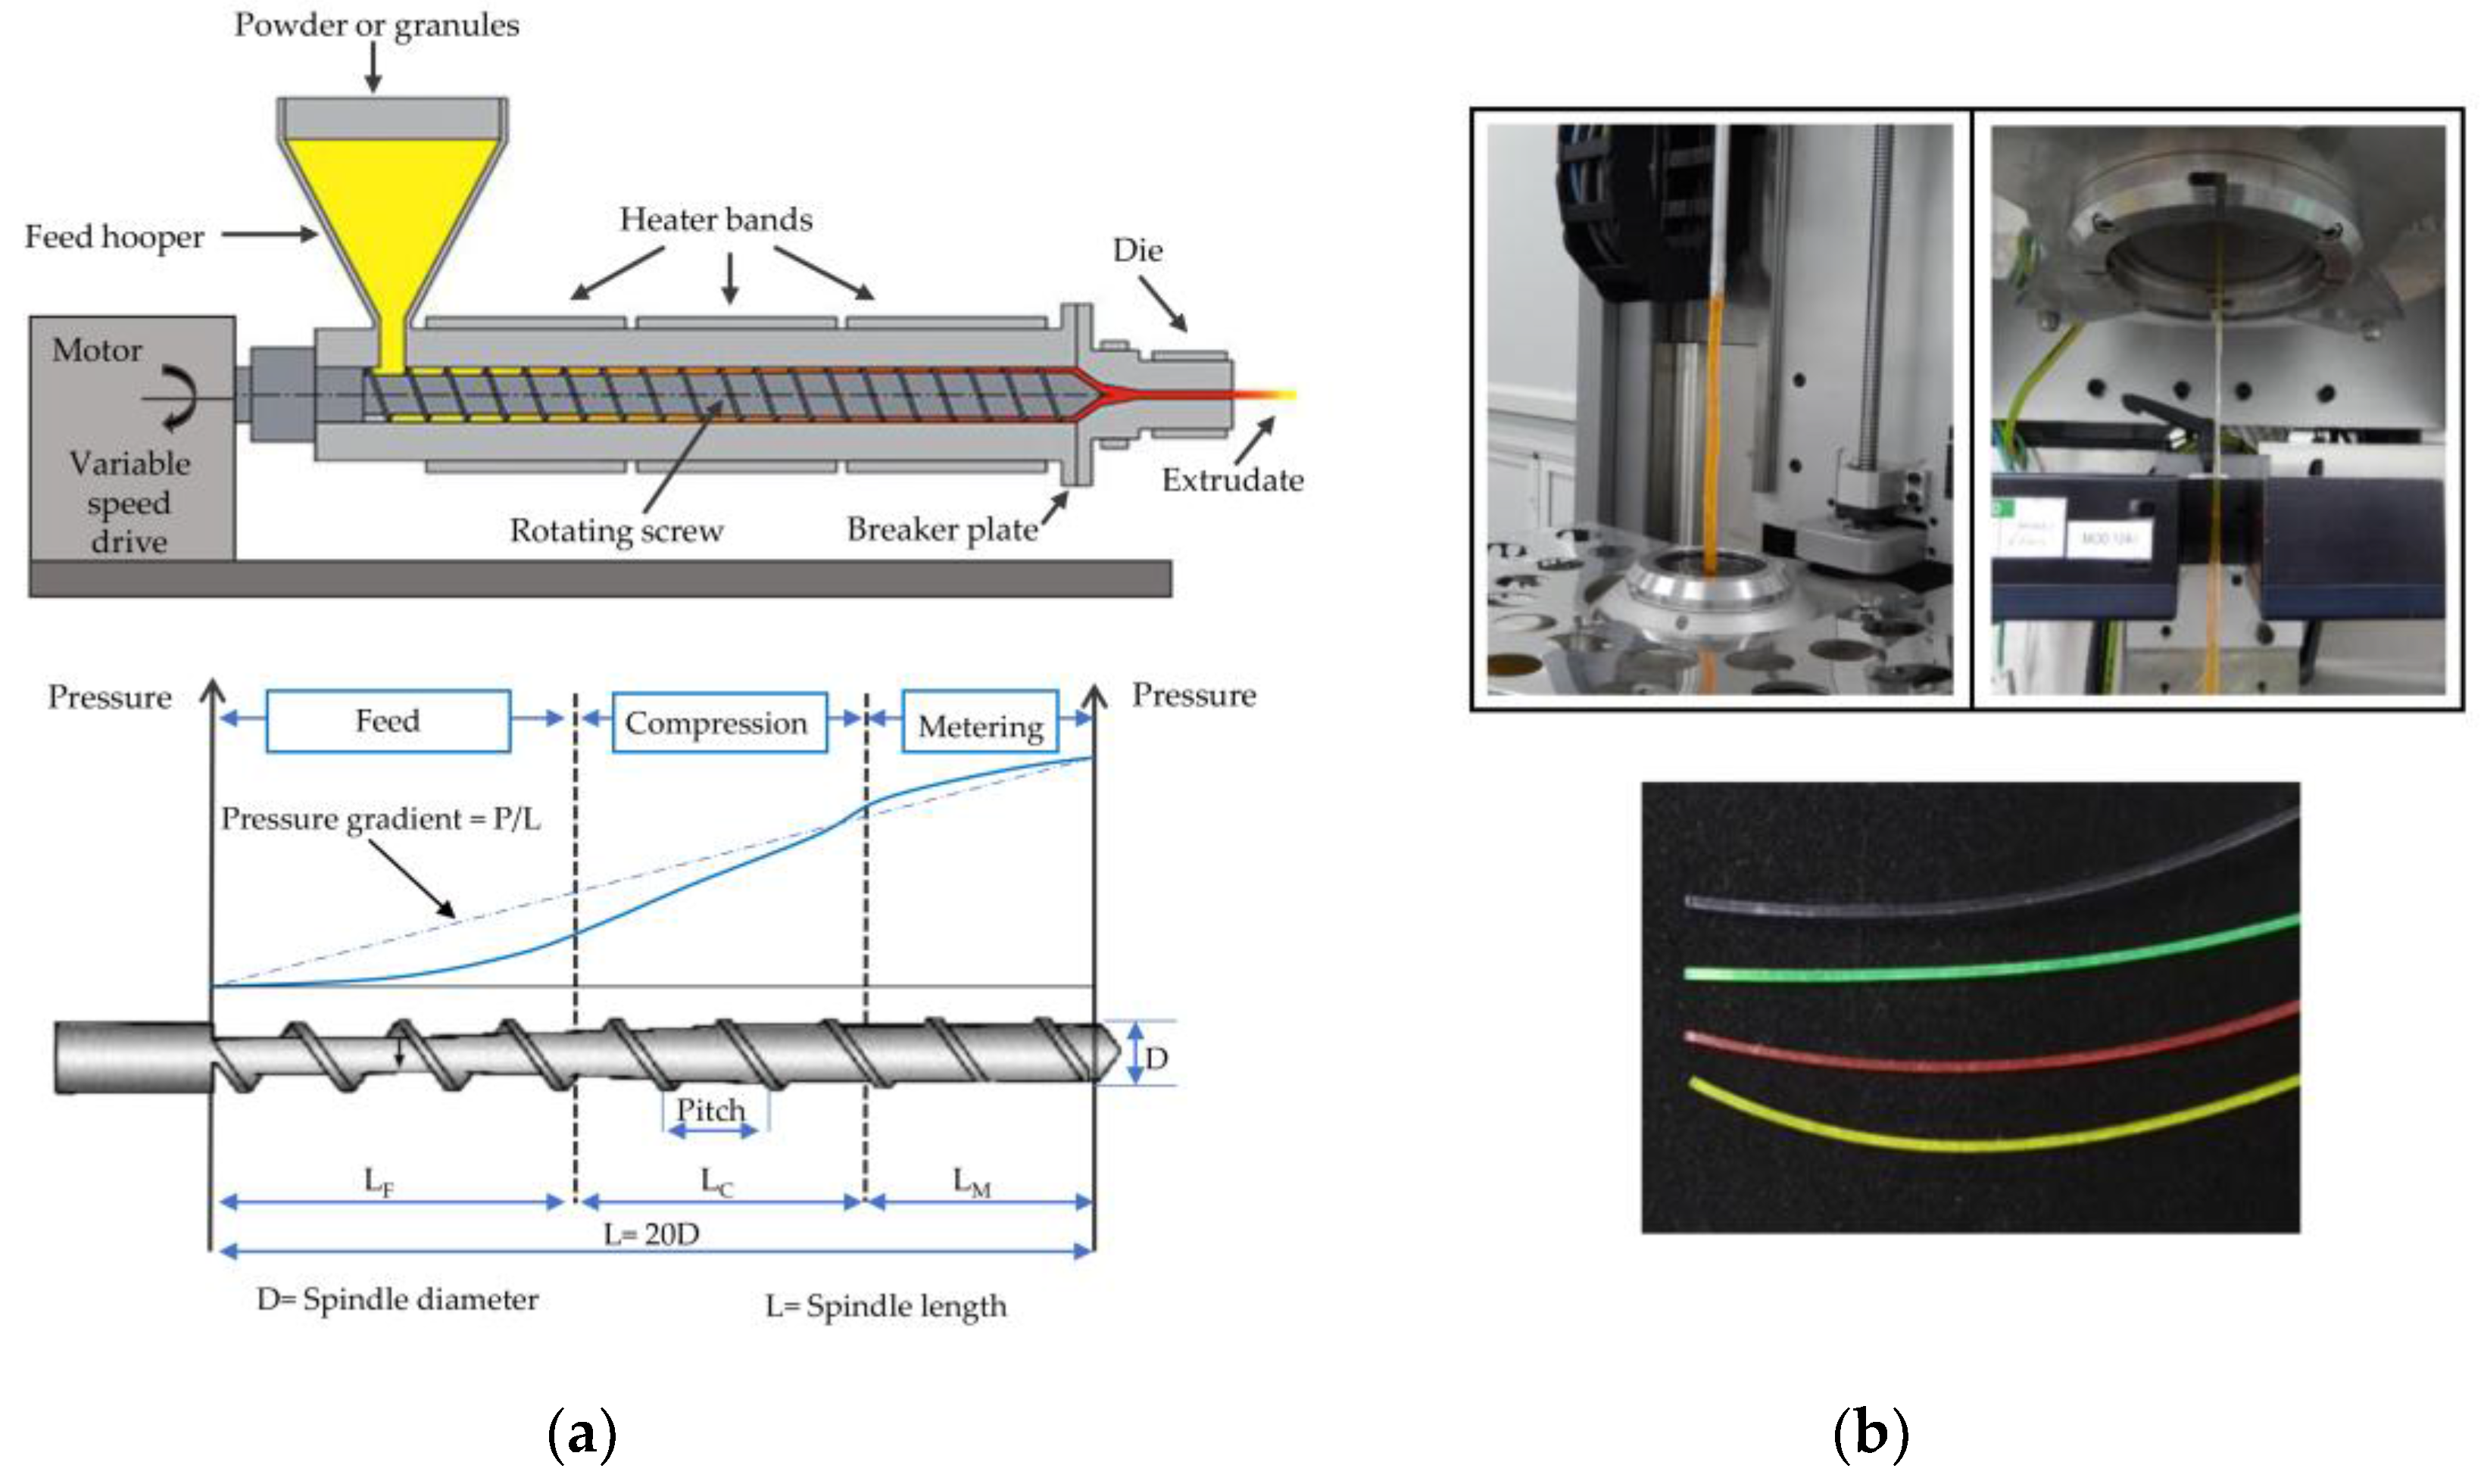
2. Materials and Methods

Commercial PMMA, obtained from Atochem, was used for the fabrication of the preforms. PMMA is an appropriate material for the fabrication of polymer preforms since it has very low oxygen permeability, and, thus, it is suitable for avoiding photochemical degradation. The PMMA sample was purified using tetrahydrofuran (THF, Scharlau, Barcelona, Spain) as solvent and water as precipitating agent. After that, it was washed in methanol and dried under vacuum pressure at 40 °C for 48 h. THF was distilled under nitrogen, with aluminum lithium hydride (Sigma-Aldrich, Madrid, Spain) to remove peroxides immediately before use.
The molecular weight distribution was measured by size exclusion chromatography (SEC) using a chromatographic system (515 Waters Division, Milford, MA, USA) equipped with a Waters Model 410 refractive index detector. THF was used as eluent at a flow rate of 1 mL/min operated at 35 °C. Styragel packed columns—HR1, HR3, HR4E, and HR5E (Waters Division)—were employed. PMMA standards (Waters Division) in a range between 3 × 10³ g/mol and 1.4 × 10⁶ g/mol were used to calibrate the columns. For measuring the glass transition temperature (Tg), a differential scanning calorimeter (DSC) was employed. About 11 mg of PMMA sample was placed on an aluminum pan and put on a hot plate (170 °C, N2) where it was maintained for 10 min to erase previous thermal history; it was then cooled to 50 °C at a fast rate (40 °C/min) and performed a heating DSC run from 50 °C to 170 °C at 10 °C/min. The values of the molecular Tg, Mn, Mw, and polydispersity (PDI) are gathered in Table 1.
Four different active dyes, three derivatives of perylene, and one derivative of naphtalimide were physically incorporated into the previously prepared fully polymerized PMMA matrix, namely, Lumogen F Violet 570 (LV), Lumogen F Yellow 083 (LY), Lumogen F Orange 240 (LO), and Lumogen F Red 305 (LR) (Figure 1). The dyes were obtained from BASF and the concentration was 0.003 wt % in all cases. The preforms were produced by an extrusion process, where the doped material is fed into the reaction chamber of a homemade extruder (see Figure 2a). There, it is melted at 165 °C and, then, directed to the screw extruder. The material is pushed through a small nozzle, and, finally, the preform is generated with a diameter value of 11 mm. The performs were annealed over 14 days in a C-70/200 climate temperature system before drawing to 1 mm diameter only-core fibers using our POF-drawing-tower at a maximum furnace-temperature of 185 °C. The fiber-preform, precisely centered, was continuously fed into a circular resistive furnace at a fixed speed of 2 mm/min, with a resultant tension of 70 g. This process yielded homogeneous fiber at the output. The diameter of the resultant fiber was measured and monitored by the control unit of the drawing tower. The maximum diameter deviation kept below 7%. The fiber samples were cut into pieces of 20 cm–25 cm, and their ends were carefully hand-polished using polishing papers. In Figure 2, a schematic of the extrusion process, two photographs of the preform in the drawing tower, and a photograph of the four dye-doped fibers are shown.
Throughout all the experiments carried during the characterization of the fibers, the samples have been transversally pumped using the SIT. This technique is a non-destructive method that allows a wide range of measurements such as optical loss measurements and a characterization of the propagation distance effects. A tunable ultrafast femtosecond laser (Mai Tai HP, wavelength range 690 nm–1040 nm, 80 MHz repetition rate and 1.2 mm of spot diameter) (Spectra Physics, Santa Clara, CA, USA) with a frequency doubler (Inspire Blue, Radiantis, Spectra Physicis) was used for exciting the samples. The emitted output spectra were recorded using a fiber-optic spectrometer (USB4000, optical resolution of 1.5 nm of full width at half maximum) (Ocean Optics, Dunedin, FL, USA). A broadband (190 nm–2100 nm) laser-driven light source (EQ-99-FC LDLS, Energetiq, Woburn, MA, USA) was employed for side illumination coupling efficiency measurements. For measuring the output power value at one of the fiber ends, a silicon photodetector (818-SL/DB, Newport, Irvine, CA, USA) was used. The values were corrected, employing its responsivity curve. The absorption spectra were measured at room temperature employing a Cary 50 UV–Vis spectrometer (Agilent, Santa Clara, CA, USA) equipped with a fiber optic accessory. A schematic of the experimental set-up of the side illumination excitation is shown in Figure 3.
In order to characterize the sample response under sunlight, a halogen lamp (Haloline Eco, Osram, Munich, Germany) was used as excitation source, providing a spectrum corresponding to a black body temperature of 2950 °C. The sample is placed perpendicularly at a distance of 36 cm that ensures uniformity at an area larger than 20 × 20 cm2. In the 400 nm–1100 nm range, the sample receives a power density of 0.38 kW/m2, which is similar to one half of a standard one-sun AM1.5d illumination in that region.

3. Results and Discussion

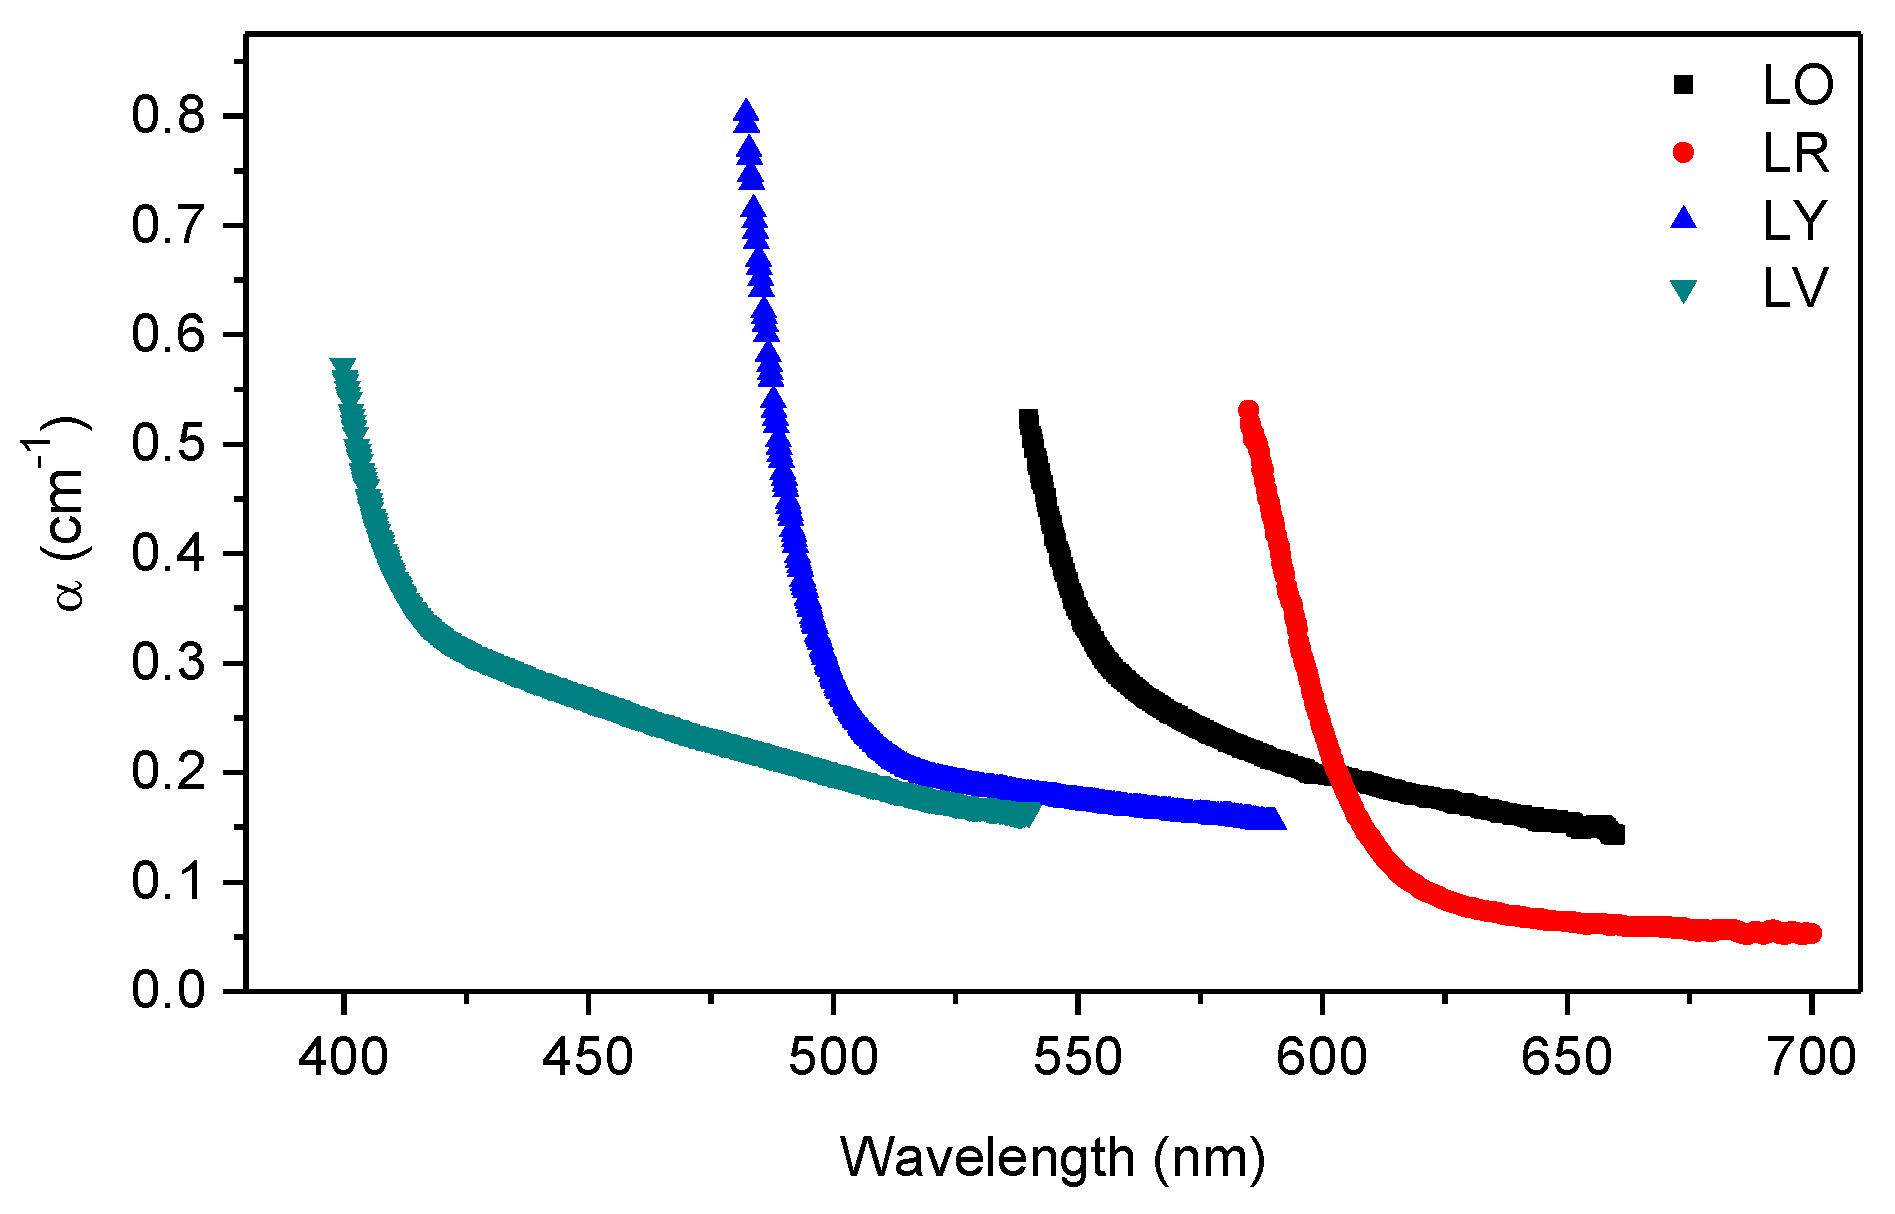
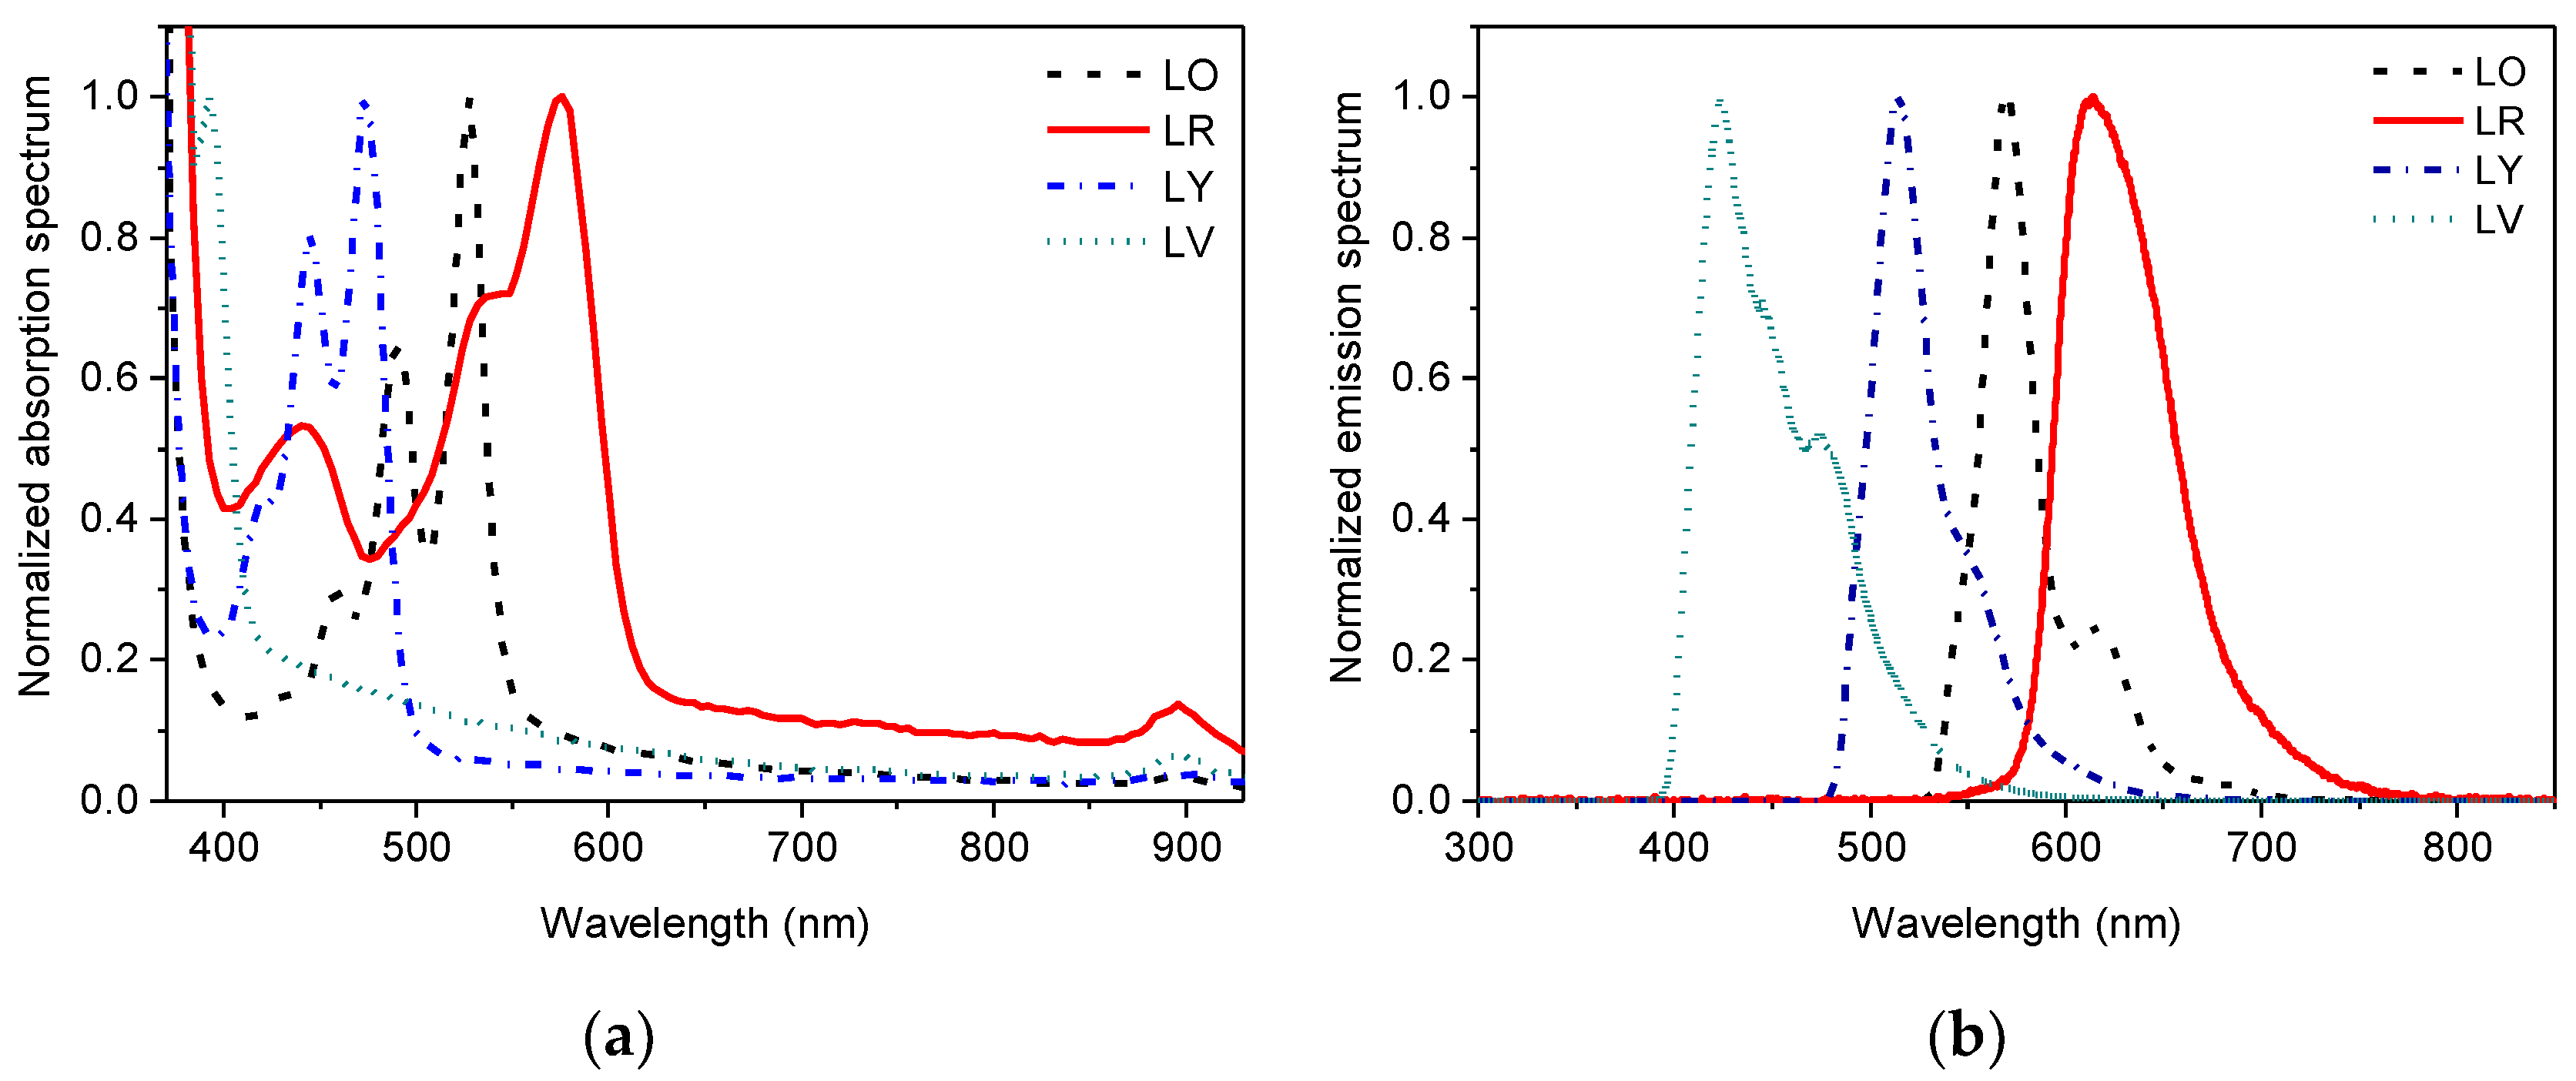
3.1. Absorption and Emission Bands

In Figure 4, the absorption and emission spectra of the four fibers are shown. The absorption spectra were measured by employing fiber samples of around 1 cm in length so that the absorption bands of the dopants embedded in the fiber could be detected. On the other hand, the emission spectra were recorded exciting each of the fibers at their maximum absorption wavelength, except for the LR sample, which was excited at 520 nm due to the wavelength range limitation of the light source. The main absorption peaks for LV, LY, LO, and LR are located at 392 nm, 472 nm, 524 nm, and 575 nm respectively, and the emission peaks are shown at 423 nm, 515 nm, 571 nm, and 613 nm. A small absorption band at around 900 nm should be noted, which is due to the PMMA matrix. These lumogen-doped fibers present broad absorption bands, making a wide wavelength range suitable to be converted to higher wavelengths. Also, they exhibit broad emission bands, therefore they enable high conversion power values. These two features are of great interest for some fluorescent applications, such as FFSC. The main drawback of using these organic dyes lies in the strong overlap between the absorption and emission spectra, as can be seen from Figure 4. Because of this overlap, successive re-absorption events can occur, and, consequently, non-radiative emissions increase. This overlap will cause a red-shift of the emission spectrum and transmission losses when the fiber length is increased.

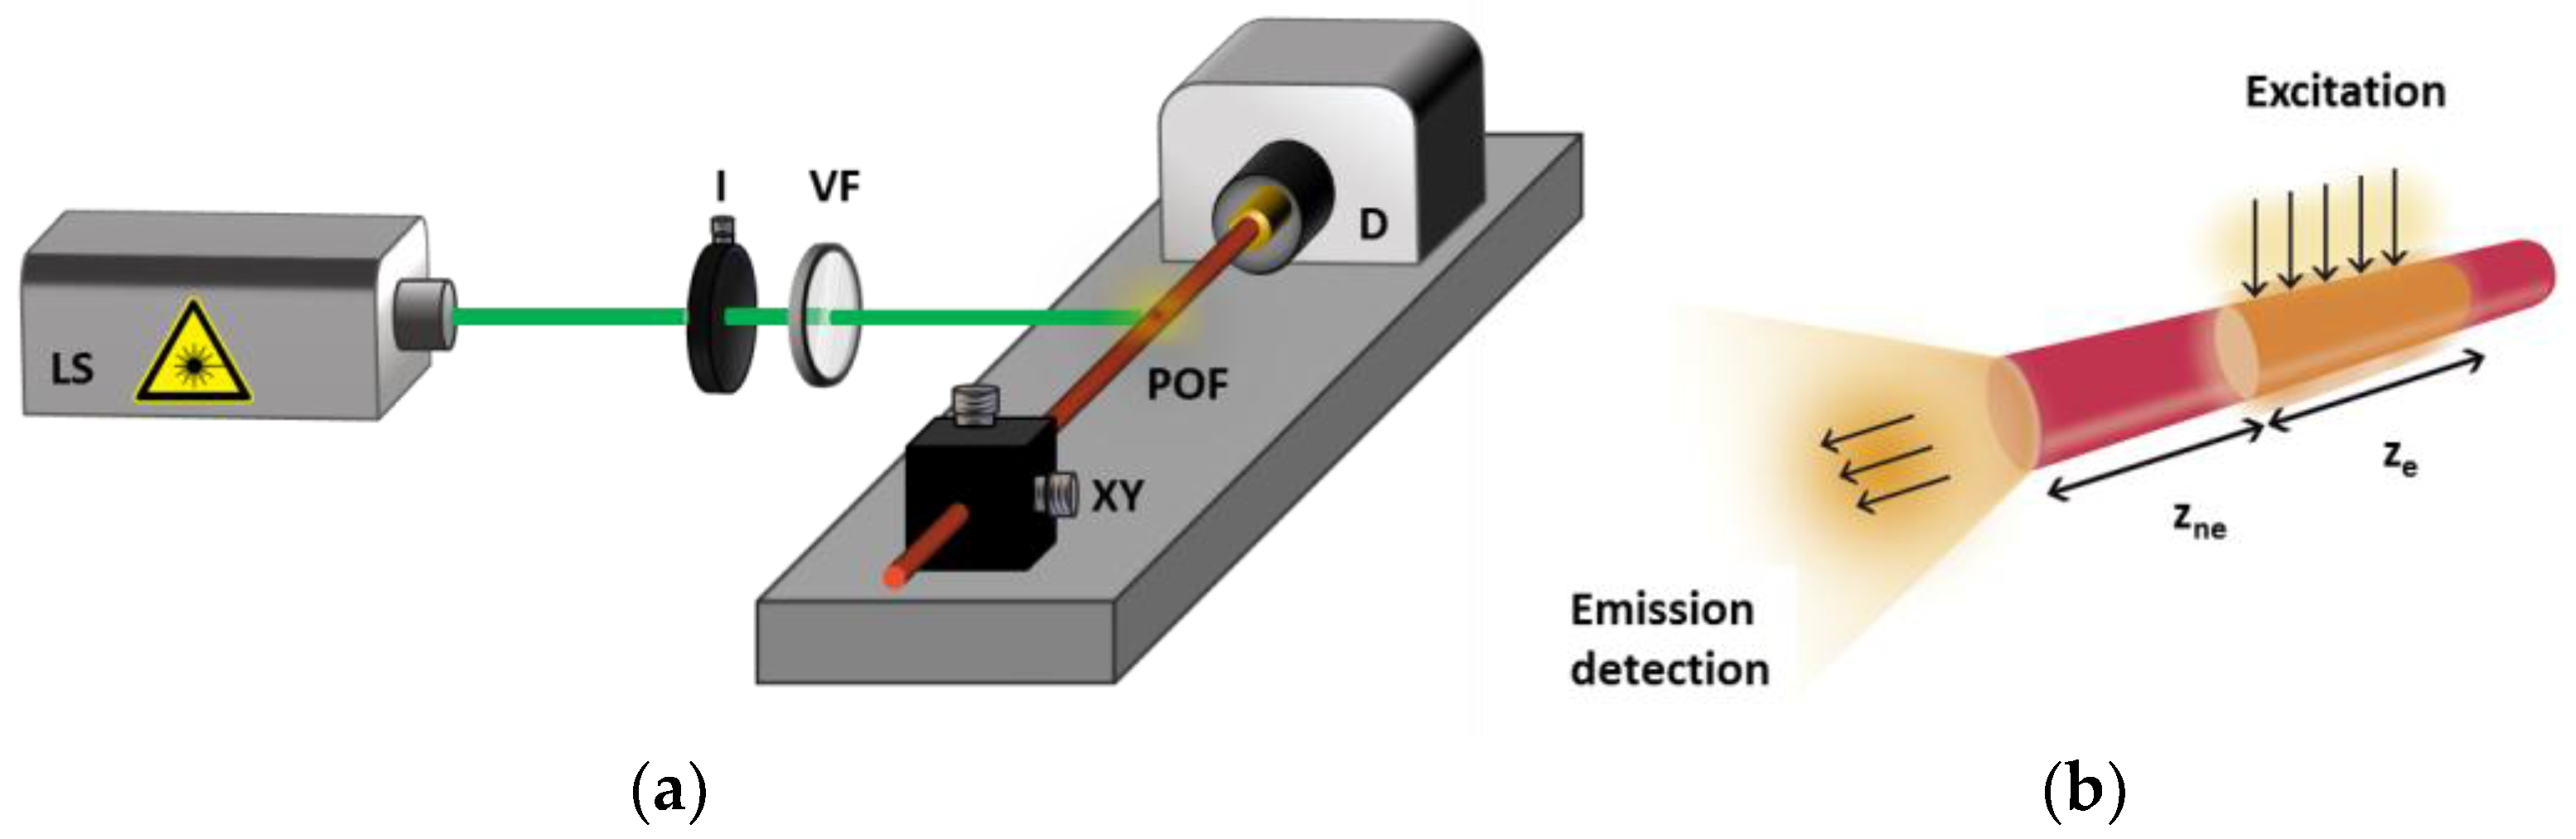
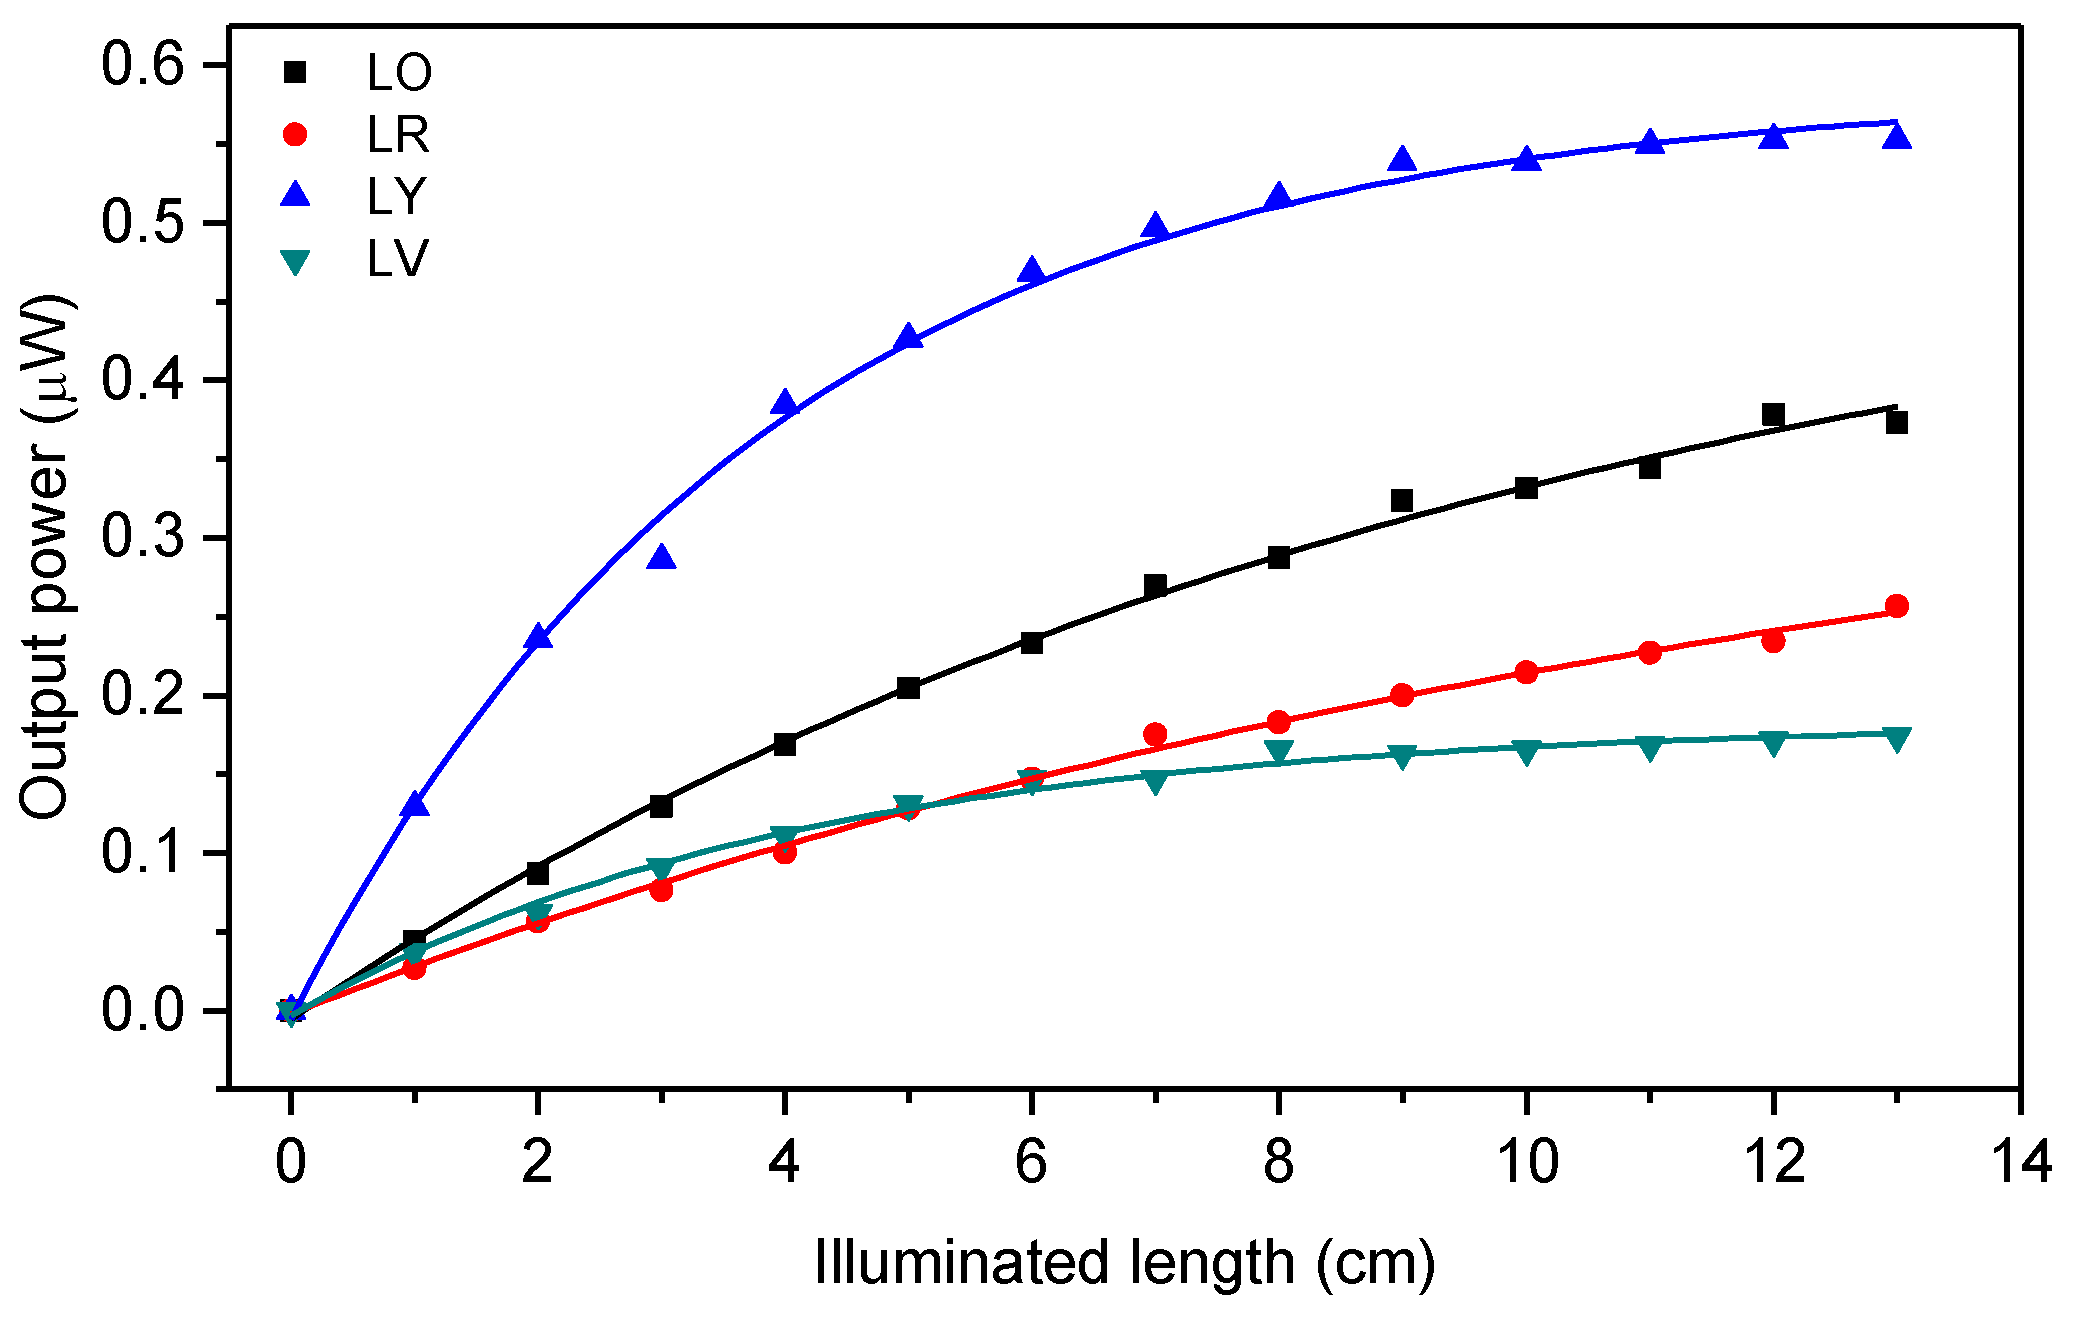
3.2. Side Illumination Coupling Efficiency
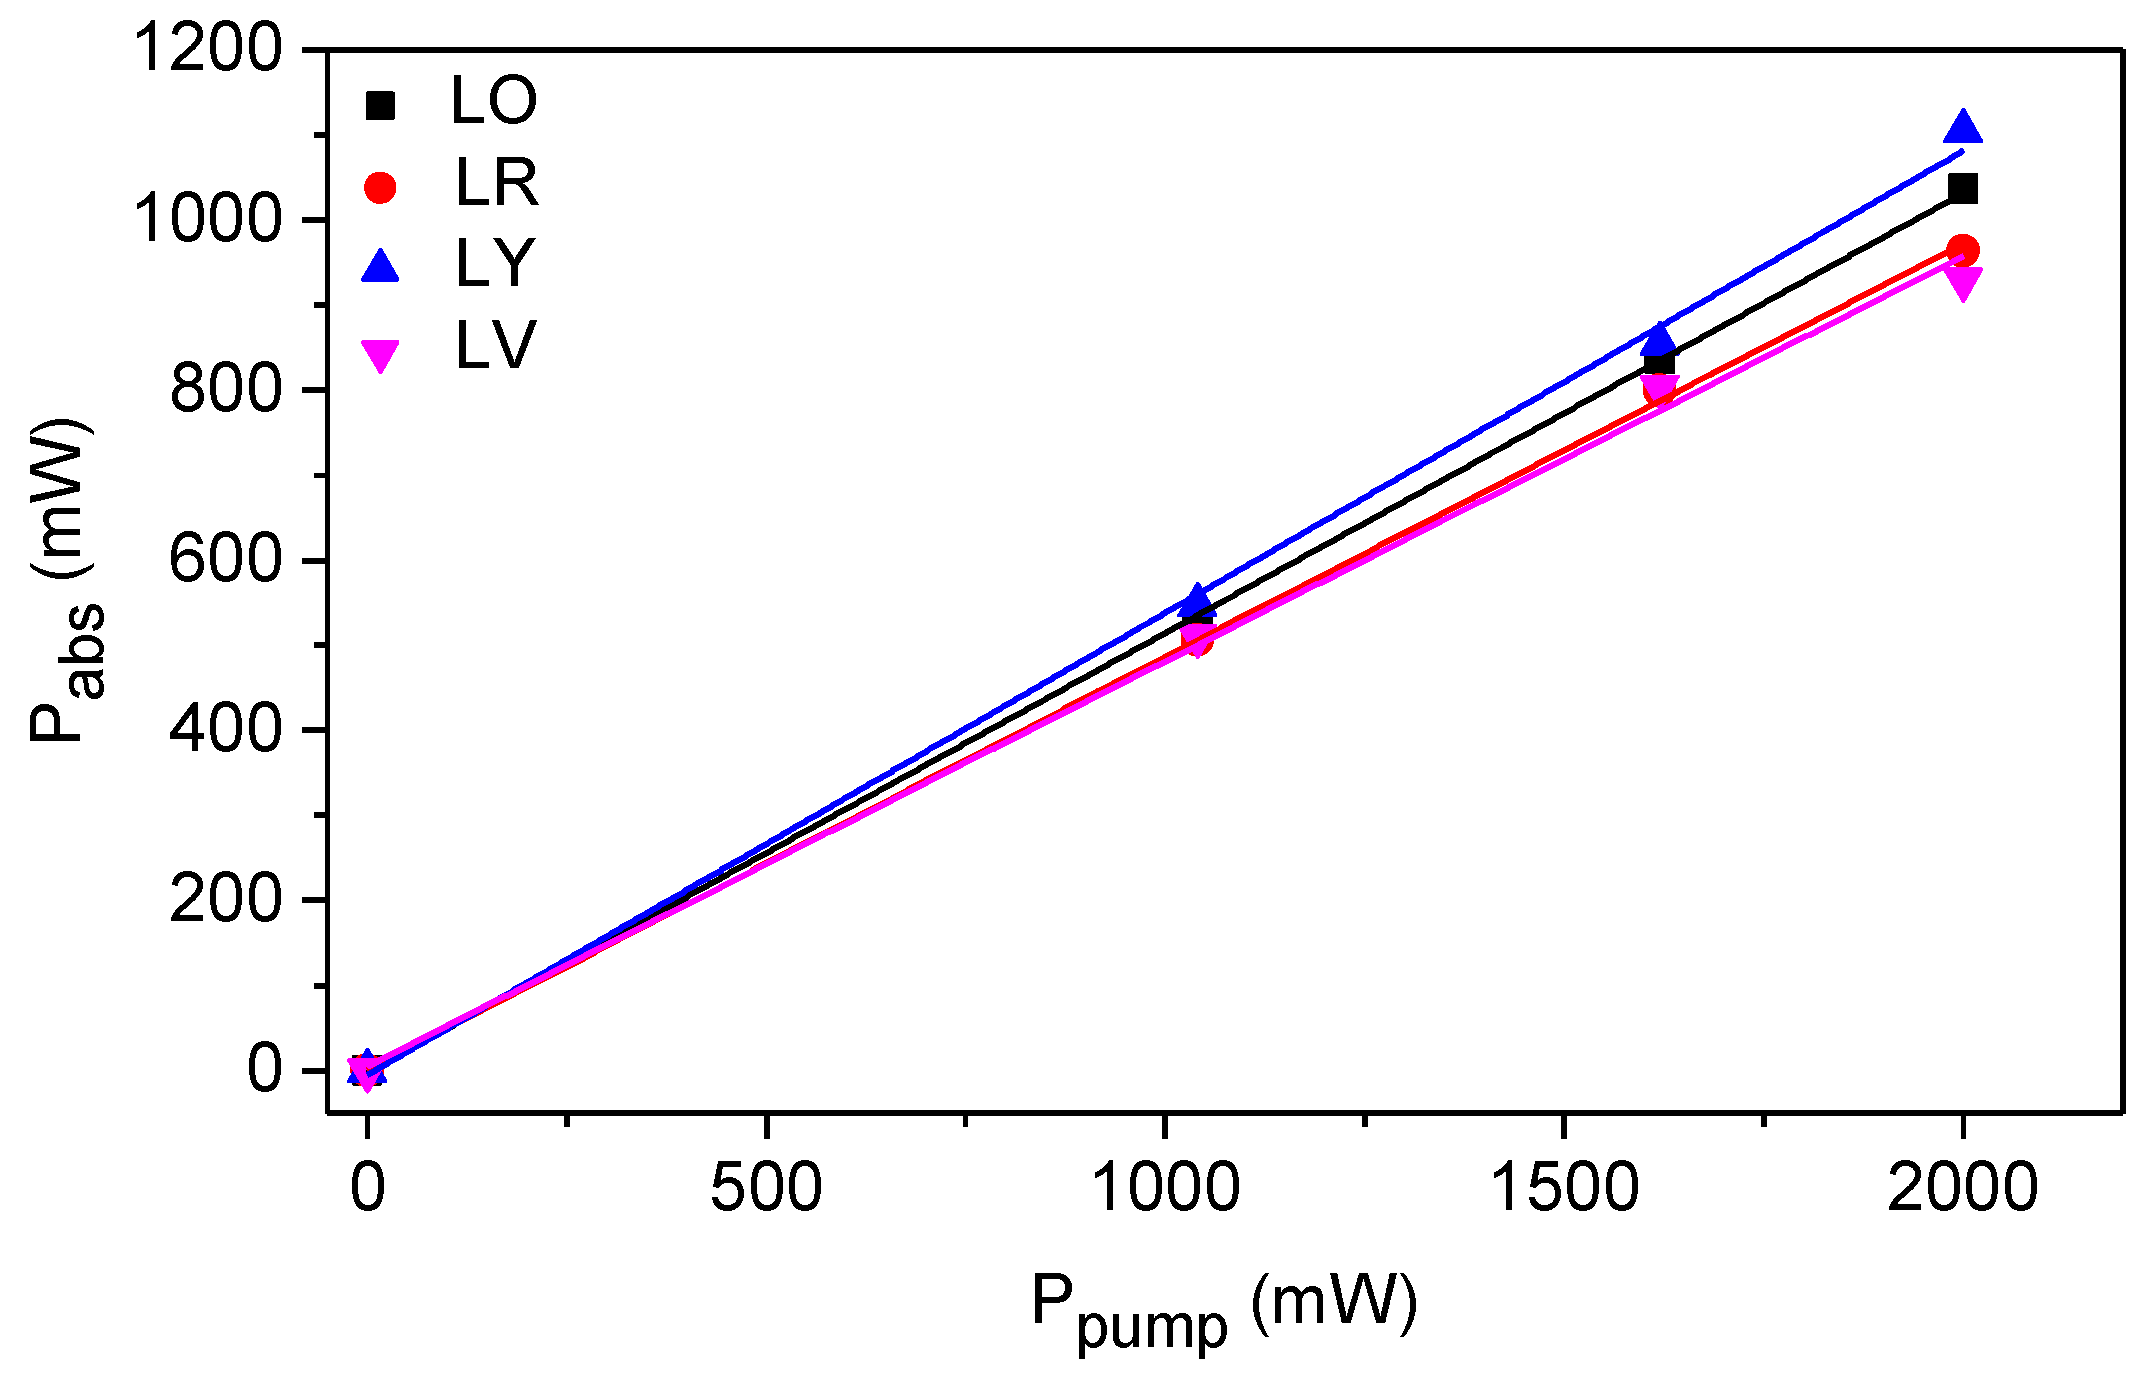
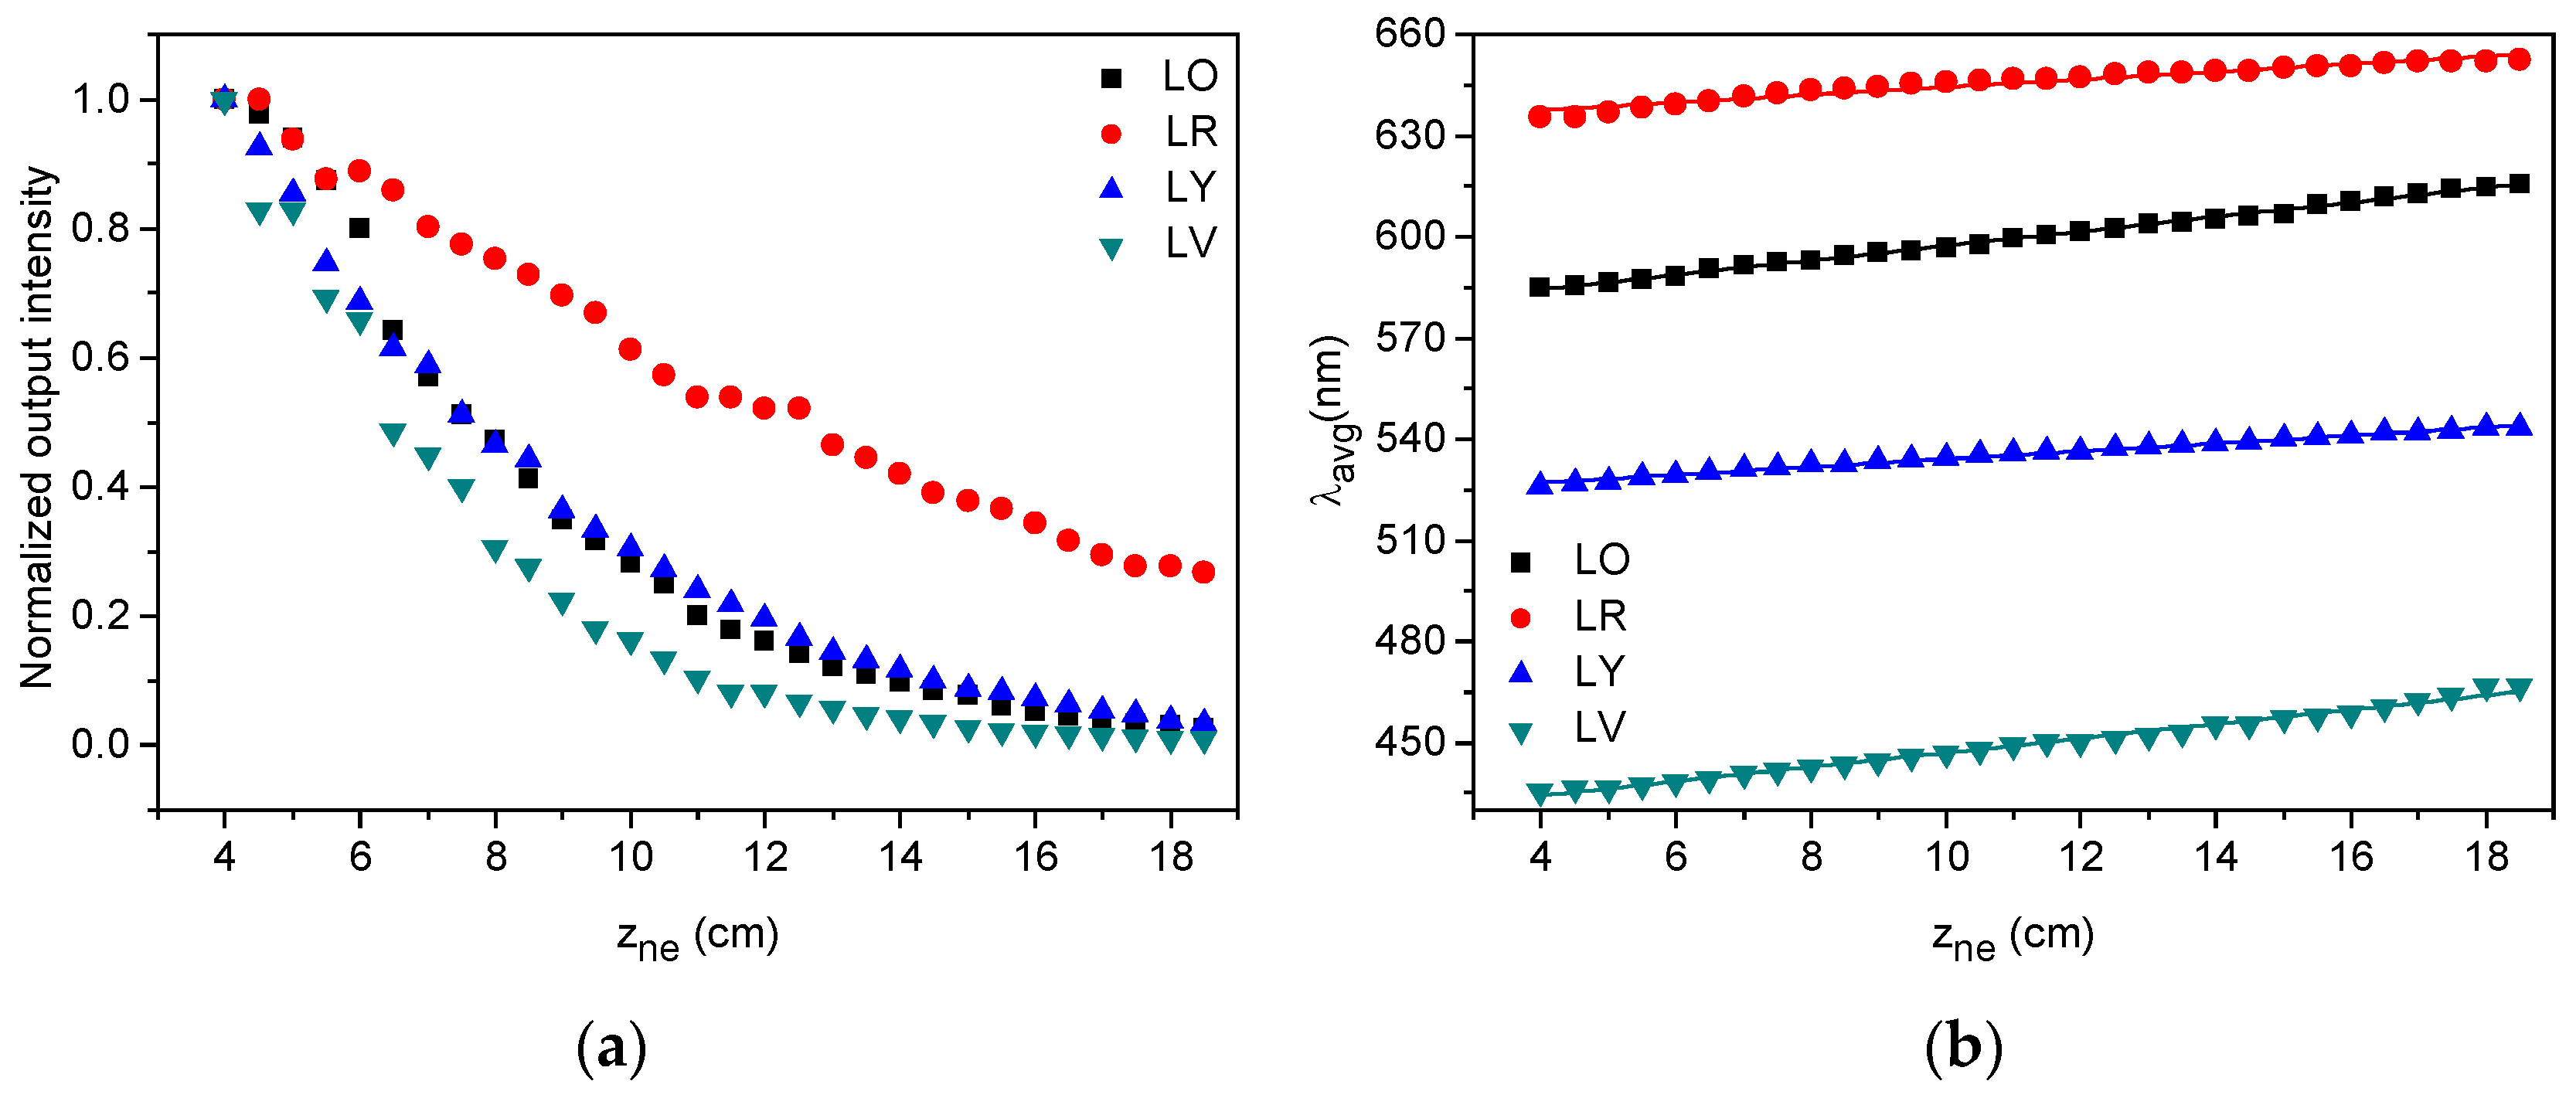
For applications such as FFSC, the amount of light that is absorbed sideways is an important feature. For characterizing the side illumination coupling efficiencies, the samples were transversally pumped employing a broadband laser-driven light source, with an excitation length of 1 mm. The absorbed power, Pabs, is calculated by the subtraction of the source-power, Ppump, and the power transmitted just in the opposite side of the fiber. The side illumination coupling efficiency is calculated as
η S I C = P a b s P p u m p · 100   ( % ) ,
Figure 5 shows the power absorbed by each fiber as a function of the pump power. As can be seen, the absorbed power increases linearly with the pump power for all fibers, leading to ηSIC values of 51.7%, 48.5%, 54.3%, and 47.6% for LO, LR, LY, and LV samples respectively. This means that around 50% of the light coming sideways is absorbed by the fiber. However, not all of the absorbed light will reach the fiber end, where, in the case of the FFSC applications, the solar cells are attached. There are multiple energy-loss mechanisms that may occur all along the fiber length, such as, non-radiative processes; reabsorption processes; light-scattering by impurities of the host material, both into the fiber core and on its surface; and losses caused by rays with angles sharper than the critical angle, which will leak out when reaching the fiber surface [27,28]. These losses have been characterized and the results will be presented in the next subsection.

3.3. Optical Losses

In this subsection, the effects of varying the total propagation length of the fiber, zne, are analyzed. The samples were excited at their maximum absorption wavelengths, except for LR, that was excited at 520 nm. When the excitation point is moved further from the detector, the output intensity decreases due to the transmission losses, and the emission spectrum is shifted towards longer wavelengths, as a consequence of the aforementioned reabsorption and reemission effects. Figure 6a shows the evolution of the total output intensity as a function of the propagation distance, zne. The fiber with the lower intensity attenuation appears to be the LR sample, whereas the other three samples show similar transmission losses. In Figure 6b the dependence of the average emission wavelength with zne can be seen. All the samples undergo similar red-shifts on their emission spectra, which have been calculated by linearly fitting the experimental points. The higher red-shift has been measured for the LV fiber, with a value of 2.2 nm/cm. This fiber corresponds to the sample with the strongest overlap between the absorption and emission bands.
To conclude this subsection, the attenuation of all fibers has been calculated. This characterization of the optical attenuation is essential for applications such as FFSC to minimize losses when the light propagates through the fiber. The optical loss coefficients have been calculated by measuring the decrease of the output fluorescent spectra at a certain wavelength as the propagation length is increased, with a constant excitation length, ze, of 1.2 mm. If we assume that the illuminated length behaves as a plane-wave source, the output light decreases exponentially for each of the emission wavelengths in the region where the absorption and emission bands overlap. This decay is expressed as
I ( λ ,   z ne ) = I o · exp ( α ( λ ) · z ne ) ,
where, Io corresponds to the output irradiance at a propagation length zne = 0, and α(λ) corresponds to the optical loss coefficient at wavelength λ. The results obtained by fitting the experimental curves to Equation (2) are shown in Figure 7. As can be seen, LV, LY, and LO samples undergo similar attenuation values of around 0.15 cm−1 in the flat region where the dopant absorption should be negligible. These values appear to be slightly higher than those documented for dye-doped fibers [29,30]. However, the attenuation measured for the LR doped fiber, with a value of 0.05 cm−1, is in good agreement with previously reported numbers for dye-doped POFs and also for conjugated polymers-doped POFs [31]. In applications where the output power represents a critical factor, such as FFSCs, one of the main goals of the fabrication process would be to reduce the transmission losses as much as possible, by controlling the fabrication parameters from the preform fabrication to the last step of fiber drawing, and by controlling the optimum dopant concentration to avoid saturation and extra reabsorption effects.

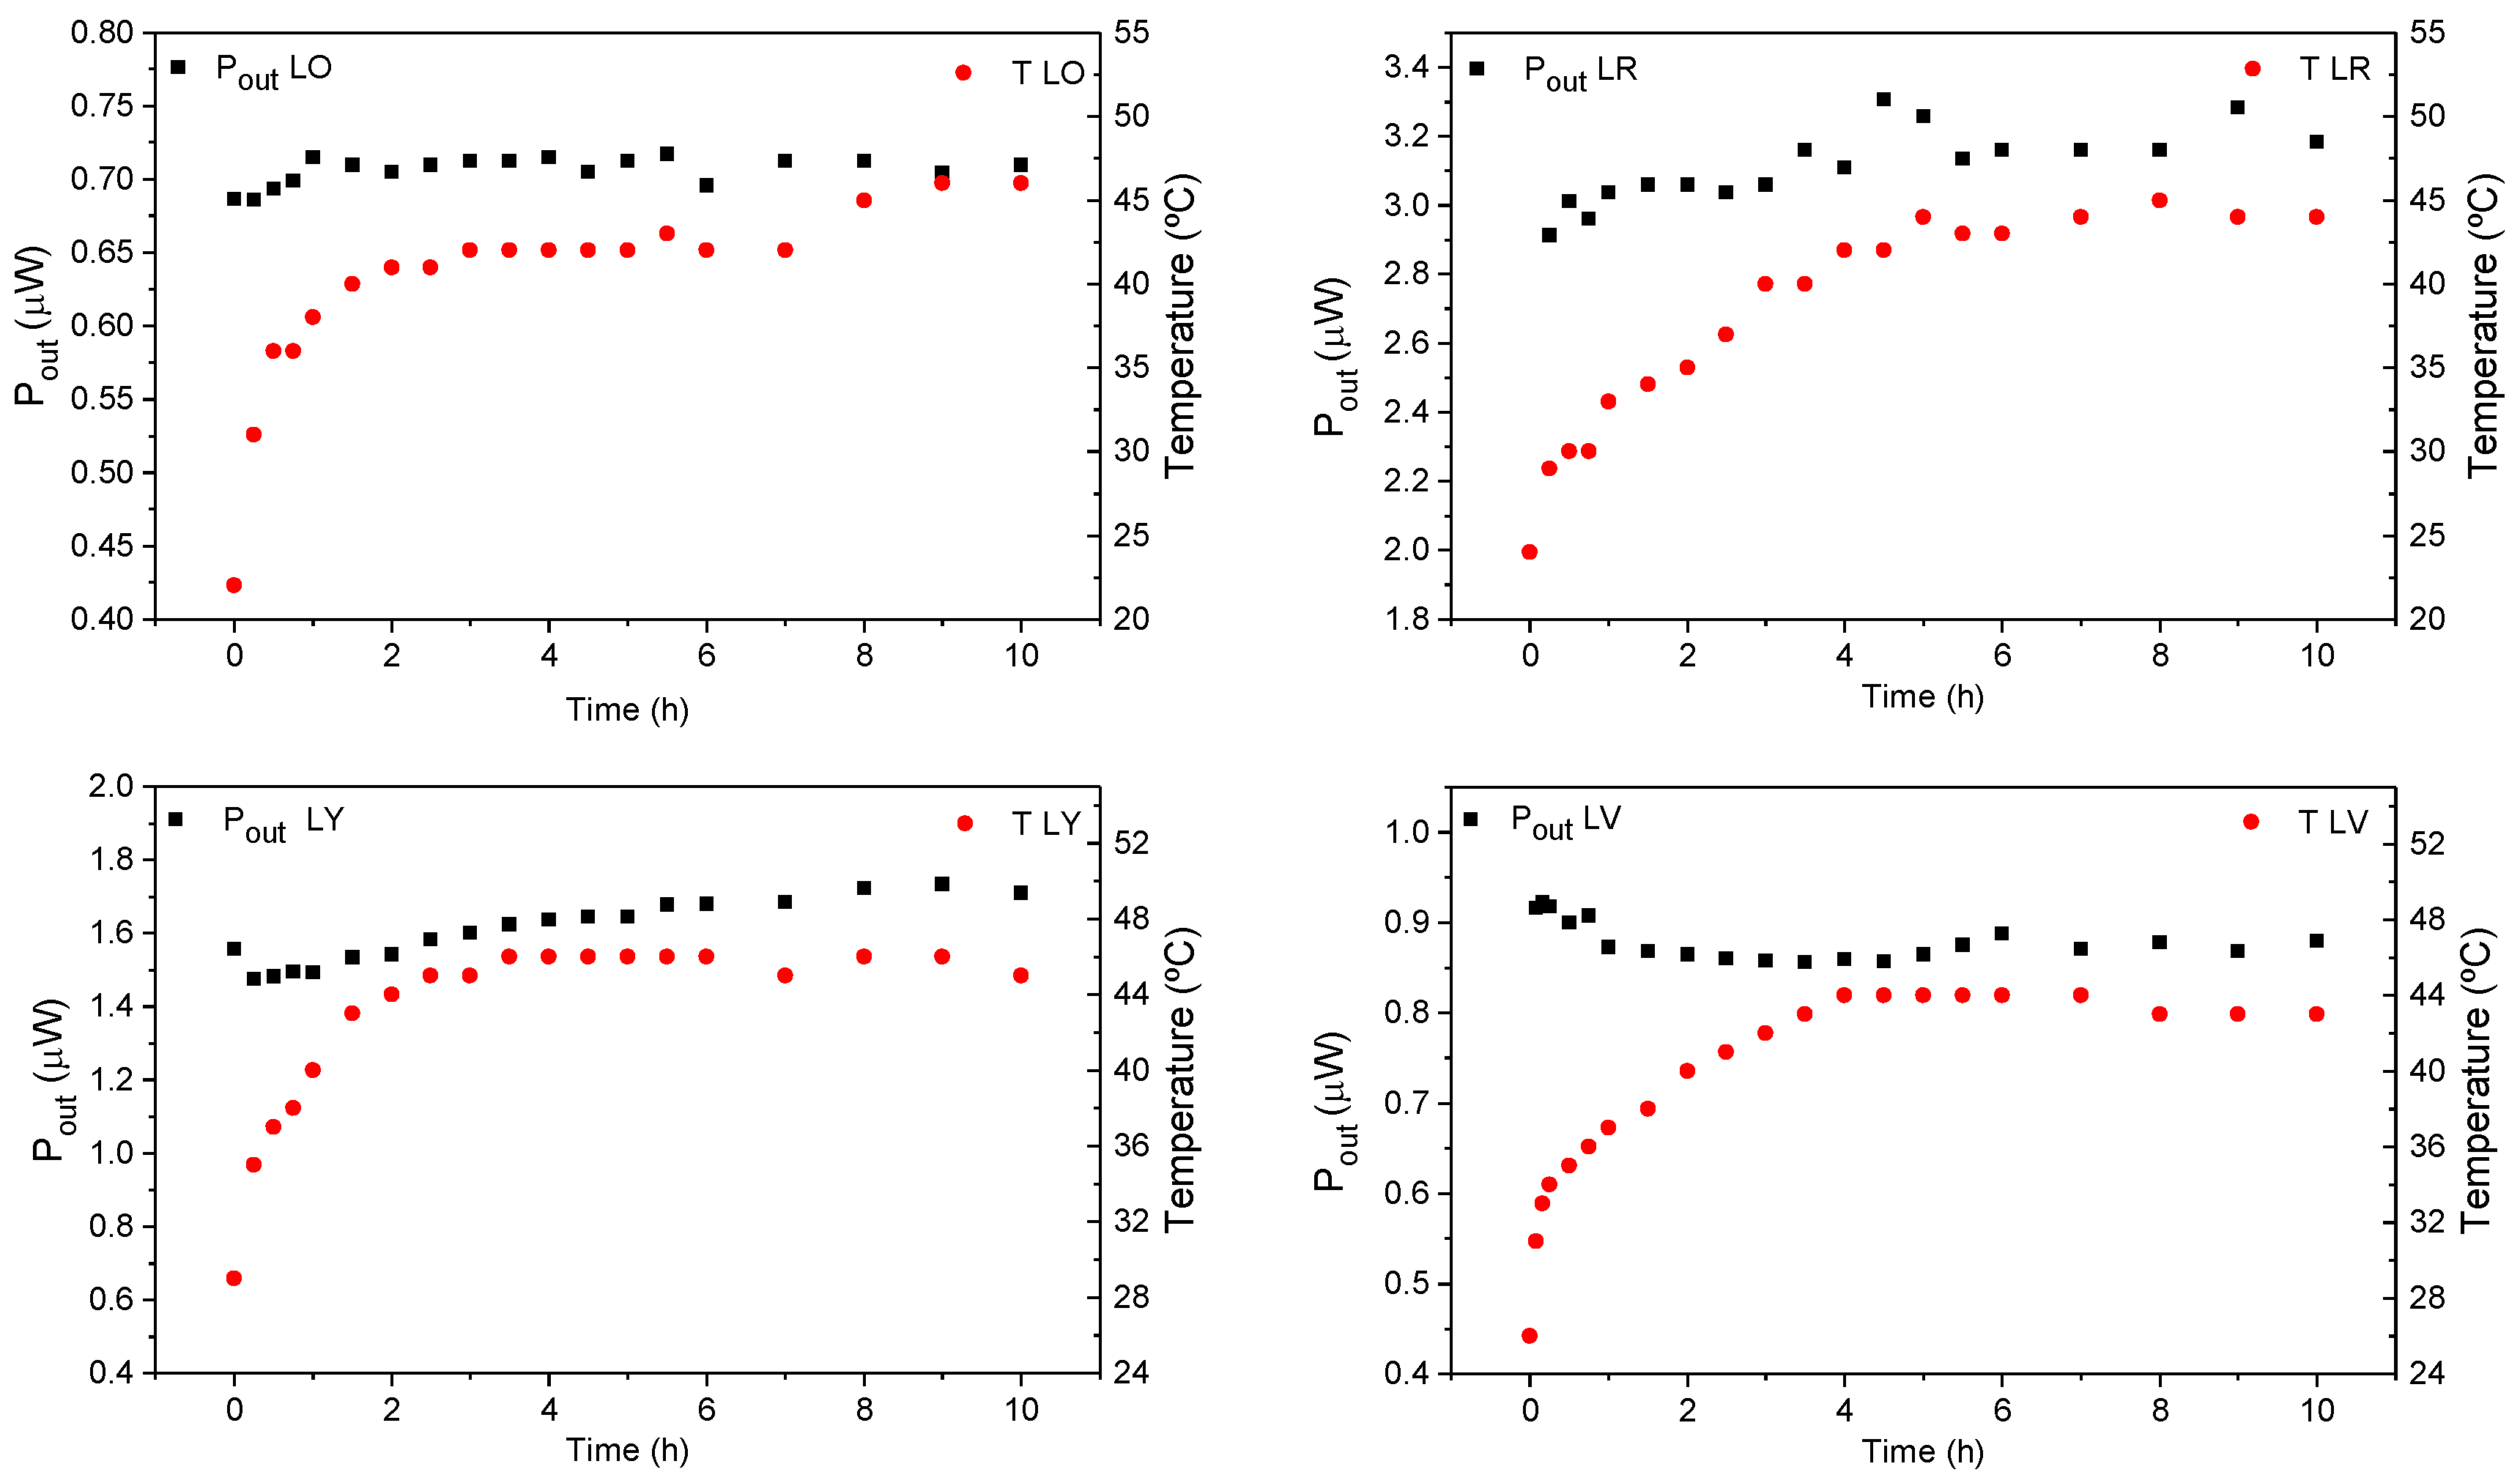
3.4. Analysis under Solar Simulator

Firstly, a study of the evolution of the output power as a function of the illuminated sample length has been carried out. In order to achieve this, only a variable portion ze of the fiber has been illuminated. The results obtained are shown in Figure 8. It can be observed that, for short lengths, the output power increases, but, afterwards, it tends to saturate. This evolution of the output power can be expressed as
P ( z e ) = C α * · ( 1 exp ( z e · α * ) ) ,
where, C is a parameter related to the spontaneous emission [5,29], and α* is the average loss coefficient corresponding to all emission wavelengths. From the fittings of Equation (3) to the experimental data the α* can be determined. Moreover, the power-saturation level has also been calculated. This saturation level corresponds to the fiber length, Lsat, where the variation of the output power is less than 0.4%. In Table 2 the values of α*, the coefficient of determination (R2) of the fittings and the saturation length, Lsat, of the fibers are gathered. As we expected, the best result is obtained for the lumogen red doped fiber, which is the sample with the lowest optical loss coefficient and the longest saturation length. The value of 76 cm obtained for our LR sample agrees with previous experimental values measured for lumogen red doped fibers with the same diameter (1 mm) [32]. It can be noticed that the average loss coefficient values are in agreement with the values obtained in Section 3.3 from the flat part of the optical loss coefficient curves.
Finally, the photo-stability of the fibers during a 10-h exposure period have been analyzed, recording the time evolution of the total output power and the emission spectra. The output power has been measured at one of the fiber ends, taking into account both the spectral distribution of the outgoing radiation and the responsivity curve of the photodetector as well as correcting for the small fluctuations of the light source. The evolution of the temperature of the fiber has also been measured, showing that it slowly increases during the first few hours and then stabilizes more than 20 °C above the initial temperature, reaching saturation at near 45 °C. Figure 9 shows the evolutions of the output power and of the fiber temperature along 10 h of exposure. It can be seen that the output power of all samples is rather stable for this period of time, which agrees with previous works that demonstrated that dyes derived from perylene exhibit long-term stability in PMMA hosts [23]. It is also in agreement with previously reported thermal analysis on different dyes derived from perylene, where high thermal stability has been demonstrated [24,33]. It has to be noted that the spectrum of the solar simulator is red-shifted compared with the AM1.5d radiation, having its maximum at around 700 nm, which would cause an overheating in the fiber surface and, therefore, an increase in the photo-degradation. However, the output power under these conditions remains constant, which reinforces the high thermal stability of these lumogen-doped fibers. Although, in this study, no dependence of the output power with the increase on the temperature has been observed, longer-term outdoor measurements should be carried out in future works to determine the fiber lifetimes and the effects of real irradiation conditions on their stability. Even if the measured power values are in the order of 103 times smaller than the pump power, these values could be easily improved by employing higher dopant concentrations, by optimizing the fiber fabrication parameters, and by producing fiber arrays with a certain fiber length improving the performance of a single fiber system and leading to higher power conversion values.

4. Conclusions

In this work, we have fabricated four different lumogen-doped polymer optical fibers, employing a two-step fabrication process of preform extrusion and fiber drawing, targeting applications in the field of fluorescent fiber solar concentrators. An analysis of the optical properties of the four samples has been carried out employing the side illumination technique. We have demonstrated that half of the light that comes sideways is coupled into the fiber, with values of side illumination coupling efficiencies of around 50% for all the samples. Moreover, we have seen that all fibers undergo similar red-shifts on their emission spectra when the non-excited length of the fiber is increased, due to reabsorption events. We have also seen that three of the samples show moderate attenuation coefficients, but for the lumogen red sample, the optical loss coefficient values are comparable to those previously reported for dye-doped fibers. Finally, a study of the power-saturation fiber length and of the photo-stability has been carried out under a sun-simulator lamp. Lumogen red sample has been found as the fiber that leads to highest output power values, with a maximum fiber length of 76 cm before reaching saturation. No variations on the output power have been detected after 10 h of continuous light exposure in all fibers, demonstrating the high stability of the dyes. Improvements of the fabrication parameters are the goal for future work.

Acknowledgments

This work has been funded in part by the Fondo Europeo de Desarrollo Regional (FEDER); by the Ministerio de Economía y Competitividad under project TEC2015-638263-C03-1-R; by the Gobierno Vasco/Eusko Jaurlaritza under projects IT933-16 and ELKARTEK (KK-2016/0030 and KK-2016/0059); and by Ministerio de Economía y Competitividad under project MAT2014-57429-R. The work carried out by Itxaso Parola has been funded by a research grant given by the Departamento de Educación, Política Lingüística y Cultura del Gobierno Vasco/Eusko Jaurlaritza for her PhD thesis.

Author Contributions

Itxaso Parola, María Asunción Illarramendi, and Joseba Zubia conceived and designed the experiments; Nekane Guarrotxena and Olga García fabricated the extrusion-made preforms; Eneko Arrospide and Gaizka Durana drew the preforms to fibers; Itxaso Parola, Federico Recart, and María Asunción Illarramendi performed the experiments; Itxaso Parola and Federico Recart processed the experimental data; all authors contributed to the scientific discussion and to the writing of the paper.

Conflicts of Interest

The authors declare no conflict of interest.

References

  1. Koike, Y.; Ishigure, T.; Nihei, E. High-bandwidth graded-index polymer optical fiber. J. Lightwave Technol. 1995, 13, 1475–1489. [Google Scholar] [CrossRef]
  2. Zubia, J.; Garitaonaindía, G.; Arrúe, J. Passive device based on plastic optical fibers to determine the indices of refraction of liquids. Appl. Opt. 2000, 39, 941–946. [Google Scholar] [CrossRef] [PubMed]
  3. Arrue, J.; Jiménez, F.; Ayesta, I.; Illarramendi, M.A.; Zubia, J. Polymer-optical-fiber lasers and amplifiers doped with organic dyes. Polymers (Basel) 2011, 3, 1162–1180. [Google Scholar] [CrossRef]
  4. Liang, H.; Zheng, Z.; Li, Z.; Xu, J.; Chen, B.; Zhao, H.; Zhang, Q.; Ming, H. Fabrication and amplification of Rhodamine B-doped step-index polymer optical fiber. J. Appl. Polym. Sci. 2004, 93, 681–685. [Google Scholar] [CrossRef]
  5. Parola, I.; Illarramendi, M.A.; Arrue, J.; Ayesta, I.; Jiménez, F.; Zubia, J.; Tagaya, A.; Koike, Y. Characterization of the optical gain in doped polymer optical fibres. J. Lumin. 2016, 177, 1–8. [Google Scholar] [CrossRef]
  6. Kobayashi, T.; Blau, W.J.; Tillmann, H.; Hörhold, H.-H. Blue amplified spontaneous emission from a stilbenoid-compound-doped polymer optical fiber. Opt. Lett. 2001, 26, 1952–1954. [Google Scholar] [CrossRef] [PubMed]
  7. Kobayashi, T.; Blau, W.J.; Tillmann, H.; Hörhold, H.H. Light amplification and lasing in a stilbenoid compound-doped glass-clad polymer optical fiber. IEEE J. Quantum Electron. 2003, 39, 664–672. [Google Scholar] [CrossRef]
  8. Camposeo, A.; Di Benedetto, F.; Stabile, R.; Neves, A.A.; Cingolani, R.; Pisignano, D. Laser emission from electrospun polymer nanofibers. Small 2009, 5, 562–566. [Google Scholar] [CrossRef] [PubMed]
  9. Camposeo, A.; Persano, L.; Pisignano, D. Light-emitting electrospun nanofibers for nanophotonics and optoelectronics. Macromol. Mater. Eng. 2013, 298, 487–503. [Google Scholar] [CrossRef]
  10. Meng, C.; Xiao, Y.; Wang, P.; Zhang, L.; Liu, Y.; Tong, L. Quantum-dot-doped polymer nanofibers for optical sensing. Adv. Mater. 2011, 23, 3770–3774. [Google Scholar] [CrossRef] [PubMed]
  11. Yang, Q.; Jiang, X.; Gu, F.; Ma, Z.; Zhang, J.; Tong, L. Polymer micro or nanofibers for optical device applications. J. Appl. Polym. Sci. 2008, 110, 1080–1084. [Google Scholar] [CrossRef]
  12. Quochi, F.; Cordella, F.; Mura, A.; Bongiovanni, G.; Balzer, F.; Rubahn, H.-G. Gain amplification and lasing properties of individual organic nanofibers. Appl. Phys. Lett. 2006, 88, 041106. [Google Scholar] [CrossRef]
  13. Song, J.; Chen, M.; Olesen, M.B.; Wang, C.; Havelund, R.; Li, Q.; Xie, E.; Yang, R.; Bøggild, P.; Wang, C.; et al. Direct electrospinning of Ag/polyvinylpyrrolidone nanocables. Nanoscale 2011, 3, 4966–4971. [Google Scholar] [CrossRef] [PubMed]
  14. Wang, P.; Zhang, L.; Xia, Y.; Tong, L.; Xu, X.; Ying, Y. Polymer Nano fibers Embedded with Aligned Gold Nanorods: A new platform for plasmonic studies and optical sensing. Nano Lett. 2012, 12, 3145–3150. [Google Scholar] [CrossRef] [PubMed]
  15. Lolla, D.; Lolla, M.; Abutaleb, A.; Shin, H.U.; Reneker, D.H.; Chase, G.G. Fabrication, polarization of electrospun polyvinylidene fluoride electret fibers and effect on capturing nanoscale solid aerosols. Materials (Basel) 2016, 9, 671. [Google Scholar] [CrossRef]
  16. Huang, X.; Han, S.; Huang, W.; Liu, X. Enhancing solar cell efficiency: The search for luminescent materials as spectral converters. Chem. Soc. Rev. 2013, 42, 173–201. [Google Scholar] [CrossRef] [PubMed]
  17. Colantuono, G.; Buckley, A.; Erdelyi, R. Ray-optics modelling of rectangular and cylindrical 2-layer solar concentrators. J. Lightwave Technol. 2013, 31, 1033–1044. [Google Scholar] [CrossRef]
  18. McIntosh, K.R.; Yamada, N.; Richards, B.S. Theoretical comparison of cylindrical and square-planar luminescent solar concentrators. Appl. Phys. B 2007, 88, 285–290. [Google Scholar] [CrossRef]
  19. Wang, T.; Yu, B.; Chen, B.; Hu, Z.; Luo, Y.; Zou, G.; Zhang, Q. A theoretical model of a cylindrical luminescent solar concentrator with a dye-doping coating. J. Opt. 2013, 15, 055709. [Google Scholar] [CrossRef]
  20. Chen, J.-Y.; Chiu, Y.-C.; Shih, C.-C.; Wu, W.-C.; Chen, W.-C. Electrospun nanofibers with dual plasmonic-enhanced luminescent solar concentrator effects for high-performance organic photovoltaic cells. J. Mater. Chem. A 2015, 3, 15039–15048. [Google Scholar] [CrossRef]
  21. Rowan, B.C.; Wilson, L.R.; Richards, B.S. Advanced material concepts for luminescent solar concentrators. IEEE J. Sel. Top. Quantum Electron. 2008, 14, 1312–1322. [Google Scholar] [CrossRef]
  22. Earp, A.A.; Franklin, J.B.; Smith, G.B. Absorption tails and extinction in luminescent solar concentrators. Sol. Energy Mater. Sol. Cells 2011, 95, 1157–1162. [Google Scholar] [CrossRef]
  23. Cerdán, L.; Costela, A.; Durán-Sampedro, G.; García-Moreno, I.; Calle, M.; Juan-y-Seva, M.; de Abajo, J.; Turnbull, G.A. New perylene-doped polymeric thin films for efficient and long-lasting lasers. J. Mater. Chem. 2012, 22, 8938–8947. [Google Scholar] [CrossRef]
  24. Mansour, A.; El-Shaarawy, M.; El-Bashir, S.; El-Mansy, M.; Hammam, M. Optical study of perylene dye doped poly(methyl methacrylate) as fluorescent solar collector. Polym. Int. 2002, 51, 393–397. [Google Scholar] [CrossRef]
  25. Correia, S.F.H.; Lima, P.P.; André, P.S.; Ferreira, M.R.S.; Carlos, L.A.D. High-efficiency luminescent solar concentrators for flexible waveguiding photovoltaics. Sol. Energy Mater. Sol. Cells 2015, 138, 51–57. [Google Scholar] [CrossRef]
  26. Wang, C.; Abdul-Rahman, H.; Rao, S.P. Daylighting can be fluorescent: Development of a fiber solar concentrator and test for its indoor illumination. Energy Build. 2010, 42, 717–727. [Google Scholar] [CrossRef]
  27. Bikandi, I.; Illarramendi, M.A.; Zubia, J.; Arrue, J.; Jiménez, F. Side-illumination fluorescence critical angle: Theory and application to F8BT-doped polymer optical fibers. Opt. Express 2012, 20, 4630–4644. [Google Scholar] [CrossRef] [PubMed]
  28. Illarramendi, M.A.; Aldabaldetreku, G.; Bikandi, I.; Zubia, J.; Durana, G.; Berganza, A. Scattering in step-index polymer optical fibers by side-illumination technique: Theory and application. JOSA B 2012, 29, 1316–1329. [Google Scholar] [CrossRef]
  29. Ayesta, I.; Illarramendi, M.A.; Arrue, J.; Parola, I.; Jiménez, F.; Zubia, J.; Tagaya, A.; Koike, Y. Optical characterization of doped thermoplastic and thermosetting polymer-Optical-Fibers. Polymers (Basel) 2017, 9, 90. [Google Scholar] [CrossRef]
  30. Parola, I.; Illarramendi, M.A.; Zubia, J.; Arrospide, E.; Durana, G.; Guarrotxena, N.; García, O.; Evert, R.; Zaremba, D.; Johannes, H.-H.; et al. Polymer optical fibers doped with organic materials as luminescent solar concentrators. Proc. SPIE 2017, 10101, 101010Z. [Google Scholar] [CrossRef]
  31. Illarramendi, M.A.; Zubia, J.; Bazzana, L.; Durana, G.; Aldabaldetreku, G.; Sarasua, J.R. Spectroscopic characterization of plastic optical fibers doped with fluorene oligomers. J. Lightwave Technol. 2009, 27, 3220–3226. [Google Scholar] [CrossRef]
  32. Videira, J.J.; Bilotti, E.; Chatten, A.J. Cylindrical and square fibre luminescent solar concentrators: Experimental and simulation comparisons. In Proceedings of the 2014 IEEE 40th Photovoltaic Specialist Conference, Denver, CO, USA, 8–13 June 2014; pp. 2280–2285. [Google Scholar]
  33. Müller, G.R.J.; Meiners, C.; Enkelmann, V.; Geerts, Y.; Müllen, K. Liquid crystalline perylene-3,4-dicarboximide derivatives with high thermal and photochemical stability. J. Mater. Chem. 1998, 8, 61–64. [Google Scholar] [CrossRef]
Figure 1. Scheme of the chemical structures of (a) Lumogen F Violet 570; (b) Lumogen F Yellow 083; (c) Lumogen F Orange 240; and (d) Lumogen F Red 305.
Fibers 05 00028 g001
Figure 2. (a) Schematic of the extrusion process; (b) Top: two photographs of the LO preform in the drawing tower; bottom: photograph of the final dye-doped 1 mm fibers (LV, LY, LR, and LO from top to bottom).
Fibers 05 00028 g002
Figure 3. (a) Schematic of the experimental set up when the fiber is pumped sideway. LS: Light source; I: Iris; VF: Variable filters; POF: polymer optical fiber; XY: Micro positioner; D: Detection; (b) Zooming of the side illumination technique. ze: Illuminated fiber length; zne: non-excited propagation length of the fiber up to the detector.
Fibers 05 00028 g003
Figure 4. Normalized absorption (a) and emission (b) spectra of the four dye-doped fibers (ze = 1.2 mm and zne = 3.3 cm).
Fibers 05 00028 g004
Figure 5. Power absorbed sideways by each of the samples as a function of the pump power, for ze = 1 mm.
Fibers 05 00028 g005
Figure 6. Evolutions of the total output intensity (a) and of the average emission wavelength (b) for all fibers, as a function of the propagation length, for a ze = 1.2 mm, and a pumping irradiance of 52 W/m2.
Fibers 05 00028 g006
Figure 7. Optical loss coefficient curves for the four fibers.
Fibers 05 00028 g007
Figure 8. Output power as a function of the illuminated length on the fiber for the four samples under sun-simulator lamp exposure; the solid-lines correspond to the fittings of Equation (3) to the experimental points.
Fibers 05 00028 g008
Figure 9. Evolutions of the output power and of the fiber temperature of the four samples during 10 h of sun-simulator exposure.
Fibers 05 00028 g009
Table 1. Glass transition temperature, number average molecular weight, weight average molecular weight, and polydispersity values of the PMMA sample.
SampleTg (°C)Mn (g/mol)Mw (g/mol)PDI
PMMA93.544,90077,6771.73
Table 2. Average loss coefficients, coefficients of determination of the fittings, and saturation length values for the four samples
Fiberα* (cm−1)R2Lsat (cm)
LO0.100.99753
LR0.070.99776
LY0.240.99625
LV0.200.99320

