Article

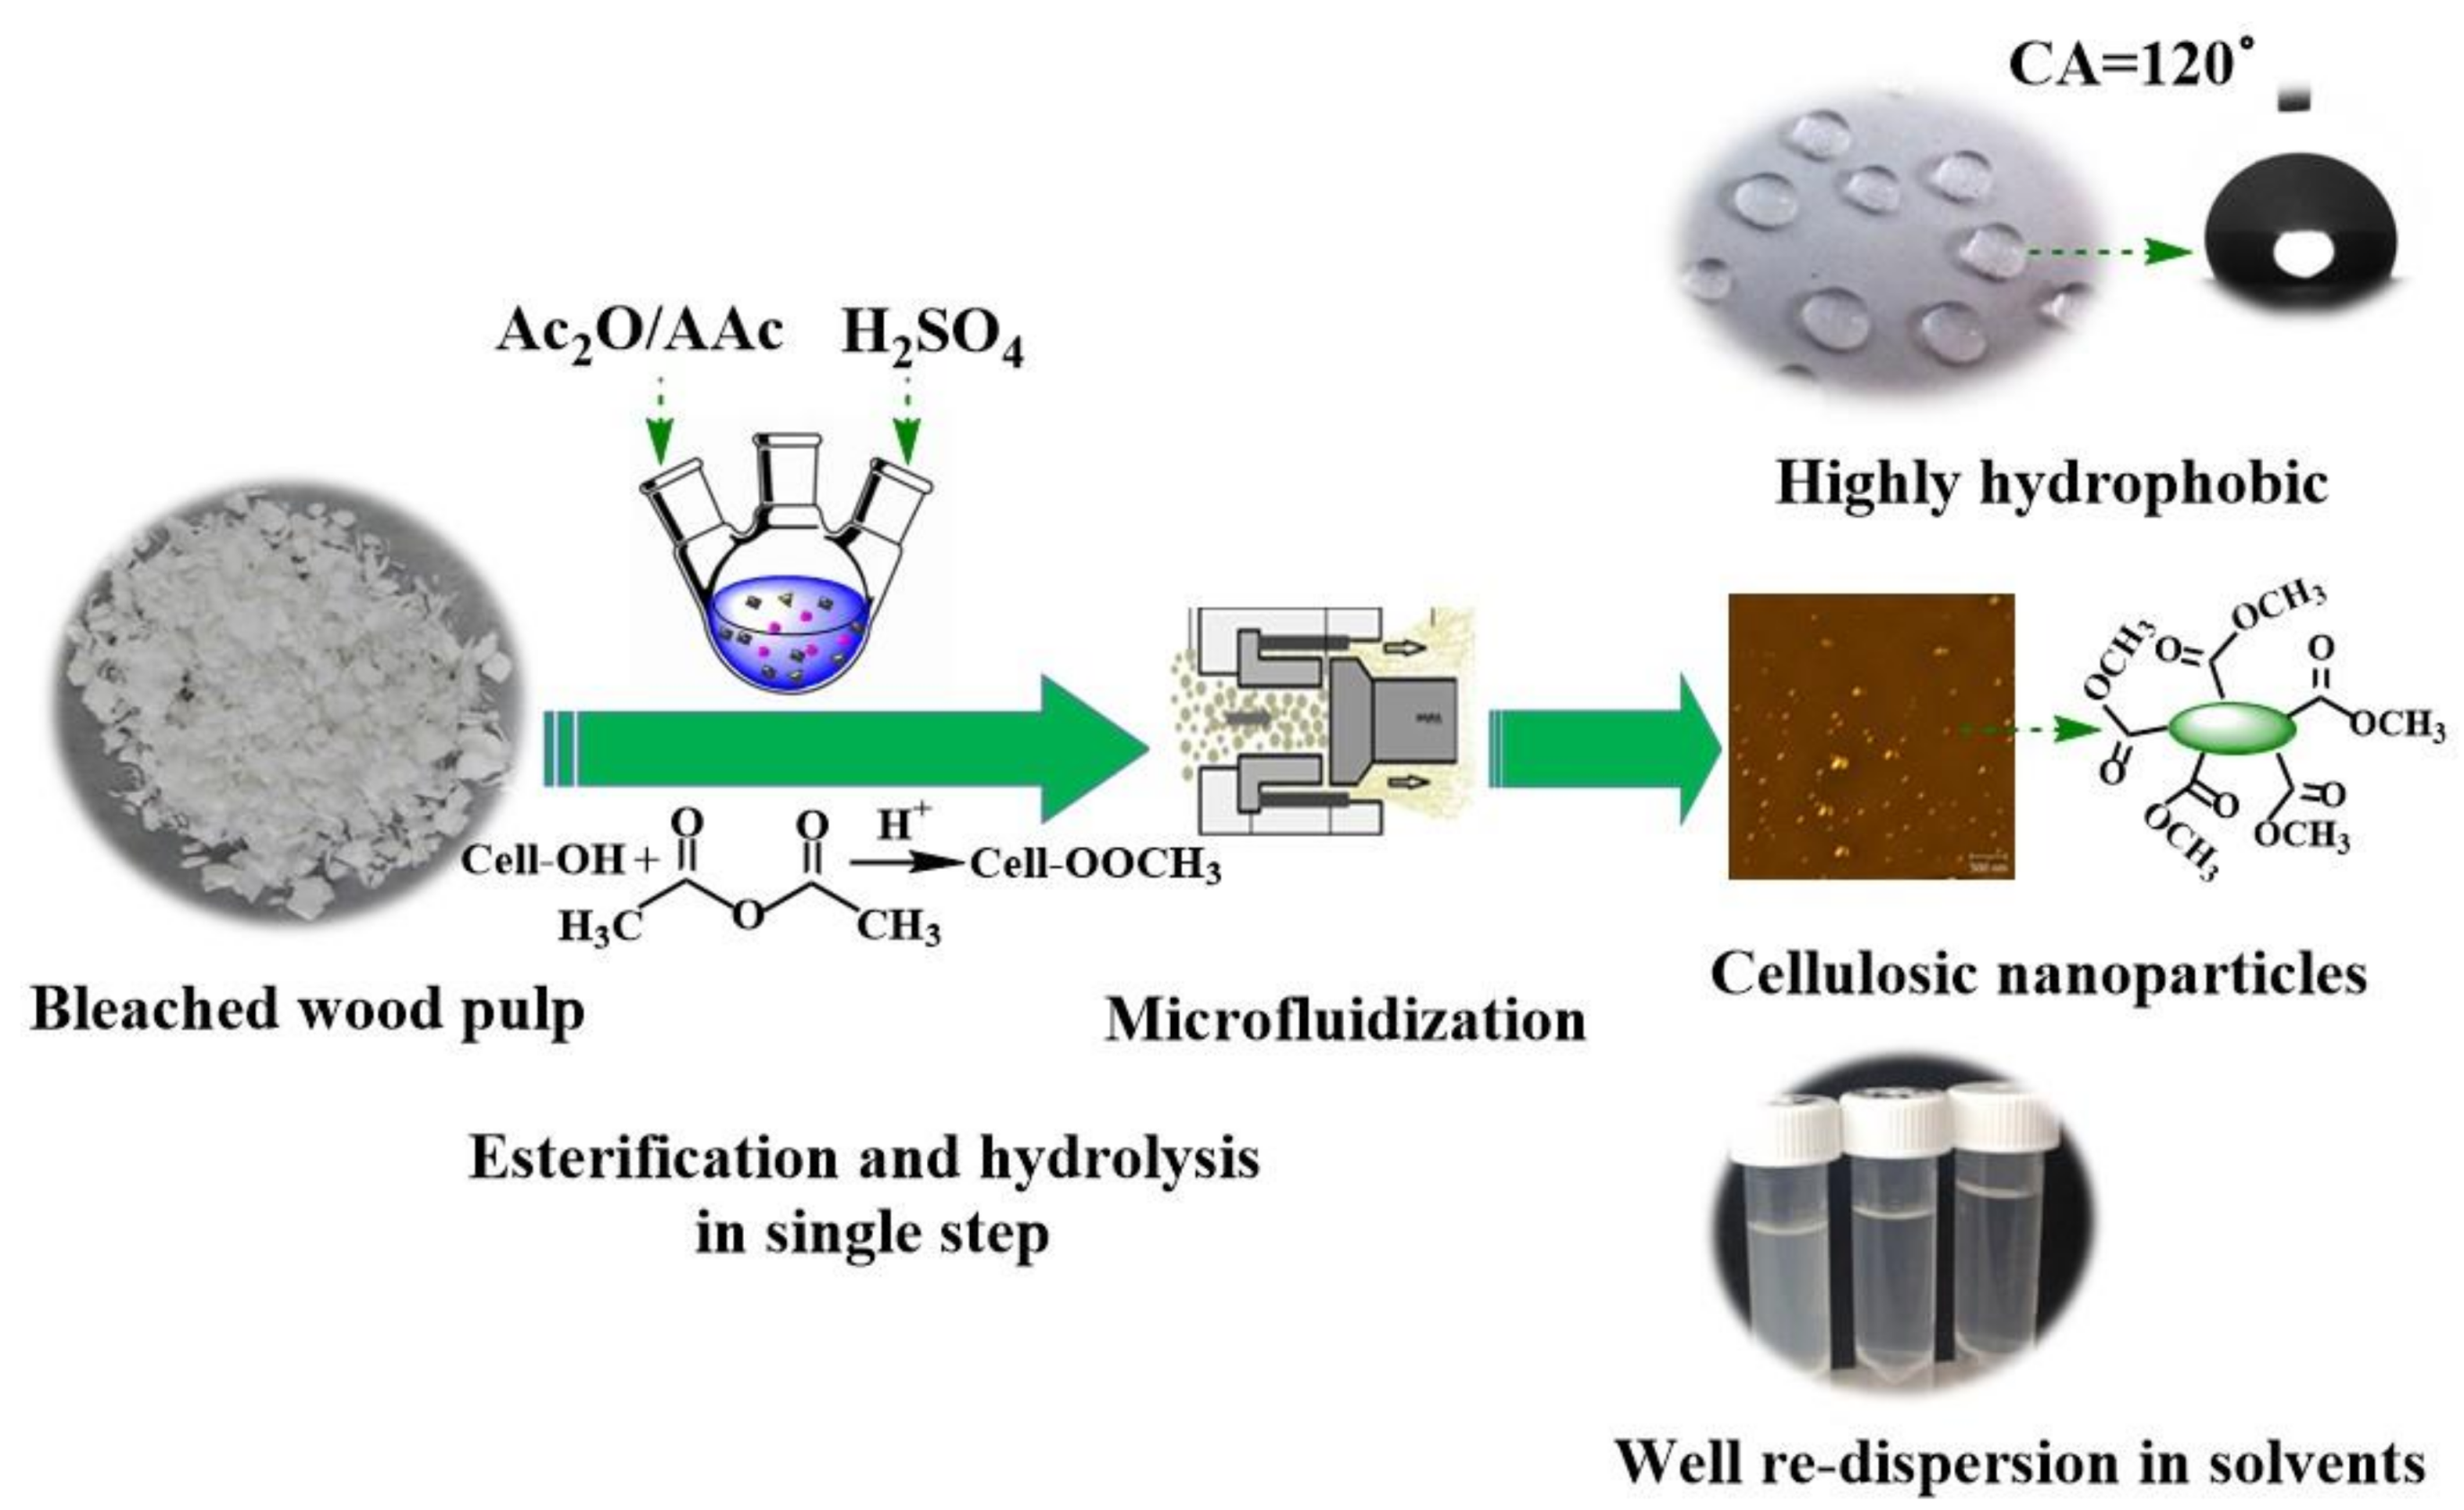
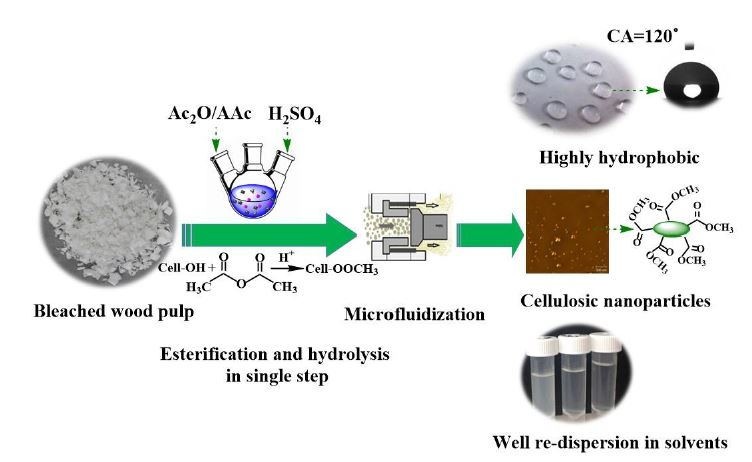
Facile Synthesis of Highly Hydrophobic Cellulose Nanoparticles through Post-Esterification Microfluidization

1
College of Environment & Resources, Fuzhou University, Fuzhou 350108, China
2
Forest Products Laboratory, U.S. Forest Service, U.S. Department of Agriculture, Madison, WI 53726, USA
*
Author to whom correspondence should be addressed.
Fibers 2018, 6(2), 22; https://doi.org/10.3390/fib6020022
Submission received: 15 December 2017 / Revised: 12 February 2018 / Accepted: 23 February 2018 / Published: 9 April 2018
(This article belongs to the Special Issue Current Developments in Cellulose Based Nanomaterials)

Abstract

:
A post-esterification with a high degree of substitution (hDS) mechanical treatment (Pe(hDS)M) approach was used for the production of highly hydrophobic cellulose nanoparticles (CNPs). The process has the advantages of substantially reducing the mechanical energy input for the production of CNPs and avoiding CNP aggregation through drying or solvent exchange. A conventional esterification reaction was carried out using a mixture of acetic anhydride, acetic acid, and concentrated sulfuric acid, but at temperatures of 60–85 °C. The successful hDS esterification of bleached eucalyptus kraft pulp fibers was confirmed by a variety of techniques, such as Fourier transform infrared (FTIR), solid state 13C NMR, X-ray photoelectron spectroscopy (XPS), elemental analyses, and X-ray diffraction (XRD). The CNP morphology and size were examined by atomic force microscopy (AFM) as well as dynamic light scattering. The hydrophobicity of the PeM-CNP was confirmed by the redispersion of freeze-dried CNPs into organic solvents and water contact-angle measurements. Finally, the partial conversion of cellulose I to cellulose II through esterification improved PeM-CNP thermal stability.

Graphical Abstract

1. Introduction

Cellulose nanomaterials (CNM), including cellulose nanocrystals (CNCs), nanofibrils (CNFs), and nanoparticles (CNPs) have attracted great interest recently for their potential applications in composites, packaging, electronics [1,2], and biomedicine [3,4]. CNPs with a low aspect ratio of close to 1 (here referred to as spherical CNPs) have attracted great interest, because they tend to be more stable than large aspect ratio cellulose nanomaterials such as CNFs and CNCs in solvent dispersions [5]. Currently, spherical CNPs are produced by acid hydrolysis [5,6], solvent method [3], enzymatic and mechanical treatment [7], and time-consuming chemical synthesis [8].
Introducing carboxylate groups into cellulose has many advantages in terms of functionalizing cellulose, facilitating mechanical fibrillation to produce cellulose nanomaterials, and increasing the stability of the resulting colloidal suspension in order to prevent aggregation [7]. It can also improve the cellulose hydrophobicity through carboxymethylation. The strong hydrogen bonding and moisture sensitivity due to the presence of a large amount of hydroxyl group on the cellulose surface results in aggregation, which causes difficulties in dispersion into a hydrophobic medium. Hydrophobic CNPs can find applications in waterproof barrier coatings for packaging materials. These particles can also be infused into wood lumens to create highly hydrophobic wood surfaces that protect wood structures from water damage without chemical treatments. Among the approaches to modify the hydrophilic property of cellulose, such as physical treatments (e.g., using plasma [9], the adsorption of cationic surfactants [10,11]) or chemical modification (e.g., silylation [12], grafting [13], esterification [14,15,16], and oxidation [1]), esterification, or carboxymethylation is often favored for its simplicity [17].
Most of the existing literature on producing hydrophobic CNM focuses on CNFs, not on CNPs. These studies use the common approach to directly esterify CNFs [18,19,20,21,22,23,24]. This requires drying CNFs and/or involves tedious solvent exchange processes to remove water from CNFs before esterification to achieve a high degree of substitution (DS). Unfortunately, drying CNF can cause fibril aggregation and difficulties in redispersion. Solvent exchange is not preferred due to environmental concerns. To avoid drying CNFs, the SolReact process [25] used carboxylic acid as a solvent, as well as a reactant, in order for it to be covalently attached on the surface of CNFs. In situ solvent exchange by water evaporation drove the esterification reaction without drying the CNFs. However, low DS values of 0.5 and 0.3 were achieved when using phenylacetic and hydrocinnamic acids, respectively. Ionic liquid was used to achieve one-pot production of hydrophobic CNFs directly from fibers, and resulted in a DS value of 0.36 with good degree of surface substitution (DSS) of 1.33 [26]. However, the economic recycling of ionic liquid needs to be addressed.
Here, we focused on producing hydrophobic CNPs by first esterifying cellulose fibers at high DS, followed by mechanical treatment, or the post-esterification (with high DS) mechanical treatment (Pe(hDS)M) approach. The Pe(hDS)M approach has at least two advantages. (1) It can avoid drying CNP and using solvents, yet it produces very high hydrophobic CNPs; and (2) esterification reaction can substantially reduce energy cost in PeM (post-esterification mechanical treatment) compared with the direct mechanical milling of cellulosic fibers, as will be discussed later. A simple PeM approach has been attempted using the Fischer–Speier esterification of hydroxyl groups, but this approach was not focused on producing highly hydrophobic CNPs. Rather, it was a chemical pretreatment step with a low DS of approximately 0.02–0.5, in order to reduce the energy in producing CNFs through subsequent mechanical fibrillation, or for producing esterified or carboxylated CNCs when using carboxylic acids or carboxylic anhydrides [7,27,28,29,30,31]. The key to achieving highly hydrophobic CNPs using PeM is to achieve a high DS in the esterification of fibers.
We applied the mature “acetic acid process” [32], i.e., acetic anhydride with sulfuric acid as the catalyst, for its low cost and high productivity, in order to produce CNPs through Pe(hDS)M of bleached wood fibers. The sulfuric acid acted as not only the catalyst for esterification, it was also the source of the hydronium ions that penetrated the cellulose and promoted the hydrolytic cleavage of the glycosidic bonds in order to facilitate CNP production. A higher temperature or severity in esterification was also employed than those used in the conventional acetic acid process in order to substantially open the fiber structure and minimize the mechanical energy input in producing CNPs. A DS of approximately two was achieved, which resulted in highly hydrophobic CNPs.

2. Materials and Methods

2.1. Materials and Chemicals

A dry lap bleached eucalyptus kraft pulp (BEP) obtained from Aracruz Cellulose (Brazil) was used as the starting cellulose material. BEP was first soaked in water overnight and disintegrated for 5000 revolutions at 312 rpm and 5% consistency at room temperature (Model 73-06-01, TMI, Ronkonkoma, New York, NY, USA). The pulp was then vacuum dewatered and air dried to approximately 5% moisture content. The resultant pulp fibers were stored in plastic bags for later use.
Concentrated sulfuric acid (98%), acetic anhydride (Ac2O), acetic acid (HAc), chloroform, acetone, and alcohol were purchased from Sigma-Aldrich (St. Louis, MO).

2.2. Synthesis of Esterified Cellulose Nanomaterials

Fiber esterification was conducted according to the schematic diagram shown in Figure 1 in a range of conditions, as listed in Table 1. Each mixture of 5 g in oven dry (OD) weight BEP with Ac2O (50–100 mL), with or without HAc (50–0 mL), and concentrated sulfuric acid (0.3–1.5 mL), was placed in a 250-mL three-necked flask that was fitted with a reflux condenser and heated in an oil bath to 60–85 °C under stirring for 1–2 h. When only Ac2O was used for acetylation without HAc, the amount of Ac2O was 100 mL, in order to maintain a constant solid-to-liquid ratio of approximately 1:20 (g BEP mL−1 solution). At the end of each reaction, the flask was removed from the oil bath, and cooled to room temperature. The mixture was then poured into a beaker containing ethanol, and stirred for several minutes. After centrifugation and washing with water three to five times at room temperature to remove unreacted reactants and byproducts, the solids at approximately 1% consistency were mechanically treated using a microfluidizer (M-110EH, Microfluidics Corp., Westwood, MA) at an operating pressure of 120 MPa for three passes through two chambers in a series with diameters of 200 μm and 87 μm (Figure 1), respectively. Compared with the 40 passes that are required through the same microfluidizer to produce nanometer-sized cellulosic fibrils using the same BEP fibers but without chemical treatment [33], this represents a substantial mechanical energy savings, although the actual energy consumption was not measured. This is because esterification substantially eroded the fibers, as shown in Figure 2 later. An aliquot of each acetylated CNP by microfluidization was dialyzed for a week until the pH of the dialysis water no longer changed. The CNPs were then freeze-dried at −50 °C for 72 h, and denoted as PeM-CNP.

2.3. Determination of the Degree of Substitution

The DS of each PeM-CNP or BEP was determined through titration by the complete basic hydrolysis of the ester linkages and titrating excess alkali, according to a literature method with minor modifications [34]. An accurately weighed 0.5 g (OD) sample (with either BEP as control or PeF-CNP) was added to 25 mL of 75% (v/v) ethanol solution. The suspension was then stirred in a water bath at 50 °C for 30 min to promote swelling. A 20-mL NaOH solution of 0.5 mol·L−1 was accurately measured and added into the suspension. The mixture was stirred at 50 °C for 30 min, and then cooled to room temperature and continuously stirred for 24 h. The excess alkali in the solution was titrated using a 0.5 mol·L−1 HCl solution with phenolphthalein as the indicator.
Acetyl content (wt %) was calculated as:
A   ( wt   % ) = [ ( V n V 0 ) × C × 43 × 10 3 × 100 ] / m
where V0 = volume (mL) of HCl used to titrate blank, Vn = volume (mL) of HCl consumed in titration, C = HCl molar concentration, m = sample OD mass (g), and 43 = molecular weight of acetyl group, i.e., CO–CH3.
The DS was calculated from the determined acetyl content (%A) as:
D S = 162 × A / [ 43 × 100 ( 43 1 ) × A ) ]
where 162 = molecular weight of the anhydroglucose (glucan) unit (AGU), 1 = the molecular weight of hydrogen.

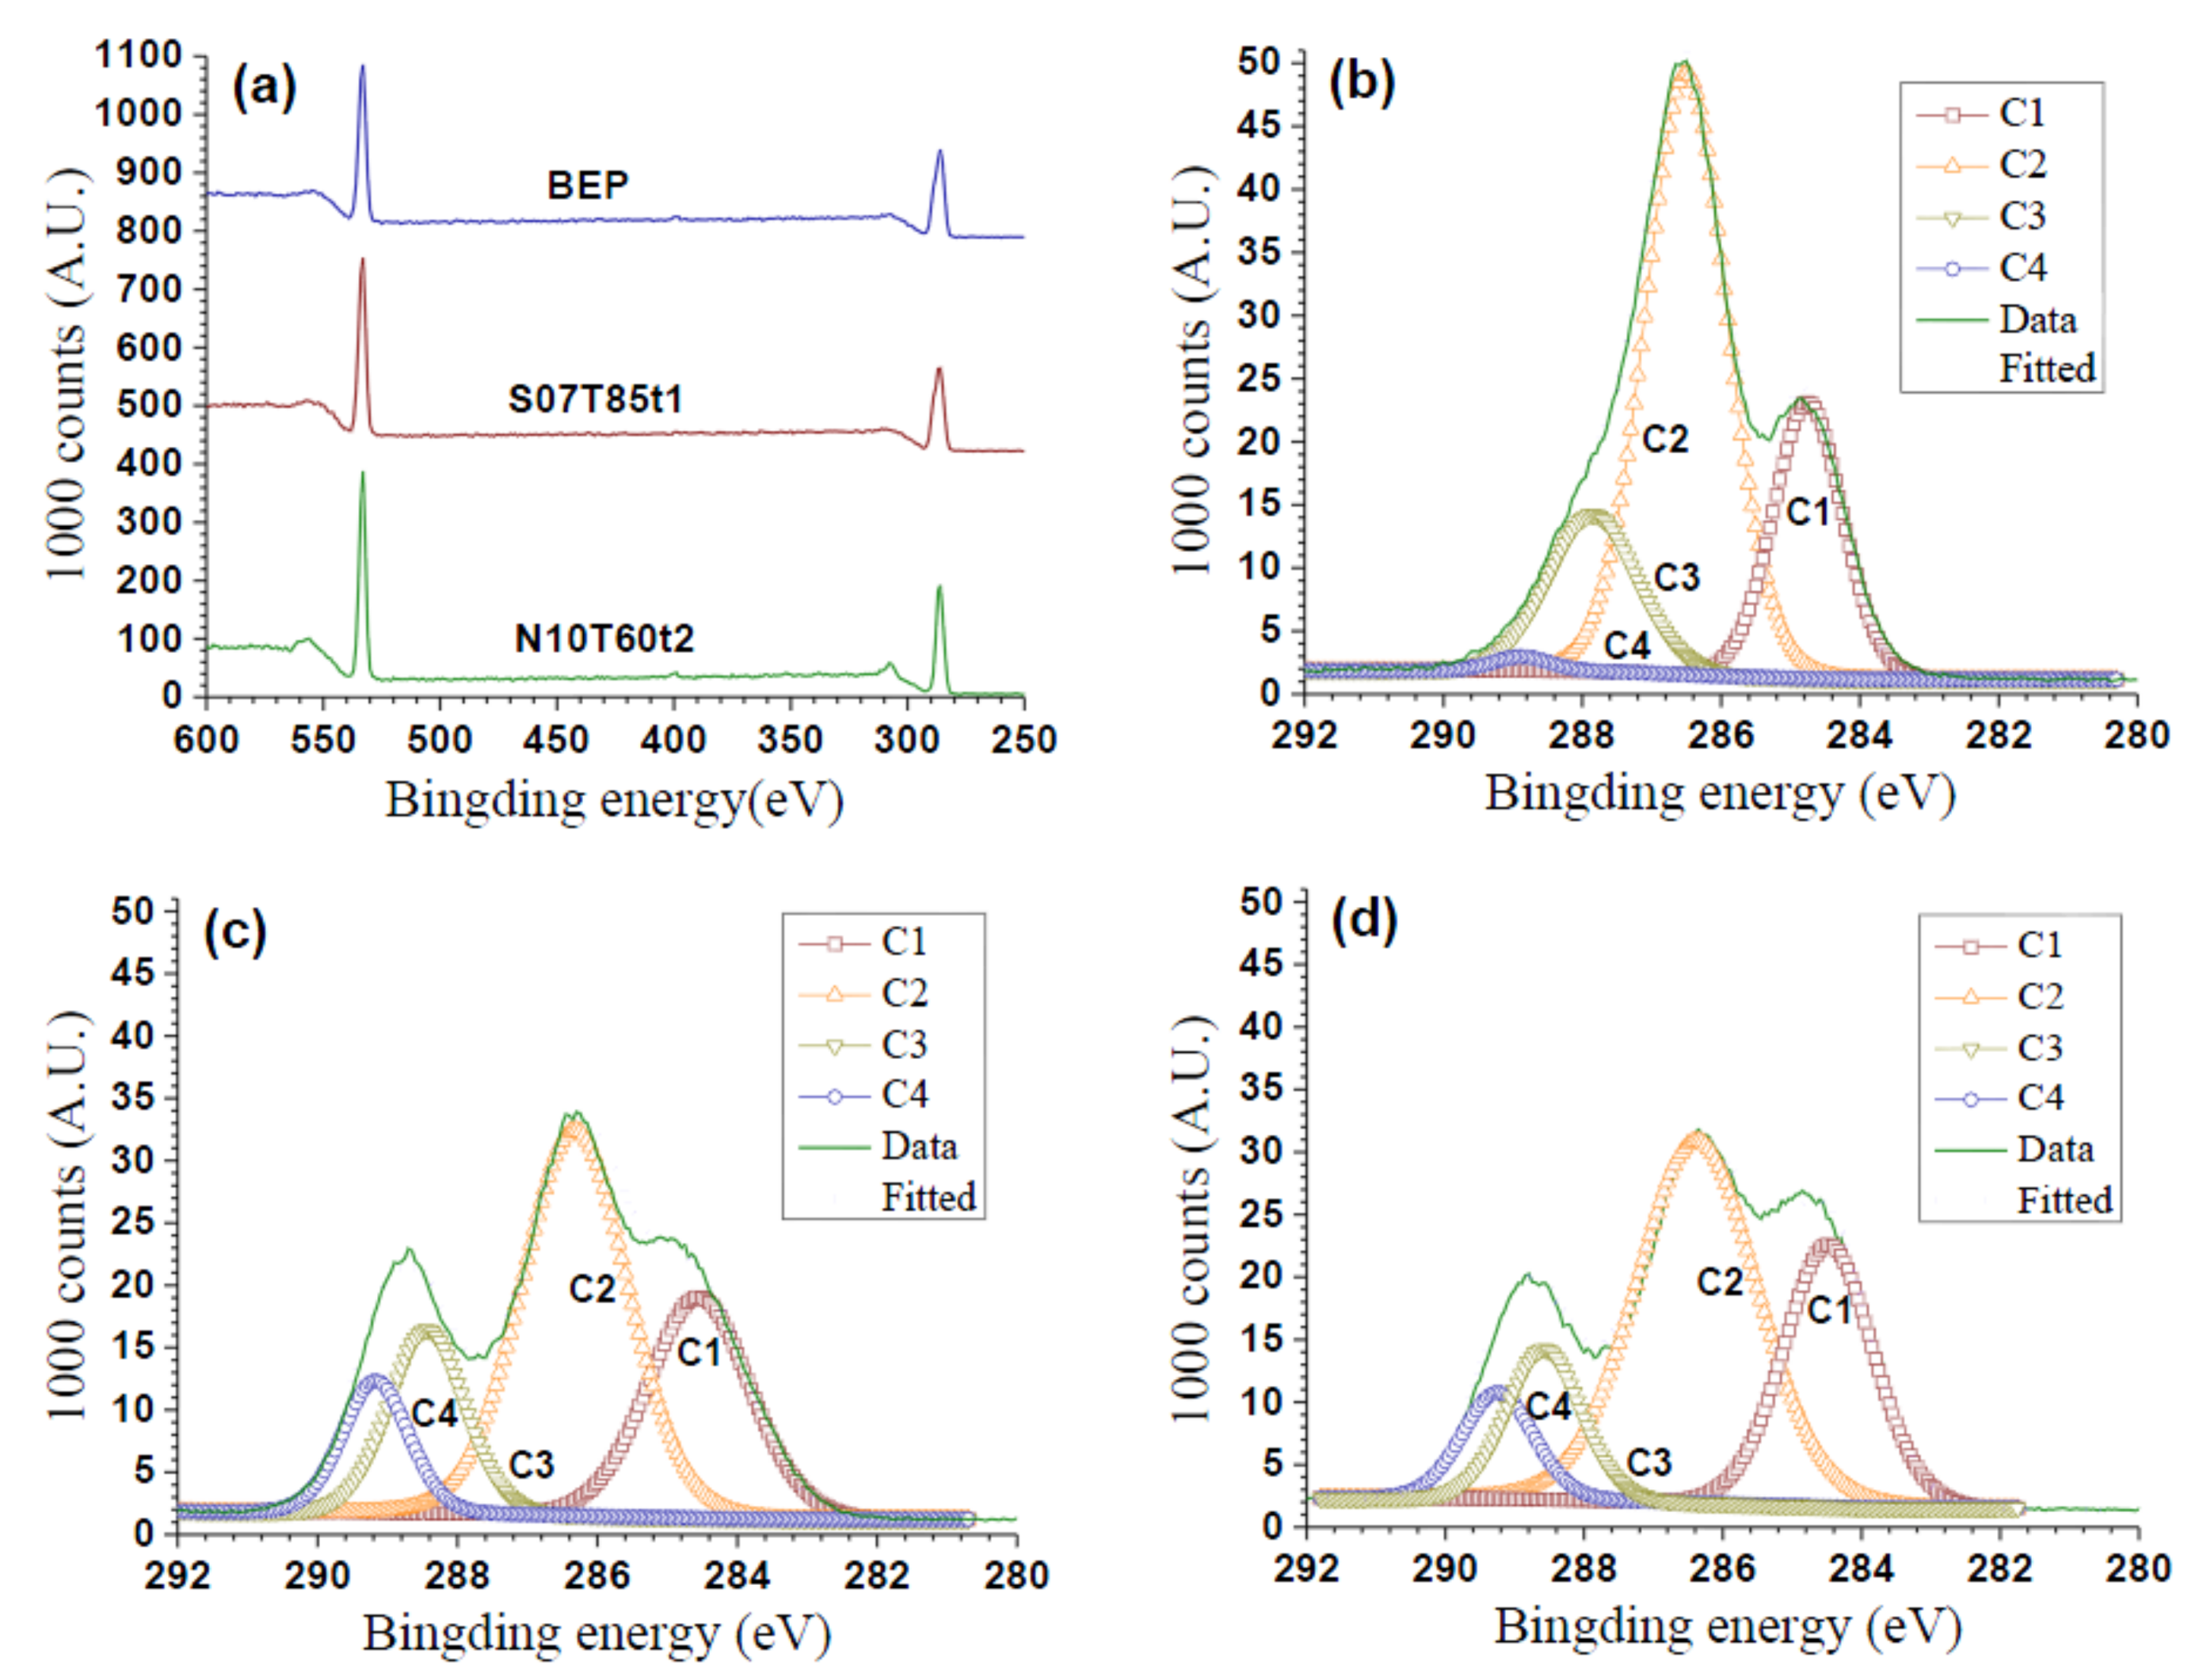
2.4. Chemical Structural Analysis

The Fourier transform infrared (FTIR) spectra of the original BEP and esterified wood fibers were obtained using a commercial Fourier transform infrared spectrometer (FTIR) (Spectrum Two, PerkinElmer, UK) with a universal attenuated total reflection (ATR) probe. All of the spectra were recorded in a wave number range of 400–4000 cm−1. Spectra were recorded at least twice for each sample in order to ensure reproducibility.
The solid-state 13C-NMR spectra of the BEP and PeM-CNP samples were recorded at room temperature with a Bruker AVANCE III 400 solid state spectrometer.
The crystallinities of BEP and PeM-CNP were evaluated by X-ray diffraction (XRD, MinFlex600, Cu K, l ¼ 0.15418 nm). Scans were performed from 5° to 60°.
Elemental analyses (EA) of BEP and PeM-CNP samples were carried out by a Vario EL Cube elemental analyzer. The weight percentages of C, H, and O in BEP and PeM-CNPs were measured. The collected data were used to determine the DS of the CNPs as:
D S C N P = C A G U C · M A G U C · ( M C A 1 ) C C A
where CAGU = 72 g·mol−1 per AGU is the carbon mass in one AGU; C is the measured carbon content (wt %) in the sample; MAGU = 162 g·mol−1; CCA = 24 g·mol−1 is the carbon mass in one acetyl group; and MCA is the molecular weight of the acetyl group (43 g·mol−1).
The surface compositions of the esterified cellulosic materials were evaluated by X-ray photoelectron spectra (XPS, Thermo Scientific ESCALAB 250). In these measurements, the C–C/C–H component of the C1s peak was adjusted to 286.4 eV. The degrees of surface substitution (DSS) were determined as [35]:
DSS = C 4 × M A G U C 4 × M C A M C
where C4 is the percentage of the signal attributed to O–C=O moieties, and MC = 12 g·mol−1 is the atomic mass of carbon.
Thermogravimetric analyses (TGA) of the original BEP and PeM-CNP samples were carried out on a thermogravimetric analyzer (Pyris 1, PerkinElmer, Inc., Waltham, MA). Approximately 5-g samples were heated from ambient to 600 °C under a stream of high purity nitrogen of 20 mL∙min−1 using a heating rate of 10 °C∙min−1.

2.5. Morphology Analyses

Electron microscopic imaging of cellulosic samples was carried out using an environmental scanning electron microscope (ESEM, Leo EVO 40, Carl Zeiss NTS, Peabody, MA, USA) and a field-emission scanning electron microscope (FE-SEM, Nova NanoSEM 230, FEI Company, ThermoFisher, Hillsboro, OR, USA). All of the samples were sputter-coated with gold in order to provide adequate conductivity for SEM analyses. Images were taken at an accelerating voltage of 5~7 kV. Micrographs were recorded at 1000~100,000 magnification in order to ensure clear images. The esterified fiber samples were also examined by transmission electron microscopy (TEM TECNAI G2F20, FEI Company, ThermoFisher, Hillsboro, OR, USA).
The morphologies of the PeM-CNP samples were also analyzed by atomic force microscopy (AFM) (CS-3230, AFM workshop, Signal Hill, CA, USA). Samples were diluted to solids consistency of 0.01 wt % and deposited on a clean mica substrate, and then air-dried overnight at room temperature. A silicon cantilever with tip radius of curvature of approximately 10 nm was used to probe samples in vibrating tapping mode at 160–225 kHz.
The size distribution of PeM-CNP was characterized using dynamic light scattering (DLS) (NanoBrook Omni, Brookhaven Instruments, Holtsville, NY, USA). The PeM-CNP suspension was diluted to 0.5 g·L−1 before analyses. The reported results were from triplicate tests, with each test having five runs.

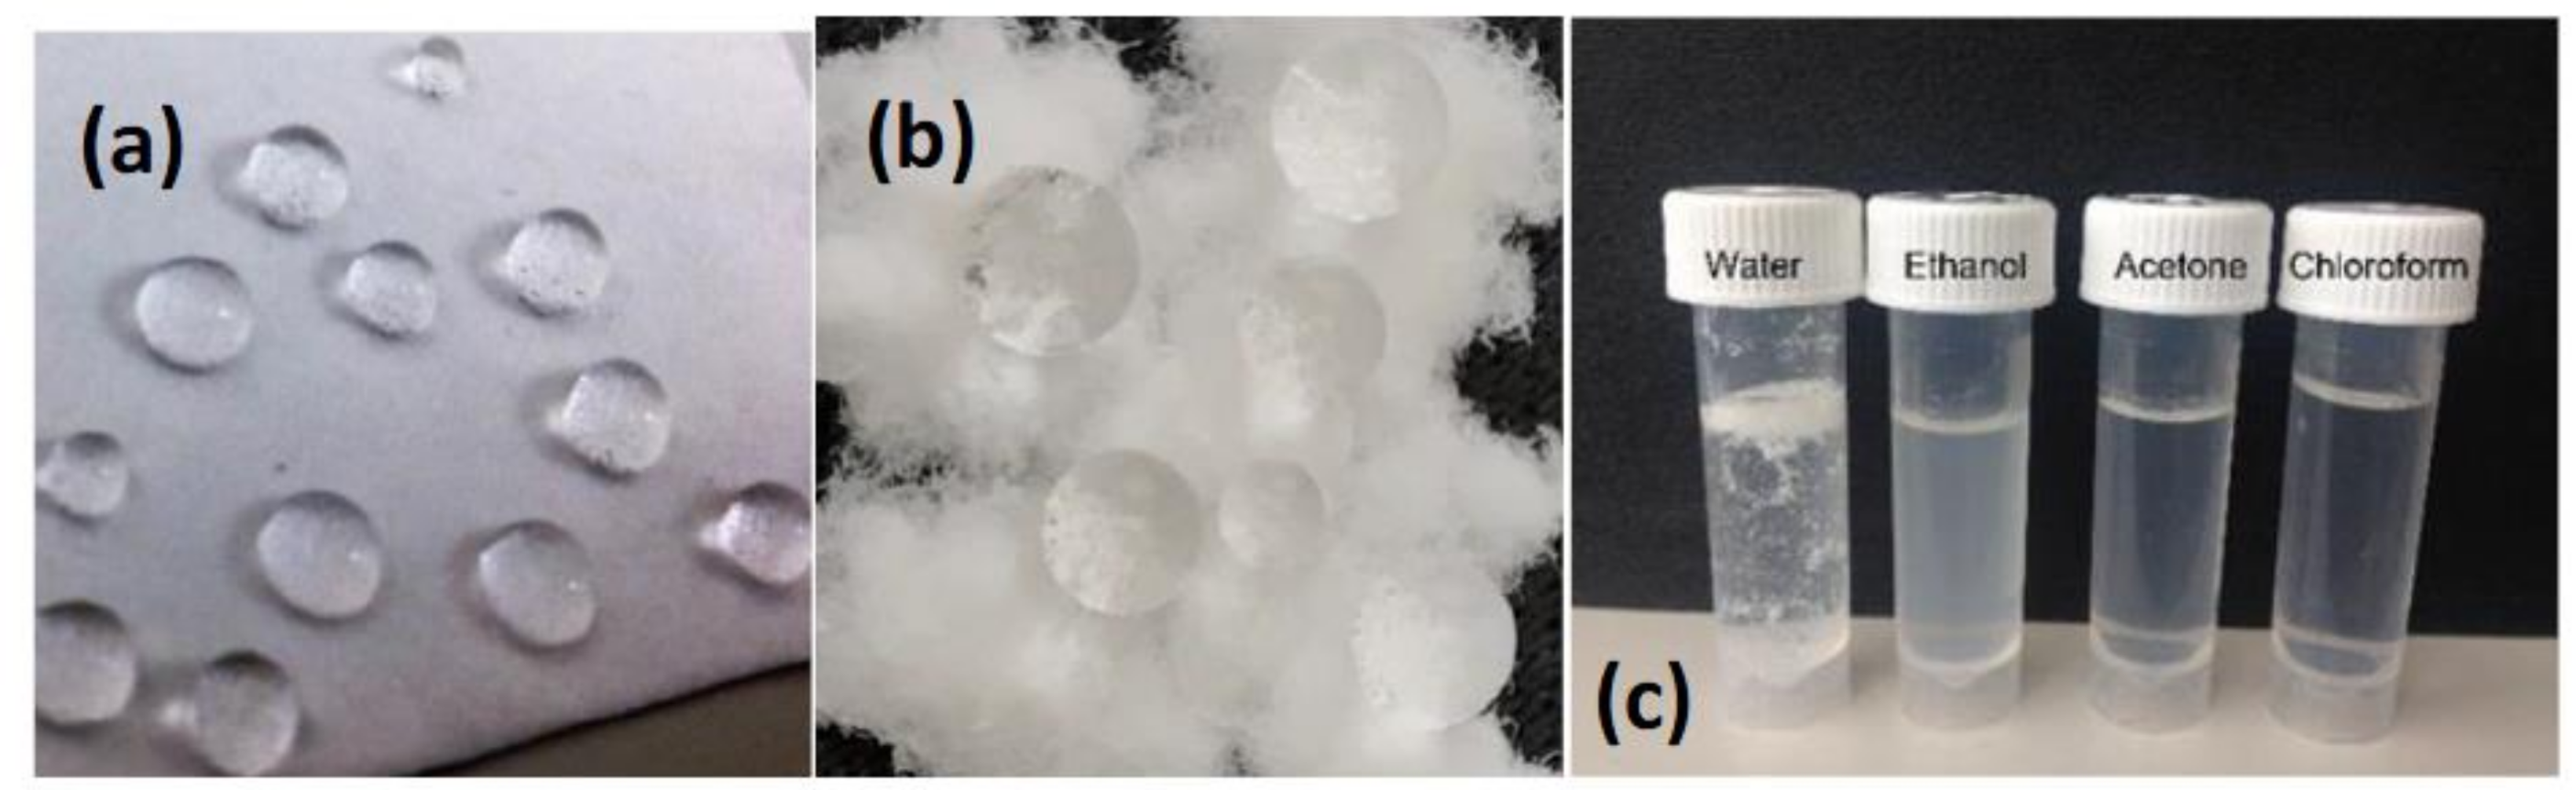
2.6. Water Contact Angle Measurements

The dried PeM-CNP samples prepared with solvent acetic acid (HAc) (S10T80t1, S07T85t1, S05T80t2) were made into pellets. Samples prepared without HAc (N10T80t1, N10T60t2, N06T85t1) were made into handsheets in a laboratory sheet former, according to the TAPPI standard method (T 205 sp-02). The contact angles of sessile drops of deionized water (DI) (approximately 5~8 μL) on the surface of CNP pellets or handsheets were measured using a contact angle analyzer (Attention Theta, Biolin Scientific, Inc. Stockholm, Sweden). Images were taken for 30 s after a drop impacted on a surface. Curve fitting and data analysis were performed using the One Attension software provided with the instrument. Each reported value is the average of at least triplicate measurements.

3. Results

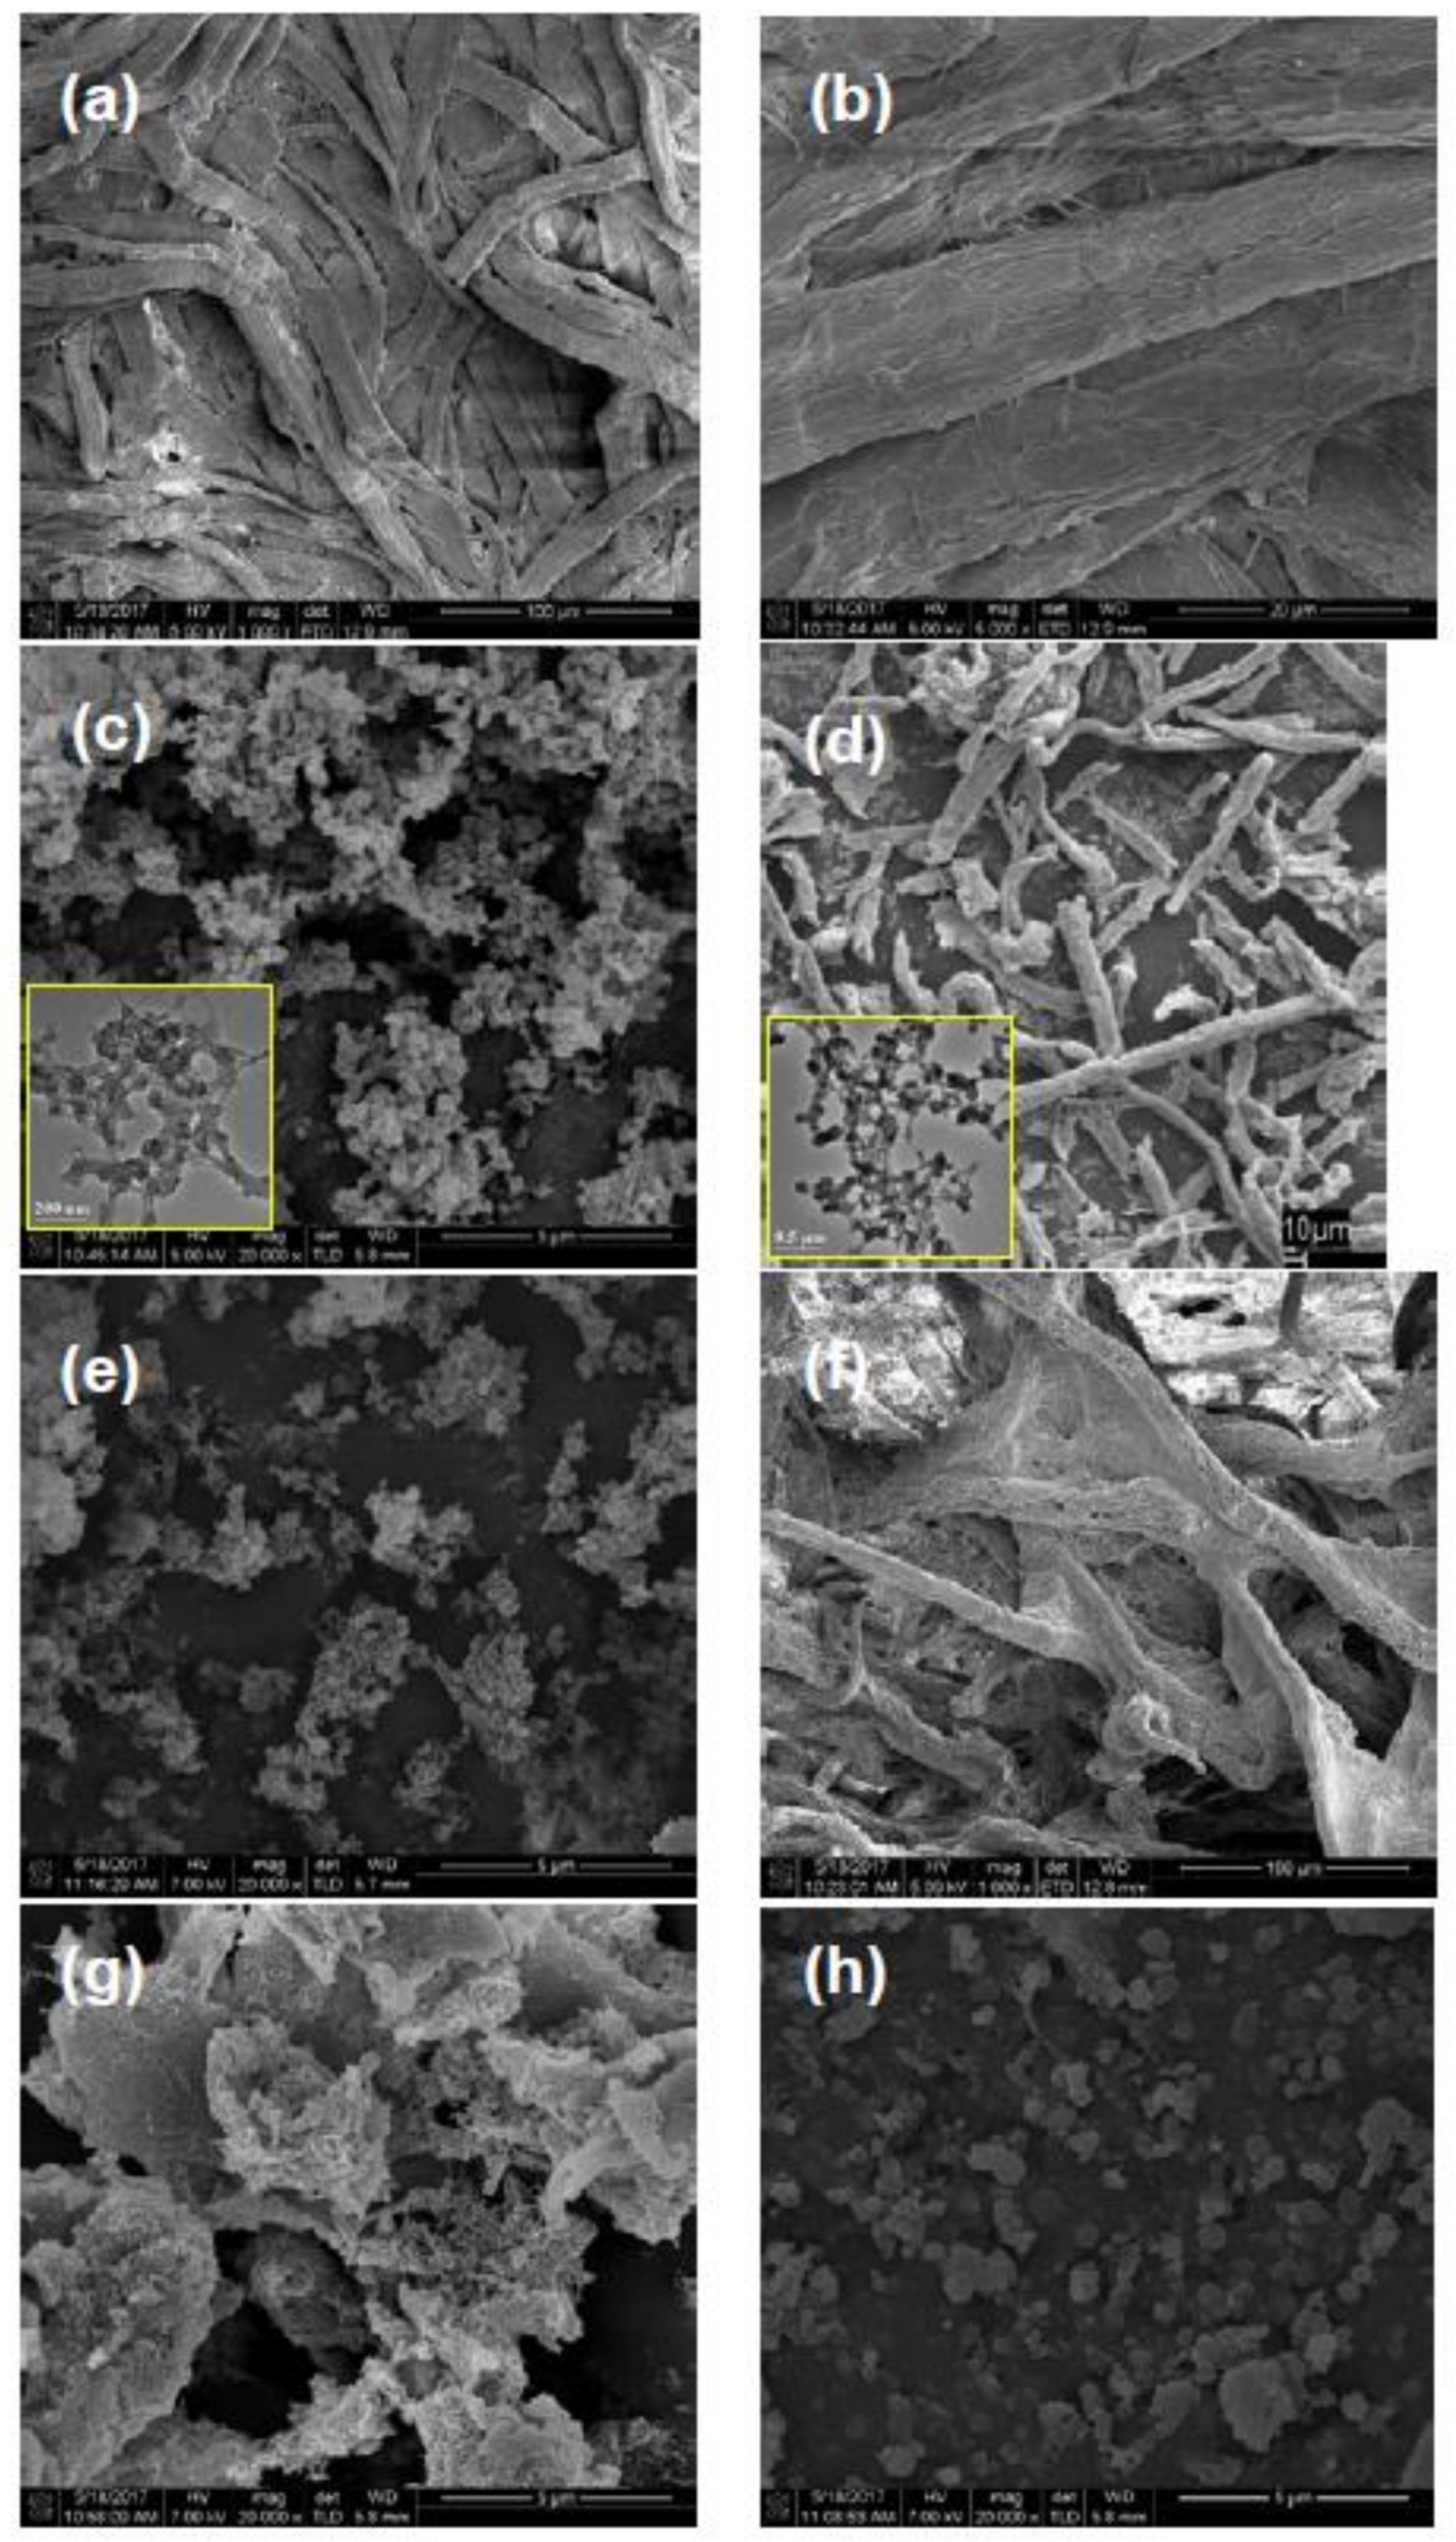
3.1. Effect of Esterification Condition on Fiber DS and Morphology

For the range of esterification conditions, the DS of esterified fibers varied from 0.1 without sulfuric acid, to 2.2 at the highest sulfuric acid application of 1% (v/v), as listed in Table 1. To facilitate discussion, the esterification conditions were labeled as S(or N)xxTyytz, with S and N representing with 50% and without acetic acid substitution, respectively, xx representing sulfuric acid loading in mL per 1000 mL, Tyy representing the reaction temperature in yy degree C, and tz representing the reaction time in z hours. The results suggested that a catalyst (sulfuric acid) concentration was a dominant factor affecting fiber DS compared with reaction time and temperature. The results also indicated that solvent HAc had a positive influence on the DS. The presence of HAc could activate cellulose and accelerate cellulose esterification by Ac2O.
The reaction condition or severity also affected the morphology of the esterified fibers. Under a high DS, cellulosic fibers (Figure 2a,b) were mostly degraded into microparticles with the application of HAc (Figure 2c,e,g). The application of HAc enhanced acid hydrolysis (comparing Figure 2c,d, and Figure 2e,f). The fibers generally retained their fiber shape without HAc (except at T = 85 °C, Figure 2h), but were substantially eroded (Figure 2d,f, approximately the same scale as Figure 2a). However, detailed examinations by TEM (insert images in Figure 2c,d) showed that the microstructures of the cellulose fragments were not different with or without HAc. The reaction temperature and time also affected fiber morphology (comparing Figure 2d,f). As the esterification reaction proceeded, the cellulosic fibers became bulky [24], and also more porous, which accelerated esterification and turned porous fibers into small fragments. Under the same solvent system, the degree of destruction of the cellulosic fibers was correlated to the DS, as demonstrated by S10T80t1 (Figure 2c), S07T85t1 (Figure 2e), and S05T80t2 (Figure 2g), which is in agreement with the literature [36].

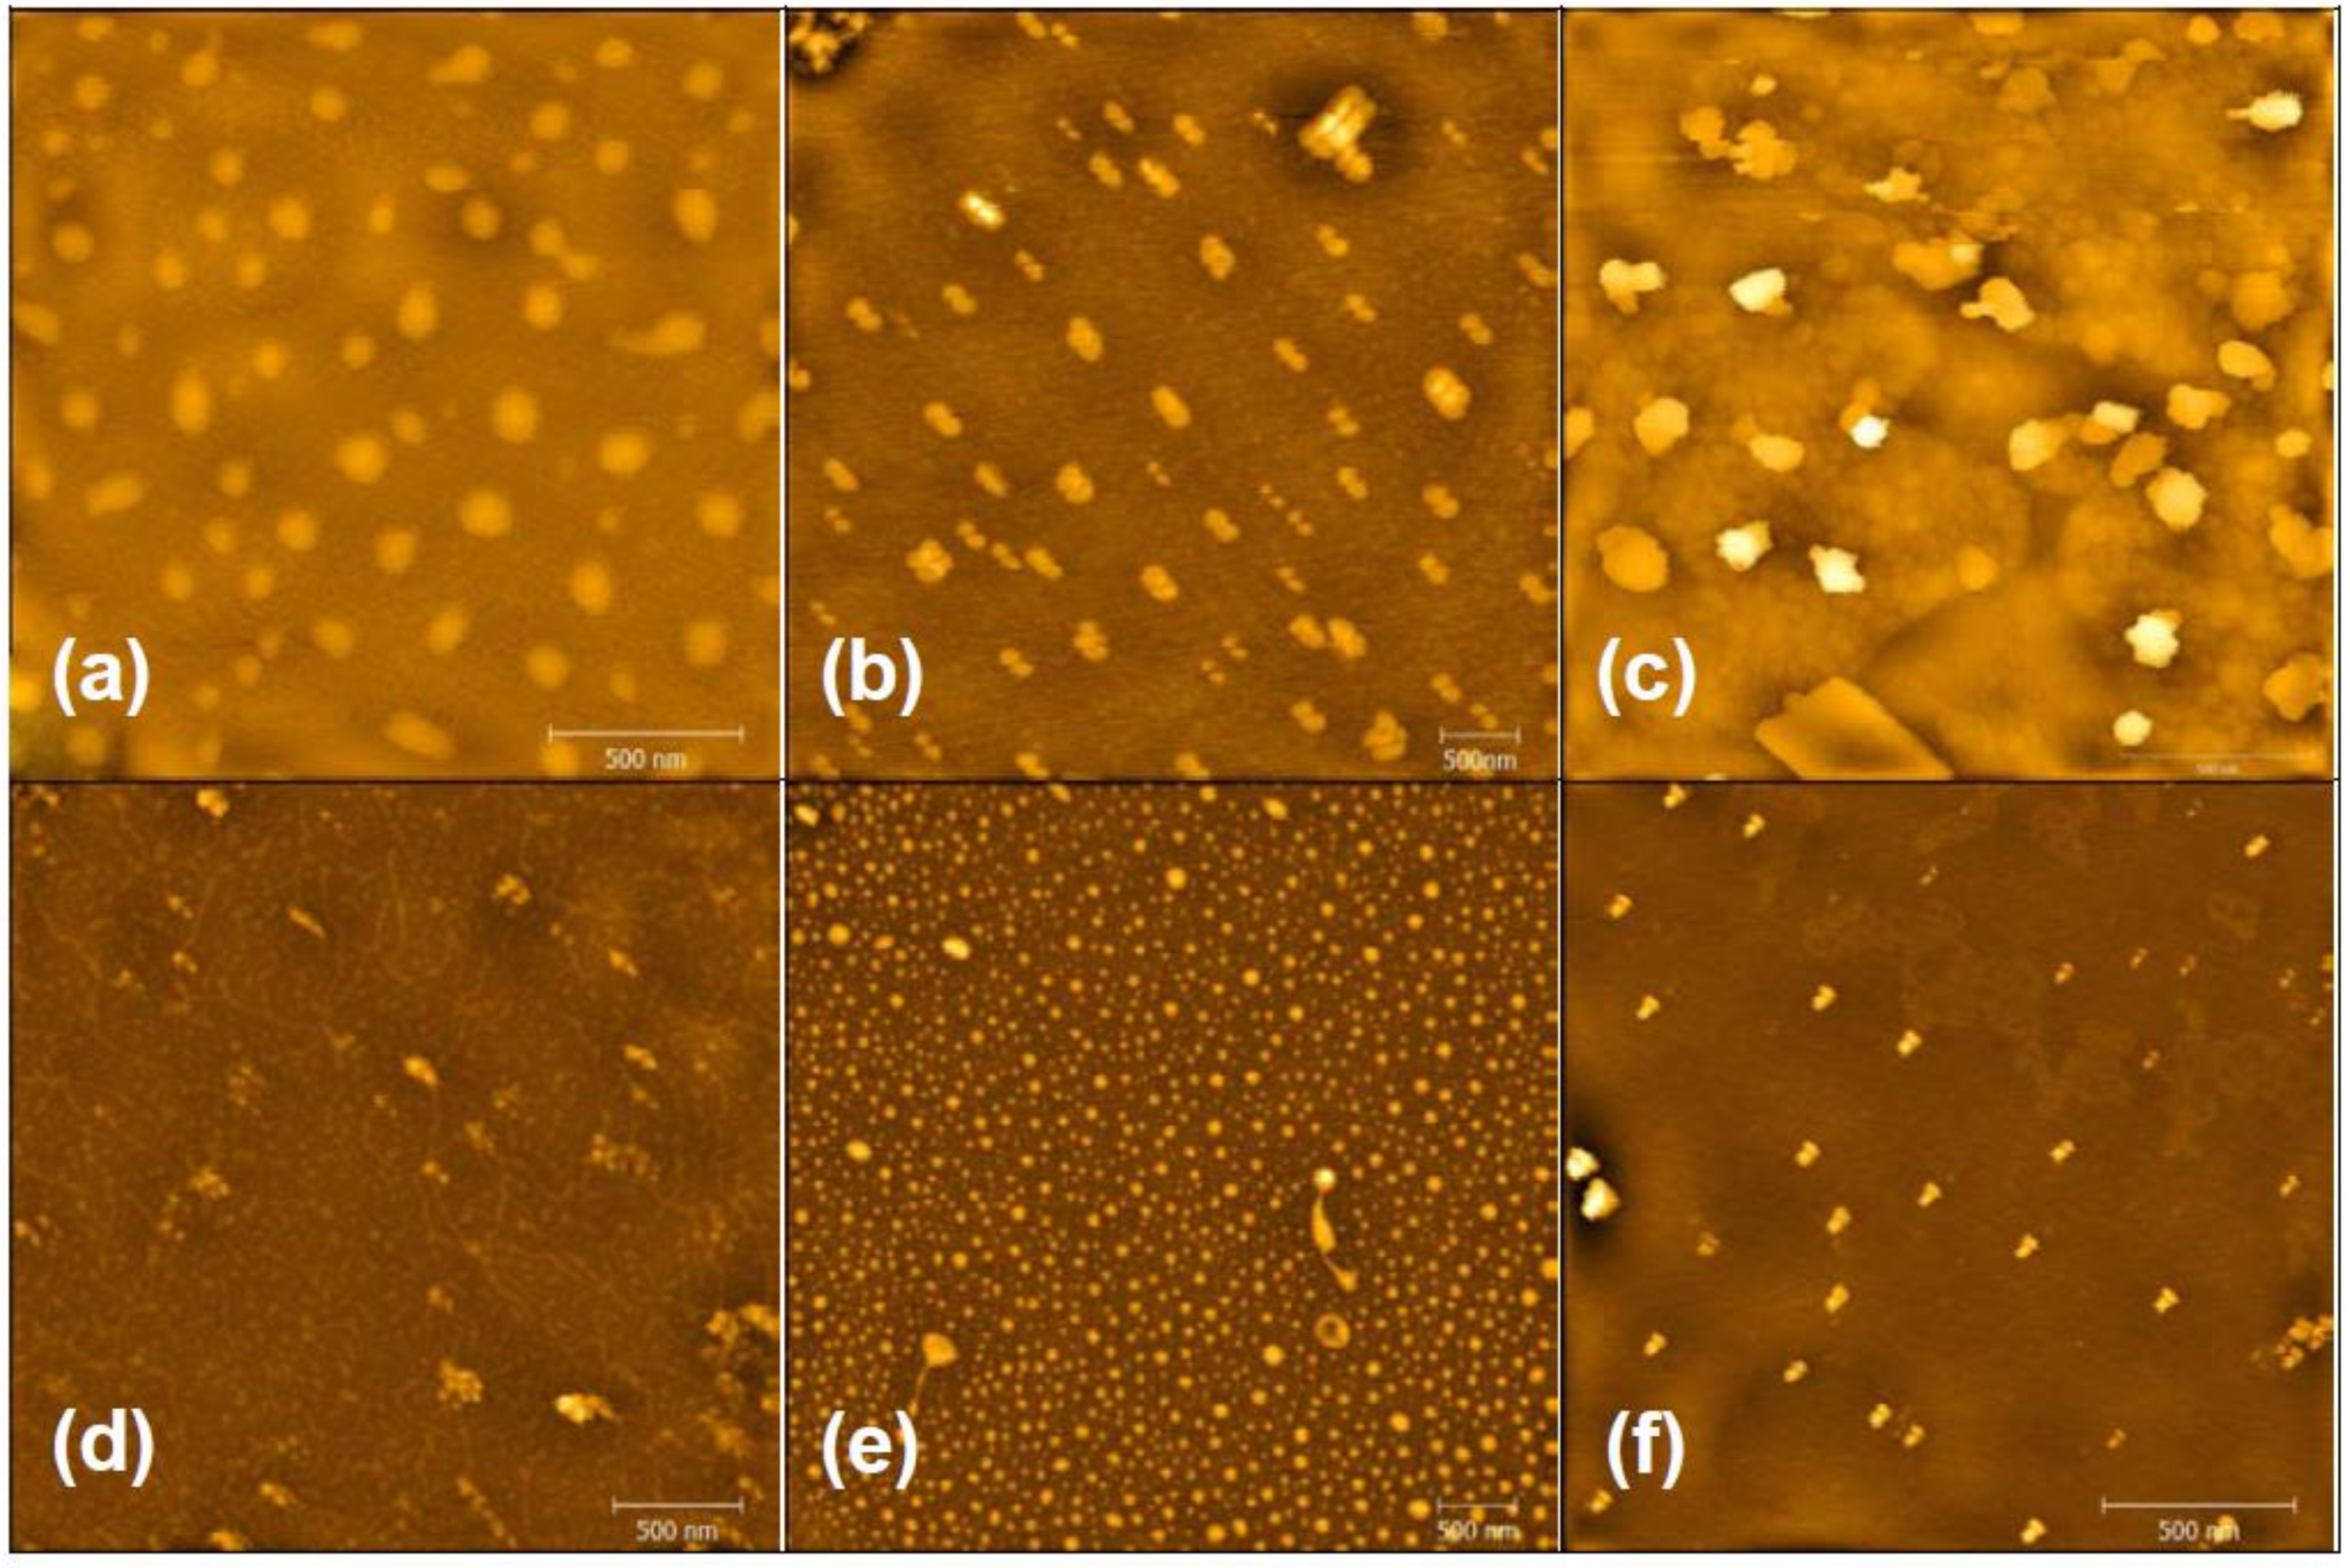
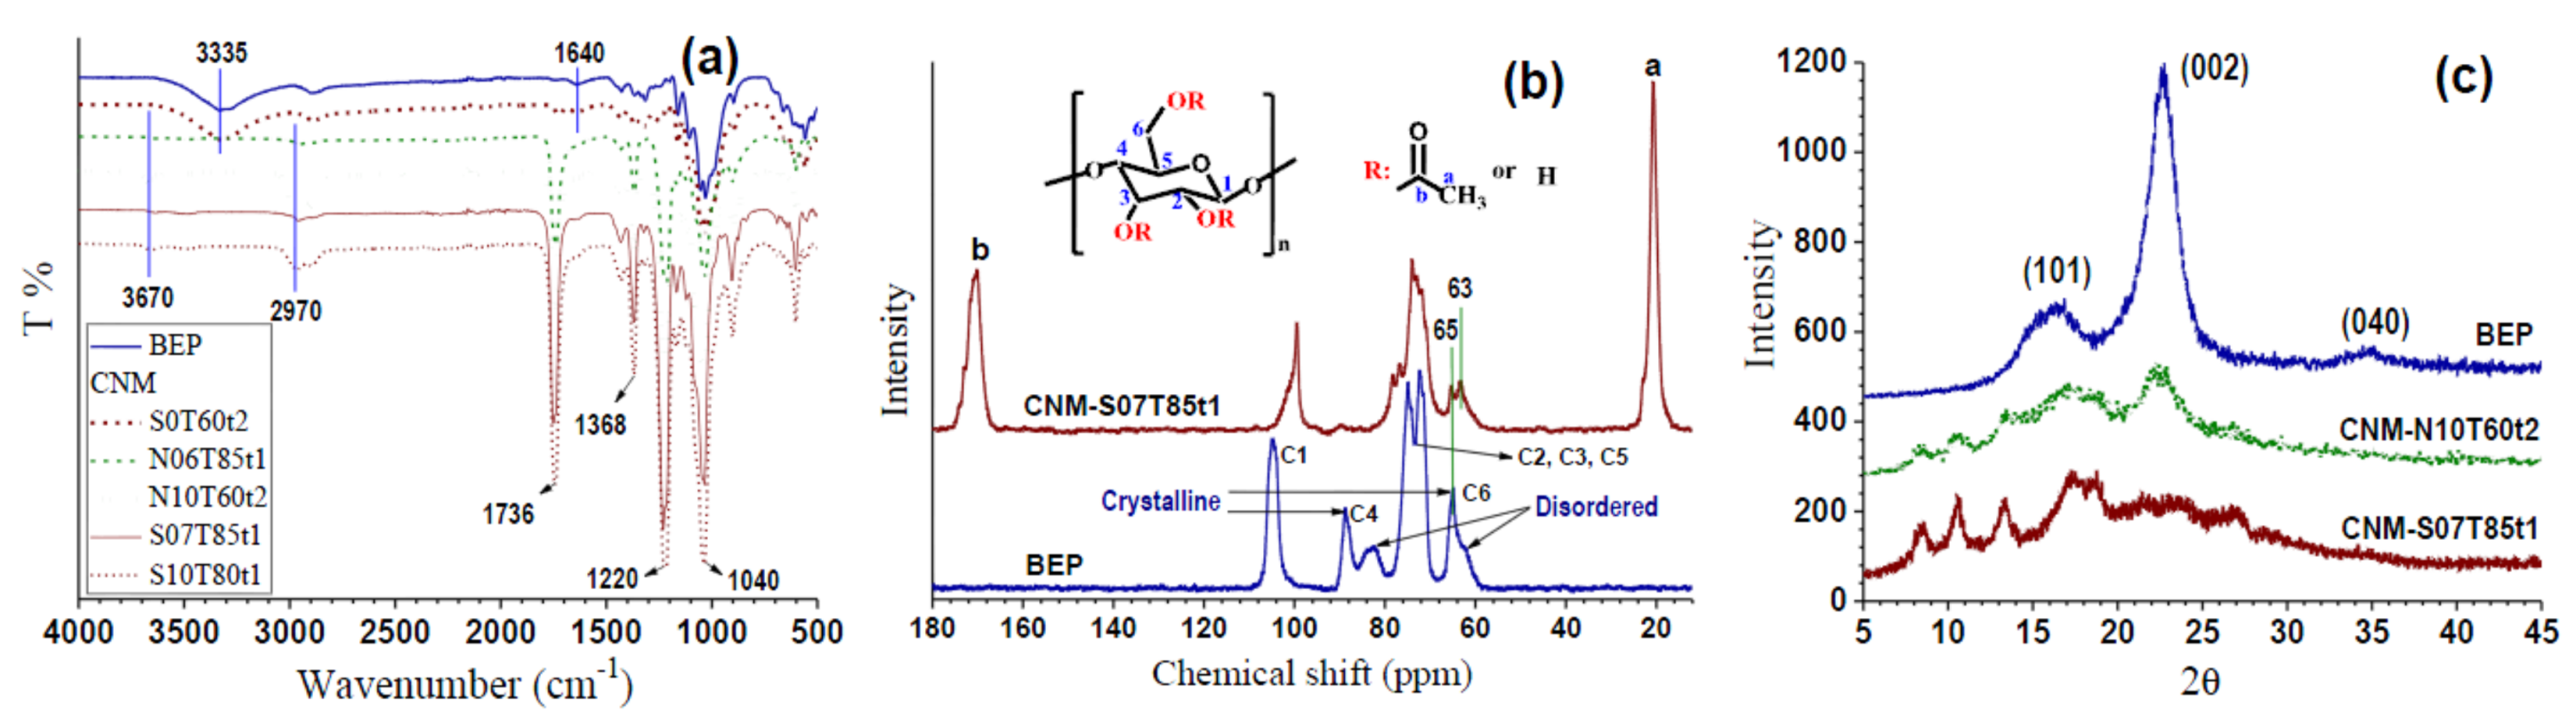
3.2. Morphologies and Chemical Structures of PeM-CNPs

The substantial fragmentation and erosion of cellulosic fibers by esterification resulted in nanoparticles after PeM using a microfluidizer for only three passes (Figure 3, Figure S1). These CNPs appear circular, with a size ranging from approximately 50 nm to 150 nm, depending on the extent of esterification. A lower severity of esterification produced larger particles. AFM images verified the role of sulfuric acid in producing CNPs. Large fragments of cellulosic fibers were apparent, with a low acid concentration (Figure 3c). Nanofibrils could be seen for the sample through esterification without acetic acid at a low severity, N10T80t1. This indicated that the production of highly hydrophobic cellulose nanofibrils may also be possible by using a lower temperature and shorter reaction time than those used in the present study.
Dynamic light scattering (DLS) measurements of sizes of PeM-CNP in aqueous suspensions were between 260–780 nm (Table 2). Furthermore, DLS CNP sizes correlated to the DS (Table 1) for a given solvent system.
Fourier transform infrared (FTIR) spectroscopy, 13C NMR, and XRD were used to study the changes in cellulose chemical structure through esterification. FTIR clearly showed the chemical structural differences between PeM-CNPs and BEP (Figure 4a). Except for CNP-S0T60t2, the prominent changes were the disappearance of the absorbance peak at 3335 cm−1, and the appearance of the new strong peak at 1736 cm−1 in all of the CNP samples, which was attributed to the substitution of the hydroxyl group (-OH) by the ester (-COO-) group. The strong intensity of the carbonyl peak at 1736 cm−1 demonstrated the high DS in these CNPs. In addition, the appearances of signals related to the acetyl structure at 2970 cm−1 (–CH stretching), 1368 cm−1 (-CH bending), 1220 cm−1 and 1040 cm−1 (C-O stretching), and the decreased peak at 1640 cm−1 (hydroxyl bending), were also prominent. It was also interesting to note that the intramolecular and the intermolecular hydrogen bonds in BEP, as represented by the combined broad peak at 3335 cm−1, were greatly reduced and shifted to a higher wavenumber (3670 cm−1) after esterification. This can be ascribed to the conversion of cellulose I to cellulose II [37,38]. CNP-S0T60t2 has a very low DS of 0.1, due to lack of catalyst in the esterification reaction, which resulted in minor changes in its FTIR spectrum, such as a weak peak at 1736 cm−1, and the strong peak at 3335 cm−1 remained.
Solid state 13C NMR spectrum of the BEP sample (Figure 4b) showed the chemical shift assigned to C1 (105 ppm), C4cryst (89 ppm), C4disordered (84 pm), C2/C3/C5 (70~80 ppm), C6cryst (65 ppm), and C6disordered (63 ppm) [26,39]. The spectrum revealed that the BEP was principally arranged in cellulose I form with high crystallinity, as proved by the high peak ratio of C4cryst/C4disordered [14,40]. After esterification, new peaks appeared in the CNP spectrum (Figure 4b) at 170 ppm and 21 ppm, which were assigned to C=O and –CH3 of acetyl ester, respectively, which indicated the occurrence of esterification reaction. Esterification reduced cellulose crystallinity, as can be seen from the sharp decrease in the intensity of the chemical shifts at 89 ppm for crystalline C4, and 65 ppm for crystalline C6, in the CNP spectrum (Figure 4b). This was accompanied by the more obvious and sharp signal at 63 ppm, which we assigned as C6 disordered components of cellulose II [41]. The split and broad peak of C6 in the CNP spectrum could be attributed to the replacement of the hydroxyl group by a corresponding ester [42]. In addition, the C2, C3, and C5 atom carbons of the CNPs also displayed evolution, as illustrated by a single peak at 73 ppm, instead of the split signal seen in BEP. This is in agreement with the chemical shift observed from the ester modified hydroxyls [24]. The results discussed above suggest the partial conversion of cellulose I to II after esterification.
XRD analyses further verified the change in the crystalline structure through esterification. The BEP diffractogram (Figure 4c) showed three 2θ peaks at approximately 16.4°, 22.5°, and 34.0° (contributing to the 101 plane, 002 plane, and 040 plane) of cellulose I. CNP-N10T60t2 from reaction without acetic acid displayed additional peaks at 8.4°, 10.6°, and 13.3° in addition to the similar cellulose I peaks at much lower intensities. These new peaks at 2θ below 14° belonged to the additional side chain crystalline arrangements of the acetyl groups. The reduction in crystallinity compared with that of BEP resulted from the introduction of the acetyl groups by breaking the intermolecular and intramolecular hydrogen bonds of the cellulose. The acetyl groups had a greater size than the hydroxyl groups. With the application of acetic acid, two new peaks at 2θ of 17.3 and 21.4 were obvious from the spectrum of CNP-S07T85t1 (Figure 4c), which were from cellulose II allomorphic crystallographic planes [41,43,44]. Meanwhile, cellulose I peaks were also observed. It showed that the PeM-CNP samples were a mixture of cellulose I and cellulose II. Part of the PeM-CNP segments retained their cellulose I identity, whereas other segments were converted to cellulose II that is a more thermodynamically stable allomorph [45]. The XRD results indicated that esterification with acetic acid resulted in changes of the crystalline structure from native cellulose I to cellulose II.

3.3. Degree of Substitution of PeM-CNP

The DS of PeM-CNP was obtained through elemental analysis (EA) using Equation (3). The results showed (Table 3) that the experimental mass fraction of carbon and oxygen in BEP was 43.61% and 50.16%, respectively. These fractions gave an O/C ratio of 1.15, which was slightly higher than the anhydroglucose theoretical value of 1.11, due to the presence of xylan in the BEP. Compared with BEP, PeM-CNP showed increased carbon content due to esterification. The calculated DSCNP values (Equation (3)) were close to the corresponding values of the esterified BEP before microfluidization, as obtained by titration method listed in Table 1.
Since the degree of surface substitution (DSS) was more directly related to the CNP surface hydrophobicities, XPS was used to determine the DSS of the PeM-CNPs, according to Equation (4). Both the BEP and PeM-CNP samples exhibited two principal peaks around 533 eV and 286 eV in the full spectra, as shown in Figure 5a, corresponding to oxygen and carbon, respectively. The surface atomic concentrations of the samples were calculated as listed in Table 4. As expected, the O/C ratios of the PeM-CNP samples were decreased compared with that of the original BEP, which was mainly due to the introduction of the acetyl group through esterification.
The deconvolution of the C1s’ high-resolution signal highlighted the differences between the BEP and PeM-CNP samples (Figure 5b–d). Theoretically, pure cellulose exhibits two peaks related to C–O (alcohols and ethers) and O–C–O (acetyl) moieties [46]. In practice, the high-resolution carbon spectra are usually resolved into four component peaks, which are categorized by the number of C–O bonds: C1 has no oxygen bonds (C–C/C–H, non-oxidized alkane-type carbons), C2 has one oxygen bond (C–O), C3 has two oxygen bonds (O–C–O and/or C=O, C of the b-1,4-glycosidic bonds in AGU units), and C4 has three oxygen bonds (O–C=O, ester groups) [47]. The signals of C1 and C4 in the BEP were contributed by non-oxidized alkane-type carbon atoms with impurities (such as lignin, fatty acids) and glucuronic acid from hemicelluloses, respectively. The C2 peak was attributed to the ether groups, the C–OH of the glucose ring, and the hydroxyl end of the cellulose chains. The C3 peak corresponded to the presence of acetyl groups, which was related to the C1 of the AGU unit. Since each AGU unit possessed only one C3 carbon, and there were no hydroxyl groups attached to this carbon atom, the content of C3 was not much changed after esterification (comparing Figure 4b–d). Therefore, the C1/C3 and C4/C3 ratios can be used to reflect the changes following esterification due to the introduction of the C–C (C1) and O–C=O (C4) groups from acetyl moieties. Table 4 summarizes the deconvoluted molar percent of the contributions of the C1 peaks, and the DSS of the PeM-CNP samples as determined from % C4 values (Equation (4)). The increased C1/C3 and C4/C3 ratios indicated the presence of acetyl groups. The determined DSS values (Table 4) were all higher than the values of their respective esterified cellulose sample measured by titrimetric analyses (Table 1), and higher than their respective DSCNP values from the same elemental analyses (Table 3). This indicates that the extent of fiber esterification was sufficient to result in a highly hydrophobic surface at the nanoparticle scale. Since the DSS was substantially lower than three, and because the DSS was higher than DSCNP, the CNP remained as acetylated cellulose with a lower DS in the inner core than on its surface.

3.4. Thermal and Interfacial Properties of PeM-CNP

Thermogravimetric analyses (TGA) of the PeM-CNP samples showed initial minor weight loss in BEP, which could be ascribed to water desorption (Figure S2a); however, the weight loss was not obvious for the two PeM-CNP samples, because they were more hydrophobic than BEP. The onset thermal degradation temperatures Tonset defined as dW/dT = −1 [29], maximal weight loss temperature, Tmax, and T95 defined at 5% weight loss, are summarized in Table 5. The decrease in the thermal stability of original cellulose after acid hydrolysis treatment was previously discussed, and was typical for sulfuric acid-hydrolyzed cellulose [48,49]. However, the PeM-CNP samples displayed much higher Tonset than the pristine unesterified CNC prepared using sulfuric hydrolysis [24,26,29]. The overall enhancement of the thermal stability performance of PeM-CNP samples was from the combination of the introduction of an acetyl group and the contribution of more thermally stable cellulose II components. The co-existence of cellulose I and II in PeM-CNP samples was also confirmed by the appearance of two different peaks (304.3 °C and 380.6 °C for S2, 304.8 °C and 382.7 °C for S3) in derivative thermograph (DTG) profiles (insert in Figure S2b).
The surface hydrophobicities of the PeM-CNP samples can be clearly seen from the shape of the water droplets on the PeM-CNP surface (Figure 6a,b). The static water contact angles (CA) were analyzed (Table 4 and Figure S3), and show excellent hydrophobicity. The time-dependent measurements indicated that the contact angles were fairly stable (Figure S4).
The esterification of cellulose resulted in a substantially improved redispersion of freeze-dried PeM-CNP in solvents, due to the replacement of the hydroxyl groups in cellulose by hydrophobic acetyl esters. The freeze-dried PeM-CNP-S05T80t2 (2 wt %) was redispersed in ethanol, acetone, and chloroform after storage under ambient conditions with sonication. As shown in Figure 6c, a clear and homogeneous solution was obtained in both acetone and chloroform, whereas a translucent homogeneous suspension was obtained in ethanol. CNP flocculation was clearly observed in water. The good redispersion of freeze-dried PeM-CNP in ethanol was also confirmed by the DLS-measured sizes of the samples. As listed in Table 2, the average DLS size of the freeze-dried samples in ethanol showed no substantial difference from the DLS size of the corresponding fresh (not dried) sample. However, a large size variation was observed between the redispersed freeze-dried CNM in water from the corresponding fresh sample.

4. Conclusions

We successfully prepared highly hydrophobic cellulose nanoparticles (CNPs) from bleached eucalyptus kraft pulp fibers through post-esterification mechanical treatment (PeM) with minimal mechanical energy input. A high degree of substitution of hydroxyl groups on the surface was achieved using a mixture of acetic anhydride, acetic acid, and sulfuric acid as catalysts, but at a higher temperature range—between 60–85 °C—than those used in a conventional acetic acid esterification process. Detailed morphological and chemical structural analyses of the resultant PeM-CNP were performed using various techniques. These characterizations revealed a PeM-CNP sample particle size of 50–150 nm, and a high hydrophobicity, with a high degree of surface substitution (DSS). The PeM-CNPs had high thermal stability, partly due to the partial transformation of cellulose I to cellulose II through esterification. The greatly enhanced hydrophobicity improved the redispersion of PeM-CNPs in organic solvents, and prohibited the formation of strong hydrogen bonding upon drying.

Supplementary Materials

The following are available online at https://www.mdpi.com/2079-6439/6/2/22/s1, Figure S1: AFM images of post esterification fibrillated (PeM) cellulose paticles (CNP). (a) CNM-S10T80t1; (b) CNM-S05T80t2; (c) CNM-N10T80t1; (d) CNM-N10T60t2. Figure S2: Thermal stability of BEP and PeM-CNP samples. (a) weight loss; (b) derivative weight loss. Figure S3: Water contact angle on surface of PeM-CNP pellets: (a) S10T80t1; (b) S07T85t1; (c) S05T80t2; (d) N10T80t1; (e) N10T60t2; (f) N06T85t1. Figure S4: Time-dependent water contact angle on PeM-CNP samples.

Acknowledgments

This work was conducted while Lin was a visiting scholar at the US Forest Service, Forest Products Laboratory (FPL), Madison, WI, and on official government time of Zhu. This work was partially financial supported by the Science and Technology Project of Fujian Province Educational Department (No. JZ160416) and Chinese Scholarship Council (CSC). Funding from these programs made the visiting appointments of Lin at FPL possible.

Author Contributions

C.L. conducted major parts of the study and drafted the manuscript. Q.M. contributed to AFM analyses. Q.S. contributed to sample characterizations using FE-SEM, XRD, XPS, EA and 13C-NMR. H.B. contributed to microfluidization and thermal stability tests. J.Z. contributed to data analyses and major revisions of the manuscript.

Conflicts of Interest

The authors declare no conflicts of interest.

References

  1. Eichhorn, S.J.; Dufresne, A.; Aranguren, M.; Marcovich, N.E.; Capadona, J.R.; Rowan, S.J.; Weder, C.; Thielemans, W.; Roman, M.; Renneckar, S.; et al. Review: Current international research into cellulose nanofibres and nanocomposites. J. Mater. Sci. 2009, 45. [Google Scholar] [CrossRef]
  2. Zhu, H.; Luo, W.; Ciesielski, P.N.; Fang, Z.; Zhu, J.Y.; Henriksson, G.; Himmel, M.E.; Hu, L. Wood-derived materials for green electronics, biological devices, and energy applications. Chem. Rev. 2016, 116, 9305–9374. [Google Scholar] [CrossRef] [PubMed]
  3. Carrick, C.; Wågberg, L.; Larsson, P.A. Immunoselective cellulose nanospheres: A versatile platform for nanotheranostics. ACS Macro Lett. 2014, 3, 1117–1120. [Google Scholar] [CrossRef]
  4. Katz, E.; Willner, I. Integrated nanoparticle-biomolecule hybrid systems: Synthesis, properties, and applications. Angew. Chem. Int. Ed. 2004, 43, 6042–6108. [Google Scholar] [CrossRef] [PubMed]
  5. Sharma, P.R.; Varma, A.J. Functional nanoparticles obtained from cellulose: Engineering the shape and size of 6-carboxycellulose. Chem. Commun. 2013, 49, 8818–8820. [Google Scholar] [CrossRef] [PubMed]
  6. Zhang, J.; Elder, T.J.; Pu, Y.; Ragauskas, A.J. Facile synthesis of spherical cellulose nanoparticles. Carbohydr. Polym. 2007, 69, 607–611. [Google Scholar] [CrossRef]
  7. Beaumont, M.; Nypelö, T.; König, J.; Zirbs, R.; Opietnik, M.; Potthast, A.; Rosenau, T. Synthesis of redispersible spherical cellulose II nanoparticles decorated with carboxylate groups. Green Chem. 2016, 18, 1465–1468. [Google Scholar]
  8. Nikolajski, M.; Wotschadlo, J.; Clement, J.H.; Heinze, T. Amino-Functionalized Cellulose Nanoparticles: Preparation, Characterization, and Interactions with Living Cells. Macromol. Biosci. 2012, 12, 920–925. [Google Scholar] [PubMed]
  9. Thorvaldsson, A.; Edvinsson, P.; Glantz, A.; Rodriguez, K.; Walkenström, P.; Gatenholm, P. Superhydrophobic behaviour of plasma modified electrospun cellulose nanofiber-coated microfibers. Cellulose 2012, 19, 1743–1748. [Google Scholar]
  10. Heux, L.; Chauve, G.; Bonini, C. Nonflocculating and Chiral-Nematic Self-ordering of Cellulose Microcrystals Suspensions in Nonpolar Solvents. Langmuir 2000, 16, 8210–8212. [Google Scholar]
  11. Petersson, L.; Kvien, I.; Oksman, K. Structure and thermal properties of poly(lactic acid)/cellulose whiskers nanocomposite materials. Compos. Sci. Technol. 2007, 67, 2535–2544. [Google Scholar] [CrossRef]
  12. Goussé, C.; Chanzy, H.; Excoffier, G.; Soubeyrand, L.; Fleury, E. Stable suspensions of partially silylated cellulose whiskers dispersed in organic solvents. Polymer 2002, 43, 2645–2651. [Google Scholar] [CrossRef]
  13. Yin, Y.; Tian, X.; Jiang, X.; Wang, H.; Gao, W. Modification of cellulose nanocrystal via SI-ATRP of styrene and the mechanism of its reinforcement of polymethylmethacrylate. Carbohydr. Polym. 2016, 142, 206–212. [Google Scholar] [CrossRef] [PubMed]
  14. Berlioz, S.; Molina-Boisseau, S.; Nishiyama, Y.; Heux, L. Gas-Phase Surface Esterification of Cellulose Microfibrils and Whiskers. Biomacromolecules 2009, 10, 2144–2151. [Google Scholar] [CrossRef] [PubMed]
  15. Peng, S.X.; Chang, H.; Kumar, S.; Moon, R.J.; Youngblood, J.P. A comparative guide to controlled hydrophobization of cellulose nanocrystals via surface esterification. Cellulose 2016, 23, 1825–1846. [Google Scholar] [CrossRef]
  16. Sèbe, G.; Ham-Pichavant, F.; Pecastaings, G. Dispersibility and Emulsion-Stabilizing Effect of Cellulose Nanowhiskers Esterified by Vinyl Acetate and Vinyl Cinnamate. Biomacromolecules 2013, 14, 2937–2944. [Google Scholar] [CrossRef] [PubMed]
  17. Habibi, Y. Key advances in the chemical modification of nanocelluloses. Chem. Soc. Rev. 2014, 43, 1519–1542. [Google Scholar] [CrossRef] [PubMed]
  18. Fahma, F.; Takemura, A.; Saito, Y. Acetylation and stepwise solvent-exchange to modify hydrophilic cellulose whiskers to polychloroprene-compatible nanofiller. Cellulose 2014, 21, 2519–2527. [Google Scholar] [CrossRef]
  19. Junior de Menezes, A.; Siqueira, G.; Curvelo, A.A.S.; Dufresne, A. Extrusion and characterization of functionalized cellulose whiskers reinforced polyethylene nanocomposites. Polymer 2009, 50, 4552–4563. [Google Scholar] [CrossRef]
  20. Kato, H.; Nakatsubo, F.; Abe, K.; Yano, H. Crosslinking via sulfur vulcanization of natural rubber and cellulose nanofibers incorporating unsaturated fatty acids. RSC Adv. 2015, 5, 29814–29819. [Google Scholar] [CrossRef]
  21. Tingaut, P.; Zimmermann, T.; Lopez-Suevos, F. Synthesis and Characterization of Bionanocomposites with Tunable Properties from Poly(lactic acid) and Acetylated Microfibrillated Cellulose. Biomacromolecules 2010, 11, 454–464. [Google Scholar] [CrossRef] [PubMed]
  22. Uschanov, P.; Johansson, L.-S.; Maunu, S.L.; Laine, J. Heterogeneous modification of various celluloses with fatty acids. Cellulose 2011, 18, 393–404. [Google Scholar] [CrossRef]
  23. Vuoti, S.; Talja, R.; Johansson, L.-S.; Heikkinen, H.; Tammelin, T. Solvent impact on esterification and film formation ability of nanofibrillated cellulose. Cellulose 2013, 20, 2359–2370. [Google Scholar] [CrossRef]
  24. Abraham, E.; Nevo, Y.; Slattegard, R.; Attias, N.; Sharon, S.; Lapidot, S.; Shoseyov, O. Highly Hydrophobic Thermally Stable Liquid Crystalline Cellulosic Nanomaterials. ACS Sustain. Chem. Eng. 2016, 4, 1338–1346. [Google Scholar] [CrossRef]
  25. Espino-Pérez, E.; Domenek, S.; Belgacem, N.; Sillard, C.; Bras, J. Green Process for Chemical Functionalization of Nanocellulose with Carboxylic Acids. Biomacromolecules 2014, 15, 4551–4560. [Google Scholar] [CrossRef] [PubMed]
  26. Miao, J.; Yu, Y.; Jiang, Z.; Zhang, L. One-pot preparation of hydrophobic cellulose nanocrystals in an ionic liquid. Cellulose 2016, 23, 1209–1219. [Google Scholar] [CrossRef]
  27. Braun, B.; Dorgan, J.R. Single-Step Method for the Isolation and Surface Functionalization of Cellulosic Nanowhiskers. Biomacromolecules 2009, 10, 334–341. [Google Scholar] [CrossRef] [PubMed]
  28. Sehaqui, H.; Kulasinski, K.; Pfenninger, N.; Zimmermann, T.; Tingaut, P. Highly carboxylated cellulose nanofibers via succinic anhydride esterification of wheat fibers and facile mechanical disintegration. Biomacmolecules 2017, 18, 242–248. [Google Scholar] [CrossRef] [PubMed]
  29. Chen, L.; Zhu, J.Y.; Baez, C.; Kitin, P.; Elder, T. Highly thermal-stable and functional cellulose nanocrystals and nanofibrils produced using fully recyclable organic acids. Green Chem. 2016, 18, 3835–3843. [Google Scholar] [CrossRef]
  30. Bian, H.; Chen, L.; Dai, H.; Zhu, J.Y. Integrated production of lignin containing cellulose nanocrystals (LCNC) and nanofibrils (LCNF) using an easily recyclable di-carboxylic acid. Carbohydr. Polym. 2017, 167, 167–176. [Google Scholar] [CrossRef] [PubMed]
  31. Tang, L.; Huang, B.; Lu, Q.; Wang, S.; Ou, W.; Lin, W.; Chen, X. Ultrasonication-assisted manufacture of cellulose nanocrystals esterified with acetic acid. Bioresour. Technol. 2013, 127, 100–105. [Google Scholar] [CrossRef] [PubMed]
  32. Sassi, J.-F.; Chanzy, H. Ultrastructural aspects of the acetylation of cellulose. Cellulose 1995, 2, 111–127. [Google Scholar] [CrossRef]
  33. Wang, W.; Sabo, R.C.; Mozuch, M.D.; Kersten, P.; Zhu, J.Y.; Jin, Y. Physical and mechanical properties of cellulose nanofibril films from bleached eucalyptus pulp by endoglucanase treatment and microfluidization. J. Polym. Environ. 2015, 23, 551–558. [Google Scholar] [CrossRef]
  34. Nutan, M.T.H. Starch Acetate as a Film Forming Excipient in Controlled Drug Delivery. Ph.D. Thesis, Texas Tech University, Lubbock, TX, USA, 2004. [Google Scholar]
  35. Adebajo, M.O.; Frost, R.L.; Kloprogge, J.T.; Kokot, S. Raman spectroscopic investigation of acetylation of raw cotton. Spectrochim. Acta A Mol. Biomol. Spectrosc. 2006, 64, 448–453. [Google Scholar] [CrossRef] [PubMed] [Green Version]
  36. Crofton, D.J.; Moncrieff, D.; Pethrick, R.A. Dielectric studies of cellulose and its derivatives: 1. Acetylation of cellulose. Polymer 1982, 23, 1605–1608. [Google Scholar] [CrossRef]
  37. Colom, X.; Carrillo, F. Crystallinity changes in lyocell and viscose-type fibres by caustic treatment. Eur. Polym. J. 2002, 38, 2225–2230. [Google Scholar] [CrossRef]
  38. Stipanovic, A.J.; Sarko, A. Packing Analysis of Carbohydrates and Polysaccharides. 6. Molecular and Crystal Structure of Regenerated Cellulose II. Macromolecules 1976, 9, 851–857. [Google Scholar] [CrossRef]
  39. Abraham, E.; Kam, D.; Nevo, Y.; Slattegard, R.; Rivkin, A.; Lapidot, S.; Shoseyov, O. Highly Modified Cellulose Nanocrystals and Formation of Epoxy-Nanocrystalline Cellulose (CNC) Nanocomposites. ACS Appl. Mater. Interfaces 2016, 8, 28086–28095. [Google Scholar] [CrossRef] [PubMed]
  40. Liitiä, T.; Maunu, S.L.; Hortling, B.; Tamminen, T.; Pekkala, O.; Varhimo, A. Cellulose crystallinity and ordering of hemicelluloses in pine and birch pulps as revealed by solid-state NMR spectroscopic methods. Cellulose 2003, 10, 307–316. [Google Scholar] [CrossRef]
  41. Isogai, A.; Usuda, M.; Kato, T.; Uryu, T.; Atalla, R.H. Solid-state CP/MAS carbon-13 NMR study of cellulose polymorphs. Macromolecules 1989, 22, 3168–3172. [Google Scholar] [CrossRef]
  42. Yamamoto, H.; Horii, F.; Hirai, A. Structural studies of bacterial cellulose through the solid-phase nitration and acetylation by CP/MAS 13C NMR spectroscopy. Cellulose 2006, 13, 327. [Google Scholar] [CrossRef]
  43. Takahashi, M.; Takenaka, H. Transition from Cellulose I Family to Cellulose II Family. Polym. J. 1987, 19, 855–861. [Google Scholar] [CrossRef]
  44. Wada, M.; Ike, M.; Tokuyasu, K. Enzymatic hydrolysis of cellulose I is greatly accelerated via its conversion to the cellulose II hydrate form. Polym. Degrad. Stab. 2010, 95, 543–548. [Google Scholar] [CrossRef]
  45. Dinand, E.; Vignon, M.; Chanzy, H.; Heux, L. Mercerization of primary wall cellulose and its implication for the conversion of cellulose I→cellulose II. Cellulose 2002, 9, 7–18. [Google Scholar] [CrossRef]
  46. Zafeiropoulos, N.E.; Vickers, P.E.; Baillie, C.A.; Watts, J.F. An experimental investigation of modified and unmodified flax fibres with XPS, ToF-SIMS and ATR-FTIR. J. Mater. Sci. 2003, 38, 3903–3914. [Google Scholar] [CrossRef]
  47. Dorris, G.; Gray, D. Surface analysis of paper and wood fibres by ESCA. II. Surface composition of mechanical pulps. Cellul. Chem. Technol. 1978, 12, 721–734. [Google Scholar]
  48. Kargarzadeh, H.; Ahmad, I.; Abdullah, I.; Dufresne, A.; Zainudin, S.Y.; Sheltami, R.M. Effects of hydrolysis conditions on the morphology, crystallinity, and thermal stability of cellulose nanocrystals extracted from kenaf bast fibers. Cellulose 2012, 19, 855–866. [Google Scholar] [CrossRef]
  49. Roman, M.; Winter, W.T. Effect of Sulfate Groups from Sulfuric Acid Hydrolysis on the Thermal Degradation Behavior of Bacterial Cellulose. Biomacromolecules 2004, 5, 1671–1677. [Google Scholar] [CrossRef] [PubMed]
Figure 1. Schematic experimental flow diagram for producing highly hydrophobic cellulose nanoparticles (CNPs).
Fibers 06 00022 g001
Figure 2. Scanning electron microscope (SEM) or field-emission scanning electron microscope (FE-SEM) images of initial bleached eucalyptus kraft pulp (BEP) and esterified BEP fibers. (a) and (b) BEP; (c) S10T80t1; (d) N10T80t1; (e) S07T85t1; (f) N10T60t2; (g) S05T80t2; (h) N06T85t1.
Fibers 06 00022 g002
Figure 3. Atomic force microscopy (AFM) images of post-esterification microfluidized (PeM) cellulose nanoparticles (CNPs). (a) CNP-S07T85t1; (b) CNP-S05T80t2; (c) CNP-S01T80t2; (d) CNP-N10T80t1; (e) CNP-N10T60t2; (f) CNP-N06T85t1.
Fibers 06 00022 g003
Figure 4. Comparisons of chemical structural properties of BEP with esterified CNP using Fourier transform infrared (FTIR) (a), NMR (b), and XRD (c).
Fibers 06 00022 g004
Figure 5. XPS spectra (a); deconvolution of the C 1s peak: BEP (b); CNM-S07T85t1 (c); and CNM-N10T60t2 (d).
Fibers 06 00022 g005
Figure 6. Photos of water drop on the surface of dried esterified cellulose samples: (a) Film of N10T80t1; (b) N10T60t2. (c) A photo shows redispersion of PeM-CNP-S05T80t2 in water, ethanol, acetone, and chloroform.
Fibers 06 00022 g006
Table 1. Experimental conditions and results of cellulose esterification. DS: degree of substitution.
Sample IDReaction ConditionsDS of Fiber
Ac2O/HAc (mL/mL)T (°C);
Time (h)
H2SO4 (mL)
S10T80t150/5080; 11.02.2
S07T85t150/5085; 10.71.8
S05T80t250/5080; 20.51.6
S01T80t250/5080; 20.11.2
S0T60t250/5060; 200.1
N10T80t1100/080; 11.01.5
N10T60t2100/060; 21.01.3
N06T85t1100/085; 10.61.1
Table 2. Size and size distribution of PeM-CNPs by dynamic light scattering (DLS) measurements.
Sample IDFresh SamplesRedispersed in EthanolRedispersed in Water
D (nm)PDI 1D (nm)PDI 1D (nm)PDI 1
S10T80t12660.152800.1911930.36
S07T85t12840.103260.208660.33
S05T80t27760.326980.2013970.35
S01T80t27600.307580.2610480.30
N10T80t13520.193540.206660.29
N10T60t24320.234340.2418990.40
N06T85t12980.203410.176540.25
1 PDI, particle size distribution polydispersity index.
Table 3. Elemental analysis of BEP and PeM-CNP samples.
SamplesC (wt %)O (wt %)O/CDSCNP
BEP43.6150.161.15-
S07T85t148.3646.190.9551.72
N10T60t247.8046.610.9751.38
Table 4. Element percent and deconvolution of the peak C1s from the X-ray photoelectron spectra (XPS) analysis for BEP and PeM-CNP samples and degree of surface substitution (DSS).
SamplesAtomic Concentration (mol)Deconvolution of the Peak C1sDSSCA (°) of PeM-CNP
% C% OO/C% C1% C2% C3% C4
BEP57.737.90.6623.059.416.70.95--122
S10T80t163.536.50.5724.250.115.010.62.3113
S07T85t160.437.10.6226.247.616.010.12.190
S05T80t262.637.40.6027.944.618.68.91.870
S01T80t261.738.30.6226.145.820.67.51.40
N10T80t163.936.10.5726.949.215.18.81.7105
N10T60t263.135.40.5627.251.012.98.91.8120
N06T85t162.937.10.5930.746.015.38.01.590
Table 5. Comparisons of Tonset, Tmax, and T95 of BEP with PeM-CNP samples.
TonsetWeight Loss at Tonset (%)TmaxT95
BEP3117.7390.8328.7
S07T85t13164.5304.3; 380.6320.3
S05T80t23169.5304.8; 382.7258.9
N06T85t12524.8378.4253.7

