Abstract
This paper aims to develop a hierarchical risk assessment model using the newly-developed evidential reasoning (ER) rule, which constitutes a generic conjunctive probabilistic reasoning process. In this paper, we first provide a brief introduction to the basics of the ER rule and emphasize the strengths for representing and aggregating uncertain information from multiple experts and sources. Further, we discuss the key steps of developing the hierarchical risk assessment framework systematically, including (1) formulation of risk assessment hierarchy; (2) representation of both qualitative and quantitative information; (3) elicitation of attribute weights and information reliabilities; (4) aggregation of assessment information using the ER rule and (5) quantification and ranking of risks using utility-based transformation. The proposed hierarchical risk assessment framework can potentially be implemented to various complex and uncertain systems. A case study on the fire/explosion risk assessment of marine vessels demonstrates the applicability of the proposed risk assessment model.
1. Introduction
Risk assessment plays a vital role in the whole risk management cycle from identifying, assessing, analyzing, reporting and manipulating to monitoring risks. It helps decision makers to prioritize and manage risks in order to avoid potential threats and better utilize limited sources. Traditionally, risk is defined as a combination of likelihood and consequence. However, as many real-world systems are becoming increasingly complicated, along with the appearance of unexpected events and dramatic changes, the two high-level measurements of likelihood and consequence are unable to completely capture the entire characteristics of a risk [1]. In the past decades, a range of risk assessment methods, including preliminary hazard analysis, fault tree analysis, event tree analysis, and relevant quantitative techniques have been proposed to support risk management [2,3].
Compared with qualitative risk assessment techniques, which mainly focus on risk identification and evaluation, quantitative risk assessment techniques put more emphasis on the quantification as well as ranking of risks to support better decision making. Under the umbrella of quantitative risk assessment methods, risk matrix has been widely accepted as a convenient and effective tool for risk assessment [4,5,6]. Both qualitative and quantitative assessment can be incorporated into a risk matrix, where qualitative information, such as from questionnaires and interviews, can be used to identify potential improvements, while quantitative information, such as historical data, can help to evaluate countable costs or benefits. In line with the definition of risks, the probability of occurrence and the severity of impact can be expressed as two input variables in the risk matrix. Their combination formulates an index to classify and discriminate different risks, and it can also be logically interpreted as “IF probability is p and severity is s, THEN risk is r” [5]. Usually, both input and output variables are described by qualitative scales in the risk matrix. For example, the probability of occurrence can be split into five levels, such as remote, unlikely, likely, high likely and almost certain, while the severity of impact can be categorized as negligible, minor, moderate, serious and critical.
As discussed above, risk matrix measures each risk mainly from two dimensions. However, many real-world systems are more complicated, and we may need to take into consideration more risk attributes and components in the risk evaluation process. It is difficult for the risk matrix to provide a holistic view from multiple aspects. Thus, multiple criteria decision analysis (MCDA) techniques can be employed to fill up the gap. MCDA provides a systematic process to formulate the hierarchical assessment model, aggregate assessment information and support better decision making [7]. It can also be useful to select potential risks, categories risks with similar characteristics and prioritize risks in terms of historical data and decision maker (DM)’s domain knowledge [8]. The evidential reasoning (ER) methodology among a series of MCDA techniques has attracted a lot of attention due to the capability of modelling qualitative and quantitative information in a unified way, aggregating probabilistic information rigorously and producing final distributed assessment results [9,10]. Furthermore, the ER methodology was initially proposed in the context of MCDA, and it consists of three key components or features, specifically, belief structure for modelling various types of uncertainty [9], rule and utility based information transformation techniques [11], and the ER algorithm for information aggregation [12]. The ER methodology has been widely applied to a wide range of decision and risk analysis problems [13,14]. The ER rule further improves the ER methodology, and it constitutes a generic conjunctive probabilistic reasoning process and combine multiple pieces of independent evidence conjunctively with taking into account both weights and reliabilities [15,16].
Through taking advantage of the key strengths of the ER rule in uncertainty modelling and aggregation, this paper aims to develop a hierarchical risk assessment framework with incorporating both qualitative and quantitative assessment information. The rest of the paper is organized as follows: in Section 2, the basics and key features of the ER rule are briefly introduced. In Section 3, the hierarchical risk assessment framework is presented with the key steps, (1) formulation of risk assessment hierarchy; (2) representation of both qualitative and quantitative information; (3) elicitation of attribute weights and information reliabilities; (4) aggregation of assessment information using the ER rule and (5) quantification and ranking of risks using utility-based transformation. A case study on the fire/explosion risk assessment of marine vessels is conducted to illustrate the applicability of the proposed hierarchical risk assessment model in Section 4. Some concluding remarks are presented in Section 5.
2. Basics and Strengths of the ER Rule in Representing and Aggregating Uncertain Information
In the ER rule, a piece of evidence or information in the context of risk and decision analysis, , is profiled by the following belief distribution.
From the perspective of modelling uncertainty, the belief degree assigned exactly to the frame of discernment Θ reflects global ignorance, to a smaller subset of Θ except for any singleton proposition measures local ignorance, and to any singleton can be regarded as probability [15]. Each piece of evidence can also be associated with a weight and a reliability respectively. In the ER rule, the weight is used to reflect the relative importance of evidence , while the reliability is regarded as the inherent property of the evidence [15,17].
Once all the three components, namely, belief distribution, weight and reliability are given, each piece of evidence can be further transformed to a weighted belief distribution with reliability [15].
The new hybrid weight is defined as . The residual support , when the piece of evidence is fully reliable, i.e., .
Further, the ER rule can be used to combine multiple pieces of evidence in a recursive way. For illustration purpose, two pieces of independent evidence and can be combined as follows
where denotes the combined belief degrees to which the proposition is jointly supported. The first square bracket term in Equation (5) is regarded as the bounded sum of individual support on proposition . Specifically, the unreliability of evidence , i.e., sets a bounded role which can play. While the second term is the orthogonal sum of collective support on proposition .
The ER rule generalizes the Bayesian inference, the seminal Dempster-Shafer (D-S) theory of evidence [18,19] and the ER algorithm [9,10]. Each piece of evidence in the Bayesian inference is formulated by a probability distribution, which can be regarded as a belief distribution without local or global ignorance [15,17]. The ER rule can rigorously combine two pieces of highly or completely conflicting evidence, where Dempster’s rule combination was found to generate counter-intuitive results [20,21]. The original ER algorithm considers a special case where the reliability of evidence is equal to its normalized weight [15]. As discussed above, the ER rule can deal with both qualitative and quantitative attributes, which provides DMs with the flexibility of providing their preferences using either numeric values or linguistic variables. In addition, a variety of other uncertainties, such as fuzziness, interval beliefs, can also be formulated under the unified structure of belief distributions. Compared with rough set and fuzzy set, which can also be used to handle epistemic uncertainty, the ER rule provides a systematic and rigorous way for probabilistic information representation and aggregation. In the context of risk analysis, these features are extremely useful in representing and aggregating uncertain risk assessment information in different formats and from multiple experts and sources.
3. A Hierarchal Risk Assessment Model Using the ER Rule
It is worth noting that we mainly focus on the step of risk assessment, instead of the whole process of risk management in this section.
3.1. Formulation of Risk Assessment Hierarchy
In risk assessment, different stakeholders, including experts and decision makers are usually involved, and they play respective roles in identifying risk attributes or factors and providing assessment information in terms of their domain knowledge and risk perception.
In this paper, the scheme of MCDA is employed to build up the risk assessment hierarchy. As illustrated in Figure 1, an identified risk can be assessed by two or more dimensional parameters, such as occurrence likelihood and consequence severity used in a risk matrix. Under each of the top-level parameters, relevant risk attributes or factors should be identified to support reliable risk assessment. The lower-level risk attributes or factors can further be split to a number of sub-attributes.
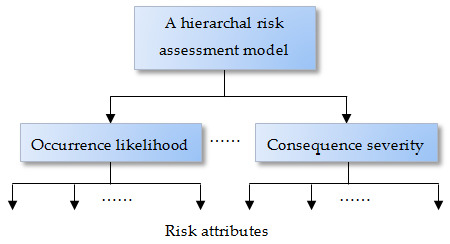
Figure 1.
Illustration of a hierarchal risk assessment model.
From the perspective of collecting assessment information, the bottom level risk attributes or factors can be classified as quantitative evaluation and subjective judgment. It is rather straightforward to collect quantitative data, while subjective judgment may involve stakeholders and experts’ perception as well as various risk guidelines.
3.2. Representation of Both Qualitative and Quantitative Assessment Information
As discussed previously, the top-level risk parameters can be assessed by linguistic variables. Correspondingly, a set of linguistic variables can also be defined for both lower-level qualitative and quantitative risk attributes. The set of linguistic grades can be regarded as a frame of discernment, for example, {: remote, : unlikely,: likely, : high likely, : almost certain}. Under the frame of discernment, accurate and exclusive definition of each linguistic term should be provided in order to facilitate rigorous risk assessment. In addition, it worth mentioning that the so-called local ignorance of assigning belief degrees to smaller subsets of Θ except for any singleton proposition is usually disregarded in the context of risk analysis in order to reduce the difficulty of eliciting assessment information.
With regard to a qualitative risk attribute, subjective assessment information of assigning belief degrees to each assessment grade can be collected from decision makers and experts directly. However, the bias and variations from qualitative assessment is likely to result in a lack of objectivity and consistency for risk management.
For a quantitative risk attribute , a set of referential values should be defined to cover its value interval. Then the following information transformation technique can be used to generate the corresponding belief distribution [11].
Here, represents the belief degree to which the risk attribute is assessed as the referential value .
3.3. Elicitation of Attribute Weights and Information Reliabilities
The weight can be assigned as a measurement of the degree of importance, where and to ensure the completeness of the total risk attributes under a parameter or a risk category.
Apart from direct assignment techniques in weight elicitation, the analytic hierarchy process (AHP) method can be used to generate weights for attributes [22]. DMs provide multiple pairwise comparisons of one attribute against another by assigning subjective degree of importance, ranging from 1 to 9, and we can exhaust pairwise comparisons completely. DMs also have the flexibility to use verbal intuitive expressions, such as ‘strongly’ or ‘moderately’, to elicit relative importance of attributes [23]. Specifically, in a pairwise comparison matrix , an entry represents how much more important attribute is over attribute (). In principle, and thus the diagonal entries are equal to 1. Thus the pairwise comparison matrix can be represented as
The normalized weights can then be estimated by the eigenvector of . A consistency index can be calculated to check whether the weights generated are sufficiently consistent, and it is allowed to have a small degree of inconsistency resulting from biased judgement. However, re-examination of the pairwise comparisons should be conducted, when the consistency index approximated from maximum eigenvalue and eigenvector is smaller than a threshold value [24]. To overcome the order dependency of the consistency index, a normalized consistency ratio can be calculated to measure the degree between total consistency and total randomness [25]. Given a sufficiently acceptable level of the consistency ratio, the AHP weights are regarded as more reliable than directly assigned weights.
Furthermore, a group of DMs or experts are usually involved in the risk assessment process, and it is difficult for them to reach consensus on both assessing risk attributes and assigning their weights. For a cooperative risk assessment situation, where DMs or experts share accountability, the weight assignment process can be elicited from negotiation, brainstorming, voting schemes, etc. Alternatively, a supra DM in the collective decision environment can potentially lead the whole process [26,27].
In the ER rule, weight and reliability need to be considered simultaneously in order to obtain the hybrid weight as discussed above. However, there are lack of theoretical research and practical solutions with regard to eliciting information reliabilities, and it has often been linked with evidence discounting [15,28,29,30,31]. In the context of risk analysis, the reliabilities of information sources can be obtained in terms of contextual information, experts’ domain knowledge, and historical data.
When both weights and reliability are available, the implementation of the formula produces the hybrid weight , for which if , if , and if . Specifically, when a piece of evidence is fully reliable, i.e., , there will be . The hybrid weight will be discounted to , when the piece of evidence is fully unreliable, i.e., .
3.4. Aggregation of Assessment Information Using the ER Rule
With the collection of the three types of risk assessment information, specifically, belief distributions on bottom-level risk attributes, reliabilities of assessment information on bottom-level risk attributes, and weights for all risk parameters and attributes, the ER rule is then applied to aggregate assessment information from bottom to up. The risk level on a middle-level risk attribute or parameter is usually aggregated from the assessment information collected from the bottom-level risk attributes recursively. As illustrated in Figure 2, the risk parameter/attribute is profiled by a belief distribution which is combined from the belief distributions of the lower-level attributes using the ER rule. Furthermore, the overall risk level can be aggregated and profiled in the form of a belief distribution.
where denotes the belief degree to which the overall risk level is assessed as the linguistic grade , though taking into account all relevant risk assessment information. The remaining belief degree, when there are incomplete assessment information from the bottom-level risk attributes. The belief distribution provides a more informative risk profile.
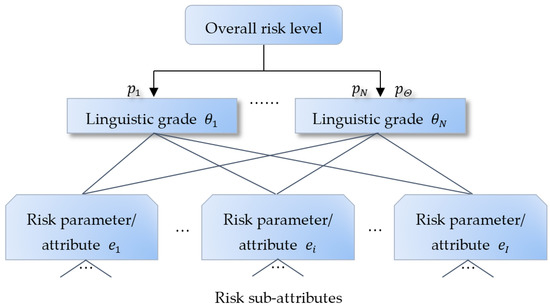
Figure 2.
Aggregation of risk assessment information.
It is assumed that the same number of linguistic grades is used to assess all the risk parameters and attributes. Otherwise, rule and utility based information transformation approaches should be implemented to match a common set of linguistic variables [11].
3.5. Quantification and Ranking of Risks Using Utility-Based Transformation
The overall belief distribution can be quantified as a risk score using utility-based transformation. Assume that the utility of the linguistic grade is . The risk score can be given as
As discussed above, incomplete assessment information from the bottom-level risk attributes will lead to . Correspondingly, the overall risk level can be characterized by a set of minimum, maximum and average risk scores.
The interval can capture the range of potential risk levels. If there doesn’t exist incomplete assessment information, we can easily rank a series of risks in terms of their risk scores. Otherwise, the above risk intervals should be considered for ranking.
4. A Case Study on the Fire/Explosion Risk Assessment of Marine Vessels
Fire/explosion is one of the major accidents or risks having the potential to cause disastrous consequences for marine vessels [32,33]. According to the UK marine accident investigation branch (MAIB) statistics [34], around 11% of the total 1639 accidents of UK merchant vessels (≥100 gross tonnage) from 2001 to 2012 were resulted from fire/explosion as shown in Figure 3.
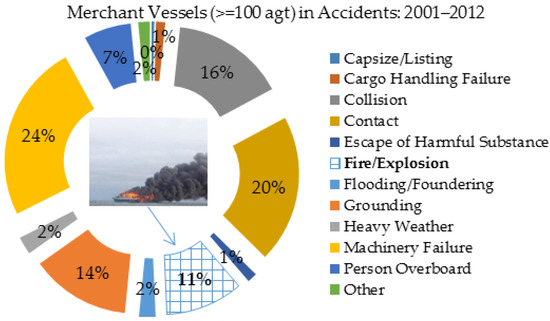
Figure 3.
Marine accident investigation branch (MAIB) statistics on fire/explosion risks of UK merchant vessels.
Thus, a set of regulations, codes and guidelines have been issued to support the safety management over fire/explosion and relevant risks [32]. The focus of the section is to demonstrate how to apply the proposed hierarchical risk assessment model, rather than to formulate a complete assessment criteria hierarchy. From this perspective, this section only picks up a small part of the assessment criteria hierarchy, specifically, the assessment of measures to prevent the occurrence of fire/explosion in the engine room of marine vessels as shown in Figure 4. Next, we consider the above discussed three types of risk assessment information, which are weights, reliabilities, belief distributions on the lower-level risk attributes categorized as managerial measures, operative measures and technical measures respectively.
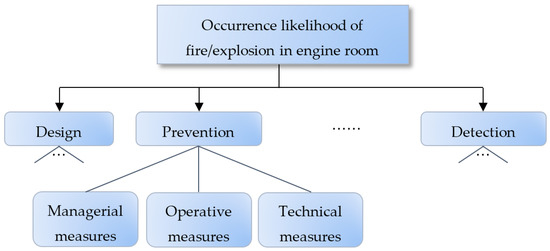
Figure 4.
Assessment of the occurrence likelihood of fire/explosion in engine room.
The relative importance of these prevention measures can be captured by pairwise comparisons. As shown in Table 1, the upper diagonal entries denote how many times the row attribute is more important than the column attribute, the diagonal entries are equal to 1 for self-comparisons, and the lower diagonal entries are the reciprocals of the corresponding upper diagonal entries. Furthermore, the AHP method is applied to obtain the last column of the calculated weights, where the consistency ratio is sufficiently acceptable.

Table 1.
An example of pairwise comparison matrix.
It can be assumed that reliabilities are equal to weights, if both pieces of information are collected from the same group of experts. In practice, it is always very demanding to assign weights and reliabilities separately based on subjective judgement. However, there are potentially historical data available to calibrate reliabilities in some applications.
All the three attributes related to prevention measures can be regarded as qualitative, and a set of questions can be designed to collect judgement from experts. For example, the questions “Is there any fire/explosion prevention plan?”, “Are there any rules in place for processing flammable and/or explosive materials?” and “Whether the fire prevention and protection system is installed and tested appropriately?” can be asked for the assessment of managerial measures; “Is there any assessment for planned operations for fire/explosion risks?” and “Is there any regular assessment on the functionality of fire/explosion prevention systems?” for operative measures; “What is the capability of fire/gas detection system?” and “What is the capability of static electricity protection system” for technical measures. Assume that the following belief distributions are obtained under the unified frame of discernment {: remote, : unlikely,: likely, : high likely, : almost certain}.
Here it is worth noting that there is incomplete assessment information for technical measures, and the remaining belief degree . With the assumption that reliability is equal to weight for each of the above three attributes, the belief distributions can be transformed to weighted belief distributions with reliability respectively using the Equation (3). Then, the ER rule formulated mathematically in the Equations (4) and (5) can be applied to combine three pieces of belief distributions recursively, which produces the overall assessment of prevention measures in the format of a belief distribution as shown in Figure 5.
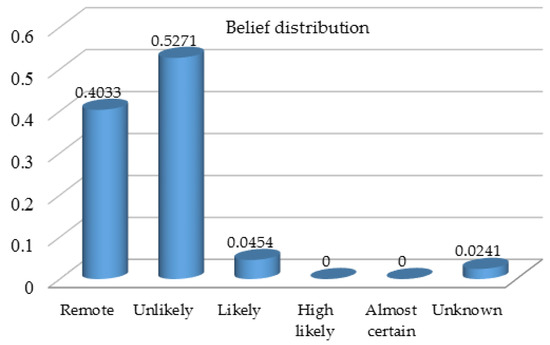
Figure 5.
Belief distribution on the overall assessment of prevention measures.
The belief distribution provides more informative fire/explosion risk assessment profile with regard to the attribute of prevention measures, and it also covers unknown part due to incomplete knowledge or limited information. In this context of risk analysis with a hierarchical assessment model, sensitivity analysis can be further conducted between the quantified risk score or the belief degree on a specific linguistic assessment grade and different types of inputs from lower-level risk attributes, such as belief distributions and weights. For example, sensitivity analysis can be done to identify lower-level risk attributes causing high belief degrees on certain linguistic assessment grades to be avoided. In addition, the quantified risk core discussed in Section 3.5 can be used to rank and prioritize the fire/explosion risk among a set of potential risks. For example, if the utilities corresponding to the frame of discernment {: remote, : unlikely,: likely, : high likely, : almost certain} are , the occurrence likelihood related to fire/explosion prevention measures can be characterized by the utility interval . Given both occurrence likelihood and consequence severity are cost-type attributes, and they should be controlled as low as possible. That is to say, risks associated with high utilities should be prioritized for mitigation and controlling.
5. Concluding Remarks
In this paper, we proposed a hierarchical risk assessment model using the evidential reasoning (ER) rule. The key steps from the formulation of risk assessment hierarchy to the quantification and ranking of risks have been discussed in a systematic way. The applicability of the proposed risk assessment model was demonstrated by a case study on the fire/explosion risk assessment of marine vessels. In addition, the paper further takes into account the reliabilities of information sources and expert’s judgement for risk assessment, in comparison to the previous application of the ER approach to risk analysis. This hierarchical risk assessment model can be applicable to the risk analysis of various complex and uncertain systems, e.g., manufacturing systems, healthcare systems and offshore infrastructure. In order to reduce the complexity of collecting information, local ignorance isn’t considered in the belief distributions on the bottom-level attributes. However, it can be useful to assign belief degrees to smaller subsets of the frame of discernment for capturing local uncertainty of risk assessment information in our future research. In addition, the mutual independence of risk attributes also needs to be investigated in specific applications.
Acknowledgments
This work is partially supported by the Natural Science Foundation of China under Grant No. 71671186, 71331008.
Author Contributions
X.J. and J.J. conceived and designed the research topic; J.S. performed the numerical analysis; Y.W.C. provided support on the methodological design and the case study; and all the authors were involved in writing and revising the paper.
Conflicts of Interest
The authors declare no conflict of interest. The founding sponsors had no role in the design of the study; in the collection, analyses, or interpretation of data; in the writing of the manuscript, and in the decision to publish the results.
References
- Curtis, P.; Carey, M. Risk Assessment in Practice; Committee of Sponsoring Organizations of the Treadway Commission: USA. Available online: https://www2.deloitte.com/content/dam/Deloitte/global/Documents/Governance-Risk-Compliance/dttl-grc-riskassessmentinpractice.pdf (accessed on 5 February 2017).
- Cox, L.A., Jr. Risk Analysis of Complex and Uncertain Systems; Springer: Berlin/Heidelberg, Germany, 2009; Volume 129. [Google Scholar]
- Rausand, M. Risk Assessment: Theory, Methods, and Applications; John Wiley & Sons: New York, NY, USA, 2013; p. 115. [Google Scholar]
- Paul, R.; Garvey, P.; Lansdowne, Z. Risk matrix: An approach for identifying, assessing, and ranking program risks. Air Force J. Logist. 1998, 22, 16–23. [Google Scholar]
- Markowski, A.; Mannan, M. Fuzzy risk matrix. J. Hazard. Mater. 2008, 159, 152–157. [Google Scholar] [CrossRef] [PubMed]
- Ni, H.; Chen, A.; Chen, N. Some extensions on risk matrix approach. Saf. Sci. 2010, 48, 1269–1278. [Google Scholar] [CrossRef]
- Roy, B. Multicriteria Methodology for Decision Aiding; Kluwer Academic Publishers: Dordrecht, The Netherlands, 1996. [Google Scholar]
- Mayag, B.; Cailloux, O.; Mousseau, V. MCDA tools and risk analysis: The decision deck project. In Proceedings of the Advances in Safety, Reliability and Risk Management Conference (ESREL), Troyes, France, 18–22 September 2011; p. 377.
- Yang, J.B.; Singh, M.G. An evidential reasoning approach for multiple attribute decision making with uncertainty. IEEE Trans. Syst. Man Cybern. 1994, 24, 1–18. [Google Scholar] [CrossRef]
- Xu, D.L. An introduction and survey of the evidential reasoning approach for multiple criteria decision analysis. Ann. Oper. Res. 2012, 195, 163–187. [Google Scholar] [CrossRef]
- Yang, J.B. Rule and utility based evidential reasoning approach for multiple attribute decision analysis under uncertainty. Eur. J. Oper. Res. 2001, 131, 31–61. [Google Scholar] [CrossRef]
- Yang, J.B.; Xu, D.L. On the evidential reasoning algorithm for multiattribute decision analysis under uncertainty. IEEE Trans. Syst. Man Cybern. Part A Syst. Hum. 2002, 32, 289–304. [Google Scholar] [CrossRef]
- Wang, J.Q.; Nie, R.R.; Zhang, H.Y.; Chen, X.H. Intuitionistic fuzzy multi-criteria decision-making method based on evidential reasoning. Appl. Soft Comput. 2013, 13, 1823–1831. [Google Scholar] [CrossRef]
- Dymova, L.; Sevastjanov, P. A new approach to the rule-base evidential reasoning in the intuitionistic fuzzy setting. Knowl. Based Syst. 2014, 61, 109–117. [Google Scholar] [CrossRef]
- Yang, J.B.; Xu, D.L. Evidential reasoning rule for evidence combination. Artif. Intell. 2013, 205, 1–29. [Google Scholar] [CrossRef]
- Yang, J.B.; Xu, D.L. A study on generalising Bayesian inference to evidential reasoning. In Belief Functions: Theory and Applications—Lecture Notes in Computer Science; Springer: Berlin/Heidelberg, Germany, 2014; Volume 8764, pp. 180–189. [Google Scholar]
- Chen, Y.; Chen, Y.W.; Xu, X.B.; Pan, C.C.; Yang, J.B.; Yang, G.K. A data-driven approximate causal inference model using the evidential reasoning rule. Knowl. Based Syst. 2015, 88, 264–272. [Google Scholar] [CrossRef]
- Dempster, A.P. A generalization of Bayesian inference. J. R. Stat. Soc. Ser. B 1968, 30, 205–247. [Google Scholar]
- Shafer, G. Mathematical Theory of Evidence; Princeton University Press: Princeton, NJ, USA, 1976. [Google Scholar]
- Yager, R.R. On the dempster-shafer framework and new combination rules. Inf. Sci. 1987, 41, 93–137. [Google Scholar] [CrossRef]
- Zadeh, L.A. Review of Shafer’s a mathematical theory of evidence. AI Mag. 1984, 5, 81–83. [Google Scholar]
- Saaty, L.T. How to make a decision: The Analytic Hierarchy Process. Eur. J. Oper. Res. 1990, 48, 9–26. [Google Scholar] [CrossRef]
- Belton, V.; Stewart, T.J. Multiple Criteria Decision Analysis: An Integrated Approach, 1st ed.; Kluwer Academic Publishers: Norwell, MA, USA, 2002. [Google Scholar]
- Triantaphyllou, E. Multi-Criteria Decision Making Methods: A Comparative Study; Springer: Berlin/Heidelberg, Germany, 2013; Volume 44. [Google Scholar]
- Aguarόn, J.; Moreno-Jiménez, J.M. The geometric consistency index: Approximated thresholds. Eur. J. Oper. Res. 2003, 147, 137–145. [Google Scholar] [CrossRef]
- Bell, D.E.; Raiffa, H.; Tversky, A. Descriptive, Normative, and Prescriptive Interactions in Decision Making. Decision Making: Descriptive, Normative, and Prescriptive Interactions; Cambridge University Press: Cambridge, UK, 1988; Volume 1, pp. 9–32. [Google Scholar]
- Keeney, R.L.; Gregory, R.S. Selecting attributes to measure the achievement of objectives. Oper. Res. 2005, 53, 1–11. [Google Scholar] [CrossRef]
- Elouedi, Z.; Mellouli, K.; Smets, P. Assessing sensor reliability for multisensor data fusion within the transferable belief model. IEEE Trans. Syst. Man Cybern. Part B Cybern. 2004, 34, 782–787. [Google Scholar] [CrossRef]
- Rogova, G.L.; Nimier, V. Reliability in information fusion: Literature survey. In Proceedings of the 7th International Conference on Information Fusion, Stockholm, Sweden, 28 June–1 July 2004; Volume 2, pp. 1158–1165.
- Xu, X.; Li, S.; Song, X.; Wen, C.; Xu, D. The optimal design of industrial alarm systems based on evidence theory. Control Eng. Pract. 2016, 46, 142–156. [Google Scholar] [CrossRef]
- Fu, C.; Huhns, M.; Yang, S. A consensus framework for multiple attribute group decision analysis in an evidential reasoning context. Inf. Fusion 2014, 17, 22–35. [Google Scholar] [CrossRef]
- Chen, Y.W.; Xu, D.L.; Yang, J.B.; Tang, D. Fire and Explosion Safety Assessment in Container Line Supply Chain. In Decision Aid Models for Disaster Management and Emergencies; Atlantis Press: Paris, France, 2013; pp. 295–306. [Google Scholar]
- Wang, J. Offshore safety case approach and formal safety assessment of ships. J. Saf. Res. 2002, 33, 81–115. [Google Scholar] [CrossRef]
- Marine Accident Investigation Branch (MAIB). Annual Report 2012; Marine Accident Investigation Branch: Southampton, UK, 2012.
© 2017 by the authors. Licensee MDPI, Basel, Switzerland. This article is an open access article distributed under the terms and conditions of the Creative Commons Attribution (CC BY) license ( http://creativecommons.org/licenses/by/4.0/).