3. General Regularities of Systems
As it was mentioned above, systems represent regularities in the flows of resources. Therefore, they have to be built in these flows and for this reason, each system should have at least two resource flows. The resources, except for the simplest ones (like light and many chemical elements), are obtained from other living systems. Therefore, in order to get a resource, a system has to give other resources in return. Otherwise the opposite interacting resource sources will have no reason to give its own resources [
15]. It is related, of course, to a consistent sequence of interaction between groups of resource sources.
The main reason for the exchange of resources is that they are scattered in time and space. That is why systems can be located close to, or effectively interact with a limited number of types of resources. They will have such types of resources in excess supply, at the same time experiencing shortage of other resources. That is why exchange is crucial. Systems located closer to any resource can give it to a system located further from it in such amount that will cover the transmission losses. In return, they get resources from the systems located closer to other sources in the amount that covers possible losses. If a system has a priority access to several resources, it can combine them to create a more complex resource. The further a system is located in the chain of sources from some simple resource it uses, the more complex such system will be, because it will have more intermediaries and more levels of hierarchy. Therefore, the resources which supply the required simple resource to the system will be more complex too.
The more complex a system is, the more exchanges it has and the more complex resources it consumes. Therefore, such systems are intermediaries between the resources flows; they reallocate resources in space and act as carriers of resource flaws, creating new regularities. For example, plants have better access to the microelements in the soil due to their roots and more effective accumulation of light due to their shape. While animals have better access to remote distances due to their shape. As a result of exchange, a system of some animals gets nutrients and the system of certain plants gets access to the new territories where they can grow. However, plants provide food for more animals than they need to relocate their seeds and animals relocate more seeds to longer distances than needed. Therefore, systems having better access to resources than their counterparts do provide it in excess supply to cover the losses. It is important to note that all resources lost in transmission are also some flows of resources used by other systems.
In case of more complex social systems, it may be schematically demonstrated as one firm having access to the fossils/minerals and the workers who can process them, while the other having arable land and bakers. As a result, they can exchange bread for metal fabrics. All losses of crop and person-hours are covered by their relevant suppliers, while the counterpart has to cover its own costs. In social systems, the model is even more complicated due to the monetary system – an additional system that facilitates the exchange [
16]. However, the money received for goods is always used to pay for resources required for functioning, including the time of managers, founders and owners. Sometimes it happens after their services have already been provided. Therefore, some resources are exchanged for other resources and money is used to facilitate the process.
Let us consider in detail the process of exchange between the systems [
17,
18]. In reality, the exchange is never instantaneous. One of the resources is always provided some time after it has been invested in [
19]. One of the two exchanged resources will always be insufficient to compensate the existing flows of the opposite resource. It means that the resource will be returned later. Therefore, some of the sources of such resources will be working for future return of resources to the opposite sources. In fact, such sources of resources will become a subsystem of the opposite sources. The excess resource will be invested in the future flows of the opposite resource [
20,
21]. That is how hierarchy in the flows of each resource is established.
For example, if we consider payment, employees represent the adapted subsystems of a company [
22]. However, when it concerns labor employees turn the company’s means of production into their subsystems making the latter adapt to them. In reality, the resource flows in the systems are not that linear. Moreover, flows of the same resource may cross.
At the same time, it is important to differentiate between current and constant excess of recourse. A scarce resource can be supplied not so often but in large lot, creating temporary excesses. The same is with the current shortage—a generally abundant resource can be supplied not so often but intensively, creating sometimes an urgent demand. Therefore, distribution of flows of resources in time becomes crucial.
It is convenient to measure the distribution of the resources flows through a system in relation to each another. Then
Hn, as the value of resources with a single interaction with a single source of resource
n, will be measured in relation to the value of the resources
Hk from the sources of the opposite resource
k. Quantity will be measured by the medium frequency of the supply of resource:
Fn—the possibility of interactions with the source of resources
n [
23] and it will be assessed in relation to the frequency of interaction with the opposite flows of resource
k:
Fk. Here the average will mean quantity of interactions with the sources during a certain period of time. Ideally it should be the whole time period of existence of the system but usually it is the period of observation. If we draw a reference axis with coordinates
Hn/Hk and
Fn/Fk, then we will be able to dot any pair of groups of sources belonging to the resources which interact via the system (
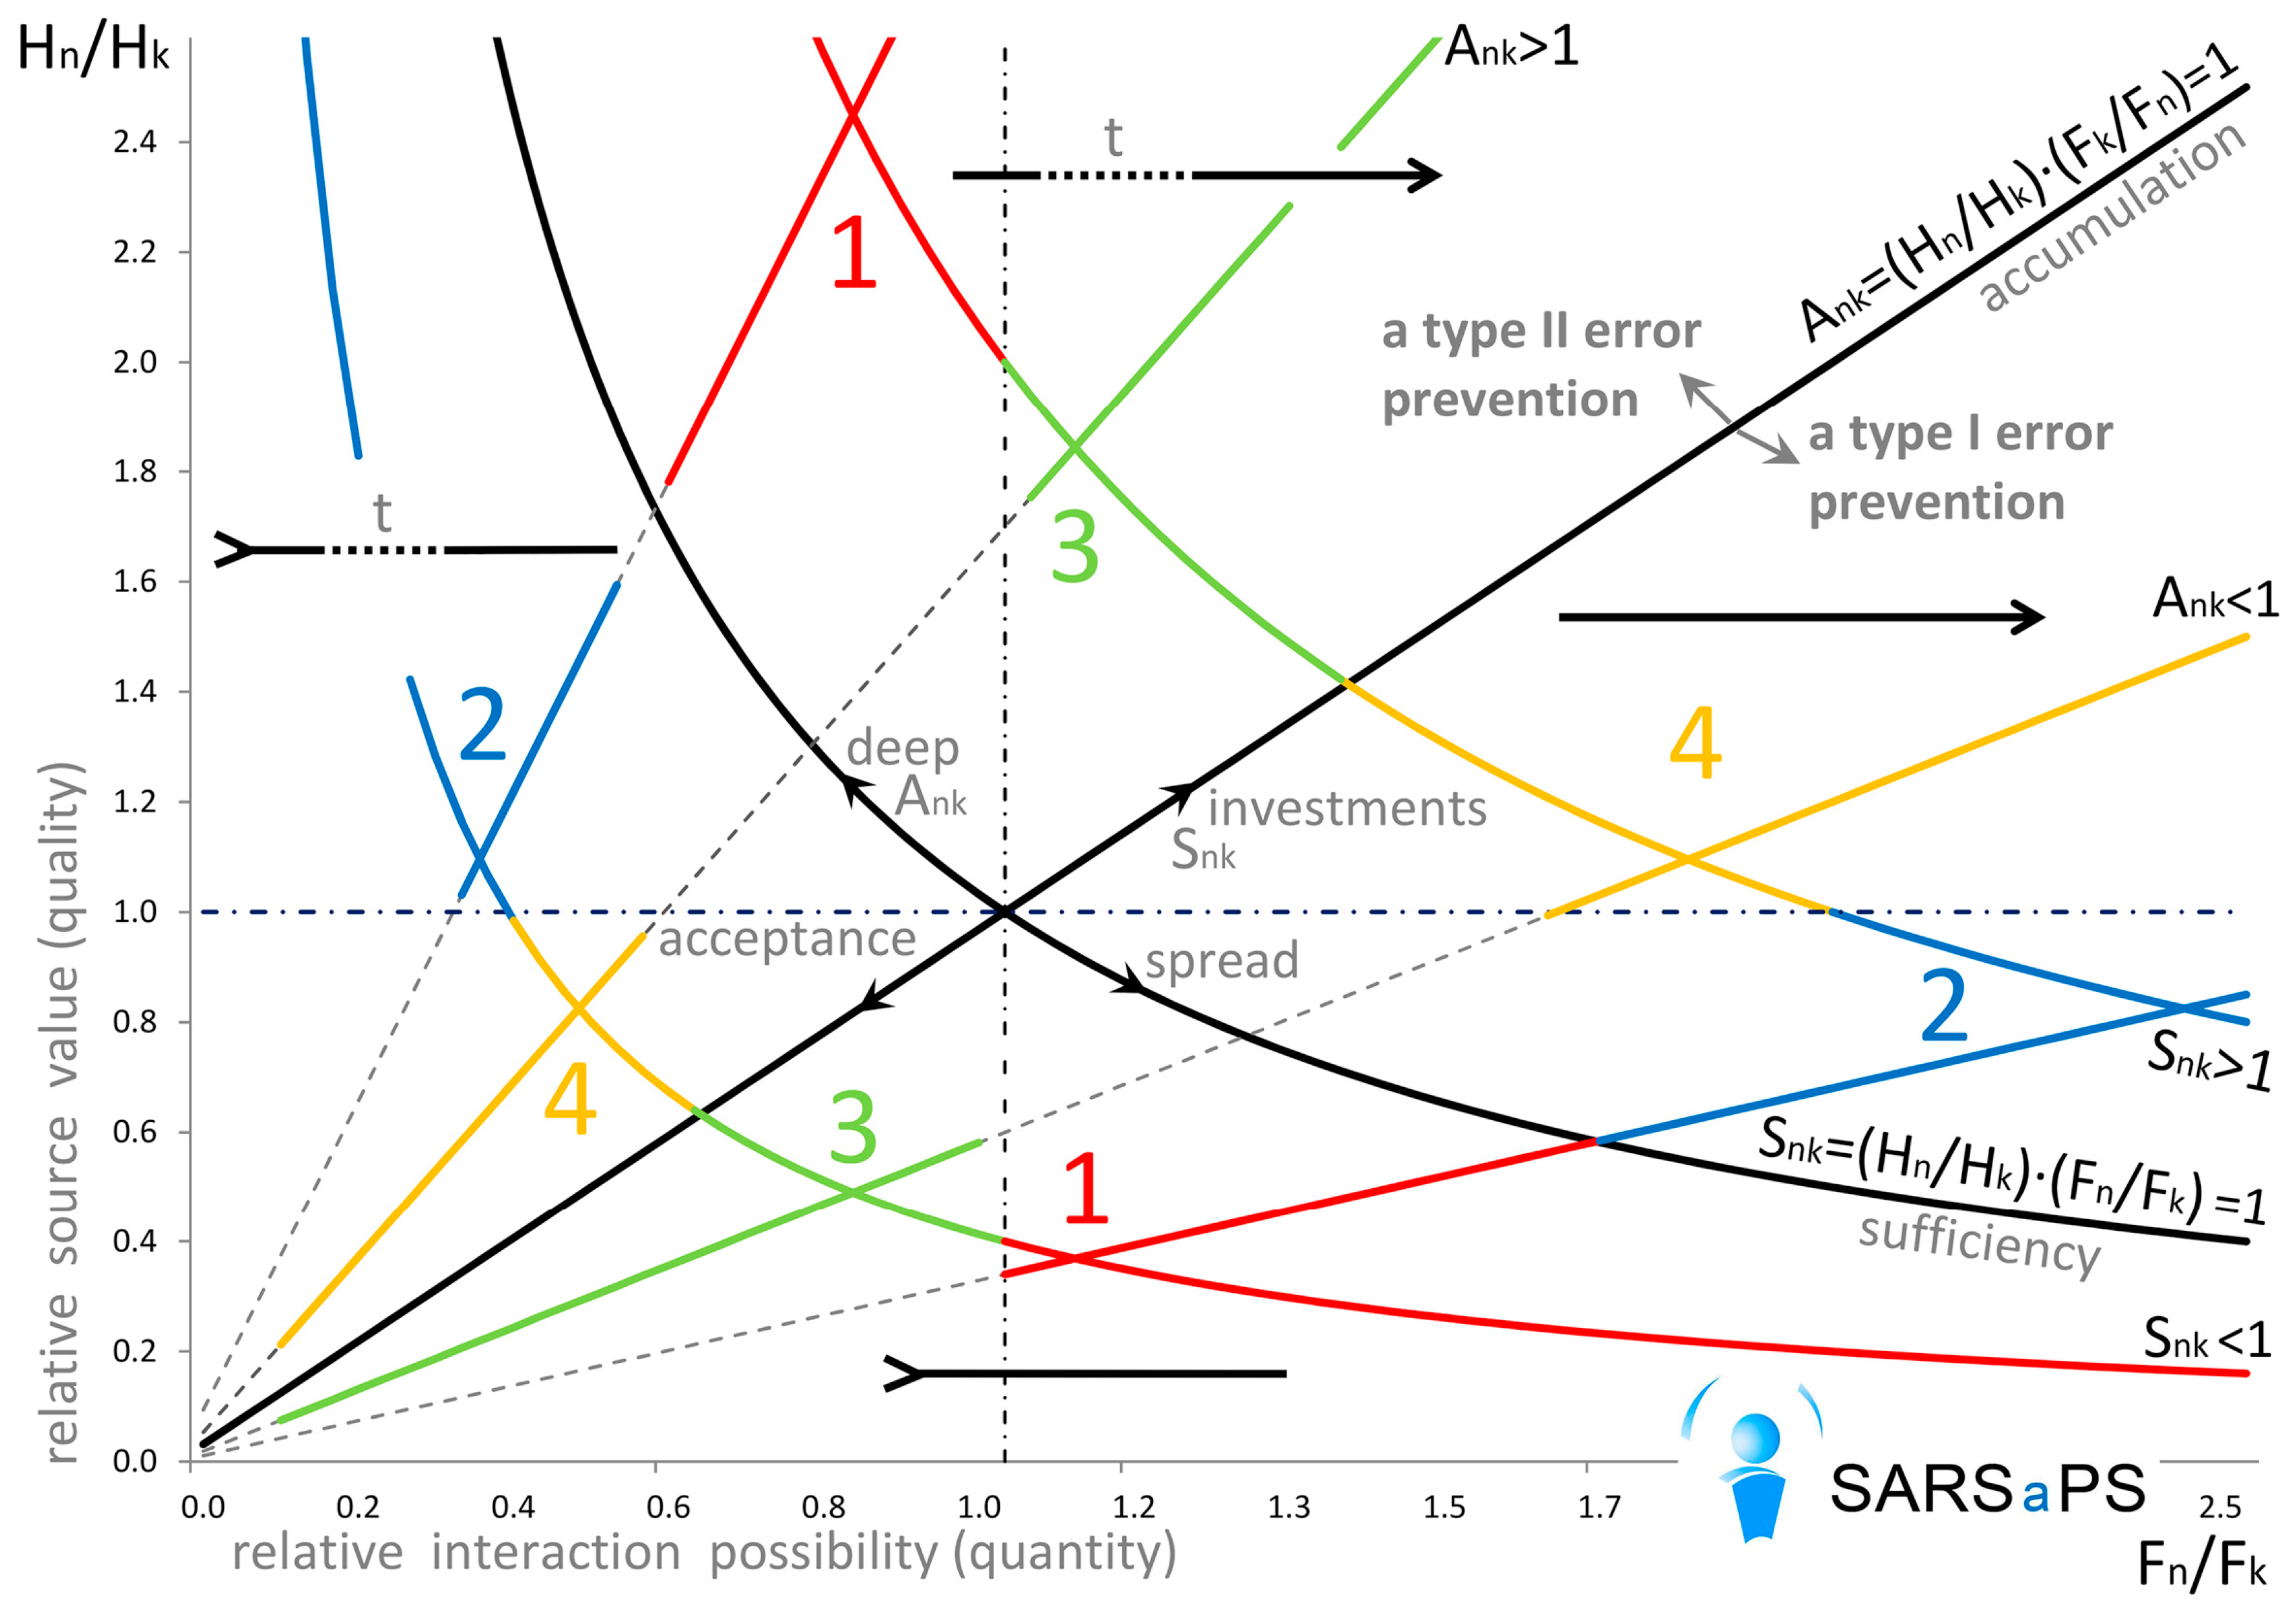
Figure 1).
For convenience, we can call Hn/Hk relative quality of the resources source, i.e., how fully their single sources are able to satisfy the demands and call Fn/Fk relative quantity of the resources. For quality we can draw analogy with a digital picture: the more pixels it has, the better its quality is. Quantity in this case means quantity of the pictures.
Additionally it is convenient to draw line Snk = (Hn/Hk)·(Fn/Fk) = 1 in this coordinate plane, which will mean parameters of sources of resource n in relation to parameters of sources of resource k. To the left from this line with Snk < 1 incoming resources are not enough to compensate the existing flow of the reciprocal resources. In this case part of the future flow of such resources will be used to pay for borrowed resources. By doing so, the crediting system invests in the future strengthening of the flow of the opposite resource. To the right from the line with Snk > 1, the resources are excessive to carry out an exchange with the existing opposite sources and some of the resources are invested in the future flows. The line demonstrates the resource’s sufficiency.
It is also convenient to draw a straight line Ank = (Hn/Hk)·(Fk/Fn) = 1 on the graph, demonstrating which characteristic of the source of resources is more significant—whether it is value or frequency of supply. With Ank > 1, the value of each source is more influential with a low frequency of supply. With Ank < 1, a large contribution is made by the frequency of appearance of the sources of resources, with small value of each of them. It will be demonstrated below that the line shows the amount of accumulations.
Both Snk and Ank parameters are important for analyzing systems. Therefore, with Snk < 1 the resources are insufficient to carry out an exchange and it seems that it has to spend them into the current exchange processes as much as possible but when Ank > 1, it is necessary to accumulate such resources, because if their supply tends to become less frequent, the system will be in danger of disintegration. That is why it is more effective to weaken the current exchange processes and at the same time to enhance their future stability by accumulating resources in the system.
For the same reason the system needs to accumulate excessive resources with Snk > 1 and Ank > 1. While with Snk > 1 and Ank < 1 it will be more rational to invest the excesses of the resources in current processes with a partly delayed reverse flow of resources.
As it was shown above, in case of two counter flows of resources, one is invested at once, while the supply of the other is partly delayed. If we take the four possible types of resource modes resulting from the combination of Snk and Ank on the graph, each interaction will have only two sets of oppositely directed resources:
- (a)
Snk < 1, Ank > 1 and Snk > 1, Ank < 1
- (b)
Snk > 1, Ank > 1 and Snk < 1, Ank < 1
Other combinations will lead either to accumulation of both types of resources with both A > 1, or on the contrary, there will be no need to invest both of them with each A < 1. Another possibility will mean that there is no excessive resource with both S < 1, or that there are no scarce resources with both S > 1. In all four above-described cases the flow of resources through the system will be irrational, therefore there will be no interaction between the systems. Mathematically, in case of two resources n and k, assuming that Snk = (Hn/Hk)·(Fn/Fk) > 1, then Skn = (Hk/Hn)·(Fk/Fn) < 1 and with Ank = (Hn/Hk)·(Fk/Fn) < 1 then it will always be Akn = (Hk/Hn)·(Fn/Fk) > 1.
In both assumed cases a) and b) represent a resource, whose sources are insufficient to carry out an exchange with the sources of the reciprocal resource and which is needed in larger quantities with Snk < 1; and a resource, which is excessive compared to the reciprocal flow of resources with Snk > 1. Also, in both cases there is a resource which is accumulated to carry out an exchange with additional sources of reciprocal resources or to intensify exchange with the existing sources of resource with Ank > 1 and another resource which is spent at once with Ank < 1. Let us consider these combinations in more detail:
(a) The first resource
n is enough and is not accumulated:
Snk > 1,
Ank < 1 and the second resource
k is in short supply but it is accumulated:
Skn < 1,
Akn > 1. In this case, the system is in short of the second resource and has to accumulate it due to significant discreteness in time, which is connected with high risks if the average frequency of supply decreases. The first resource is excessive but since its supply is evenly distributed in time, deviation from the average frequency will not cause any significant damage due to the small portions of arriving resources. It is more beneficial to spend the first resource at once. Accumulation of the second resource means investment of the first resource in intensification of interaction with the sources of the opposite second resource. The example is additional procurement of unique goods for creating storage, because the supplies can cease [
24]. Another example is providing unique specialists with extra bonuses to make them more loyal. Adaptation to the characteristics of the supplier is taking place due to accumulation of its resource but at the same time the offer itself is influenced to meet the requirements of suppliers.
There are such notions in statistics as type I and type II errors. Type I error implies an omission of an important event and absence of reaction to it. Type II error implies reaction to a false event, which is not important. In case of the described combination of resources, the accumulation strategy for the resource is a preventive measure for the type II error, which means reaction to a scarcely important event. For example, in case rare sources of resources temporarily cease the supply of the resources, at the same time preserving the average frequency of supply, the storage will help to cope up with the situation. Investment strategy for resource is aimed at protecting from the type I error, i.e., from the omission of possible source of reciprocal resource. In this case the scarce resource is accumulated to prevent type II error and the excess resource is invested to prevent type I error. Investments in this case are used to intensify the exchange.
(b) The first resource n is scarce and is not accumulated: Skn < 1, Akn < 1 and the second resource k is enough but it is accumulated: Snk > 1, Ank > 1. In this case, it is the second resource that has to be accumulated due to the specific distribution in time of its supply. There is a shortage of the first resource but its supplies are stable, therefore, there is no real need for safety storage. The second resource is invested. Since its interactions with the sources of the first resource are scanty and frequent, there is no sense in investing in intensification of interaction with each one of them. In this case, it will be more beneficial to invest into the increase of their amount. In this case, the system will be adapting to the needs of a group of additional counterparts, i.e., to the system of a multitude of similar resource sources. However, part of this multitude will be subsequently included in the system concerned. As an example, we can consider accumulation of various goods for a larger number of customers, or employment of additional less-skilled workers in case the existing ones fail to manage. Such strategy of accumulation of the second resource is aimed at prevention of the type I error, which means avoiding omission of an important event or failure to receive a resource. All emerging additional sources of resources of the same type will be included in the exchange system at the expense of the accumulated resources. At the same time, investment of resources in their exchange is aimed at avoiding type II error. Investments are used to increase the frequency of interaction.
Let us complicate the graph a little. Let us add two more single straight lines: Hn/Hk = 1 when values of the sources of reciprocal resources are equal—normal quality of resource sources; and line Fn/Fk = 1, when average distribution of the sources of reciprocal resources in time is equal—normal quantity of the sources of resources. It should be specified that at the crossing point of all lines with them being equal to one, no additional transfer system emerges, because no additional redistribution of resources is required. Moreover, relative characteristics are not fierce around this point, which means they can completely change due to various fluctuations. Stable systems rarely emerge under such conditions. It is more common for the systems to emerge in case with significant deviation from the center of the graph.
In relation to the horizontal straight line Hn/Hk = 1, normal quality of the sources of resources, both resources in a stable system can only be opposite to each other, because if there is Hn/Hk > 1 for the first resource n, then there inevitably will be Hk/Hn < 1 for the second resource k. Let us consider division of the pair of resources Snk < 1, Ank < 1 and Snk > 1, Ank > 1 by a vertical straight line Fn/Fk = 1, with a relatively normal quantity. In this case, the pairs will be opposite too. If the first resource has the following characteristics: Snk < 1, Ank < 1, Fn/Fk < 1, then the sources of another resource can only have the following parameters: Skn > 1, Akn > 1, Fk/Fn > 1.
In both pairs there can be cases, when the sources of the scarce resource are less frequent and at the same time less valuable, than the sources of the opposite resource Hn/Hk < 1 and Fn/Fk < 1. Then they will not have any relative advantage, which will be beneficial to invest resources in. The same is applicable to the excess resource which will not have an advantage influencing the strategy. While interacting with both sources of resources the system will have to apply both strategies, aimed at the prevention of type II and type I mistakes. However, the dominant strategy will remain. It will be determined depending on which characteristics will make larger contribution to the flow of resources as shown by the straight line Ank. We can also assume, that systems with stricter strategies invest in the formation of their structure, while systems with vaguer strategy are aimed at the increase of their volume.
We also got regularity, which implies that if one resource is shifting parallel to the sufficiency line
Snk = (Hn/Hk)·(Fn/Fk) = 1, then the second resource is shifting parallel to this line in the opposite direction. The same is happening when one of the resources is shifting parallel to the accumulation line
Ank = (Hn/Hk)·(Fk/Fn) = 1. In extreme case, if one resource is shifting perpendicularly to the center, then the second one is moving towards it until it reaches the cross point of all single lines. That is how the feedback [
25] algorithm works in systems.
We got four possible pairs of resources with the following characteristics of their sources:
Snk < 1, Ank < 1, Fn/Fk > 1 and Skn > 1, Akn > 1, Fk/Fn < 1;
Snk > 1, Ank < 1, Hn/Hk < 1 and Skn < 1, Akn > 1, Hk/Hn > 1;
Snk < 1, Ank < 1, Fn/Fk < 1 and Skn > 1, Akn > 1, Fk/Fn > 1;
Snk > 1, Ank < 1, Hn/Hk > 1 and Skn < 1, Akn > 1, Hk/Hn < 1.
As it was demonstrated above, combinations of 1 and 2 in this list are more strictly directed at the prevention of the above-mentioned errors in reactions. Here we can draw analogy to technology: if it is necessary to register some large phenomenon without a false triggering, then the input signal is accumulated to a certain extent and only then it is registered. If it is necessary to register very weak phenomena, then some tension is created due to the intensive energy flow and if there is even low signal this energy flow deviates, which is considered as registration. In the first case, if the signal is below the fixed threshold there will be no registration at all. In the second case, there is a high possibility of a false registration of accidental events. Any other systems, including the social ones, work in the same way.
Here we get the picture of interaction between sources of resources depending on the scale of consideration. With a certain scale some systems, for example, sources of resource k are insufficient for interaction and Skn < Snk. In this case system of sources of resource n will have to seek for other sources of opposite resources similar to resource k. For example, resource m. Then sources of resources k and m will have to compete between each other and therefore, to become more adapted to the requirements of the sources of resource n.
However, at a larger scale, a suprasystem of similar subsystems of sources of resources k and m will have relatively more resources compared to the system of sources of resource n. Therefore it will be searching for additional sources and will take up the system of sources of resource m, S(k+m)/n > Sn/(k+m) and so on. However, the type of resource which will be accumulated in the system does not depend on the orientation of adaptation of resource sources with a certain scale. It depends on the relative distribution of sources of resources in time. Combinations 1 and 4 accumulate a resource which is sufficient with the scale, while the resource in combinations 2 and 3 is insufficient.
At the same time we have to admit that line of normal quality and quantity, Hn/Hk = 1 and Fn/Fk = 1, between the strategies 1–3 and 2–4 are quite vague in reality and the same is true about their relevant thresholds in one or three sigmas in statistical measurements. Another fact that makes this model rather relative is that in reality most systems represent a mix of numerous flows of resources. As a result, several input resources can constitute one output resource and vice versa but in reality, the picture is even more complex. Nonetheless, in many cases there are some main flows of input and output resources, while others can be considered as additional or supplementary to them, in case when there is no possibility to carry out a more detailed analysis. At the same time, all the described distinctive features of resources become more apparent when the plotted points characterizing them are located further on the graph from the crossing point of single lines.
It is easier to apply this model for analyzing many social systems, because they use money as an intermediary tool for exchanges. It is money that can be often considered as a counter resource. Therefore, if we consider some abstract production company, then at some macro level it may be accepted that there is a flow of goods or services in one direction and a flow of money in the opposite direction. There is no need to consider the micro processes of exchange within the system, since they can be taken as the source of transmission losses of resources.
4. Dynamics and Differences of the State Systems
In order to explain application of the above-described model to the analysis of social systems, it will be more convenient to start from the historically largest ones of them, like countries [
26]. Flows of resources in such systems are quite uniform and this makes them similar to the simplest biological systems, like plants, which are used in evolutional economics for practical demonstration of regularities in systems [
27]. For social systems linked to a certain territory—states, one of the resources is represented by the services of individuals [
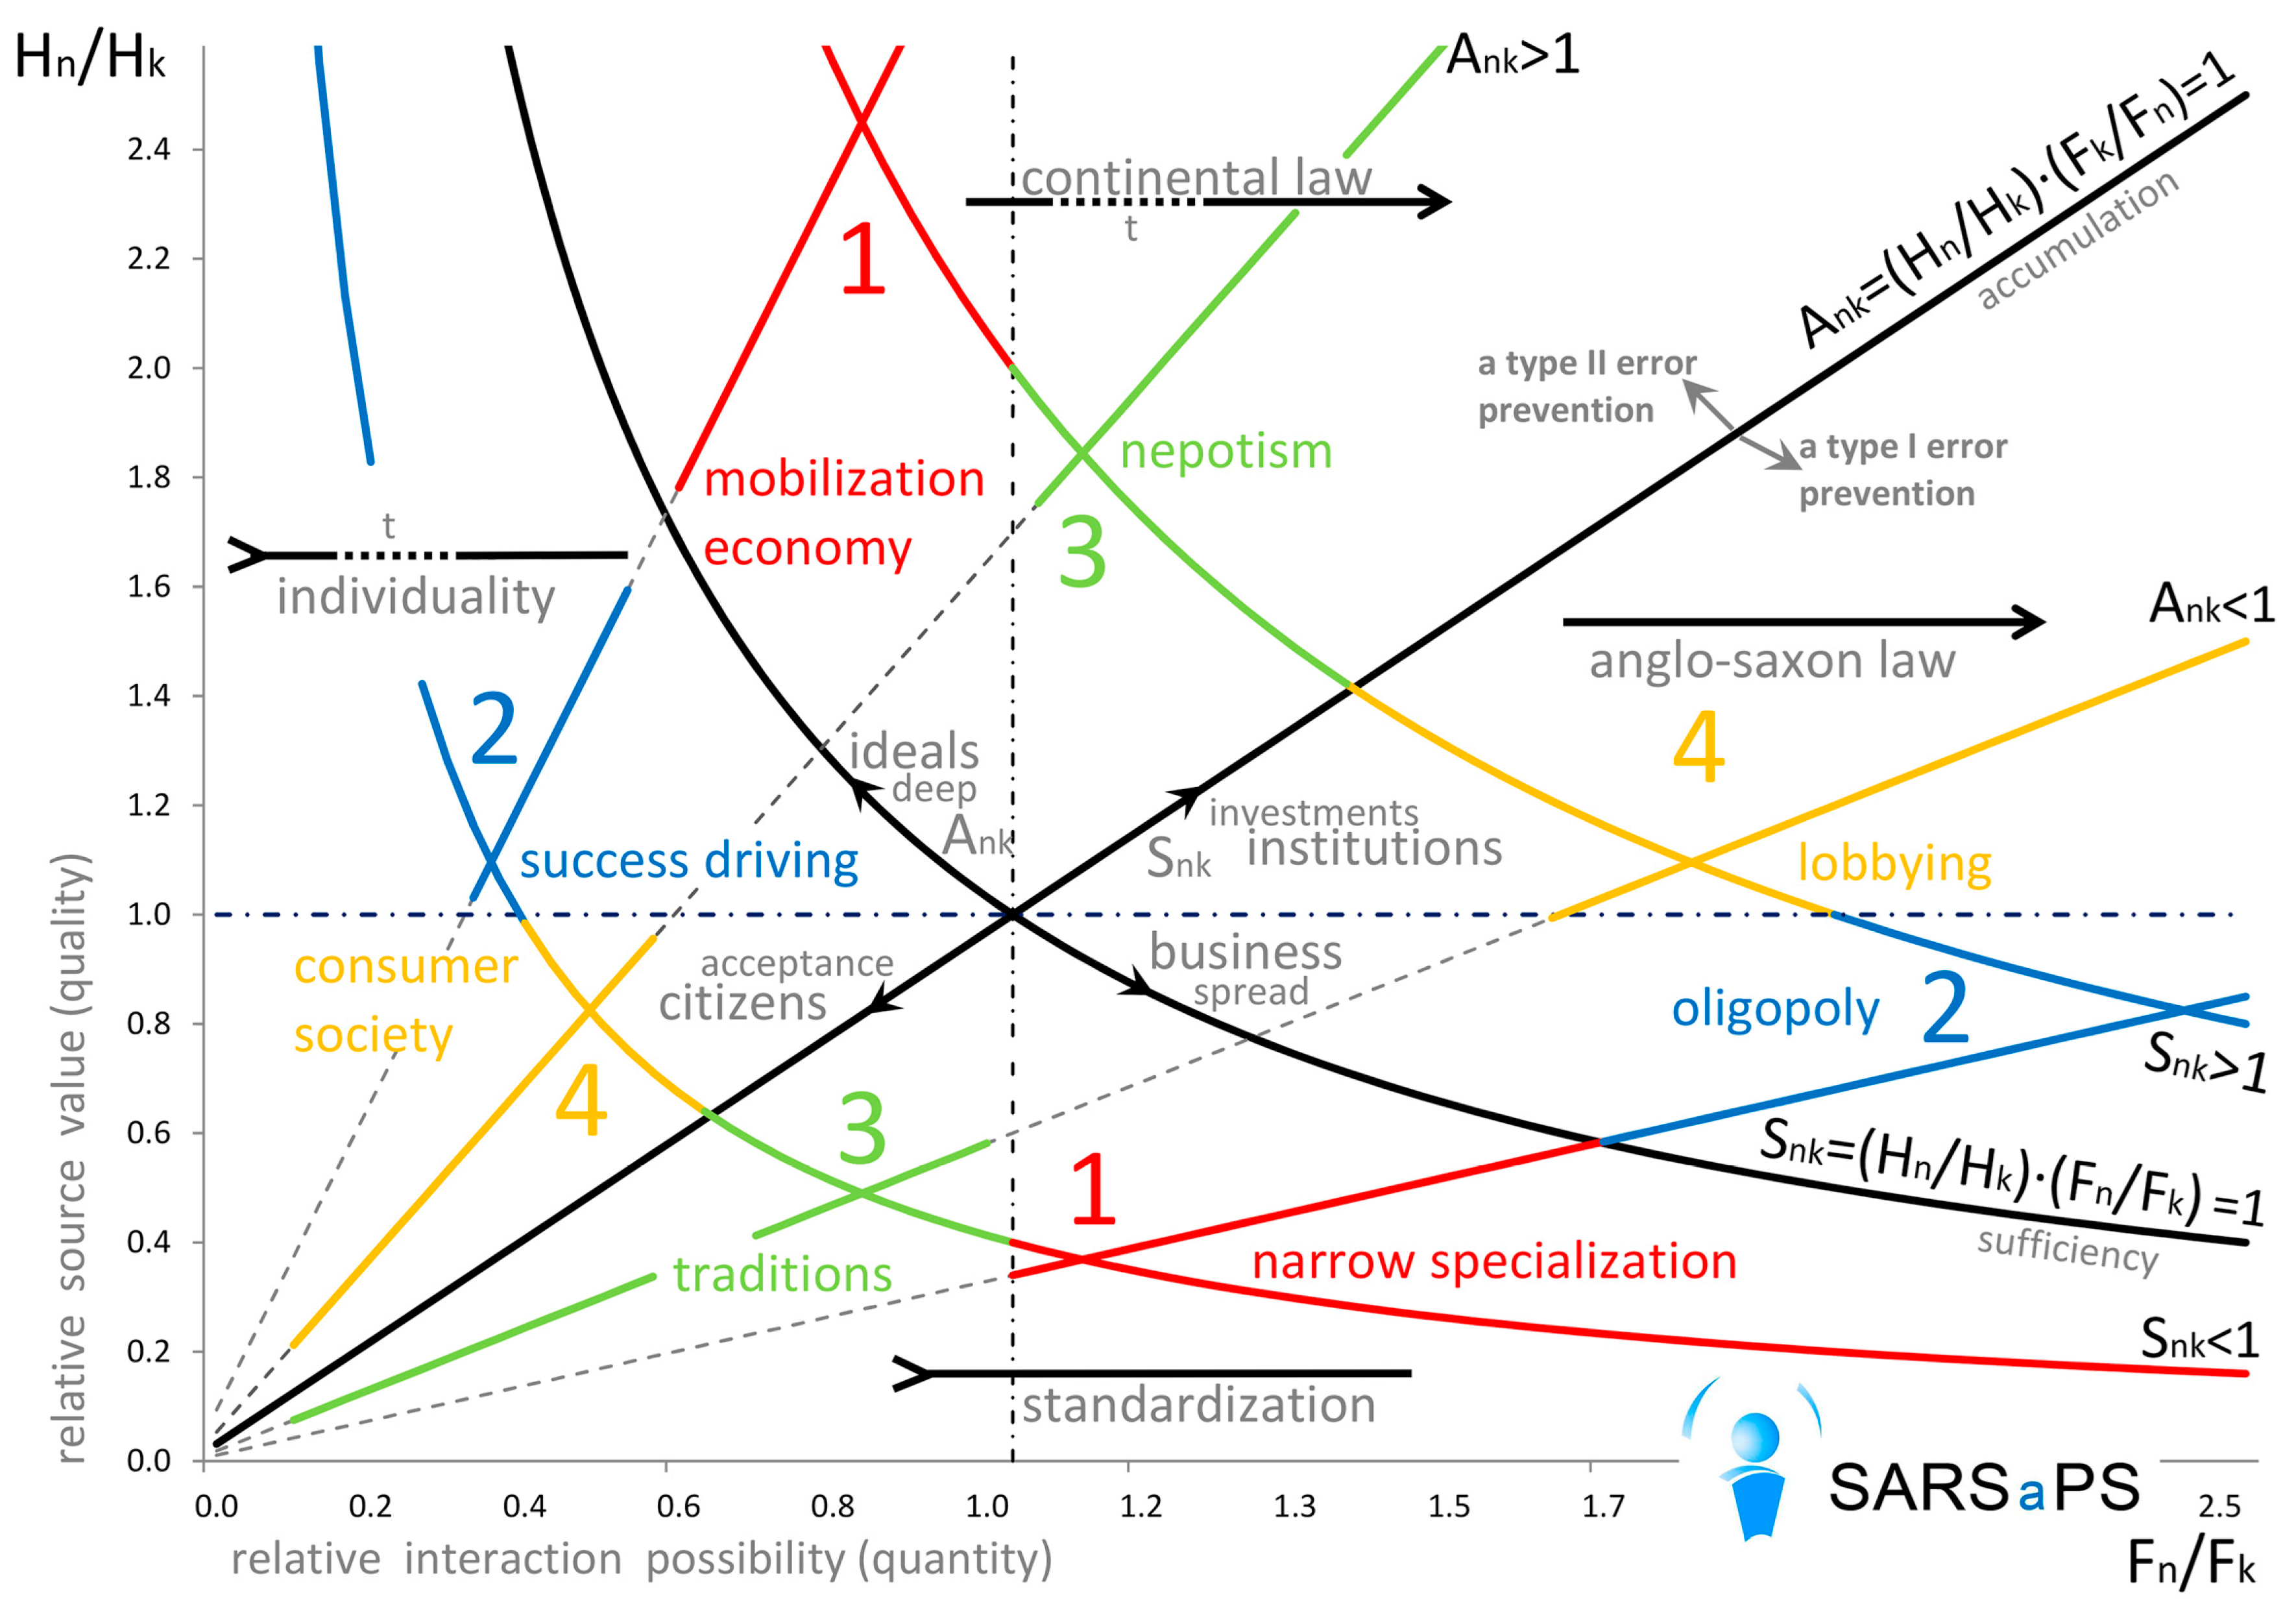
28] and the other resource will be represented by the services of the state and its subsystems. Therefore, sources of services of workers provided to organizations tend to have two extreme conditions: mass but simple and rare resources and rare but unique and highly professional ones. The same can be applied to the sources of services of organizations: small, autonomous and mostly private companies or expert institutions and large and mostly integrated centralized state systems (
Figure 2).
Initially, at the low level of development, when states began to emerge from separate tribes, the range of services provided by those states and their subsystems was very narrow. The reason was that spheres of both individual services and public services were underdeveloped. That is why after development of technologies, which enabled production of the first surplus products, the services provided in response by the states were rather uniform; these were unified agricultural and administrative and religious services with large religious building. The citizens themselves were quite uniform in terms of their value, which corresponds with the following parameters:
Snk < 1,
Ank < 1,
Fn/Fk > 1 in the 1st combination of resources. In other words, with mass but inefficient sources of state resources, i.e., people, the output resources were accumulated in large public projects and a centralized uniform system of rendering of service [
29]. Under the above-described conditions organizations will have the following parameters
Skn > 1,
Akn > 1,
Fk/Fn < 1. In relation to the citizens interacting with the state system. The large ancient religious buildings could be constructed only due to the lack of other ways to utilize the economic surplus. Religious buildings which were constructed later did not stand out that much against the surrounding buildings, even if there were similar resources and centralization of services.
Such system of a state and its subsystems, established with scarce human resources is aimed at the prevention of type II error in the investment of resources, i.e., against the waste of resources on the ineffective organizations and institutions. That is why all services are provided by a state and its subsystems only after some selection, which implies, for example, strict standards for any products of all subsystems, including the labor of individual humans. At the same they use ceiling amount of human resources sources, i.e., maximum number of people with different abilities.
As a result of the excess product increase under natural conditions there appears some small private property, which causes transition from communal to private economy. Therefore, it becomes necessary to diversify services for these suppliers of resources, which are more individualized but still small, with characteristics Snk < 1, Ank < 1, Fn/Fk < 1, from the 3rd pair of resources. Initially there was diversification of religious services. As a result, there appeared a limited pantheon of clearly distinguished gods with more local religious buildings and well-developed religious services. The state systems became less centralized and various large subsystems begin to divide into smaller ones based on personal contacts which leads to the establishment of nepotism. Characteristics of the state institutions become the following: Skn > 1, Akn > 1, Fk/Fn > 1. In this case the system aimed at the prevention of type II error in the investment of resources remains but it becomes much less strict due to the shortage of resources, which cannot be covered only at the expense of the large-scale production. Such deficit can be made up by the increase of population, which can be quickly achieved by expanding the territory under control. As the surplus product was growing, the uniform system became decentralized and could disintegrate, because there was a need for different strategies for its different subsystems.
In the last case, after disintegration of the large suprasystem, the subsystems located in the regions, which were not that rich in resources would no longer get the redistributed resources from richer regions. Then local shortage of resources would increase and such system would return to the centralized organization, more strictly directed at the prevention of type II error in the investment of resources.
In case of developed technologies such system will result in a mobilization economy with all human resources concentrated on large public works and with narrow specialization of labor and detailed standards for them [
30].
There is another regularity too. It is most evident in case of the above-described state system strictly directed at the prevention of type II error in the investment of resources. When there is such a state system with little diversification of subsystems and their services, the following tendency may appear: amount of resources obtained in the remote and isolated regions and underdeveloped territories of such states may significantly increase due to development of technologies. Then those people, who were the first to bring new technologies will launch the new flows of resources [
31]. Such people, which produce quite a lot of surplus product, will initially be quite a rare thing, due to a high risk. Though there will be much more people in general, only a few of them will succeed in the new highly competitive environment. However, their possible personal income will be high mostly due to the fact, that the system of redistribution of resources for public services is underdeveloped in the region and as a result, they can be spent on private goods. Such sources of human resources will have the following parameters:
Skn < 1,
Akn > 1,
Hk/Hn > 1, from the 2nd pair of resources. Organizations, which serve population when the infrastructure is so underdeveloped, will be uncoordinated and the competition between them will be oligopolistic [
32], since the absence of infrastructure will raise the switching barriers. At the same time there will be plenty of them because large individual wealth intensifies the use of services and therefore increases the income of such organizations. The structure of organizations emerging in such territories with uncontrolled competition will have the following characteristics:
Snk > 1,
Ank < 1,
Hn/Hk < 1. As for larger organizations, the main scarce resource will be represented by the services of smaller organization, rather than by the services of individuals. Smaller subsystems will compete between each other inside such organizations. All levels of such state system will mostly correspond with the 2nd pair of resources because all levels are interconnected [
33] and are located on the same flow of resources. Investments of such organization will be aimed at intensification of interaction with the most successful sources of resources. In such state systems, there is competition for rare but large flows of resources [
34]. At the same time the state system does not guarantee access to resources in case of such way of interaction between systems. The described state system is aimed at the prevention of type I error in the investment of resources; it tries not to omit possible effective interaction and accumulates resources in the form of people and organizations, providing the opportunity of a large compensation for all of them. However, the interaction is taking place only with the most effective ones of them. One of the most vivid historic examples of emergence of such state system is the rise of the eastern part of the Roman Empire and its subsequent secession.
When the above-described system accumulates resources from all the surrounding territories it leads to an increase in the number of resources but at the same time they become relatively less important: Skn < 1, Akn > 1, Hk/Hn < 1 from the 4th pair of resources. As a result, there takes place a transition to a vaguer compensation, which becomes smaller and more reliable but remains highly individualized. That is how a less strict avoidance of type I error in the investment of resources is established: Snk > 1, Ank < 1, Hn/Hk > 1. Oligopolies are replaced by a more flexible system of lobbying, because pure competition with a decrease one-time compensation is unable to sustain quite a solid structure.
The above-described system accumulates resources in the center for the increased intensity of interaction. That is why if the systems are strictly organized, compensation will be minimal on their fringes. As a result, other state systems may emerge in the remote and isolated territories in case there is a shortage of resources. The new systems will be similar to the ones described at the beginning and will be aimed at the prevention of the type II errors in the investment of resources in case of limited intensity of human resources. That is how the Arab Caliphate emerged in the provinces of the above-mentioned Eastern Roman Empire.
In case of a less strict prevention of type I error in the investment in such system, another regularity may show up. If there is an increase of resource flow due to a technical progress, a similar system with a more competitive structure may appear in the outlying districts. As a result, the new system will begin to accumulate resource flows, including the ones from the previous competitive system. One of the most recent examples was the replacement of England by the US as the leader in financial systems. Such model also helps to understand concentration of late centers of civilization in the northern or remote territories.
Therefore, there are several regularities or laws determining the dynamics of the state systems. State systems aimed at prevention of type I errors in the investment of resources with strict strategies create systems in the outlying districts aimed at strict prevention of type II error. If the strategy of prevention of type I error is not strict, there is a risk of emergence of a new state system with a stricter strategy of prevention of type I error in the investment.
The state systems aimed at the prevention of type II error in the investment of resources with their strict organization also increase the risk of emergence in the outlying districts of a state system with a stricter strategy of prevention of type I error. With a less strict prevention of type II error there are preconditions for the emergence of a state system with a stricter organization against type II error in the investment.
Therefore, there are two ways of development of state systems: (a) system with small compensation for exchanges but with a high possibility to receive such compensation; and (b) system with maximum compensation and a low possibility to receive it.
Both types subsequently tend to make their strategies less strict. And the emergence of both types of systems is related to (a) presence of a strictly organized oppositely directed system which is demonstrated by the opposite directions of pairs of resources 1 and 2; (b) appearance of a new resource base of a vague system with similar organization. The strategies become vague due to the increase in excess resources in both systems simultaneously, which corresponds with the opposite direction of resource pairs 3 and 4. That is how economic centers have been shifting in the course of human history.
At the state level and even at the international level these strategies are perfectly demonstrated by the Anglo-Saxon and Continental legal systems. The first one is more oriented at individual reasoning and expert opinion while the second one gives priority to a unified system of legal norms. It is impossible to combine the two strategies when international legal institutions are created, therefore they always have a particular orientation. Therefore, the medieval Catholic Church, which in its functions was similar to the modern UN, had a structure identical with the Anglo-Saxon legal system. The same can be said about the Delian League [
35]. On the contrary, the structure of the modern system of international law is much more similar to the Continental System. However, the UN Security Council is based on the opposite principle, which implies competition of expert opinions as was with the earlier analogs of the UN.
Another vivid example of the two opposite strategies of interaction with indefinite resource sources is the financial reporting systems. There is a great difference between the IFRS with its high level of expert opinion and the accounting system adopted in the USSR. We cannot say which of the systems is better since they have been created for different organizational structures. The first one is aimed at the prevention of type I statistical errors in the investment of resources and the second one is aimed at the prevention of type II statistical errors. In organized systems there is a contradiction of a competitive environment and a team work [
36], which, when dominate, reflect different strategies of the global structure.


