Article

A Conceptual Design of Spatio-Temporal Agent-Based Model for Volcanic Evacuation

1
School of Geography, University of Leeds, Leeds LS2 9JT, UK
2
Faculty of Geography, Universitas Muhammadiyah Surakarta, Surakarta 57162, Indonesia
3
Centre for Spatial Analysis & Policy, School of Geography, University of Leeds, Leeds LS2 9JT, UK
4
River Basin Processes & Management, School of Geography, University of Leeds, Leeds LS2 9JT, UK
*
Author to whom correspondence should be addressed.
Systems 2017, 5(4), 53; https://doi.org/10.3390/systems5040053
Submission received: 30 August 2017 / Revised: 29 October 2017 / Accepted: 22 November 2017 / Published: 26 November 2017
(This article belongs to the Special Issue Pervasive Simulation for Enhanced Decision Making)

Abstract

:
The understanding of evacuation processes is important for improving the effectiveness of evacuation plans in the event of volcanic disasters. In terms of social processes, the enactment of evacuations in volcanic crises depends on the variability of individual/household responses. This variability of population response is related to the uncertainty and unpredictability of the hazard characteristics of volcanoes—specifically, the exact moment at which the eruption occurs (temporal), the magnitude of the eruption and which locations are impacted (spatial). In order to provide enhanced evacuation planning, it is important to recognise the potential problems that emerge during evacuation processes due to such variability. Evacuation simulations are one approach to understanding these processes. However, experimenting with volcanic evacuations in the real world is risky and challenging, and so an agent-based model is proposed to simulate volcanic evacuation. This paper highlights the literature gap for this topic and provides the conceptual design for a simulation using an agent-based model. As an implementation, an initial evacuation model is presented for Mount Merapi in Indonesia, together with potential applications of the model for supporting volcanic evacuation management, discussion of the initial outcomes and suggestions for future work.

Graphical Abstract

1. Introduction

Mount Merapi is located near the densely populated city of Yogyakarta and is one of the most active volcanoes in Indonesia [1,2]. Merapi has a centuries-long record of numerous violent eruptions [3]. These dangerous events are likely to continue in the modern era and the recurrence of large explosive events on Mount Merapi is likely in the future [2]. The physical condition of Merapi’s environment, which is suitable for farming and tourism, attracts people to live in and visit the area even though it is prone to volcanic disaster. It has been identified that there are more than 50,000 people living in the danger zone surrounding Merapi, even though they have themselves experienced several eruptions [4]. Moreover, many people have refused to relocate, despite the 2010 volcanic eruption having damaged their settlements [5,6]. It is therefore important to provide better evacuation planning, as this is the only way to reduce the risks for the nearby population.
An important means of reducing the risk presented by volcanic eruption is through the provision of effective evacuation plans. However, people do not always respond positively to evacuation orders in volcanic crises. Although it is believed that people are aware of the decision to evacuate following an order from the authorities during a crisis [7], based on the experiences of the 2006 and 2010 Mount Merapi crises [4,8], it appears that people’s slow evacuation response remained the major problem that led to fatalities. It was claimed that the response to the last eruption in 2010 was better planned than for previous eruptions; however, the casualties were higher than in 2006 due to the unanticipated changing of the intensity of the eruption.
Various study attempts relating to the reduction of physical and social aspects of the risks relating to Mount Merapi have been made (Table 1). The physical aspects considered mainly relate to the identification of hazards, based on historical events, seismicity, modelling/mapping, material sediment/deposit characteristics and ground-based/remotely sensed-based monitoring. The social aspects are related to disaster/risk management, decision-support systems, disaster impact, population responses and characteristics, and evacuation decisions/management. There is a lack of research, however, on evacuation simulation and its importance in supporting the provision of better evacuation plans [9,10].
Various aspects should be considered in order to provide modelling for volcanic evacuations, including socio-demographic attributes, behaviour, and spatial and temporal aspects. The population response is composed of the nonlinear mechanisms of social processes, and such responses are highly stochastic rather than deterministic. The model therefore needs to utilise an appropriate approach to accommodate this nonlinearity. Nowadays, agent-based modelling (ABM) is considered an adequate model to simulate such nonlinear processes [51,52]. This approach, with the integration of geographic information systems (GIS) to model spatial aspects, is considered appropriate. The integration of GIS into ABM is known as spatial agent-based modelling [53], or georeferenced agent-based modelling [54]. The conceptual integration of both GIS and ABM is provided successfully by Brown et al. [55], in which GIS is used as the spatial data-model representation, and ABM is used as the model for the processes. This approach can be used to model and simulate complex systems and represent the results of the spatial processes as spatio-temporal information.
This article, which comprises a conference paper published by Jumadi et al. [56], highlights the lack of research available in the literature related to evacuation modelling for Mount Merapi, provides a conceptual design for the simulation using spatial ABM and explores its potential use in supporting evacuation management. This paper contributes to the development of ABM for large-scale evacuation simulation, which integrates the hazard model, an aspect that is absent from the literature, especially regarding volcanic hazards. For further explanation, Section 2 presents the background to agent-based simulation in support of the evacuation decisions modelled; Section 3 outlines the concept of the volcanic evacuation model; Section 4 presents the initial model design, implementation and its potential use in support of evacuation management; Section 5 specifies the future direction of research to validate this model, while Section 6 discusses the initial results and future work.

2. Spatial Agent-Based Modelling to Support Evacuation Management

Evacuation simulation is an important tool for the support of evacuation management [10]. The example put forward by De Silva and Eglese [10] shows that evacuation simulation can be used to test contingency plan scenarios. Their simulation integrates GIS and simulation models to develop simulation-based spatial decision support for evacuation planning. However, creating realistic evacuation scenarios is challenging because various factors need to be taken into consideration [57], especially the modelling of evacuee behaviour, which is very important in defining the evacuation outcome.
Evacuations from various types of hazard have been modelled through various approaches, based on the details of evacuee behaviour. Some examples of these, ranging from macroscopic to microscopic levels, depending on the evacuee behaviour detailed in the model, are presented in Table 2. A macroscopic model is unable to capture the level of variability of population behaviour that can be achieved through a microscopic model [58], whereas a mesoscopic model compromises both micro and macro outputs [57]. Evacuation modelling uses varying methods such as GIS [59,60,61,62], ABM [63,64,65,66,67,68], numerical models [58,69,70], cellular automata [71], linear programming [72], game theory [73] and logit models [74,75]. Of these studies, only a few are concerned with volcanic evacuation, such as Marrero et al. [59,60], but, in these, the behaviour of both volcanoes and population is inadequately considered in the models (macroscopic).
The involvement of the behaviour of people in the evacuation model is important since evacuations are composed of complex social processes. Social processes are nonlinear and dynamic, and the studies relating to them are categorised as investigating complex adaptive systems [52]. For many years, social scientists have tried to understand particular social processes by means of simulation environments [103]. In this field, simulation means running simplified versions of social systems that might occur in the real world. Such simulation is essential for several purposes: to obtain understanding; to predict the consequences of particular social processes; to substitute human capabilities; training; entertainment; and to assist in discovery and formalisation [104]. Although many techniques are suitable for social process simulations, including cellular automata, artificial intelligence and ABM, ABM is the only one that can accommodate the high level of complexity of a system and instantiate interaction between agents at the same or different levels [104]. It can be used to model social entities, their behaviours, social attributes, and properties that emerge from their interactions. Spatial data from GIS can be involved in the simulation environment, to match with particular geographic locations.
ABM is defined as a computational method that enables a researcher to create, analyse and experiment with models comprised of agents that interact within an environment [103]. This term is used interchangeably with the terms ‘agent-based systems’ and ‘individual-based modelling’ (IBM) [105]. Macal and North [105] introduced a complete term for modelling and simulation based on this technique of agent-based modelling and simulation (ABM). Agents can be separate computer programs or can take the form of distinct parts of a program used to represent social actors such as individual people, organisations such as firms, or bodies such as nation states [103]. Modelling is the act of creating a model of something for a particular purpose, such as to describe it, understand it, or derive certain properties [106]. A model is defined as a simplified representation or ‘abstraction of reality’ [107] and a simulation is defined as the imitation of a system through a prototype of the system, in order to find the flaws and problems inherent in it so as to rectify them [108]. An agent can be represented in a spatially realistic environment involving a GIS. The integration of GIS and ABM has been discussed in numerous pieces of research and is known as spatial agent-based modelling [53] or georeferenced agent-based modelling [54].
ABM has advantages in modelling the complexity of interactions between social and physical environments [109], which make it appropriate for modelling certain emergency conditions in silico to provide greater understanding of them [110]. It can model the dynamic changes of hazardous environments, as well as the behaviour of people in response to a disaster [67], so that the simulation outcomes can improve the understanding of evacuation processes and optimise evacuation plans [57]. For a more realistic model, spatial data can be integrated in the model at various scales [110] ranging from small areas (e.g., [65,81,82,83,84]) to large areas (e.g., [63,68,90,91]), depending on the type of hazard being modelled. For example, fire may only impact a building, while an earthquake or tsunami can destroy a city or region. Some simulations proposed for a specific hazard integrate the hazard model in the ABM simulation and can therefore provide a more realistic model of interactions between human and hazard—for example, the fire dynamics simulator [81], numerical simulation of tsunami propagation [67], the tsunami inundation model [88] and hydrodynamic simulation of a flood [96]. Meanwhile, the evacuation models proposed for generic hazards are developed without the integration of the hazard model (e.g., [65,82,83,90,111]). Given that the hazard is spatially dynamic, providing this dynamic mechanism is significant. The hydrodynamic-using numerical simulations for tsunami [67,88] and floods [96] are examples of the integration of the hazard dynamic model in the simulation on a regional (large) scale. However, these examples are limited in involving historical events to express the spatial extent of hazard in the model. This limitation is addressed in this paper.
In addition, the composition of the population and its characteristics, behaviour and interactions can be modelled to complete the representation of the social environment. To do so, the synthetic population of agents utilises synthetic social networks, allowing synthetic daily activities to be generated based on real population data [97,112]. There are several techniques that can be used to generate a synthetic population, including deterministic reweighting, conditional probability (Monte Carlo Simulation) and simulated annealing [113]. Moreover, certain rules relating to how people respond to the hazardous event can be included, in order to specify the agent’s behaviour [85]. The agents utilised in this model have the ability to observe and measure the hazard level of their environment and make decisions based on this as well as on their interactions.

3. The Concept of the Volcanic Evacuation Model

It should be noted that no one method has been recognised as the best approach in the development of an ABM [114]. However, it should contain three main elements: agents, relationships and environment [115]. According to Macal and North [116], ABM can be developed by means of several steps: (1) identifying its purpose and the questions that are intended to be answered; (2) systematically analysing the system, identifying components and component interactions, relevant data sources and so on; (3) conducting the experiment; and (4) understanding the robustness of the model. The purpose of this model is to provide a spatially realistic simulation of a volcanic evacuation. This model intends to answer questions related to spatial and temporal aspects of evacuation—for example, how different scenarios affect the disaster outcome and which route(s) might experience potentially high levels of congestion during the evacuation process.
Spatial data is essential for providing a spatially realistic evacuation simulation. Therefore, GIS is used for preparing spatial data as input into the ABM simulation (Figure 1). The spatial data in GIS can be modelled as vector data or raster data [117]. The vector data model represents the real world as point, line or polygon geometry, while, in raster data, representation can be as a regular two-dimensional grid with specific spatial resolution. These data models have advantages and disadvantages in visualising the real world, which should be noted when deciding which model is appropriate for certain applications. The choice of vector or raster model depends on the purpose and design of the simulation, in terms of how the data will be represented. There are a number of platforms that can be used to integrate GIS data into the ABM simulation—for example AGlobe, Cougaar, Repast, CybelePro, SESAM, AnyLogic, GAMA, and NetLogo (see [118,119]); however, their capabilities for supporting this type of GIS data vary. Repast, for example, is suitable for vector models, while AnyLogic, NetLogo and GAMA accommodate both vector and raster models [118,119]. In this present model, the GIS data of the population unit, hazard zones, road networks and shelters are represented as a vector. This data was prepared using GIS software and used to set up the environment where the agents are living or moving through (road networks).
Figure 1 shows the flow of the model from preparation and simulation to output. The output can be analysed using spatial analysis that is suitable for the purpose. Several of these outcomes are provided in Section 4.2 with the aim of answering evacuation-related problems. Therefore, it is important to utilise GIS in the analysis of the output. Additionally, there are some types of spatial analysis that can be used to analyse the output: point density analysis, for example, can be used to provide an analysis of the density map of the population that has been aggregated from the individual evacuees. It can also be used to analyse the road density map.

3.1. Data Input Requirements

Providing a spatially realistic model is important because the location of the crater and the population distribution are critical in defining the risk. Therefore, some spatial and non-spatial data were employed as inputs into this model. This data is predominantly comprised of:
  • Administrative boundaries (vector data): this is used to populate the agents within the population unit (district) [120] (see the data in the supplementary material).
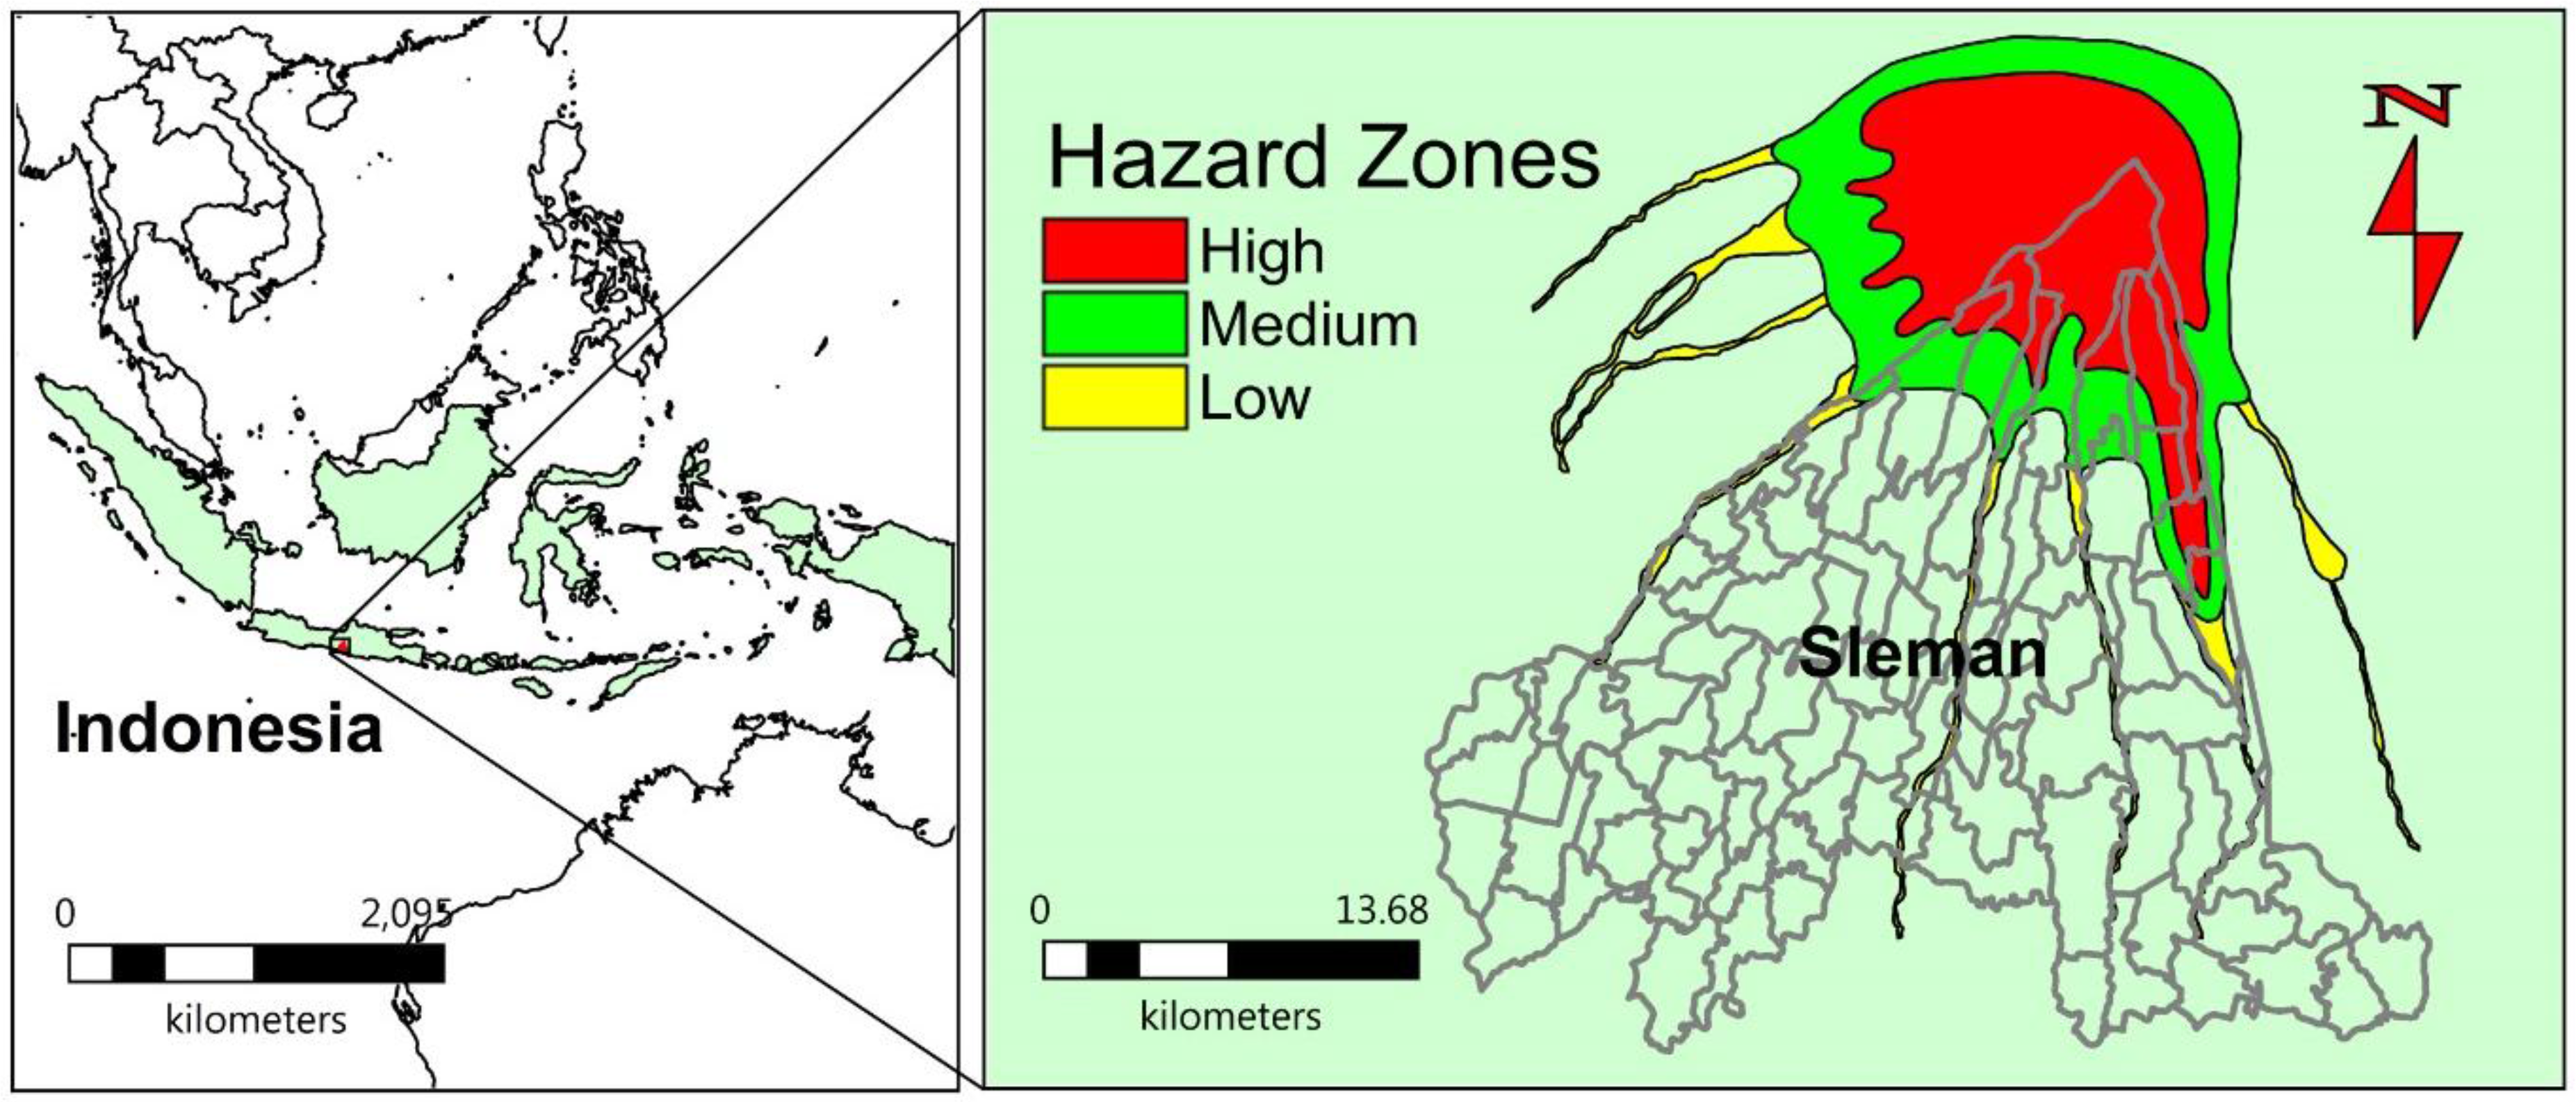
  • Volcanic hazard zones (vector data): setting up the hazard scenarios and spatial distribution related to the eruption impact.
  • Land use (vector data): defining the mean centre of population distribution (see [121]). This data is used to make the distribution of agents spatially similar to the real data.
  • Census data: defining the number of agents within each population unit [120].
  • Road networks (vector data): this is used for evacuation routing of agent movement. Open Street Map data was used in PBF format for this purpose (see [122]). For the purpose of modelling movement, Dijkstra’s algorithm (see [123]) was utilised to find the shortest path from the origin location to the destination, as this algorithm is advantageous for analysing evacuation routing in a dynamic environment [124].
  • Evacuation shelter data (vector data): the shelter is used to accommodate the evacuees. In the initial model, the shelters are placed randomly within the city and outside the hazard zone. It is assumed that people would go to the city, as it will provide much-needed public services. However, a few datasets have been listed that could be used to improve the model in this aspect in future work (see [125,126,127,128,129]).

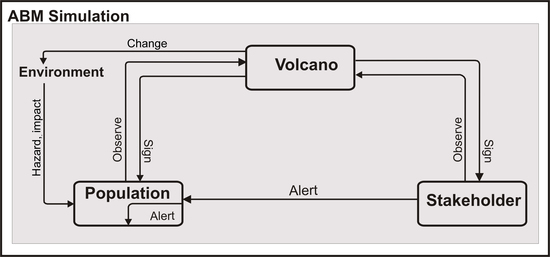
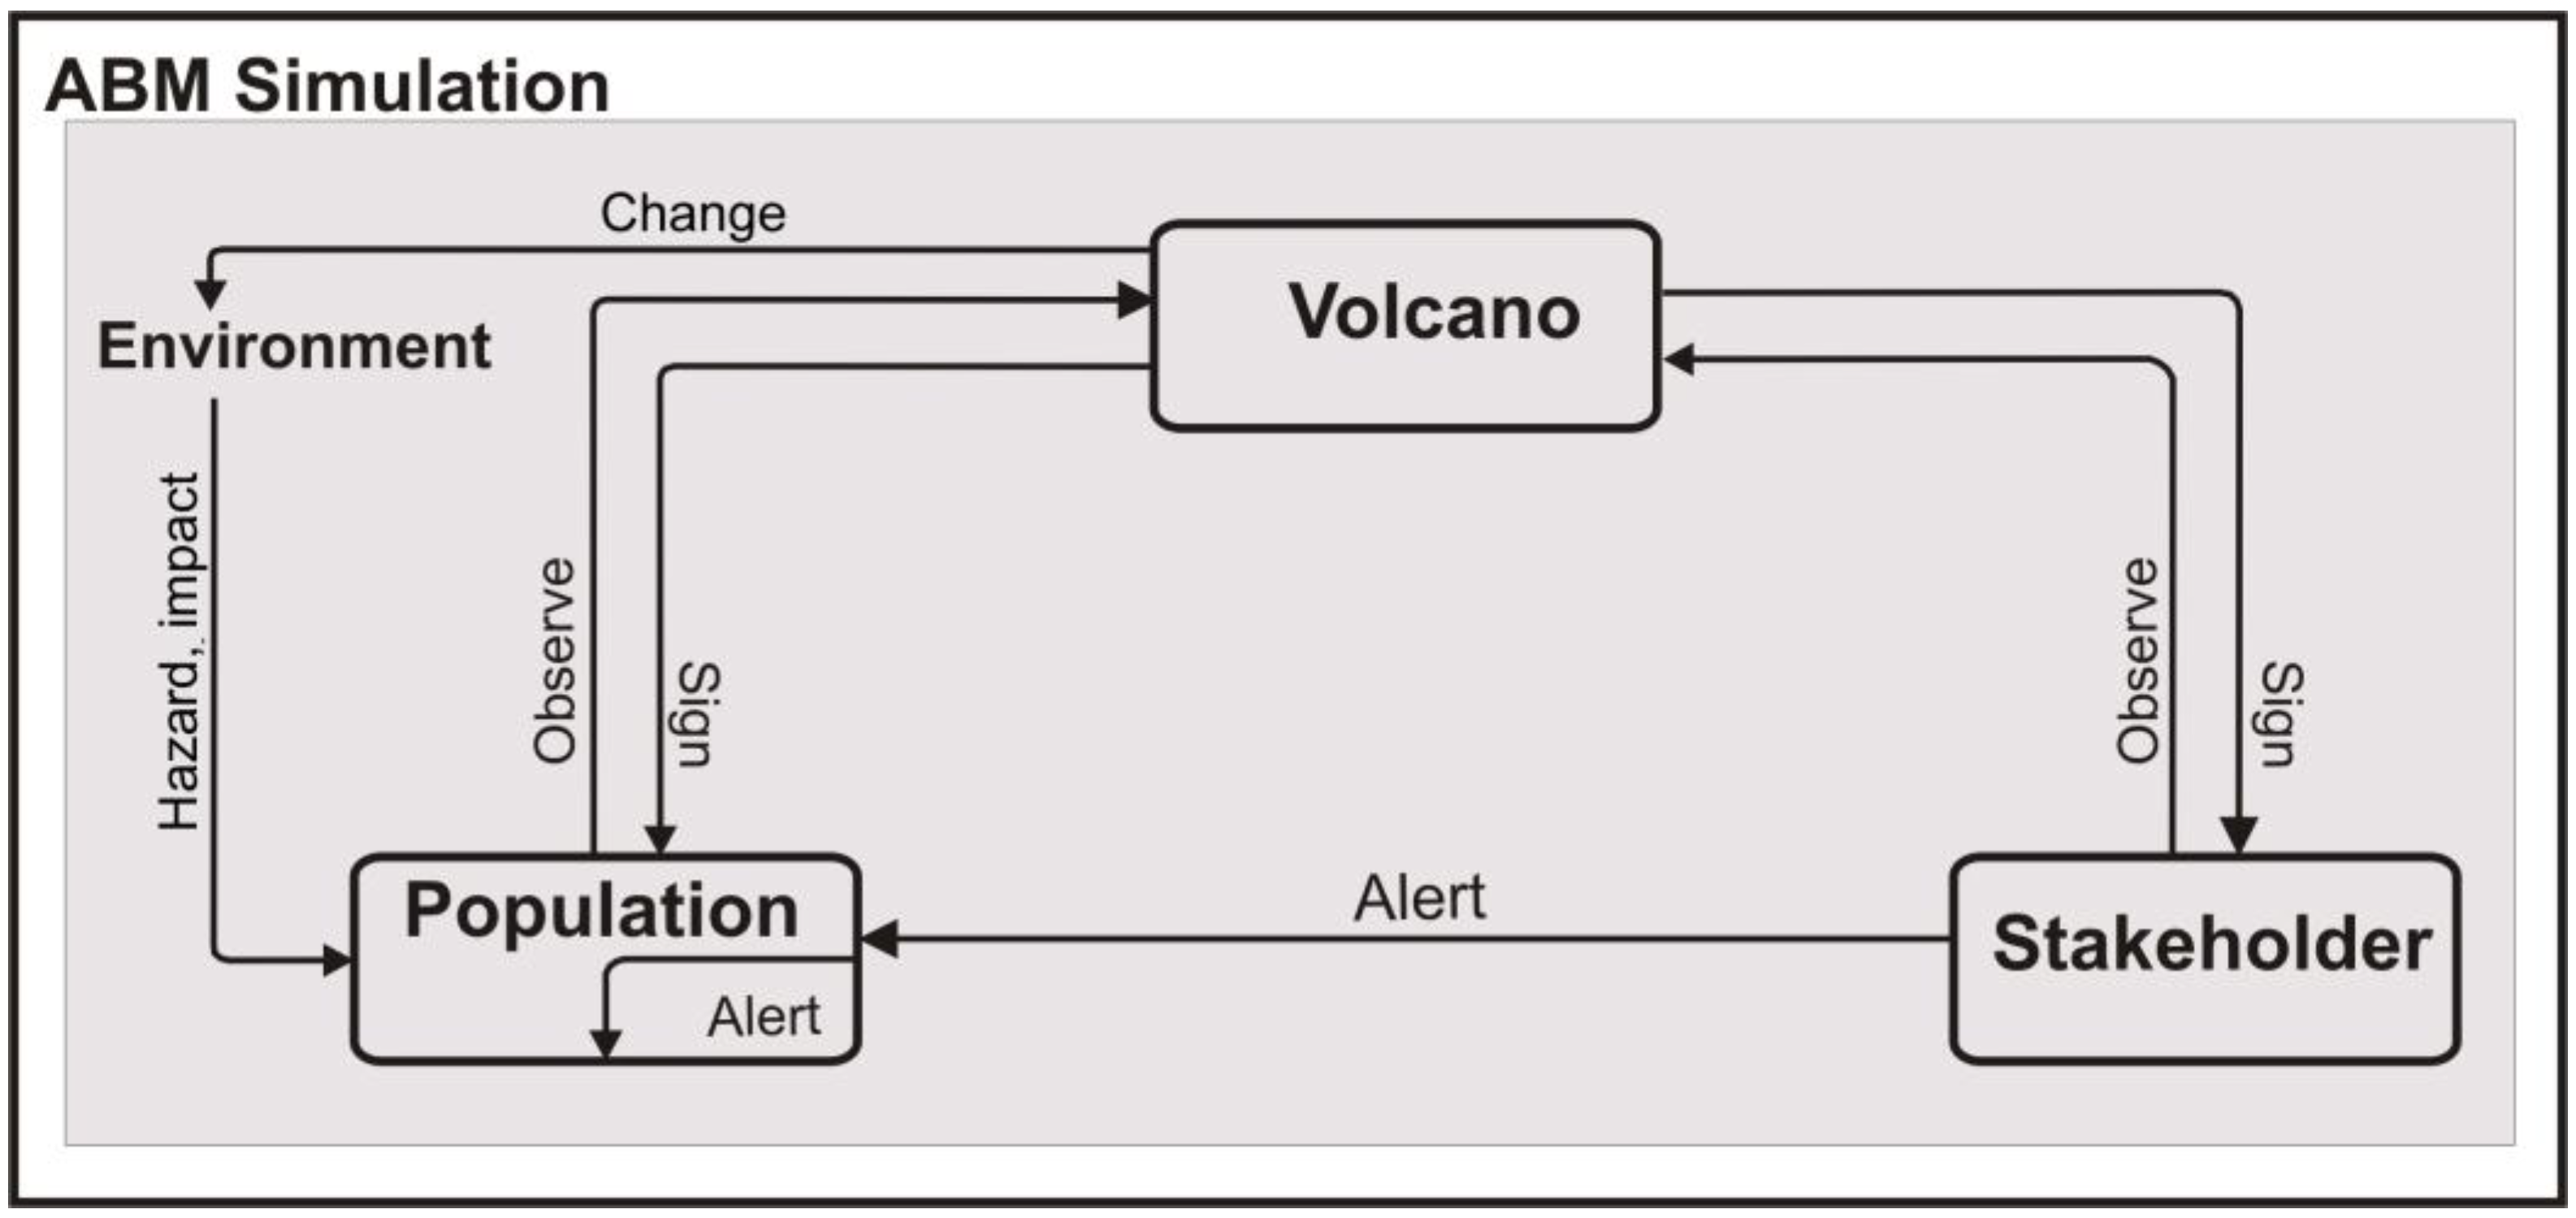
3.2. Agents and Environment

The following list provides an overview of the agents as well as the environment components. Details of the agents and environment attributes are provided in Table 3. This table also details some attributes of the agents and environment that indicate geographic location e.g., district ID, latitude, and longitude. The determinations of both location (spatial) and attributes of the agents are based on the dataset provided in Section 3.1. The agents consist of volcano, stakeholders and people. The volcano has a specific coordinate based on its real location, while the human population is spatially distributed to mimic the real population (Section 3.3). The georeferenced environment where these agents live comprises population units, hazard zones, route networks and evacuation shelters.
Agents:
  • Volcano: this is a single agent that can produce activity and influence the hazard zone.
  • Stakeholders: represent the authority that has the role of observing the volcano and alerting people.
  • People: represent the people who live in the area surrounding the volcano. This agent has the ability to decide to move from the hazard zone to a safe area.
Environment:
4.
Population unit: this is a fixed environment that is provided as a GIS region. The population unit is provided as the district boundary where the agent’s population will be distributed within this region.
5.
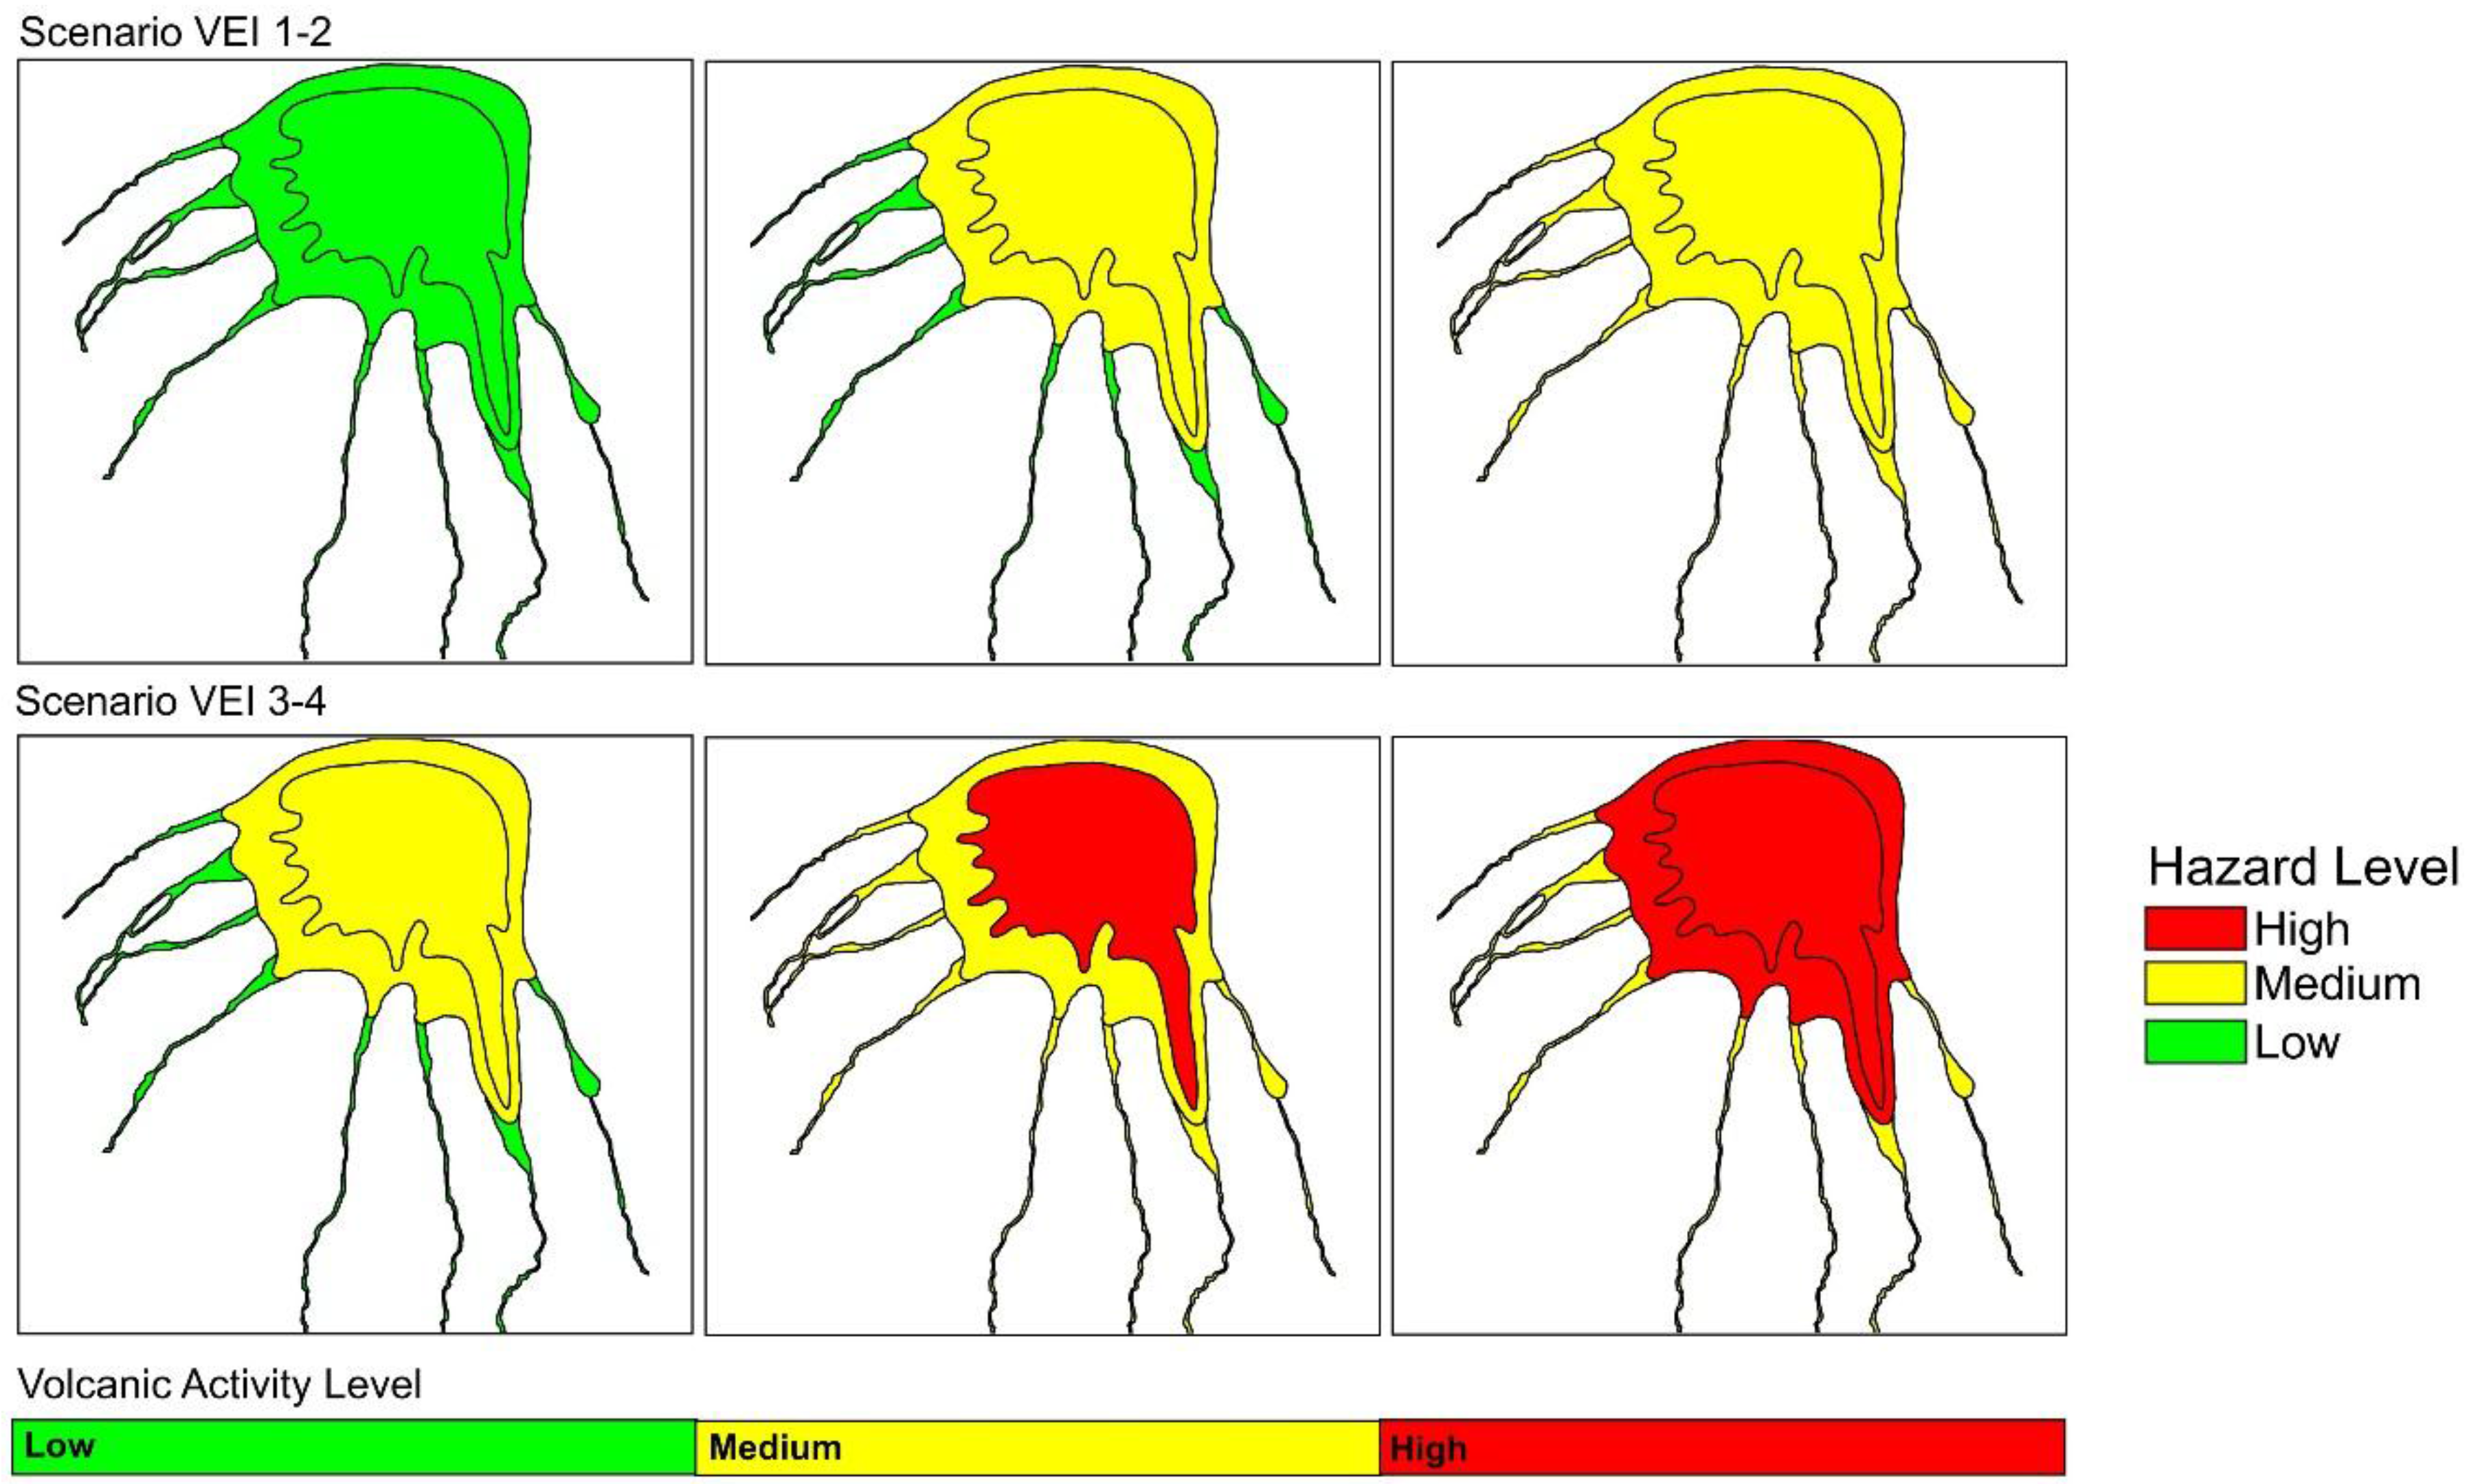
Hazard zones: the hazard zones are provided to express the hazardous environment that is dynamically changing as the volcanic activity is changing.
6.
Route networks: the evacuation routes that are generated using OpenStreetMap (OSM) are a fixed environment that is used by agents to move along.
7.
Evacuation shelters: this is a fixed environment that is distributed outside the hazard zones at GIS points.

3.3. Agent Population Generation

Developing a simulation in which the outcomes rely on individual behaviour needs a synthetic population of human agents in which the heterogeneity of the agents’ characteristics is consistent with the aggregate of characteristics of the real population [112]. Especially for spatially realistic simulation purposes, these population characteristics should be similar to real conditions in terms of socio-demographic attributes as well as spatial distribution [130]. However, the available population microdata commonly lacks spatial representation detail for household location due to confidentiality requirements [131]. Therefore, synthetic population generation should not only characterise demographic character but also geographic location.
A synthetic population is a population built from anonymous survey data at the individual level [130]. There are several techniques used to generate synthetic populations, include deterministic reweighting, conditional probability (Monte Carlo simulation) and simulated annealing [113]. Among these techniques, conditional probability has advantages for use in this model as it contains stochastic elements. This stochastic condition is needed because the exact data is unknown. This technique comprises three steps: data preparation, conditional probability simulation development and execution, and verification to fit the result, with development, execution and verification being iterative processes. If the verification process finds that deviation from the real data is high, then the process loops back to the development and execution process to fix possible bugs or logical errors.
In this model, the human agents are generated in individual units for each sub-district of Sleman that is located in the hazard zones. The number of agents within each district is proportionally minimized due to limitation of the agents in Anylogic Personal Learning Edition (PLE) (see supplementary data No. 4). The attributes were matched with the real data using census statistics represented as custom distribution in AnyLogic. The spatial distribution of the population was also randomly generated to match the real spatial distribution of the population agent using the centre of gravity model (see [121]), in which the agent population tends to be distributed randomly within the mean centre of residential areas. Furthermore, the outcome of the population generation model was verified using statistical and spatial distribution.

3.4. Agents and Environment Interaction

The ABM of the volcanic evacuation simulation is developed from the relationship between the volcano and the surrounding population (Figure 2). An active volcano such as Merapi is a potential threat to the surrounding population. Two other important agents in the interactions are the stakeholders and the population at risk. Stakeholders, in this case the authorities (government), have a significant role in observing and analysing the activities of the volcano and in issuing warnings to the population. In the ABM simulation, these three elements are represented as agents who interact with the environment. Each agent displays specific behaviour and mechanisms when interacting with the others, as well as with the environment. The environment is represented through spatial data with dynamic hazard properties. Meanwhile, the agents live in the environment within a specific geographic location. The volcano can be represented as a fixed agent that has the ability to influence the environment, although it has no ability to move, where its influence on the environment (hazard zone, see Figure 3) depends on its activity level and the intensity of the eruption (volcanic explosivity index (VEI)). When the volcano becomes active, the environment might change because of the material emitted from the volcano and thus become dangerous (Table 4 and Table 5).
There are various types of hazards in one eruption event. The hazard originating from a volcano can be categorised into two types: (1) destructive: lava flows, nuées ardentes, and lahars; and (2) less destructive: heavy ash or pumice falls, deposition of toxic chemicals, pollution of surface or underground waters, etc. [133]. Nuées ardentes and lahars are recognised as the most harmful events caused by eruptions of Merapi. Merapi produces specific nuées ardentes compared to other volcanoes [134]. The distance of travel of deposits can be 3.5 km from only a few individual events [135]. Lahar-related disasters also have a high potential of occurring at Merapi [136]. Nue’esardentes originate from coupling of volcanic gases and volcanic material as a specific hazard of Merapi that usually kill people [134], while lahars are overbank pyroclastic flows coupled with rainwater that occur during the rainy season [22,137].
The hazard map (Figure 3) is developed based on historical records of eruptions together with deposit analysis [20,132,138] that summarizes these events. The map expresses the spatial extent of hazard that relates to the location of the volcano. The hazard level of the area close to the summit is the highest, followed by the successive zones. The VEI influences the hazard level of each because this expresses the magnitude of the impact of eruptions quantitatively [139]. A low VEI will produce a relatively low hazard level in relation to the zones. On the contrary, a high VEI will result in higher hazard levels (Table 4). Moreover, because the activity level of the volcano increases/decreases gradually (dynamically), the hazard level of each zone will also change based on this activity level (Table 5).
The matrix of the relationships of the hazard characteristics, volcanic activity level and the hazard level of each zone provided in Table 4 and Table 5 can be used to provide rules for the spatio-temporal dynamic of the hazard. Based on the matrix in Table 4 and Table 5, the changing of the hazard level within these zones can be simulated dynamically (Figure 4). In referring to the tables interpreted in the official hazard map [132], the scenarios related to 3 and 4 in the VEI have a more severe impact than scenarios 1–2. Likewise, the changing of the volcanic activity level from low to high (see [43,50]) affects the hazard level in each hazard zone.

3.5. Evacuation Decision

The evacuation decision made is an important aspect of an agent’s (person’s) behaviour. During the crisis, this defines whether the agent remains or evacuates the risk zone. Several factors influence evacuation decisions, including [140,141,142] risk communication and warnings, perceptions of risk, community and social network influences, disaster likelihood, environmental cues and natural signals. The mechanisms related to individual decision-making during an evacuation, based on the literature review, is provided in Figure 5. This figure provides an overview of the mechanisms of the above factors in their influencing of decisions made and their results, in terms of evacuating or remaining during the volcanic crisis. The following brief reviews provide an overview of how these factors affect the evacuation decision.
  • Risk communications deal with the dissemination of risk warning regarding the probability of disaster occurrence within a community. There are three models of interaction in emergency situations, namely vertical (top-down), peer to peer and horizontally broadcast [143]. Communication among people at risk (horizontal communication) is believed to be an effective way to increase the reach of a broadcast. However, the delivering of risk warnings through social interaction also has the potential result of miscoordination [143]. This can lead to the occurrence of congestion and shadow evacuations [144].
  • Community and social networks also have an important role to play in influencing people in their responses to a disaster. People tend to follow their group’s (community’s) actions in their decisions in such situations [145]. At the most basic community level, they will tend to stand together with their family when deciding to stay or to leave [146]. It was found by Liu et al. [146] that people in crises will be more easily influenced when they interact with a group rather than with individuals. People may therefore decide to leave after seeing crowds of evacuees leaving their homes. Furthermore, social network contact is relatively more important in influencing evacuation decisions than warnings received from mass media [147].
  • Disaster likelihood and/or environmental cues and/or natural signals also influence evacuation decisions [45,147]. Studies of volcano and flood evacuation have identified that natural signals are the most important factors in evacuation decision [147]. Others state that risk perception is associated with environmental cues as well as with the characteristics of the hazard [142].
  • Risk perception is a critical aspect in understanding how individuals decide to evacuate or to stay [140]. Risk perception is also responsible for influencing people in their decisions about when they should evacuate and when they should return home during and after a crisis [148].
The social and physical aspects of influencing factors in evacuation decisions that are presented in Figure 5 are involved in the model developed in this study. Generalisation and simplification were applied to make the modelling feasible. For the risk communication procedure, the model implements top-down as well as horizontal broadcasting as models for communicating the warning. This is to represent real conditions in which not all people directly receive alerts from government sources. The warning can be delivered through several layers of actors [43] as well as being broadcast among the population at risk. For this reason, agents are utilised in connection to other agents to express their social network. Some of them (1 in 100 people) are connected directly to the stakeholder, who represents the authority network delivering the evacuation command. When the volcano is active, it sends signals to all the other agents expressing cues for disaster likelihood. Meanwhile, the agents (people and stakeholders) perceive the risk by classifying the hazard level of their location based on the matrix presented in Section 3.4.

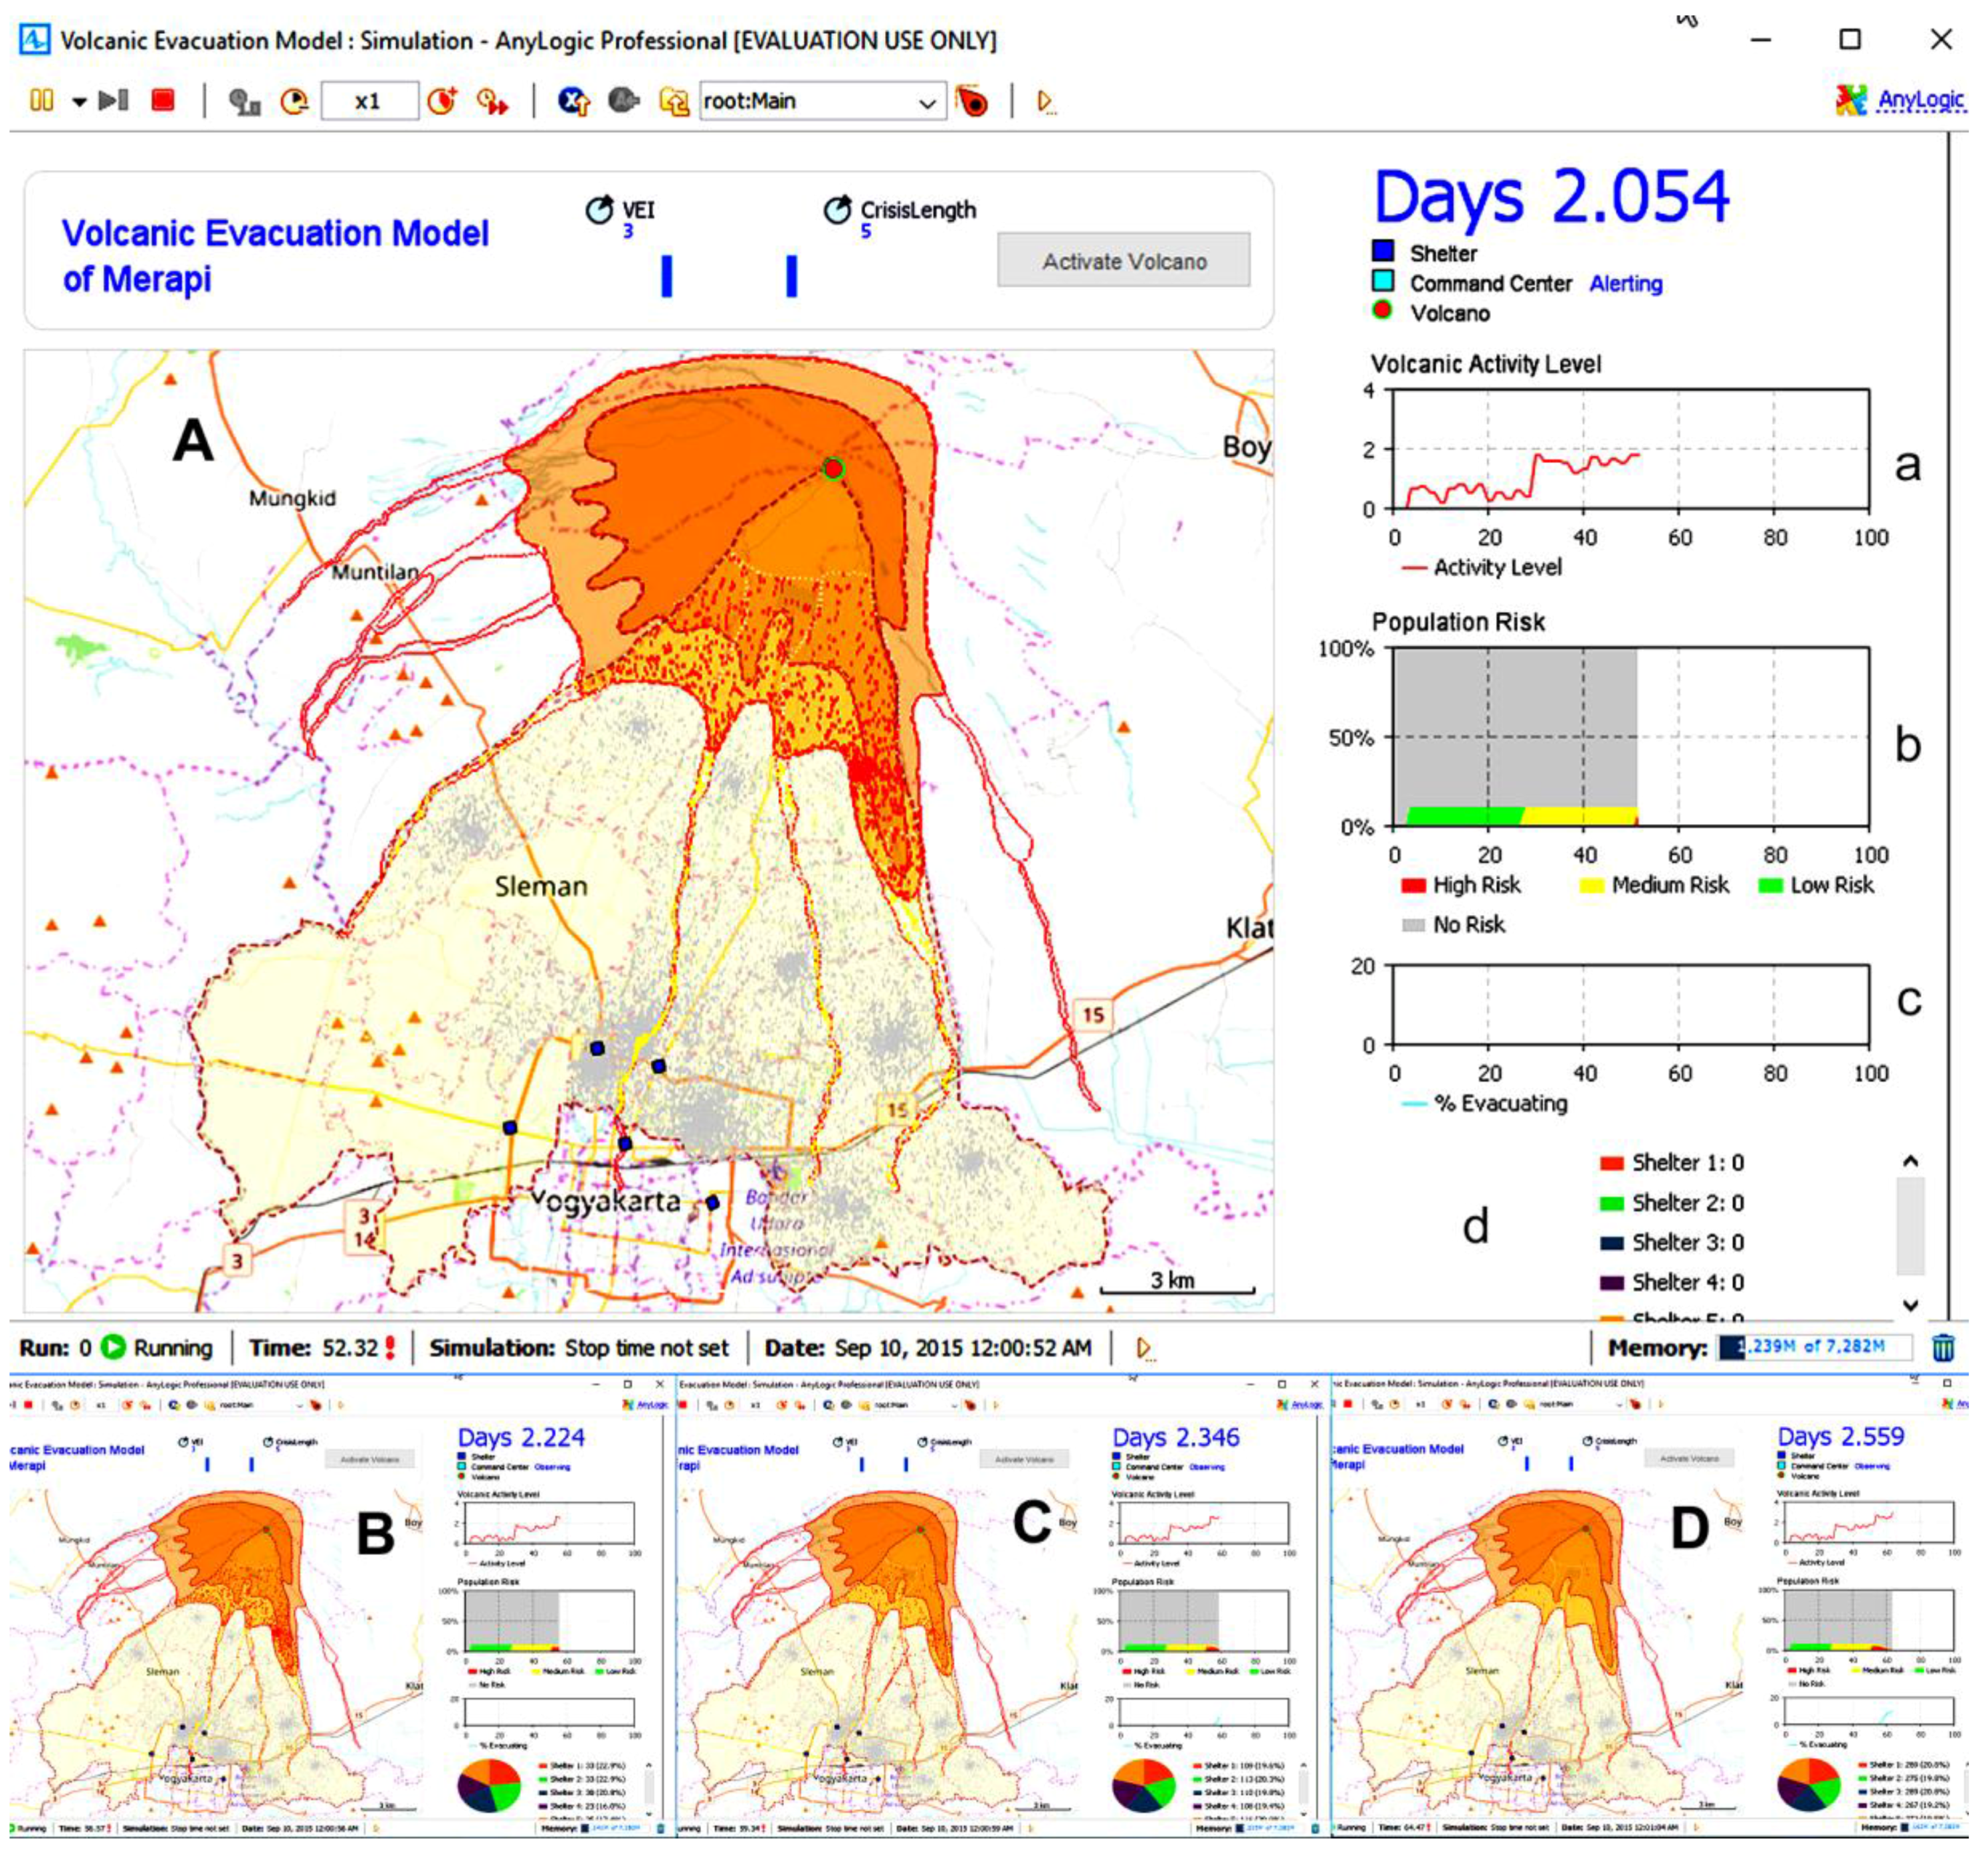
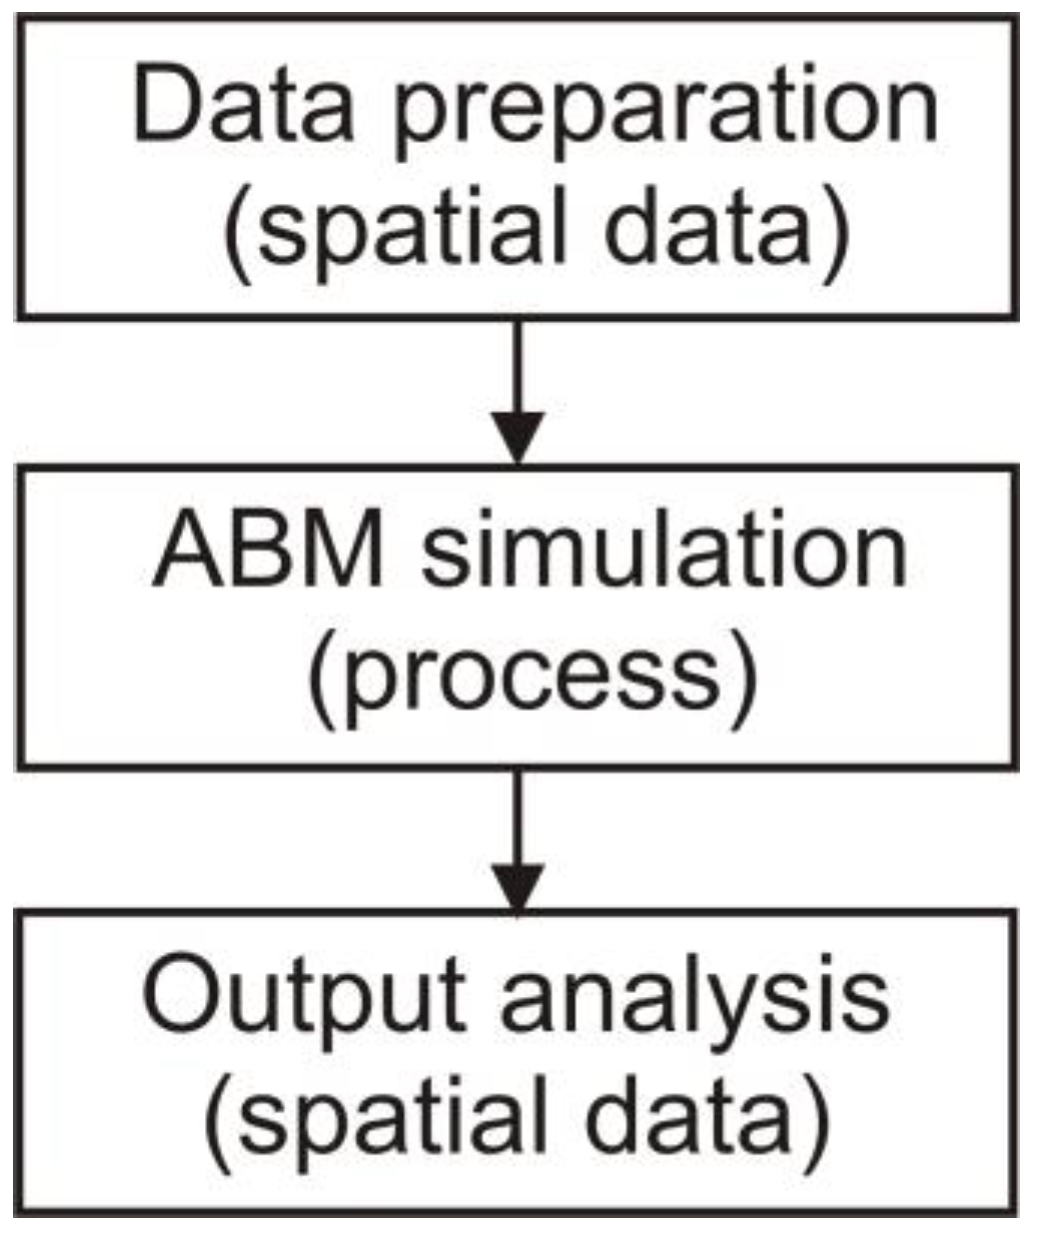
4. Initial Model Design and Implementation

4.1. Initial Design of the Model

Based on the above conceptual framework, the initial model is developed and implemented using AnyLogic. Then, the agents are developed, consisting of the volcano, stakeholders, and people living within a geographically explicit environment and with concurrent properties/attributes and rules (Figure 6) (see the detailed attributes in documentation included as supplementary material). The environment aspect contains a map of the boundary of the district in which the population is distributed, hazard zones to define hazard locations, and evacuation shelters as the evacuation destinations and routes for movements, as described in the previous section. Each agent has their own rules in responding to the occurring crisis, as well as in creating interactions.
The response procedure to the crisis primarily consists of volcanic activity/hazard observation procedure (owned by people and stakeholders), warning/alerting (owned by people and stakeholders), evacuation decision (owned by people) and destination selection and movement (owned by people). There are also interactions between the agents and environment among the agents. The interaction between agents and the environment include updating the hazard level of the hazard zones as the volcanic activity level changes, and human agents (people) retrieving environment data where they are living, such as hazard existence, routes and evacuation shelter location. The interaction among agents consists of top-down interaction and horizontal interaction. Top-down interaction is the alerting procedure from the stakeholder agent to the human agents that consists of the disaster warning, whereas the horizontal interactions occur between human agents in communicating the disaster warning, their departure times and destinations.
Based on the flow chart in Figure 6, rules are developed for each agent in the model. The rules for each agent are expressed as an activity state chart in AnyLogic. This consists of the alerting mechanism, the volcanic-activity-changing mechanism and the evacuation mechanism. Interaction is handled by sending a message to the other agents. Furthermore, an interface is developed that can be used to monitor the simulation spatially or statistically. The screenshot of the developed ABM simulation that can be run from the AnyLogic portal is provided in Figure 7 (see the supplementary materials). The movement and changing of the distribution of population at risk are recorded as spatial data that can be used for further spatial analysis. Examples of the results and the potential analysis from the data are provided in the following sub-section.

4.2. Potential Use of the Model to Support Evacuation Management

Evacuation management requires decision support that can be generated from predominantly spatial information [57]. Information that can be generated from this simulation includes (1) spatial distribution of human exposure that is valuable in analysing volcanic risk to people and providing effective evacuation strategy [149,150,151]; (2) information related to the volcanic disaster outcome in various scenarios, which is valuable in providing adjustable evacuation planning for changing hazard scenarios [121]; (3) information on route density analysis that can be used in managing evacuation routes to avoid high congestion, which may hold up the evacuation processes [72,152,153]; (4) information about variation in evacuation destination preferences provided by the evacuee distribution model that might produce a range of distribution scenarios concerning evacuees, this being information helpful in supporting shelter provision, logistical support, services and commodity-needs planning [154]; and finally, (5) clearance time analysis in various scenarios, which is a vital parameter in defining the effectiveness of evacuation processes and thus providing information essential for the decision maker [155].

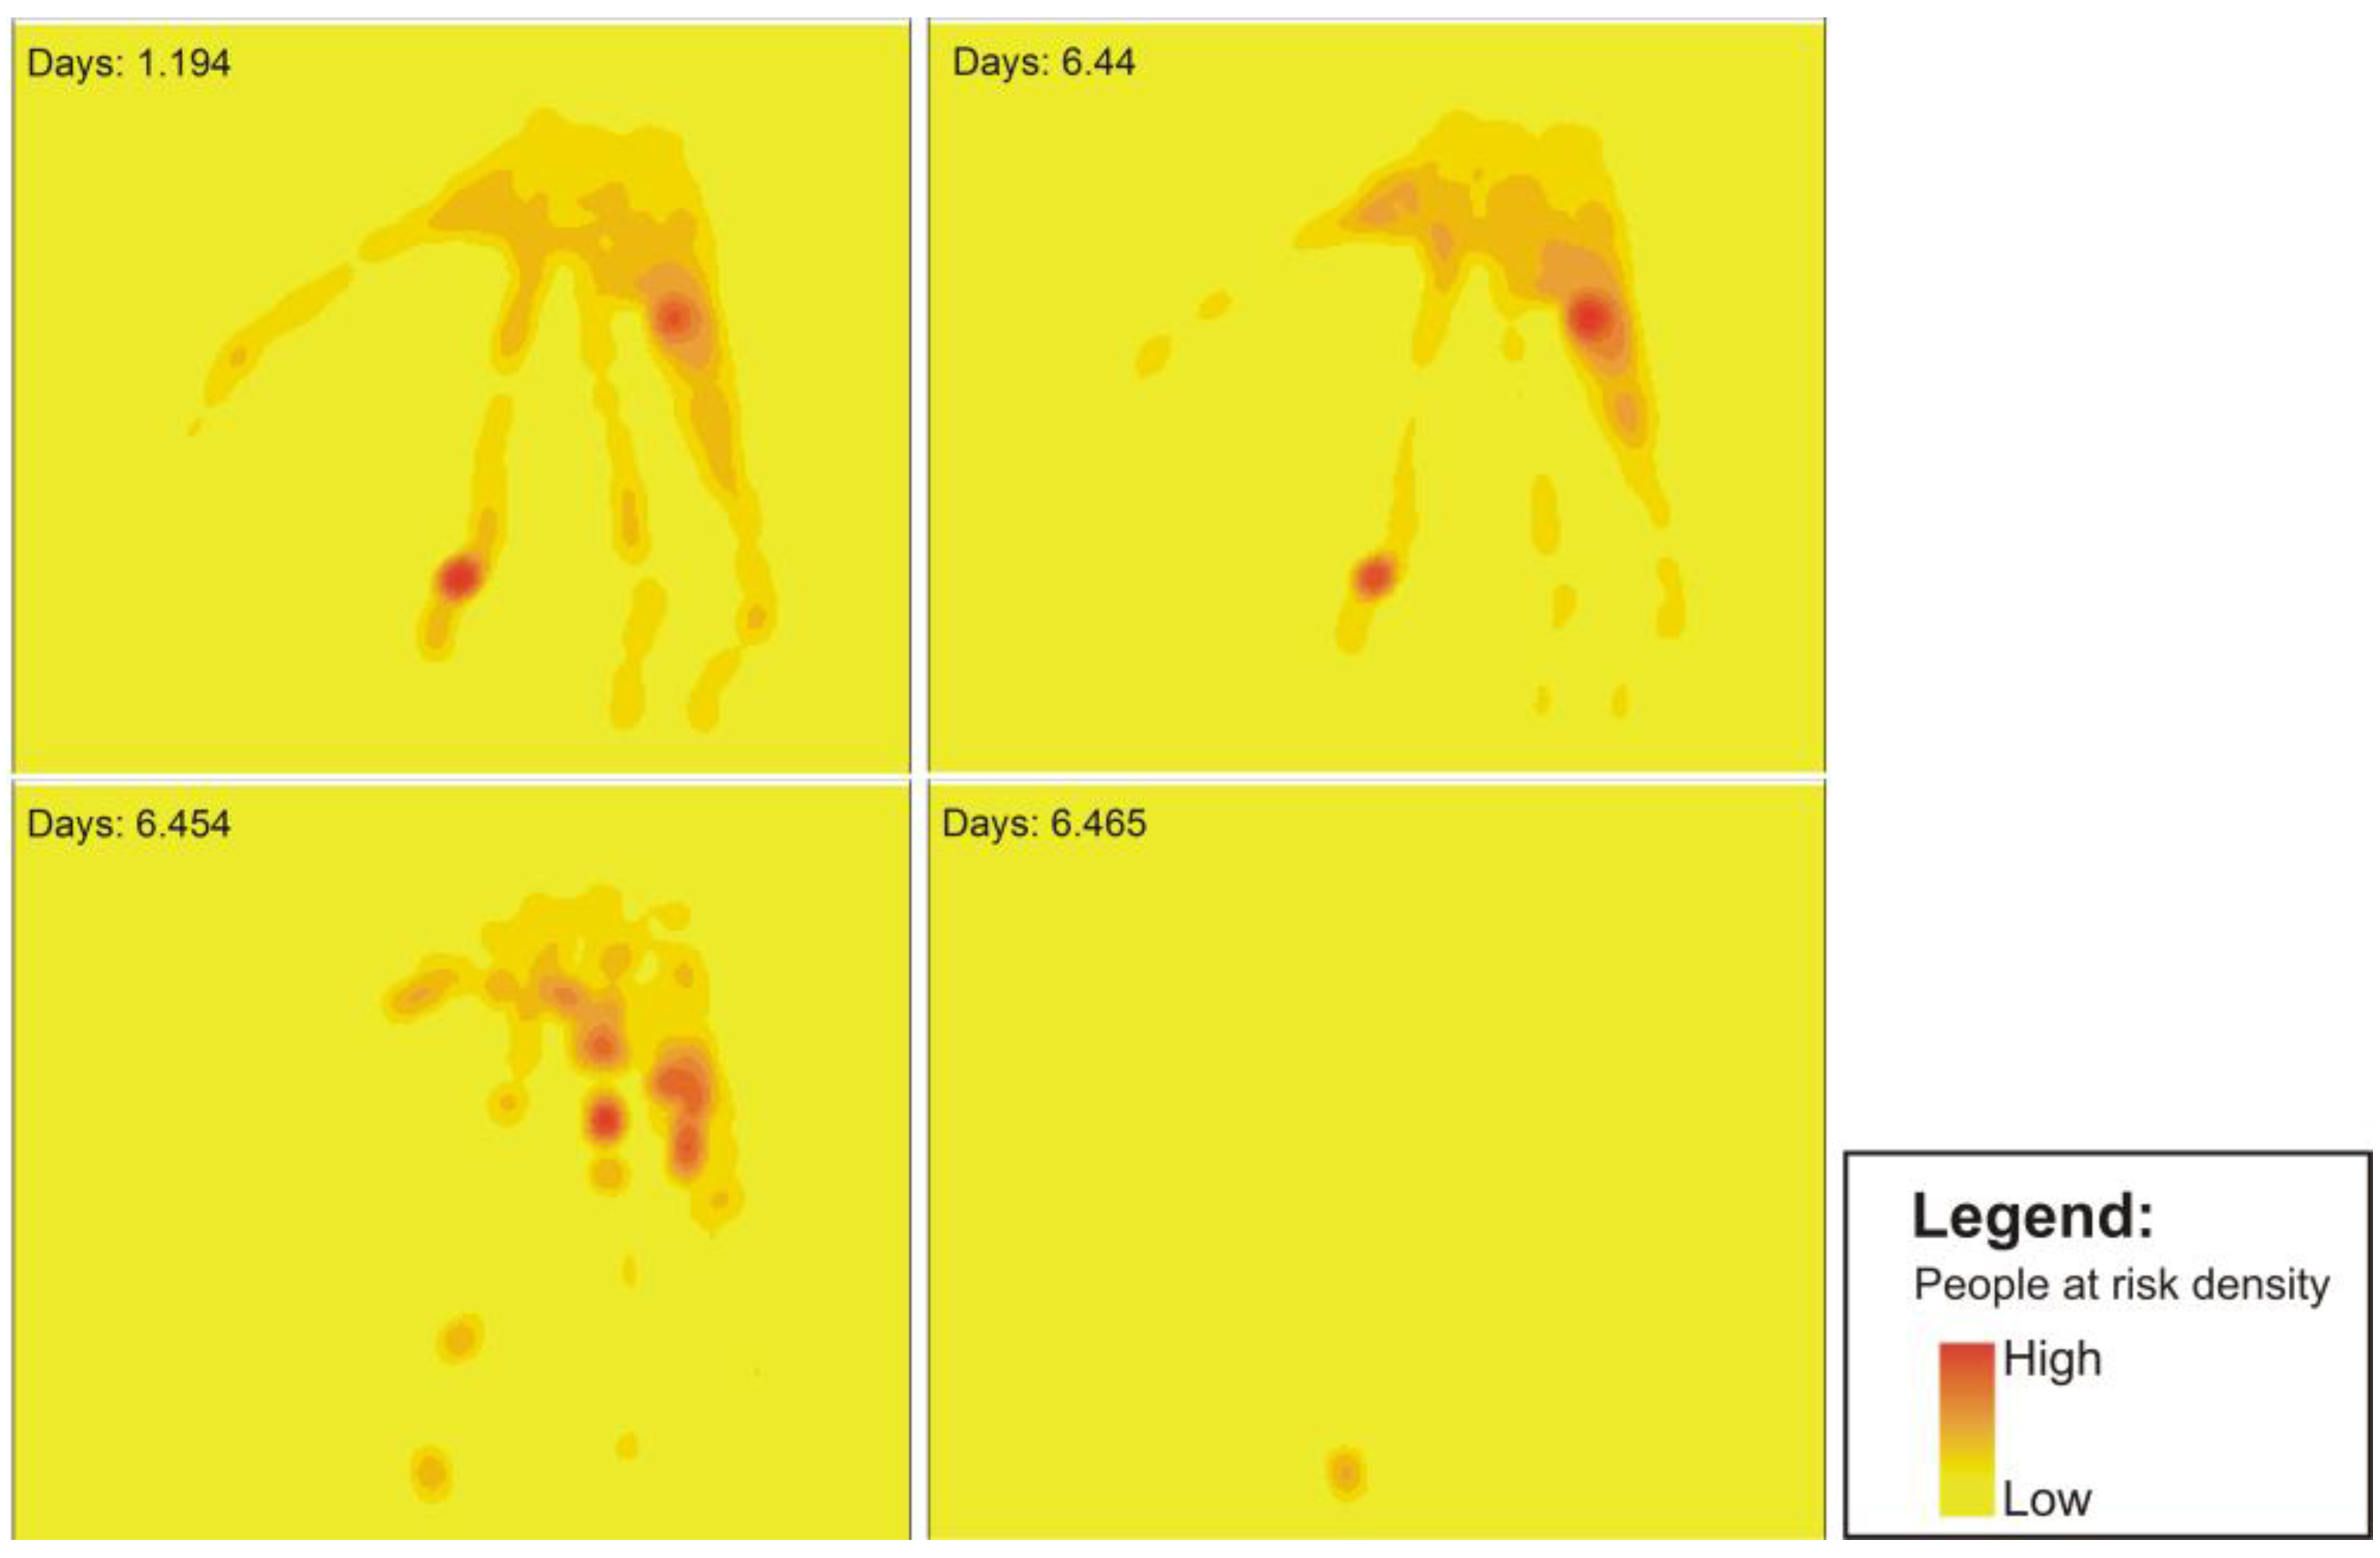
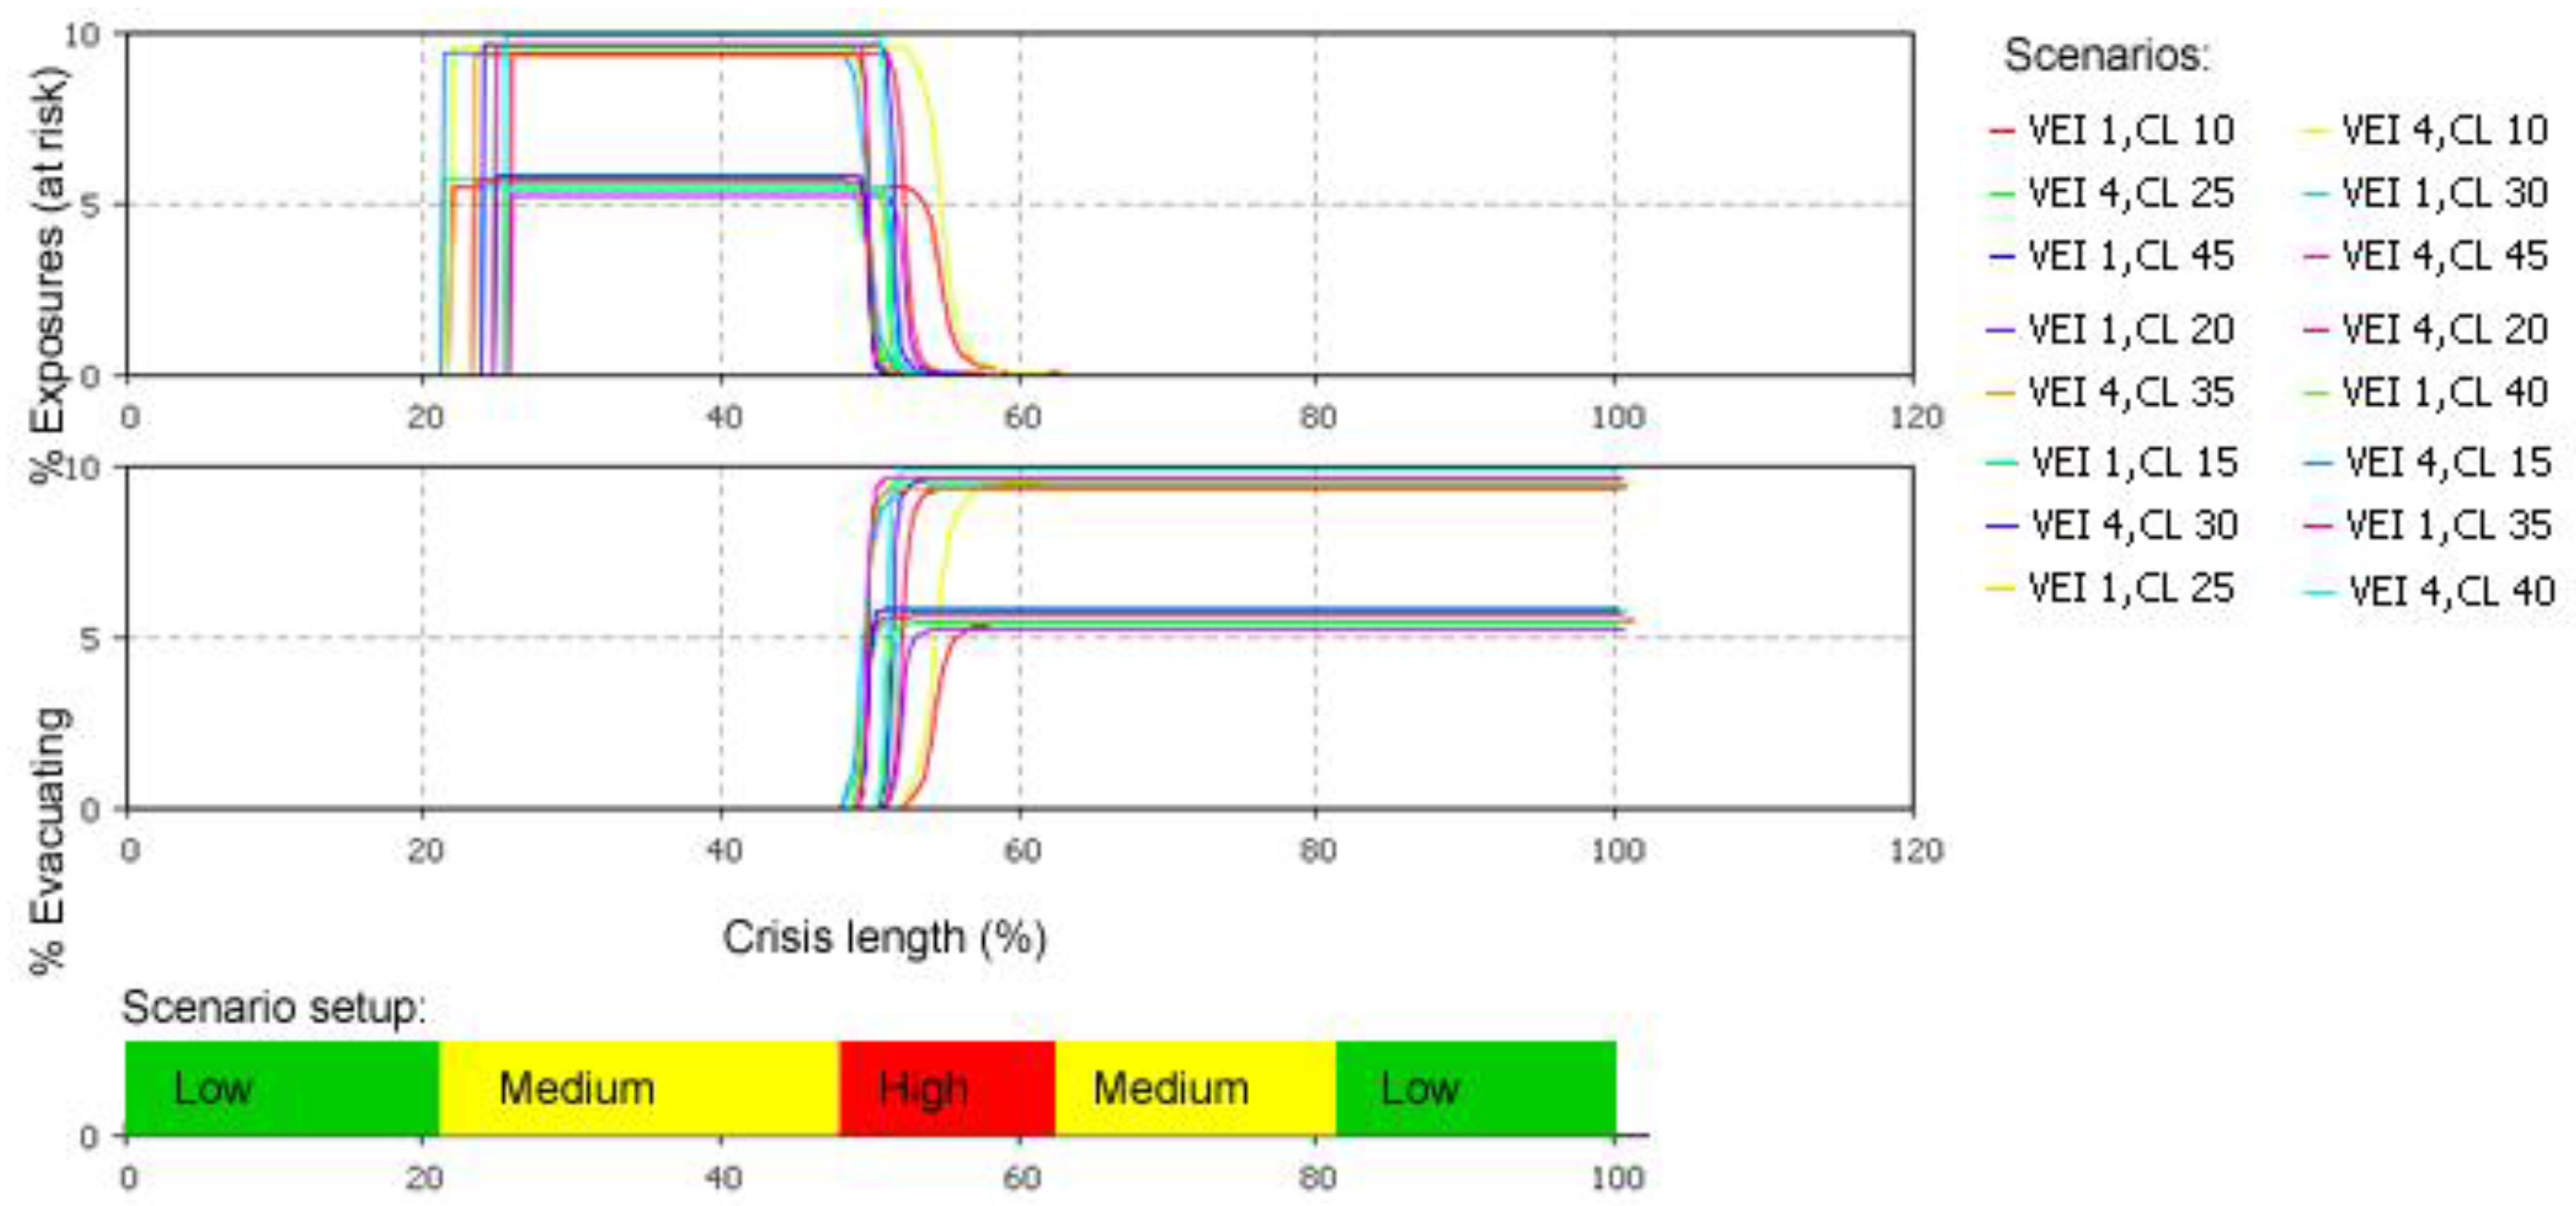
4.2.1. Spatio-Temporal Analysis of the People at Risk Distribution

This model can be used to simulate the changing of human exposure spatio-temporally. The human agents’ mobility can be recorded at every time step. Due to the movement of the evacuation processes, the spatial pattern and density of the population at risk changes over time. This approach allows the changing of spatial patterns of human exposure provided by GIS to be analysed. Figure 8 provides an example of spatial analysis using point density analysis of the human exposure within two different time steps, illustrating this spatial dynamic. The changing of the density from days 1.194 to 6.465 can be observed in this figure.

4.2.2. Analysing the Evacuation Outcome in Different Scenarios

Knowing the possible evacuation outcome in various scenarios is important [121], and so evacuation simulation should accommodate this requirement. The percentage of people at risk and the evacuating population in every time step of the simulation has been captured. The result of this information is the dynamic changing of human exposure (in medium- and high-level hazard zones) and evacuees temporally, as presented in Figure 9. This figure shows the variability of the human exposure percentage between scenarios 1 and 4 of the VEI. This variability results from the differences in the spatial extent of the impact (see Figure 4). Furthermore, the stochasticity of the model is also slightly affected by both the number of human exposures/evacuees and the evacuation rate, as shown by the curve. This stochasticity is shown in the variations in the chart, resulting from the randomness of the population distribution and the varying departure time decisions present in the simulations.

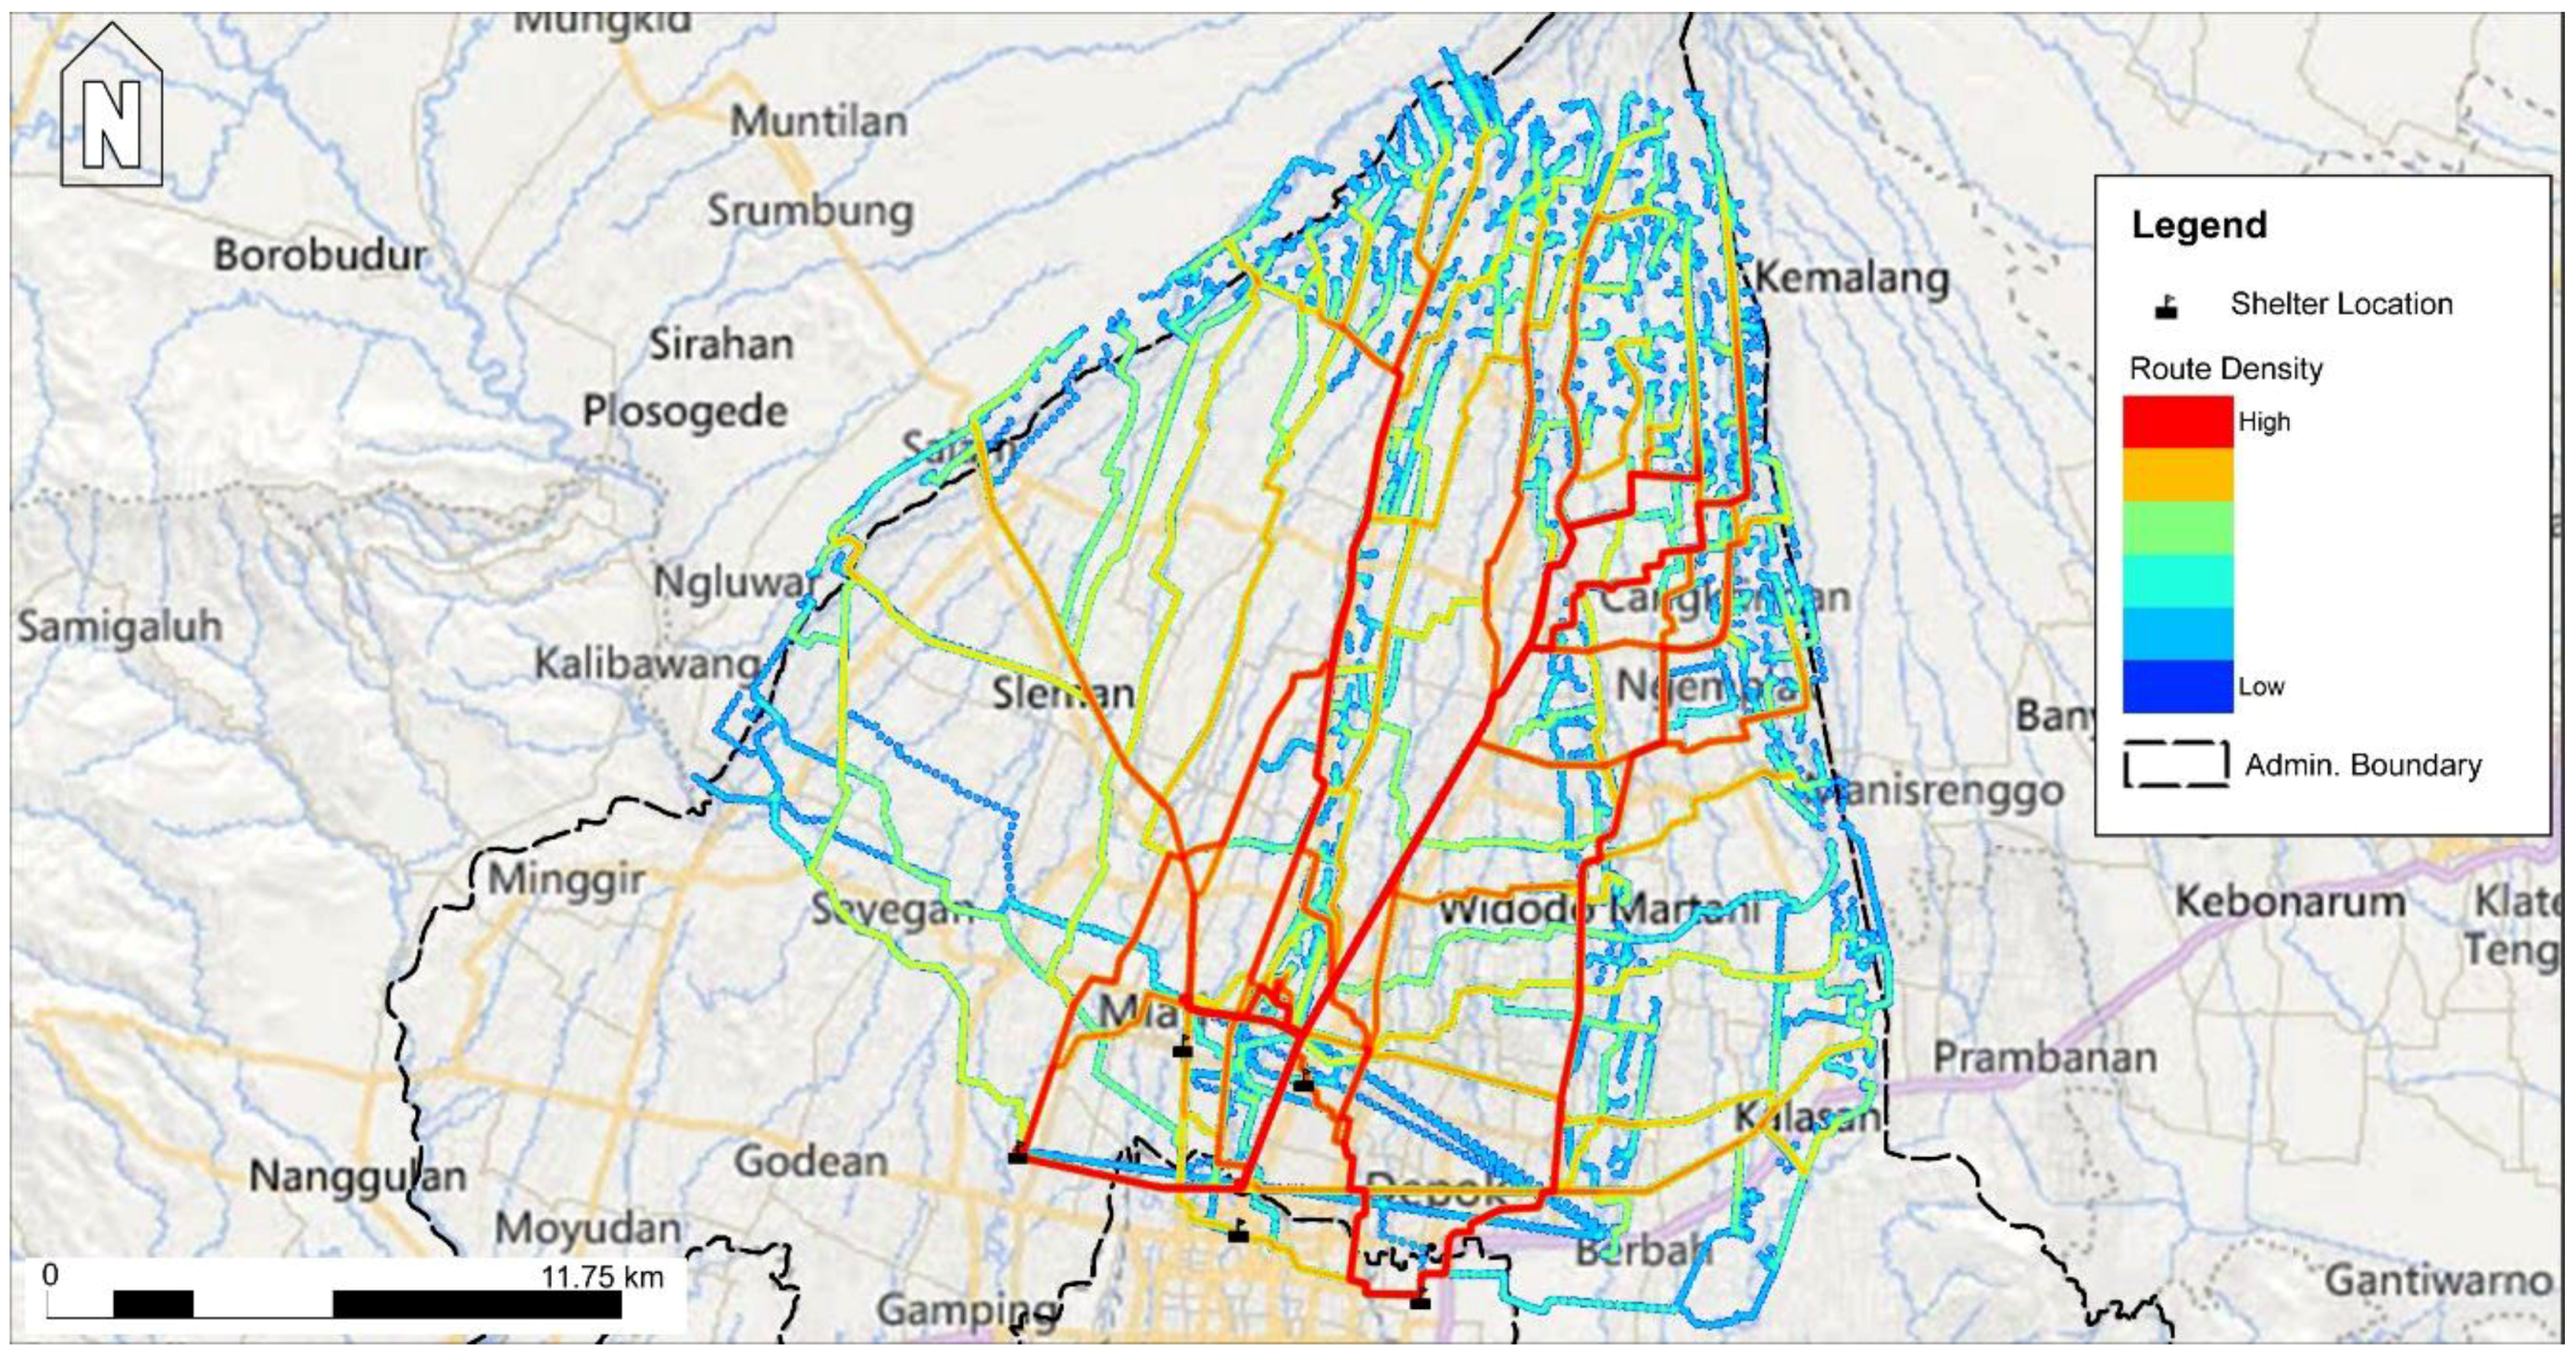
4.2.3. Route Density Analysis

Evacuation routing is another important aspect of evacuation modelling, especially for a large-scale evacuation that potentially produces congestion [72,152,153]. Here, 1000 human agents were selected randomly and their movements tracked consistently. The dataset resulting from this technique was analysed in GIS and produced the route density analysis presented in Figure 10. This figure reveals the relative density of the roads from the residential areas surrounding Merapi volcano to the five evacuation shelters that are placed randomly around the city. From this analysis, several major roads that may be crowded with evacuees are highlighted. Such information can help to support traffic management, in addition to examining potential congestion in relation to the shelters.

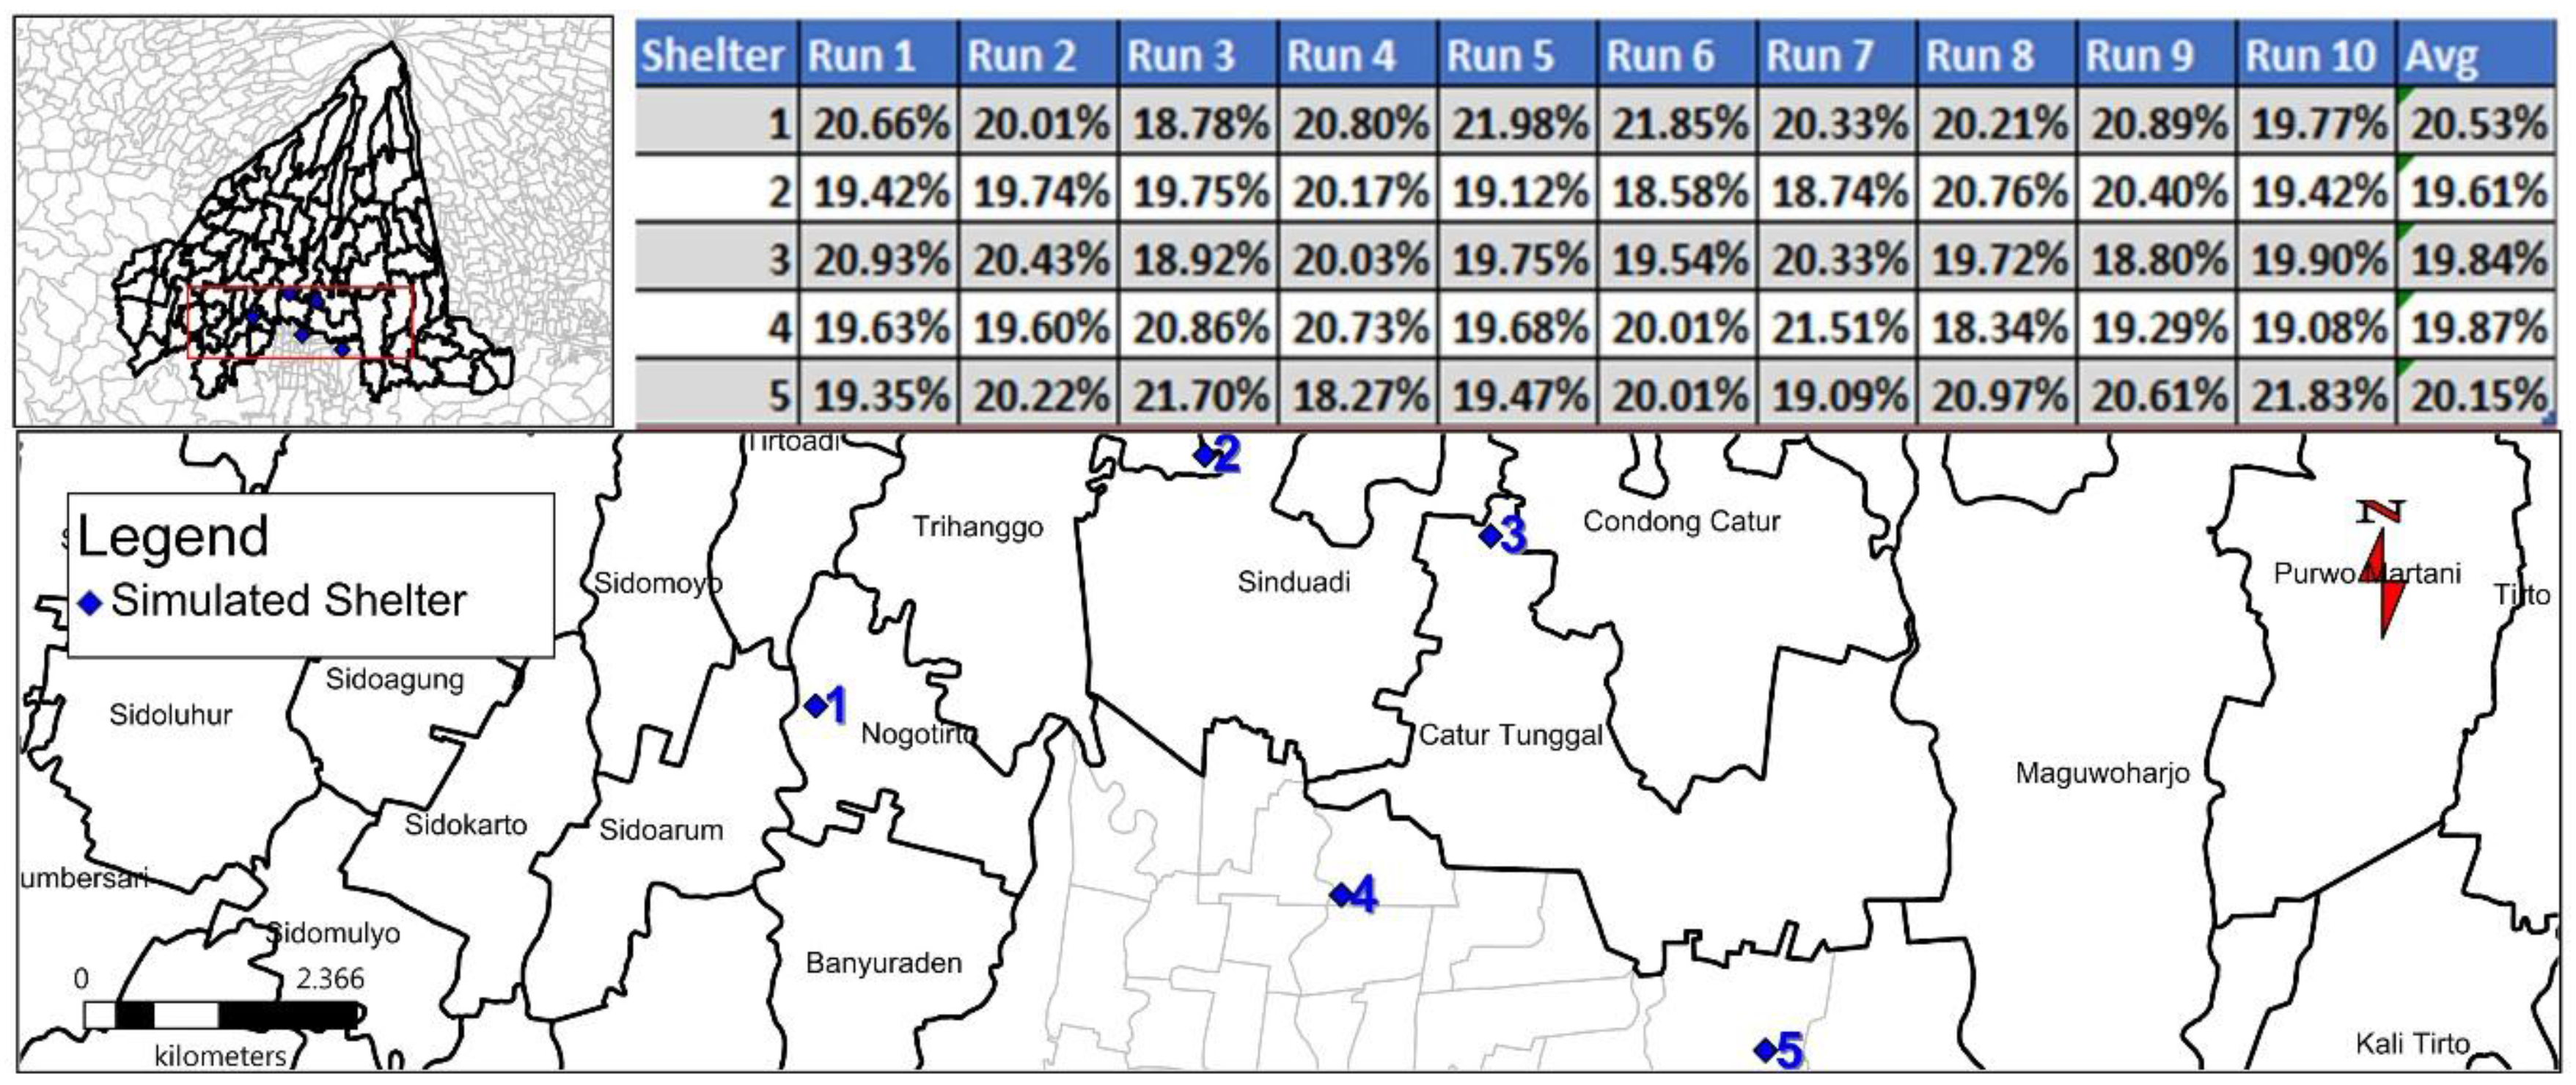
4.2.4. Evacuee Distribution Analysis

Planning the distribution of services, logistical support and commodity needs for evacuees requires supporting data for the distribution of evacuees [154]. This is especially significant in Merapi, where the evacuation shelters are mostly non-permanent and the community surrounding the hazard zone can better plan the voluntarily building of emergency evacuation shelters [7] to simulate the possible distribution of evacuees. In this model, the distribution of evacuees was modelled based on the assumption that people will vary in selecting their destinations. The human agents are randomly categorised into three categories: those who prefer the nearest shelter, those who prefer to ask their relatives (other agents), and those who randomly select their destination. The real destination preference of people remains under investigation and will be included in a future model. The results of the simulation are presented in Figure 11, where the slight variations in the distribution of evacuees can be observed in the different runs.

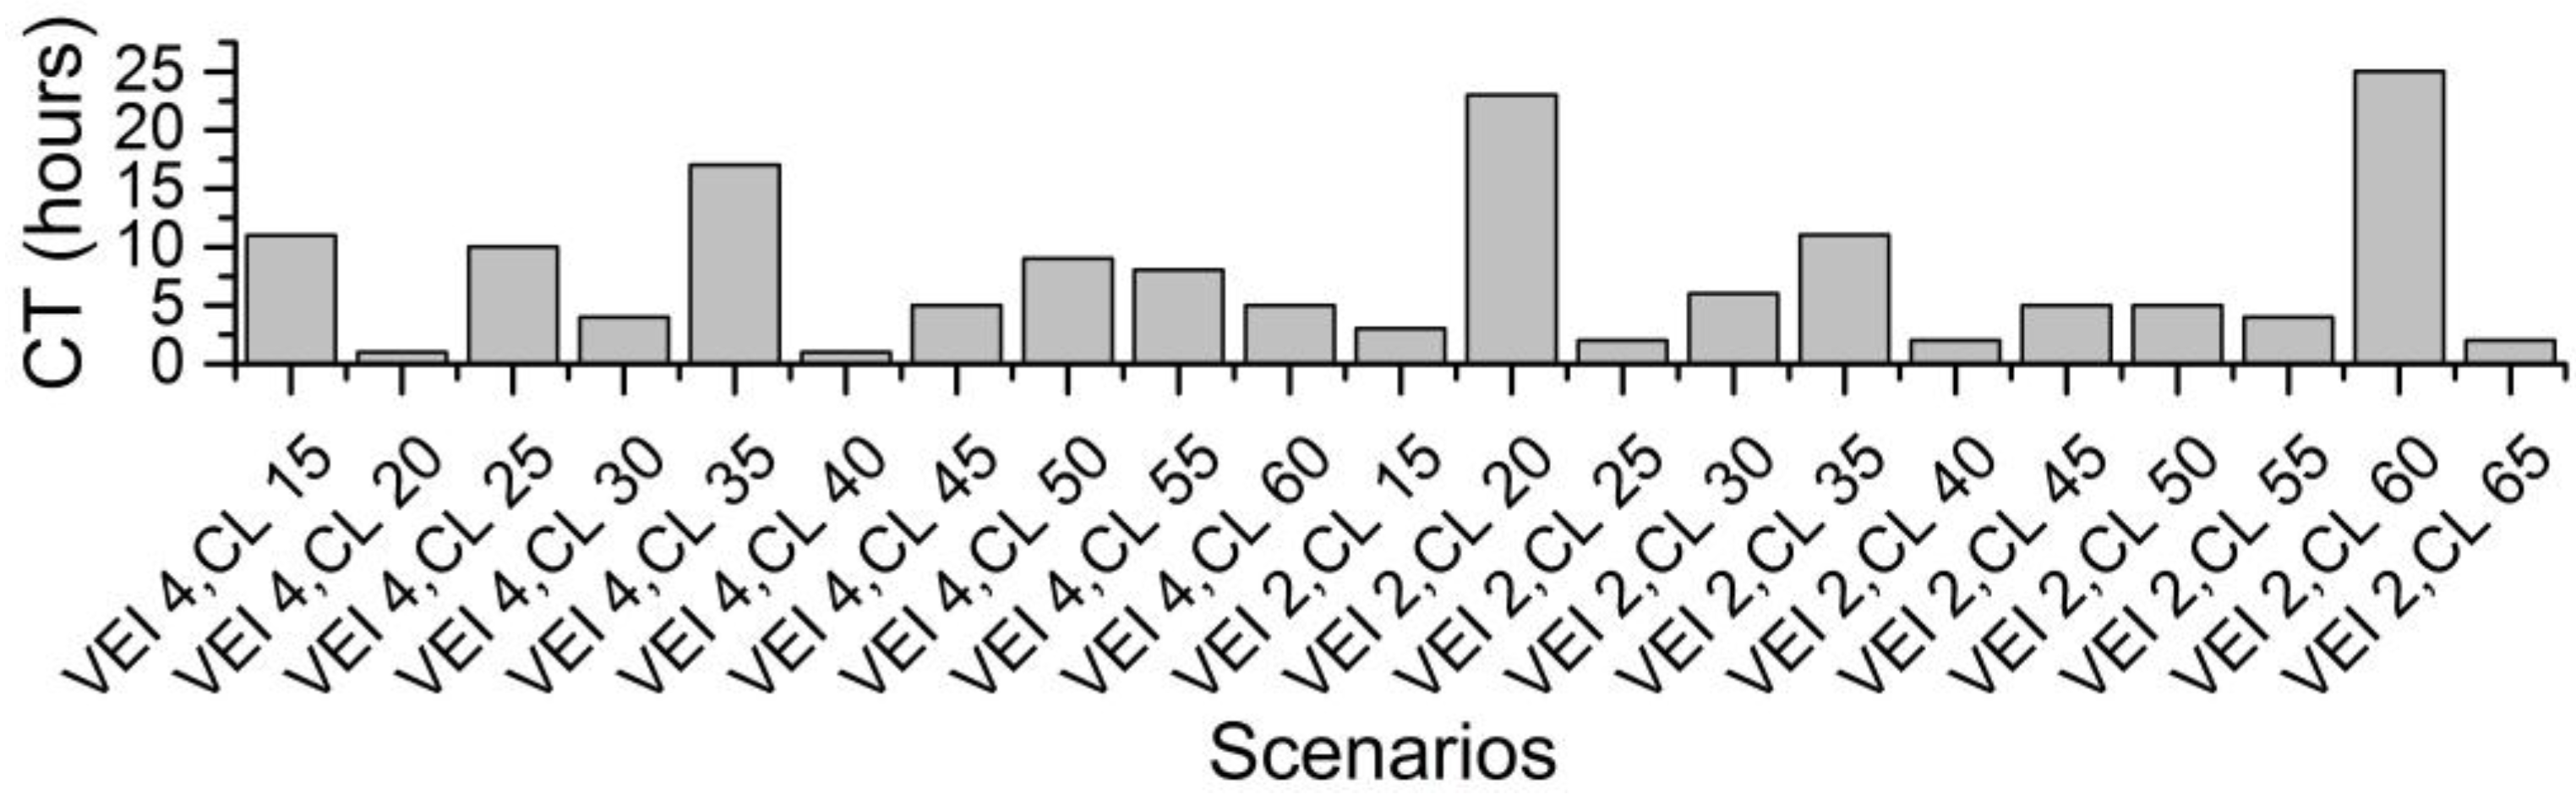
4.2.5. Clearance Time Analysis in Different Scenarios

Clearance time/evacuation time is an important parameter in demonstrating the effectiveness of performance evacuation planning. Therefore, this is used as an indicator in some evacuation simulations (see [60,155,156]). In this model, the clearance time is simulated by calculating the time required between the dissemination of the warning to the clearance of the hazard zones (zero humans at risk). In this initial model, it is assumed that everyone would evacuate. Potential reluctance, as found by [157,158], has not been considered. The human agents are characterised by random preparation time of up to 12 h. Such preparation time is needed in evacuation processes for activities such as protecting property [39], gathering family members [146,159] and evacuating livestock [160]. The result of the varying clearance time in different scenarios is presented in Figure 12. The real variability in departure time (see Figure 13) will be included in future work, with the aim of validating this result.

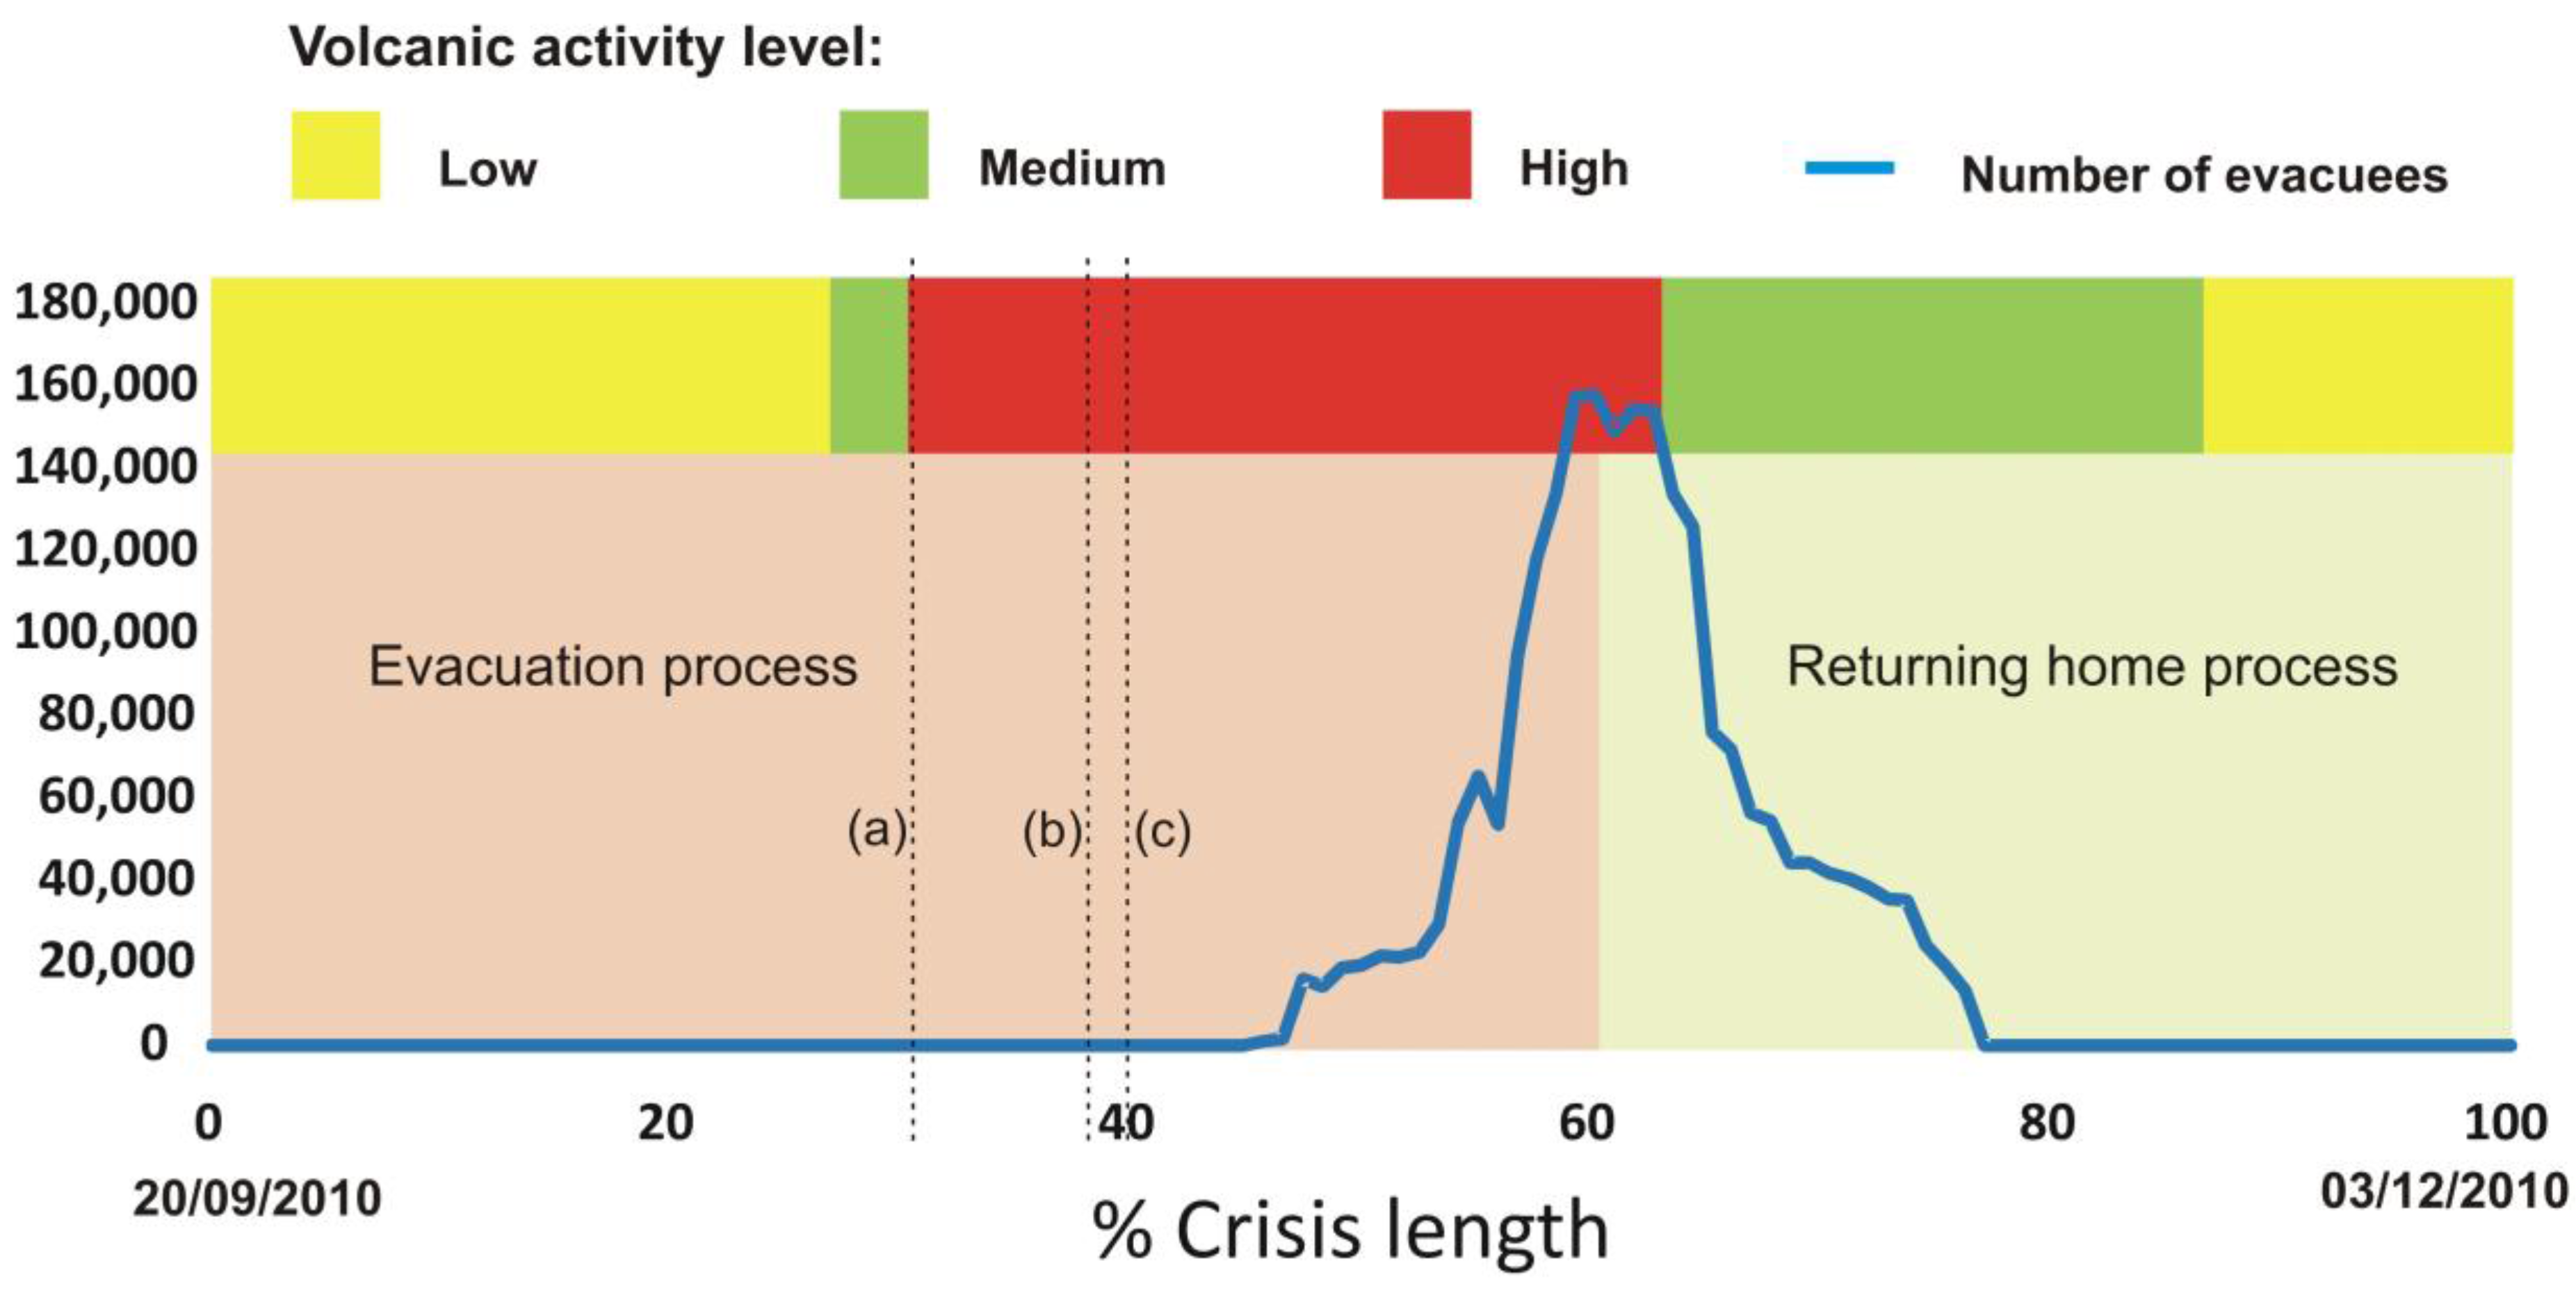
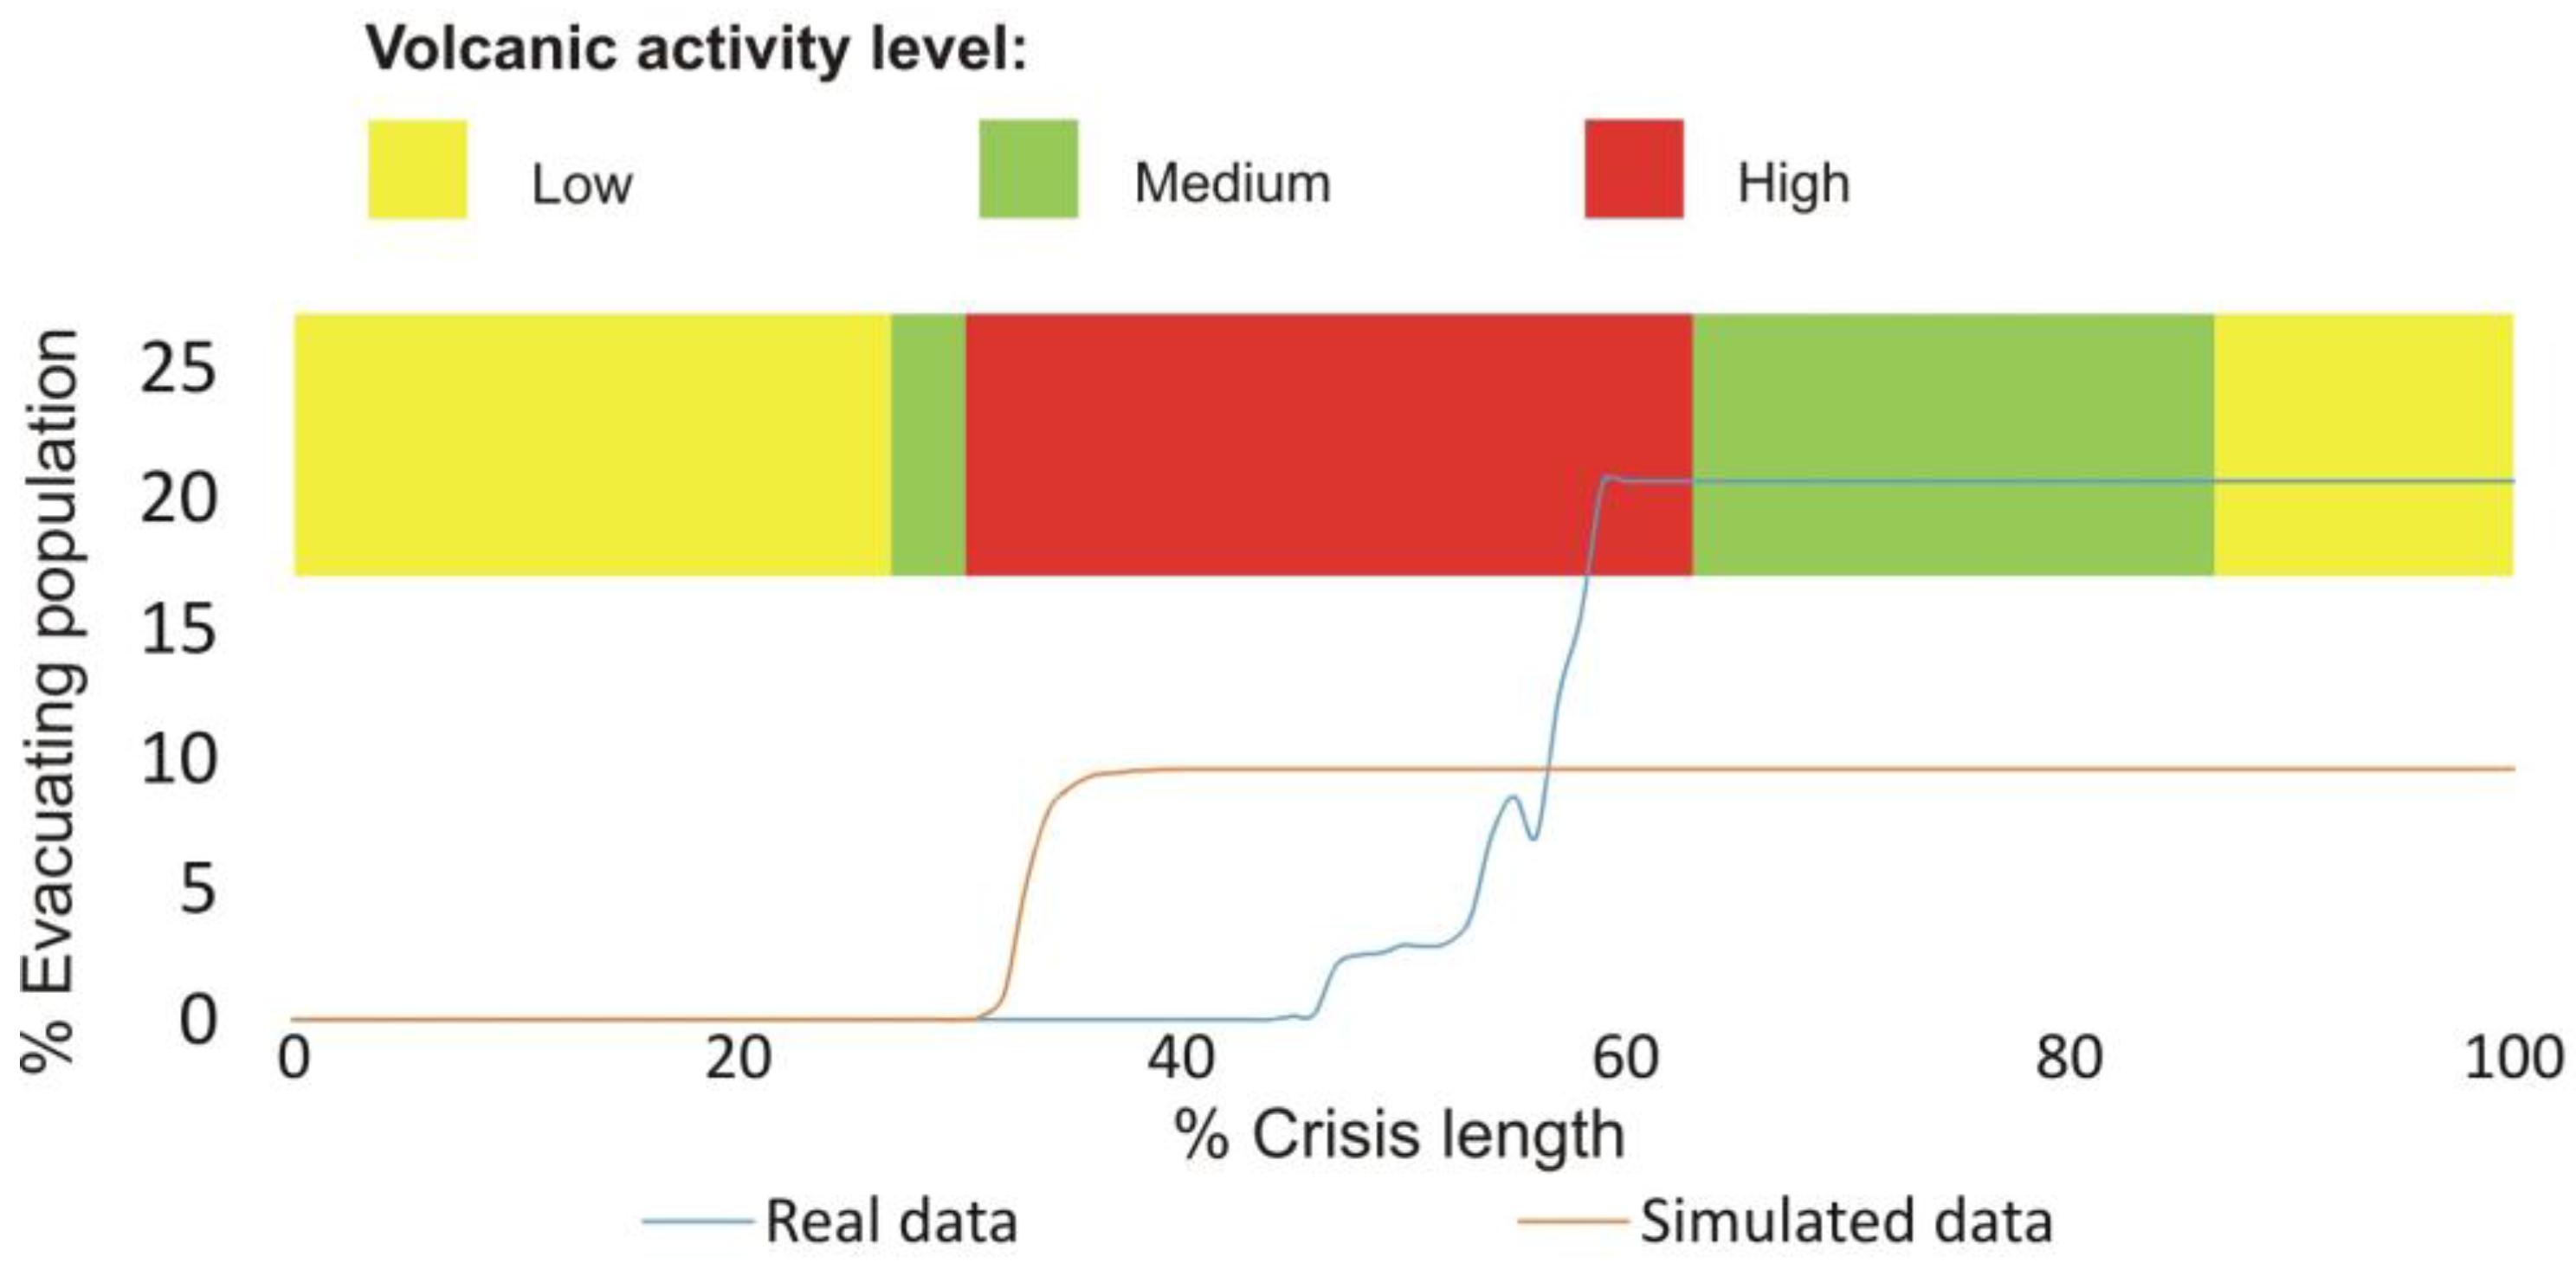
5. Towards a Validation of the Model with Real Data

There are several procedures that can be used to validate the ABM simulation [162]. Dixit presents one of these appropriate procedures for a microscopic evacuation model [163]. This method is applied by making a comparison using a statistical approach between the simulation results and the real data. It is possible to make such a comparison of this model by setting up the spatio-temporal parameters of the disaster with data from a past event and comparing the results with the model. There are several records related to previous Merapi eruptions [2,164], but the last eruption in 2010 is relatively better documented than the others. This documentation includes a chronology of the eruption, evacuation data and the spatial distribution of the evacuees.
The Merapi eruption crisis of 2010 took place over 104 days [4]. The chronological detail of this eruption is provided in [50]. During the crisis, the volcano’s activity level changed over time. To make it more straightforward, this activity can be divided into four classes: normal (excluded from the volcanic crisis period), low, medium and high. Figure 13 presents the activity profile during the 2010 eruption, from rest conditions to the climax of activities to the return to normal conditions. The government issued several alerts during this crisis to anticipate the occurrence of the disaster (Figure 13). Alerts and warnings are part of the social capacity of the community in the event of a disaster. Disaster warnings are a communicative process comprising interrelated activities and procedures [165]. As this is produced from observation of the likelihood of disaster, it commonly includes many uncertainties and limitations and so can result in false warnings and/or an unexpected eruption [166]. The authorities in Merapi produce disaster warnings by means of observing the volcano’s activity, warnings being delivered through several layers of actors [43]. The warning steps, referring to the actual warning procedures in Merapi, are provided by considering the volcanic activities occurring [4]. Figure 13 also provides real data on the 2010 evacuation [161], demonstrating a major increase in the number of evacuees resulting from the evacuation process and a significant decrease resulting from the return-entry process (returning home after the crisis).
The data taken from the 2010 eruption records can be used to set up the evacuation simulation, as undertaken by Mas et al. [67] for the 2004 tsunami. Subsequently, the outcome of the simulation using the real data is statistically and spatially compared. Comparison can be made in three ways. Firstly, comparing the emergence of people who are reluctant to evacuate with the real data that was observed by Lavigne et al. [157] expresses the validity of the evacuation decision. Then, comparison of the accumulation of evacuation movement temporally can express the validity of the departure time as well as the number of people who decide to evacuate. Finally, the appropriateness of the destination decision choices can be evaluated by comparing the distribution of the evacuees within the shelter with the real evacuation distribution data (see [125,126,127,128,129]).
In this study, we used a comparison of the accumulation of evacuation movement temporally to evaluate the departure time and the percentage of evacuating people (Figure 14). This first comparison of the average of simulation results from ten runs with the real data of 2010 can be used for initial evaluation of this model. It shows that there are discrepancies between the simulation results and the real data. Currently, there is limited information about the reasons why people evacuate so late in reality compared to the simulated expectation. In terms of the difference between the percentage of people evacuating in 2010 and the simulation, the unpredicted nature of the 2010 eruption led to the unpreparedness of the stakeholder. The stakeholder used a simple delineation of a radius of 20 km from the summit as a limit for the evacuation order [4]. This might have led to the occurrence of ‘shadow evacuation’. This term describes the behaviour of those who perceive personal danger despite not being in an evacuation zone [140] and as a result decide to evacuate. The occurrence of shadow evacuation can be a result of social interaction and communication, with people deciding to leave after seeing crowds of evacuees leaving their homes. These occurrences potentially stimulate people in low-risk or even safe areas to leave their homes without coordination [167]. This phenomenon can lead to a higher-than-expected number of evacuees [144], which necessitate more evacuation resources.

6. Discussion and Future Work

The importance of developing a volcanic evacuation model is presented in this paper. This is followed by the formulation of a conceptual design and the initial implementation of the model using AnyLogic. This is used to illustrate the potential use of such a model to support the decision-making for evacuation management. Models can also potentially be used to simulate the evacuation processes in various scenarios, such as the integrated GIS and simulation model developed by [10]; however, compared to that model, the implementation of the model in this study, using the new ABM approach and new technology (AnyLogic), provides a superior method of modelling population behaviour and interaction.
This initial model development provides a novel approach for integrating the hazard model into the simulation. The approach is different from the tsunami model [67,88] or the flood model [96], which employ a hydrodynamic numerical process to generate the hazard. The hazard model in this simulation is expressed as zones. This was originated from historical records of eruptions [132] and enabled the hazard zones to be adjusted to the simulation scenarios as well as to the level of volcanic activity. However, several improvements are required to validate this simulation model with the real data from previous evacuations and for further decision-support purposes. There are some aspects of the evacuation processes from the 2006 and 2010 data, for example, that could not be accommodated in this initial model and this will be improved in future work. These aspects include the decision-making of agents, synthetic population development, and the effect of social networks on agent (people) decisions.
Firstly, the evaluation of the decision-making mechanisms of agents needs to be improved. All people at risk were evacuating in the simulation (see Section 4.1), but the real data from the evacuations in 2006 and 2010 reveal that not everyone took part in the evacuation, meaning that some of the population disobeyed the evacuation order and preferred to stay at home during the crisis (see [157,158]). It was observed that, in the 2006 eruption, individuals in some areas of Merapi disobeyed the evacuation order and suffered the consequences of the eruption [43]. The evacuation rate at this time was 0.63 [158]. A similar phenomenon occurred in 2010, in which there were large numbers of reluctant people although the scale of the disaster was larger [157]. Some concepts of decision-making, such as those presented in [168,169], could be used as background to improve this evacuation model in the future.
Secondly, the synthetic population agents need to be improved for family aggregation characteristics. This model applied loosely distributed individual agents, whereas, in the real world, the agents are generally grouped in families. Although statistically and spatially the synthetic population in this model closely matched with the real-world situation, this drawback should be addressed in future work. Within the family/household situation where agents stay together or evacuate together, the outcome might be different from the individual decisions they might have made. The agents might also consider waiting with their families before evacuating [146,159], leading to delays.
Thirdly, the effect of social influence and the probability of successful contact among people on the evacuation decision might be varying and this might affect the outcome. This model ignores these variables and assumed that all agents always successfully make contact with their connections and always follow the commands given. In addition, it is possible for people to ignore the evacuation order altogether [157]. A good example of this is presented by Wise [97], in which studying these variables is expressed as contact success probability and communication success probability; these concepts could be used to improve this model. The decision result as a response from interaction may vary among people, based on their perception of risk, and, because of such interactions, people at risk may socially aggregate in making decisions or/and in the evacuation process.

7. Conclusions

This article was developed based on four points of focus: (1) highlighting the importance of providing evacuation simulation for Merapi; (2) providing and introducing the initial design of ABM for volcanic evacuation simulation; (3) demonstrating the potential uses of the model to support evacuation decisions; and (4) evaluating the initial design and giving insights for further improvements. This paper contributes to the development of ABM for large-scale evacuation simulation by integrating the hazard model, especially regarding volcanic hazard, which is a topic absent from the literature.
The evacuation simulation of a volcanic crisis involving Mount Merapi is important for improving evacuation management as an element of disaster risk reduction. Therefore, we initially developed this model as the basis for further application purposes. The volcanic evacuation model represents the relationships between physical and human agents, consisting of the volcano, stakeholders, the population at risk and the environment. Some potential uses of this model to support decision-making were demonstrated—for instance, analysing route densities, evacuees’ distribution in shelters, and the evacuation outcome in various scenarios. The comparison of some simulation results with real data was provided with the aim of evaluating this model. We found that there are discrepancies between the simulation results and the real data. Based on this, we suggest improvements to several aspects of this model, including the decision-making of agents, synthetic population development and the effect of social networks on agent decisions.

Supplementary Materials

Online Model: http://www.runthemodel.com/models/k-RgpNLa1oojYE1To31FJa/. Simulation Video: https://osf.io/qr65b/. Application documentation: https://osf.io/7yf3p/. Population unit and data: https://osf.io/k6d2n/.

Acknowledgments

This article is part of the PhD project of the main author in the School of Geography, University of Leeds. We gratefully acknowledge the Indonesian Ministry of Research and Higher Education for the funding through the Directorate General of Higher Education (DGHE) scholarship (BPPLN-DIKTI). We also would like to acknowledge Nick Malleson, Alison Heppenstall, and Vern Manville for supporting this research, and the anonymous reviewers for useful feedback.

Author Contributions

J.J. designed the model, performed the simulation and analysed the output, S.C. and D.C. supported developing the concept of the model. J.J. drafted the manuscript, S.C. and D.C. improved the manuscript. All the authors read and approved the final manuscript.

Conflicts of Interest

The authors declare no conflict of interest.

References

  1. Lavigne, F.; Thouret, J.C.; Voight, B.; Suwa, H.; Sumaryono, A. Lahars at Merapi volcano, Central Java: An overview. J. Volcanol. Geotherm. Res. 2000, 100, 423–456. [Google Scholar] [CrossRef]
  2. Voight, B.; Constantine, E.K.; Siswowidjoyo, S.; Torley, R. Historical eruptions of Merapi Volcano, Central Java, Indonesia, 1768–1998. J. Volcanol. Geotherm. Res. 2000, 100, 69–138. [Google Scholar] [CrossRef]
  3. Newhall, C.G.; Bronto, S.; Alloway, B.; Banks, N.G.; Bahar, I.; del Marmol, M.A.; Hadisantono, R.D.; Holcomb, R.T.; McGeehin, J.; Miksic, J.N.; et al. 10,000 Years of explosive eruptions of Merapi Volcano, Central Java: Archaeological and modern implications. J. Volcanol. Geotherm. Res. 2000, 100, 9–50. [Google Scholar] [CrossRef]
  4. Mei, E.T.W.; Lavigne, F.; Picquout, A.; de Bélizal, E.; Brunstein, D.; Grancher, D.; Sartohadi, J.; Cholik, N.; Vidal, C. Lessons learned from the 2010 evacuations at Merapi volcano. J. Volcanol. Geotherm. Res. 2013, 261, 348–365. [Google Scholar] [CrossRef]
  5. Ayuningtyas, D.; Gabriel, L. Respon Masyarakat Terhadap Kebijakan Relokasi Pada Kawasan Rawan Bencana (KRB) (Studi Kasus: Relokasi Desa Glagaharjo); Universitas Gadjah Mada: Yogyakarta, Indonesia, 2013. [Google Scholar]
  6. Nuzulia, Y.; Sudibyakto, S. Kajian Penolakan Relokasi oleh Warga Terdampak Erupsi Merapi Tahun 2010 (Studi Kasus di Dusun Kalitengah lor, DIYdan Dusun Sambungrejo JawaTengah); Universitas Gadjah Mada: Yogyakarta, Indonesia, 2014. [Google Scholar]
  7. Mei, E.T.W.; Lavigne, F.; Picquout, A.; Grancher, D. Crisis Management During the 2010 Eruption of Merapi Volcano. In Proceedings of the Regional Geographic Conference—International Geographical Union, Santiago, Chile; 2011; pp. 15–19. [Google Scholar]
  8. POSKO SET BAKORNAS PBP Penanganan Gunung Merapi: Laporan Posko, 16 June 2006. 2006. Available online: http://118.97.53.73/userfiles/file/buletin/Buletin%20Merapi16.pdf (accessed on 19 March 2015).
  9. Handayani, D.; Herliansyah, M.K.; Hartono, B.; Sopha, B.M. Community behavior during the evacuation of Mount Merapi eruption disaster. In Proceedings of the 2016 IEEE International Conference on Industrial Engineering and Engineering Management (IEEM), Bali, Indonesia, 4–7 December 2016; pp. 276–280. [Google Scholar]
  10. De Silva, F.N.; Eglese, R.W. Integrating simulation modelling and GIS: Spatial decision support systems for evacuation planning. J. Oper. Res. Soc. 2000, 51, 423–430. [Google Scholar] [CrossRef]
  11. Aman, A.; Bakhtiar, T.; Hanum, F.; Supriyo, P.T. OR/MS Applications in Mt. Merapi Disaster Management. J. Math. Stat. 2012, 8, 264–273. [Google Scholar]
  12. Bachri, S.; Stöetter, J.; Sartohadi, J.; Setiawan, M.A. Evaluation of volcanic risk management in Merapi and Bromo Volcanoes. In Proceedings of the EGU General Assembly Conference Abstracts, Vienna, Austria, 22–27 April 2012; Volume 14, p. 13111. [Google Scholar]
  13. Bakkour, D.; Enjolras, G.; Kast, R.; Thouret, J. The adaptive governance of natural disasters: Insights from the 2010 Mount Merapi Eruption in Indonesia. Available online: http://www.webcitation.org/6vD8LzkFg (accessed on 24 November 2017).
  14. Ismayasti, R.; Bakema, M.; Sagala, S. Integrating Disaster Management and Sustainable Development: Finding the Role of NGOs in the Post-Eruption Merapi. 2010. Available online: http://perpustakaan.bappenas.go.id/lontar/file?file=digital/141678-[_TOC_]-Konten%2061-73.pdf (accessed on 26 November 2017).
  15. Surono, S.; Jousset, P.; Pallister, J. Crisis Management during the centennial 2010 eruption at Merapi volcano, Central Java, Indonesia. In Proceedings of the 2011 International Union of Geodesy and Geophysics (IUGG) General Assembly, Melbourne, Australia, 28 June–7 July 2011. [Google Scholar]
  16. Jumadi, J.; Suharyadi, R.; Tuladhar, A.M. Web-Based Spatial Information System to Support Collaborative Lahars Disaster Management. Indones. J. Geogr. 2012, 44, 96–144. [Google Scholar]
  17. Putra, T.Y.D.; Trias, A.; de Vries, W. A Local Spatial Data Infrastructure to Support the Merapi Volcanic Risk Management: A Case Study at Sleman Regency, Indonesia. Indones. J. Geogr. 2011, 43, 25–48. [Google Scholar]
  18. Schneider, D.J.; Pallister, J.S.; Griswold, J.; Wessels, R.L. Use of satellite remote sensing to support crisis response to the 2010 eruption of Merapi Volcano, Indonesia. AGU Fall Meet. Abstr. 2011, 52, 02. [Google Scholar]
  19. Setijadji, L.D. Towards an Effective Decision Support System for Merapi Volcano (Yogyakarta Region, Indonesia). In Proceedings of the AGU Fall Meeting Abstracts, American Geophysical Union, San Francisco, CA, USA, 5–9 December 2011; Volume 1, p. 1271. [Google Scholar]
  20. Andreastuti, S.D.; Alloway, B.V.; Smith, I.E.M. A detailed tephrostratigraphic framework at Merapi Volcano, Central Java, Indonesia: Implications for eruption predictions and hazard assessment. J. Volcanol. Geotherm. Res. 2000, 100, 51–67. [Google Scholar] [CrossRef]
  21. Charbonnier, S.J.; Gertisser, R. Deposit architecture and dynamics of the 2006 block-and-ash flows of Merapi Volcano, Java, Indonesia. Sedimentology 2011, 58, 1573–1612. [Google Scholar] [CrossRef]
  22. Charbonnier, S.J.; Gertisser, R. Field observations and surface characteristics of pristine block-and-ash flow deposits from the 2006 eruption of Merapi Volcano, Java, Indonesia. J. Volcanol. Geotherm. Res. 2008, 177, 971–982. [Google Scholar] [CrossRef]
  23. Gertisser, R.; Cassidy, N.J.; Charbonnier, S.J.; Nuzzo, L.; Preece, K. Overbank block-and-ash flow deposits and the impact of valley-derived, unconfined flows on populated areas at Merapi volcano, Java, Indonesia. Nat. Hazards 2012, 60, 623–648. [Google Scholar] [CrossRef]
  24. Gomez, C.; Lavigne, F.; Lespinasse, N.; Hadmoko, D.S.; Wassmer, P. Longitudinal structure of pyroclastic-flow deposits, revealed by GPR survey, at Merapi Volcano, Java, Indonesia. J. Volcanol. Geotherm. Res. 2008, 176, 439–447. [Google Scholar] [CrossRef]
  25. Charbonnier, S.J.; Gertisser, R. Evaluation of geophysical mass flow models using the 2006 block-and-ash flows of Merapi Volcano, Java, Indonesia: Towards a short-term hazard assessment tool. J. Volcanol. Geotherm. Res. 2012, 231, 87–108. [Google Scholar] [CrossRef]
  26. Darmawan, H.; Wibowo, T.; Suryanto, W.; Setiawan, M. Modeling of pyroclastic flows to predict pyroclastic hazard zone in Merapi volcano after 2010 eruption. In Proceedings of the EGU General Assembly Conference Abstracts, Vienna, Austria, 27 April–2 May 2014; Volume 16, p. 1685. [Google Scholar]
  27. Itoh, H.; Takahama, J.; Takahashi, M.; Miyamoto, K. Hazard estimation of the possible pyroclastic flow disasters using numerical simulation related to the 1994 activity at Merapi Volcano. J. Volcanol. Geotherm. Res. 2000, 100, 503–516. [Google Scholar] [CrossRef]
  28. Miyamoto, K.; Gonda, Y.; Yamashita, S.; Matsuyoshi, H. Hazard estimation of the possible pyroclastic flow disasters using numerical simulation related to the 2010 activity at Merapi Volcano, Indonesia. Available online: https://presentations.copernicus.org/EGU2011-12984_presentation.pdf (accessed on 24 November 2017).
  29. Schwarzkopf, L.M.; Schmincke, H.-U.; Cronin, S.J. A conceptual model for block-and-ash flow basal avalanche transport and deposition, based on deposit architecture of 1998 and 1994 Merapi flows. J. Volcanol. Geotherm. Res. 2005, 139, 117–134. [Google Scholar] [CrossRef]
  30. Takahashi, T.; Tsujimoto, H. A mechanical model for Merapi-type pyroclastic flow. J. Volcanol. Geotherm. Res. 2000, 98, 91–115. [Google Scholar] [CrossRef]
  31. Charbonnier, S.J.; Germa, A.; Connor, C.B.; Gertisser, R.; Preece, K.; Komorowski, J.-C.; Lavigne, F.; Dixon, T.; Connor, L. Evaluation of the impact of the 2010 pyroclastic density currents at Merapi volcano from high-resolution satellite imagery, field investigations and numerical simulations. J. Volcanol. Geotherm. Res. 2013, 261, 295–315. [Google Scholar] [CrossRef]
  32. Yulianto, F.; Sofan, P.; Khomarudin, M.R.; Haidar, M. Extracting the damaging effects of the 2010 eruption of Merapi volcano in Central Java, Indonesia. Nat. Hazards 2013, 66, 229–247. [Google Scholar] [CrossRef]
  33. Ratdomopurbo, A.; Poupinet, G. An overview of the seismicity of Merapi volcano (Java, Indonesia), 1983–1994. J. Volcanol. Geotherm. Res. 2000, 100, 193–214. [Google Scholar] [CrossRef]
  34. Ratdomopurbo, A.; Poupinet, G. Monitoring a temporal change of seismic velocity in a volcano: Application to the 1992 eruption of Mt. Merapi (Indonesia). Geophys. Res. Lett. 1995, 22, 775–778. [Google Scholar] [CrossRef]
  35. Beauducel, F.; Cornet, F.H.; Suhanto, E.; Duquesnoy, T.; Kasser, M. Constraints on magma flux from displacements data at Merapi volcano, Java, Indonesia. J. Geophys. Res. 2000, 105, 8193–8203. [Google Scholar] [CrossRef]
  36. Pallister, J.S.; Schneider, D.J.; Griswold, J.P.; Keeler, R.H.; Burton, W.C.; Noyles, C.; Newhall, C.G.; Ratdomopurbo, A. Merapi 2010 eruption—Chronology and extrusion rates monitored with satellite radar and used in eruption forecasting. J. Volcanol. Geotherm. Res. 2013, 261, 144–152. [Google Scholar] [CrossRef]
  37. Voight, B.; Young, K.D.; Hidayat, D.; Purbawinata, M.A.; Ratdomopurbo, A.; Sayudi, D.S.; LaHusen, R.; Marso, J.; Murray, T.L.; Dejean, M. Deformation and seismic precursors to dome-collapse and fountain-collapse nuées ardentes at Merapi Volcano, Java, Indonesia, 1994–1998. J. Volcanol. Geotherm. Res. 2000, 100, 261–287. [Google Scholar] [CrossRef]
  38. Christia, M. Experiences of People Affected Merapi Eruption in 2010: A Qualitative Study Conducted in Krinjing Village Indonesia. Master’s Thesis, University of Oslo, Oslo, Norway, 2012. [Google Scholar]
  39. Donovan, K. Cultural Responses to Volcanic Hazards on Mt Merapi, Indonesia; University of Plymouth: Plymouth, UK, 2010. [Google Scholar]
  40. Donovan, K.; Suryanto, A.; Utami, P. Mapping cultural vulnerability in volcanic regions: The practical application of social volcanology at Mt Merapi, Indonesia. Environ. Hazards 2012, 11, 303–323. [Google Scholar] [CrossRef]
  41. Dove, M.R. Perception of volcanic eruption as agent of change on Merapi volcano, Central Java. J. Volcanol. Geotherm. Res. 2008, 172, 329–337. [Google Scholar] [CrossRef]
  42. Lavigne, F.; De Coster, B.; Juvin, N.; Flohic, F.; Gaillard, J.-C.; Texier, P.; Morin, J.; Sartohadi, J. People’s behaviour in the face of volcanic hazards: Perspectives from Javanese communities, Indonesia. J. Volcanol. Geotherm. Res. 2008, 172, 273–287. [Google Scholar] [CrossRef]
  43. Mei, E.T.W.; Lavigne, F. Influence of the institutional and socio-economic context for responding to disasters: Case study of the 1994 and 2006 eruptions of the Merapi Volcano, Indonesia. Geol. Soc. Lond. Spec. Publ. 2012, 361, 171–186. [Google Scholar] [CrossRef]
  44. Utami, P. Measuring Social Vulnerability in Volcanic Hazards: The Case Study of Merapi Volcano, Indonesia, Earth Sciences. Master’s Thesis, University of Bristol, Bristol, UK, 2008. [Google Scholar]
  45. Sagala, S.; Okada, N. F-2 Statistical analysis of correlation between hazard-related factors and households’ evacuation decisions in Mt. Merapi. Proc. Annu. Conf. Inst. Soc. Saf. Sci. 2009, AA12381938, 61–64. [Google Scholar]
  46. Bignami, C.; Ruch, J.; Chini, M.; Neri, M.; Buongiorno, M.F.; Hidayati, S.; Sayudi, D.S. Surono Pyroclastic density current volume estimation after the 2010 Merapi volcano eruption using X-band SAR. J. Volcanol. Geotherm. Res. 2013, 261, 236–243. [Google Scholar] [CrossRef]
  47. Charbonnier, S.; Germa, A.; Connor, C.; Connor, L.; Dixon, T.; Komorowski, J.-C.; Gertisser, R.; Lavigne, F.; Preece, K. The 2010 Pyroclastic Density Currents of Merapi Volcano, Central Java, Indonesia. In Proceedings of the EGU General Assembly Conference Abstracts, Vienna, Austria, 7–12 April 2013; Volume 15, p. 6629. [Google Scholar]
  48. Damby, D.E.; Horwell, C.J.; Baxter, P.J.; Delmelle, P.; Donaldson, K.; Dunster, C.; Fubini, B.; Murphy, F.A.; Nattrass, C.; Sweeney, S.; et al. The respiratory health hazard of tephra from the 2010 Centennial eruption of Merapi with implications for occupational mining of deposits. J. Volcanol. Geotherm. Res. 2013, 261, 376–387. [Google Scholar] [CrossRef] [Green Version]
  49. De Bélizal, E.; Lavigne, F.; Hadmoko, D.S.; Degeai, J.-P.; Dipayana, G.A.; Mutaqin, B.W.; Marfai, M.A.; Coquet, M.; Le Mauff, B.; Robin, A.-K.; et al. Rain-triggered lahars following the 2010 eruption of Merapi volcano, Indonesia: A major risk. J. Volcanol. Geotherm. Res. 2013, 261, 330–347. [Google Scholar] [CrossRef]
  50. Mei, E.T.W.; Lavigne, F. Mass evacuation of the 2010 Merapi eruption. Int. J. Emerg. Manag. 2013, 9, 298–311. [Google Scholar] [CrossRef]
  51. Malleson, N.; See, L.; Evans, A.; Heppenstall, A. Optimising an Agent-Based Model to Explore the Behaviour of Simulated Burglars. In Theories and Simulations of Complex Social Systems; Dabbaghian, V., Mago, V.K., Eds.; Springer: Berlin/Heidelberg, Germany, 2014; Volume 52, pp. 179–204. [Google Scholar]
  52. Srbljinović, A.; Škunca, O. An Introduction to Agent Based Modelling and Simulation of Social Processes. Interdiscip. Descr. Complex Syst. 2003, 1, 1–8. [Google Scholar]
  53. Brown, D.G.; Xie, Y. Spatial agent-based modelling. Int. J. Geogr. Inf. Sci. 2006, 20, 941–943. [Google Scholar] [CrossRef]
  54. Pons, M.; Johnson, P.A.; Rosas, M.; Jover, E. A georeferenced agent-based model to analyze the climate change impacts on ski tourism at a regional scale. Int. J. Geogr. Inf. Sci. 2014, 28, 2474–2494. [Google Scholar] [CrossRef] [Green Version]
  55. Brown, D.G.; Riolo, R.; Robinson, D.T.; North, M.; Rand, W. Spatial process and data models: Toward integration of agent-based models and GIS. J. Geogr. Syst. 2005, 7, 25–47. [Google Scholar] [CrossRef]
  56. Jumadi; Carver, S.; Quincey, D. A conceptual framework of volcanic evacuation simulation of Merapi using agent-based model and GIS. Procedia Soc. Behav. Sci. 2016, 227, 402–409. [Google Scholar] [CrossRef]
  57. Silva, F.N. De Providing spatial decision support for evacuation planning: A challenge in integrating technologies. Disaster Prev. Manag. Bradf. 2001, 10, 11–20. [Google Scholar] [CrossRef]
  58. Yang, L.; Liu, Q.; Yang, S.-H.; Yu, D. Evacuation Planning with Flood Inundation as Inputs. In Proceedings of the ISCRAM 2015 Conference, Kristiansand, Norway, 24–27 May 2015. [Google Scholar]
  59. Marrero, J.M.; García, A.; Llinares, A.; De la Cruz-Reyna, S.; Ramos, S.; Ortiz, R. Virtual tools for volcanic crisis management, and evacuation decision support: Applications to El Chichón volcano (Chiapas, México). Nat. Hazards 2013, 68, 955–980. [Google Scholar] [CrossRef]
  60. Marrero, J.M.; García, A.; Llinares, A.; Rodríguez-Losada, J.A.; Ortiz, R. The Variable Scale Evacuation Model (VSEM): A new tool for simulating massive evacuation processes during volcanic crises. Nat. Hazards Earth Syst. Sci. 2010, 10, 747–760. [Google Scholar] [CrossRef] [Green Version]
  61. Ye, M.; Wang, J.; Huang, J.; Xu, S.; Chen, Z. Methodology and its application for community-scale evacuation planning against earthquake disaster. Nat. Hazards 2011, 61, 881–892. [Google Scholar] [CrossRef]
  62. Yang, B.; Ren, B.; Wu, Y. The Research of Multi-Resolution Modeling and Simulation of the Emergency Evacuation. Procedia Eng. 2012, 29, 3110–3116. [Google Scholar] [CrossRef]
  63. Chen, X.; Meaker, J.W.; Zhan, F.B. Agent-Based Modeling and Analysis of Hurricane Evacuation Procedures for the Florida Keys. Nat. Hazards 2006, 38, 321–338. [Google Scholar] [CrossRef]
  64. Teo, J.S.; Schmöcker, J.-D.; Leon, F.; Li, J.Y.; Ji, J.; Atanasiu, G.; Taniguchi, E. An Agent-based Evacuation Model Considering Field Effects and Government Advice. Transp. Res. Record J. Transp. Res. Board 2015, 2532, 129–140. [Google Scholar] [CrossRef]
  65. Tan, L.; Hu, M.; Lin, H. Agent-based simulation of building evacuation: Combining human behavior with predictable spatial accessibility in a fire emergency. Inf. Sci. 2015, 295, 53–66. [Google Scholar] [CrossRef]
  66. Nagarajan, M. An Operational Research-Based Integrated Approach for Mass Evacuation Planning of a City; Aston University: Birmingham, UK, 2014. [Google Scholar]
  67. Mas, E.; Suppasri, A.; Imamura, F.; Koshimura, S. Agent-based simulation of the 2011 great east Japan earthquake/tsunami evacuation: An integrated model of tsunami inundation and evacuation. J. Nat. Disaster Sci. 2012, 34, 41–57. [Google Scholar] [CrossRef]
  68. Handford, D.; Rogers, A. An agent-based social forces model for driver evacuation behaviours. Prog. Artif. Intell. 2012, 1, 173–181. [Google Scholar] [CrossRef]
  69. Pourrahmani, E.; Delavar, M.R.; Pahlavani, P.; Mostafavi, M.A. Dynamic Evacuation Routing Plan after an Earthquake. Nat. Hazards Rev. 2015, 16, 04015006. [Google Scholar] [CrossRef]
  70. Pillac, V.; Cebrian, M.; Hentenryck, P.V. A column-generation approach for joint mobilization and evacuation planning. Constraints 2015, 20, 285–303. [Google Scholar] [CrossRef]
  71. Zia, K.; Ferscha, A. A Simulation Study of Exit Choice Based on Effective Throughput of an Exit Area in a Multi-exit Evacuation Situation. In Proceedings of the Distributed Simulation and Real Time Applications, Singapore, 25–28 October 2009; pp. 235–238. [Google Scholar]
  72. Dixit, V.V. Hurricane evacuation: Origin, route, and destination. J. Transp. Saf. Secur. 2008, 1, 74–84. [Google Scholar] [CrossRef]
  73. Lo, S.M.; Huang, H.C.; Wang, P.; Yuen, K.K. A game theory based exit selection model for evacuation. Fire Saf. J. 2006, 41, 364–369. [Google Scholar] [CrossRef]
  74. Sadri, A.M.; Murray-Tuite, P.; Gladwin, H.; Gladwin, H. Hurricane Evacuation Routing Strategy from Miami Beach: Choice of Major Bridges. Transp. Res. Record: J. Transp. Res. Board 2015, 2532, 164–173. [Google Scholar] [CrossRef]
  75. Ng, M.; Diaz, R.; Behr, J. Departure time choice behavior for hurricane evacuation planning: The case of the understudied medically fragile population. Transp. Res. Part E Logist. Transp. Rev. 2015, 77, 215–226. [Google Scholar] [CrossRef]
  76. Zou, N.; Yeh, S.-T.; Chang, G.-L.; Marquess, A.; Zezeski, M. Simulation-Based Emergency Evacuation System for Ocean City, Maryland, During Hurricanes. Transp. Res. Rec. J. Transp. Res. Board 2005, 1922, 138–148. [Google Scholar] [CrossRef]
  77. Kohsaka, H. Risk prediction and evacuation-rescue plans for pyroclastic flow using GIS: A case study of the southern slope of Asama Volcano, Japan. Geogr. Rev. Jpn. Ser. A 2000, 73, 483–497. [Google Scholar] [CrossRef]
  78. Brachman, M.L.; Dragicevic, S. A spatially explicit network science model for emergency evacuations in an urban context. Comput. Environ. Urban Syst. 2014, 44, 15–26. [Google Scholar] [CrossRef]
  79. Goerigk, M.; Deghdak, K.; Heßler, P. A comprehensive evacuation planning model and genetic solution algorithm. Transp. Res. Part E Logist. Transp. Rev. 2014, 71, 82–97. [Google Scholar] [CrossRef]
  80. Cheng, G.; Wilmot, C.G.; Baker, E.J. A destination choice model for hurricane evacuation. In Proceedings of the 87th Annual Meeting Transportation Research Board, Washington, DC, USA, 13–17 January 2008; pp. 13–17. [Google Scholar]
  81. Shi, J.; Ren, A.; Chen, C. Agent-based evacuation model of large public buildings under fire conditions. Autom. Constr. 2009, 18, 338–347. [Google Scholar] [CrossRef]
  82. Christensen, K.; Sasaki, Y. Agent-Based Emergency Evacuation Simulation with Individuals with Disabilities in the Population. Available online: http://jasss.soc.surrey.ac.uk/11/3/9.html (accessed on 17 March 2015).
  83. Zhao, H.; Winter, S.; Tomko, M. Integrating Decentralized Indoor Evacuation with Information Depositories in the Field. ISPRS Int. J. Geo-Inf. 2017, 6, 213. [Google Scholar] [CrossRef]
  84. Joo, J.; Kim, N.; Wysk, R.A.; Rothrock, L.; Son, Y.-J.; Oh, Y.; Lee, S. Agent-based simulation of affordance-based human behaviors in emergency evacuation. Simul. Model. Pract. Theory 2013, 32, 99–115. [Google Scholar] [CrossRef]
  85. Adam, C.; Gaudou, B. Modelling Human Behaviours in Disasters from Interviews: Application to Melbourne Bushfires. J. Artif. Soc. Soc. Simul. 2017, 20, 12. [Google Scholar] [CrossRef]
  86. Zhang, B. Agent-Based Discrete-Event Simulation and Optimization of Regional Transportation Evacuation. Ph.D. Thesis, Rensselaer Polytechnic Institute, New York, NY, USA, 2012. [Google Scholar]
  87. Chen, X.; Zhan, F.B. Agent-based modelling and simulation of urban evacuation: Relative effectiveness of simultaneous and staged evacuation strategies. J. Oper. Res. Soc. 2008, 59, 25–33. [Google Scholar] [CrossRef]
  88. Wang, H.; Mostafizi, A.; Cramer, L.A.; Cox, D.; Park, H. An agent-based model of a multimodal near-field tsunami evacuation: Decision-making and life safety. Transp. Res. Part C Emerg. Technol. 2016, 64, 86–100. [Google Scholar] [CrossRef]
  89. Usman, F.; Murakami, K.; Wicaksono, A.D.; Setiawan, E. Application of Agent-Based Model Simulation for Tsunami Evacuation in Pacitan, Indonesia. MATEC Web Conf. 2017, 97, 01064. [Google Scholar] [CrossRef]
  90. Zhang, B.; Chan, W.K.; Ukkusuri, S.V. Agent-based modeling for household level hurricane evacuation. In Proceedings of the 2009 Winter Simulation Conference (WSC), Austin, Texas, 13–16 December 2009; pp. 2778–2784. [Google Scholar]
  91. Yin, W.; Murray-Tuite, P.; Ukkusuri, S.V.; Gladwin, H. An agent-based modeling system for travel demand simulation for hurricane evacuation. Transp. Res. Part C Emerg. Technol. 2014, 42, 44–59. [Google Scholar] [CrossRef]
  92. Ukkusuri, S.V.; Hasan, S.; Luong, B.; Doan, K.; Zhan, X.; Murray-Tuite, P.; Yin, W. A-RESCUE: An Agent based regional evacuation simulator coupled with user enriched behavior. Netw. Spat. Econ. 2017, 17, 197–223. [Google Scholar] [CrossRef]
  93. Bernardini, G.; D’Orazio, M.; Quagliarini, E.; Spalazzi, L. An Agent-based Model for Earthquake Pedestrians’ Evacuation Simulation in Urban Scenarios. Transp. Res. Procedia 2014, 2, 255–263. [Google Scholar] [CrossRef]
  94. Cimellaro, G.P.; Ozzello, F.; Vallero, A.; Mahin, S.; Shao, B. Simulating earthquake evacuation using human behavior models. Earthq. Eng. Struct. Dyn. 2017, 46, 985–1002. [Google Scholar] [CrossRef]
  95. Medina, N.; Sanchez, A.; Vojinovic, Z. The Potential of Agent Based Models for Testing City Evacuation Strategies under a Flood Event. Procedia Eng. 2016, 154, 765–772. [Google Scholar] [CrossRef]
  96. Dawson, R.J.; Peppe, R.; Wang, M. An agent-based model for risk-based flood incident management. Nat. Hazards 2011, 59, 167–189. [Google Scholar] [CrossRef]
  97. Wise, S. Using Social Media Content to Inform Agent-based Models for Humanitarian Crisis Response; George Mason University: Fairfax, VA, USA, 2014. [Google Scholar]
  98. Wang, D.Q.; Gong, Q.G.; Shen, X.F. An Improved Personnel Evacuation Cellular Automata Model Based on the Ant Colony Optimization Algorithm. Appl. Mech. Mater. 2014, 513, 3287–3291. [Google Scholar] [CrossRef]
  99. Yuan, W.; Tan, K.H. An evacuation model using cellular automata. Phys. Stat. Mech. Its Appl. 2007, 384, 549–566. [Google Scholar] [CrossRef]
  100. Uno, K.; Kashiyama, K. Development of simulation system for the disaster evacuation based on multi-agent model using GIS. Tsinghua Sci. Technol. 2008, 13, 348–353. [Google Scholar] [CrossRef]
  101. Chen, X. Agent-based micro-simulation of staged evacuations. Int. J. Adv. Intell. Paradig. 2012, 4, 22. [Google Scholar] [CrossRef]
  102. Hsu, Y.-T.; Peeta, S. An aggregate approach to model evacuee behavior for no-notice evacuation operations. Transportation 2013, 40, 671–696. [Google Scholar] [CrossRef]
  103. Gilbert, G.N. Agent-Based Models; SAGE: London, UK, 2008; ISBN 978-1-4129-4964-4. [Google Scholar]
  104. Gilbert, N.; Troitzsch, K. Simulation for The Social Scientist; McGraw-Hill Education: New York, NY, USA, 2005; ISBN 978-0-335-21600-0. [Google Scholar]
  105. Macal, C.M.; North, M.J. Tutorial on agent-based modeling and simulation. In Proceedings of the 37th conference on Winter simulation, Orlando, FL, USA, 4–7 December 2005; pp. 2–15. [Google Scholar]
  106. Press, O.U. A Dictionary of Computing; Oxford University Press: Oxford, UK, 2004; ISBN 978-0-19-860877-6. [Google Scholar]
  107. Demeritt, D.; Wainwright, J. Models, Modelling, and Geography. In Questioning Geography: Fundamental Debates; Blackwell Publishing: Oxford, UK, 2005; p. 206. [Google Scholar]
  108. Bandyopadhyay, S.; Bhattacharya, R. Discrete and Continuous Simulation: Theory and Practice; CRC Press: Boca Raton, FL, USA, 2014. [Google Scholar]
  109. Heppenstall, A.; Malleson, N.; Crooks, A. “Space, the Final Frontier”: How Good are Agent-Based Models at Simulating Individuals and Space in Cities? Systems 2016, 4, 9. [Google Scholar] [CrossRef]
  110. Hawe, G.I.; Coates, G.; Wilson, D.T.; Crouch, R.S. Agent-based simulation for large-scale emergency response: A survey of usage and implementation. ACM Comput. Surv. CSUR 2012, 45, 8. [Google Scholar] [CrossRef] [Green Version]
  111. Na, H.S.; Banerjee, A. An agent-based discrete event simulation approach for modeling large-scale disaster evacuation network. In Proceedings of the 2014 Winter Simulation Conference, Savannah, GA, USA, 7–10 December 2014; pp. 1516–1526. [Google Scholar]
  112. Van Dam, K.H.; Bustos-Turu, G.; Shah, N. A methodology for simulating synthetic populations for the analysis of socio-technical infrastructures. In Advances in Social Simulation 2015; Springer: Cham, Switzerland, 2017; pp. 429–434. [Google Scholar]
  113. Harland, K.; Heppenstall, A.; Smith, D.; Birkin, M. Creating realistic synthetic populations at varying spatial scales: A comparative critique of population synthesis techniques. J. Artif. Soc. Soc. Simul. 2012, 15, 1–15. [Google Scholar] [CrossRef]
  114. Gilbert, N.; Terna, P. How to build and use agent-based models in social science. Mind Soc. 2000, 1, 57–72. [Google Scholar] [CrossRef]
  115. Macal, C.M.; North, M.J. Tutorial on agent-based modelling and simulation. J. Simul. 2010, 4, 151–162. [Google Scholar] [CrossRef]
  116. Macal, C.; North, M. Tutorial on Agent-Based Modeling and Simulation PART 2: How to Model with Agents. In Proceedings of the 2005 Winter Simulation Conference, Orlando, FL, USA, 4–7 December 2005; pp. 73–83. [Google Scholar]
  117. Sugumaran, R.; DeGroote, J. Spatial Decision Support Systems Principles and Practices; CRC Press: Boca Raton, FL, USA, 2010; ISBN 978-1-4200-6212-0. [Google Scholar]
  118. Kravari, K.; Bassiliades, N. A Survey of Agent Platforms. J. Artif. Soc. Soc. Simul. 2015, 18, 11. [Google Scholar] [CrossRef]
  119. Crooks, A.T.; Castle, C.J. The integration of agent-based modelling and geographical information for geospatial simulation. In Agent-Based Models of Geographical Systems; Springer: London, UK, 2012; pp. 219–251. [Google Scholar]
  120. BPS Kab. Sleman Statistik Daerah Sleman 2015. Available online: http://www.webcitation.org/6vD9mA8gE (accessed on 21 March 2016).
  121. Jumadi; Carver, S.; Quincey, D. ABM and GIS-based multi-scenarios volcanic evacuation modelling of Merapi. In AIP Conference Proceedings; AIP Publishing: New York, NY, USA, 2016; Volume 1730, p. 050005. [Google Scholar]
  122. GEOFABRIK Download OpenStreetMap Data for this Region: Indonesia. Available online: http://www.webcitation.org/6t07rwZox (accessed on 26 August 2017).
  123. Skiena, S. Dijkstra’s algorithm. In Implementing Discrete Mathematics Combination Graph Theory Mathematics Read; MA Addison-Wesley: Boston, MA, USA, 1990; pp. 225–227. [Google Scholar]
  124. Oyola, A.; Romero, D.G.; Vintimilla, B.X. A Dijkstra-Based Algorithm for Selecting the Shortest-Safe Evacuation Routes in Dynamic Environments (SSER). In Proceedings of the International Conference on Industrial, Engineering and Other Applications of Applied Intelligent Systems; Springer: Cham, Switzerland; 2017; pp. 131–135. [Google Scholar]
  125. BNPB Peta Lokasi dan Jumlah Pengungsi Letusan G.Api Merapi di Wilayah Kab. Sleman (15 nov). Available online: http://www.webcitation.org/6piPoQCLs (accessed on 14 April 2017).
  126. BNPB Peta Lokasi dan Jumlah Pengungsi Letusan G.Api Merapi di Wilayah Kab. Bantul (11 nov). Available online: http://www.webcitation.org/6pikQru7D (accessed on 14 April 2017).
  127. BNPB Peta Lokasi dan Jumlah Pengungsi Letusan G.Api Merapi di Wilayah Kota Yogyakarta (15 nov). Available online: http://www.webcitation.org/6pilvuYiE (accessed on 14 April 2017).
  128. BNPB Peta Lokasi dan Jumlah Pengungsi Letusan G.Api Merapi di Wilayah Kab. Kulon Progo (15 nov). Available online: http://www.webcitation.org/6piskXxQF (accessed on 14 April 2017).
  129. Budiyono, A.F. Informasi Posko Pengungsian Merapi DIY (Update 10 November 2010). Available online: http://www.webcitation.org/6pWJmis9R (accessed on 6 April 2017).
  130. Heppenstall, A.J.; Harland, K.; Smith, D.M.; Birkin, M.H. Creating realistic synthetic populations at varying spatial scales: A comparative critique of population synthesis techniques. In Proceedings of the Geocomputation 2011 Conference Proceedings, UCL, London, UK, 20–22 July 2011; pp. 1–8. [Google Scholar]
  131. Huang, Z.; Williamson, P. A Comparison of Synthetic Reconstruction and Combinatorial Optimisation Approaches to the Creation of Small-Area Microdata; University of Liverpool: Liverpool, UK, 2001. [Google Scholar]
  132. BNPB Peta Kawasan Rawan Bencana Merapi. Available online: http://geospasial.bnpb.go.id/wp-content/uploads/2011/05/2011-04-29_KRB_Area_Terdampak_Langsung_Merapi.pdf (accessed on 9 October 2015).
  133. D’ALBE, E.M.F. Objectives of volcanic monitoring and prediction. J. Geol. Soc. 1979, 136, 321–326. [Google Scholar] [CrossRef]
  134. Bardintzeff, J.M. Merapi volcano (Java, Indonesia) and Merapi-type nuée ardente. Bull. Volcanol. 1984, 47, 433–446. [Google Scholar] [CrossRef]
  135. Abdurachman, E.K.; Bourdier, J.-L.; Voight, B. Nuées ardentes of 22 November 1994 at Merapi volcano, Java, Indonesia. J. Volcanol. Geotherm. Res. 2000, 100, 345–361. [Google Scholar] [CrossRef] [Green Version]
  136. Lavigne, F.; de Bélizal, E.; Cholik, N.; Aisyah, N.; Picquout, A.; Mei, E.T.W. Lahar hazards and risks following the 2010 eruption of Merapi volcano, Indonesia. EGU Gen. Assem. 2011, 13. Available online: http://meetingorganizer.copernicus.org/EGU2011/EGU2011-4400.pdf (accessed on 26 November 2017).
  137. Lavigne, F.; Thouret, J.-C. Sediment transportation and deposition by rain-triggered lahars at Merapi Volcano, Central Java, Indonesia. Geomorphology 2003, 49, 45–69. [Google Scholar] [CrossRef]
  138. Thouret, J.-C.; Lavigne, F.; Kelfoun, K.; Bronto, S. Toward a revised hazard assessment at Merapi volcano, Central Java. J. Volcanol. Geotherm. Res. 2000, 100, 479–502. [Google Scholar] [CrossRef]
  139. Newhall, C.G.; Self, S. The volcanic explosivity index (VEI) an estimate of explosive magnitude for historical volcanism. J. Geophys. Res. 1982, 87, 1231. [Google Scholar] [CrossRef]
  140. Dash, N.; Gladwin, H. Evacuation Decision Making and Behavioral Responses: Individual and Household. Nat. Hazards Rev. 2007, 8, 69–77. [Google Scholar] [CrossRef]
  141. Ahsan, M.N.; Takeuchi, K.; Vink, K.; Ohara, M. A Systematic Review of the Factors Affecting the Cyclone Evacuation Decision Process in Bangladesh. J. Disaster Res. 2016, 11, 741. [Google Scholar] [CrossRef]
  142. Lim, M.B.B.; Lim, H.R.; Piantanakulchai, M.; Uy, F.A. A household-level flood evacuation decision model in Quezon City, Philippines. Nat. Hazards 2015, 80, 1539–1561. [Google Scholar] [CrossRef]
  143. Linardi, S. Peer coordination and communication following disaster warnings: An experimental framework. Saf. Sci. 2016. [Google Scholar] [CrossRef]
  144. Lamb, S.; Walton, D.; Mora, K.; Thomas, J. Effect of authoritative information and message characteristics on evacuation and shadow evacuation in a simulated flood event. Nat. Hazards Rev. 2011, 13, 272–282. [Google Scholar] [CrossRef]
  145. Khalid, M.N.A.; Yusof, U.K. A Crowd Modelling Considering Group Cohesion in the Emergency Route Planning Problems. Aust. J. Basic Appl. Sci. 2014, 8, 33–39. [Google Scholar]
  146. Liu, S.; Murray-Tuite, P.; Schweitzer, L. Incorporating Household Gathering and Mode Decisions in Large-Scale No-Notice Evacuation Modeling. Comput.-Aided Civ. Infrastruct. Eng. 2014, 29, 107–122. [Google Scholar] [CrossRef]
  147. Ronald, W. Population Evacuation in Volcanic Eruptions, Floods, and Nuclear Power Plant Accidents: Some Elementary Comparisons. J. Commun. Pschol. 1983, 11, 36–47. [Google Scholar]
  148. Siebeneck, L.K.; Cova, T.J. Spatial and temporal variation in evacuee risk perception throughout the evacuation and return-entry process. Risk Anal. 2012, 32, 1468–1480. [Google Scholar] [CrossRef] [PubMed]
  149. Pareschi, M.T.; Cavarra, L.; Favalli, M.; Giannini, F.; Meriggi, A. GIS and volcanic risk management. Nat. Hazards 2000, 26, 361–379. [Google Scholar] [CrossRef]
  150. Escobar Wolf, R.P. Volcanic Processes and Human Exposure as Elements to Build a Risk Model for Volcan de Fuego, Guatemala; Diss. Michigan Technological University: Michigan, MI, USA, 2013. [Google Scholar]
  151. Zhang, N.; Huang, H.; Su, B.; Zhang, H. Population evacuation analysis: Considering dynamic population vulnerability distribution and disaster information dissemination. Nat. Hazards 2013, 69, 1629–1646. [Google Scholar] [CrossRef]
  152. Huang, Z.; Zheng, P.; Ren, G.; Cheng, Y.; Ran, B. Simultaneous optimization of evacuation route and departure time based on link-congestion mitigation. Nat. Hazards 2016, 83, 575–599. [Google Scholar] [CrossRef]
  153. Liu, X.; Lim, S. Integration of spatial analysis and an agent-based model into evacuation management for shelter assignment and routing. J. Spat. Sci. 2016, 61, 1–16. [Google Scholar] [CrossRef]
  154. Yi, W.; Özdamar, L. A dynamic logistics coordination model for evacuation and support in disaster response activities. Eur. J. Oper. Res. 2007, 179, 1177–1193. [Google Scholar] [CrossRef]
  155. Mitchell, S.; Radwan, E. Heuristic Priority Ranking of Emergency Evacuation Staging to Reduce Clearance Time. Transp. Res. Rec. J. Transp. Res. Board 2006, 1964, 219–228. [Google Scholar] [CrossRef]
  156. Tu, H.; Tamminga, G.; Drolenga, H.; de Wit, J.; van der Berg, W. Evacuation plan of the city of almere: simulating the impact of driving behavior on evacuation clearance time. Procedia Eng. 2010, 3, 67–75. [Google Scholar] [CrossRef]
  157. Lavigne, F.; Morin, J.; Mei, E.T.W.; Calder, E.S.; Usamah, M.; Nugroho, U. Mapping Hazard Zones, Rapid Warning Communication and Understanding Communities: Primary Ways to Mitigate Pyroclastic Flow Hazard. In SpringerLink; Advances in Volcanology; Springer: Berlin/Heidelberg, Germany, 2017; pp. 1–13. [Google Scholar]
  158. Sagala, S.A.H. System Analysis of Social Resilience against Volcanic Risks Case Studies of Merapi, Indonesia and Mt. Sakurajima, Japan; Kyoto University: Kyoto, Japan, 2009. [Google Scholar]
  159. Van Drimmelen, M.N. Family Gathering in Evacuations: A Case-Study of the 2007 Angora Fire; The University of Utah: Salt Lake City, UT, USA, 2010. [Google Scholar]
  160. Wilson, T.; Dantas, A.; Cole, J. Livestock Evacuation or Not: An Emergency Response Assessment of Natural Disasters. Proc. East Asia Soc. Transp. Stud. 2009, 7, 8. [Google Scholar]
  161. Local Government of Sleman Pemerintah Kabupaten Sleman Update Data Pengungsi Bencana Merapi. 2010. Available online: http://www.webcitation.org/6pNWR8K4a (accessed on 31 March 2017).
  162. Klügl, F. A Validation Methodology for Agent-based Simulations. In Proceedings of the 2008 ACM Symposium on Applied Computing, Fortaleza, Ceara, Brazil, 16–20 March 2008; ACM: New York, NY, USA, 2008; pp. 39–43. [Google Scholar]
  163. Dixit, V.; Montz, T.; Wolshon, B. Validation techniques for region-level microscopic mass evacuation traffic simulations. Transp. Res. Rec. J. Transp. Res. Board 2011, 2229, 66–74. [Google Scholar] [CrossRef]
  164. Siebert, L.; Simkin, T.; Kimberly, P. Volcanoes of the World; University of California Press: Berkeley, CA, USA, 2011. [Google Scholar]
  165. Anderson, W.A. Disaster Warning and Communication Processes in Two Communities. J. Commun. 1969, 19, 92–104. [Google Scholar] [CrossRef] [PubMed]
  166. Durage, S.W.; Wirasinghe, S.C.; Ruwanpura, J.Y. Decision Analysis for Tornado Warning and Evacuation. Nat. Hazards Rev. 2016, 17, 04015014. [Google Scholar] [CrossRef]
  167. Baker, E.J. Hurricane evacuation behavior. Int. J. Mass Emerg. Disasters 1991, 9, 287–310. [Google Scholar]
  168. Lovreglio, R.; Borri, D.; Ronchi, E.; Fonzone, A.; dell’Olio, L. The need of latent variables for modelling decision-making in evacuation simulations. In Proceedings of the IX International Workshop on Planning and Evaluation, Bari, Italy, 16–18 March 2015. [Google Scholar]
  169. Lovreglio, R.; Ronchi, E.; Nilsson, D. An Evacuation Decision Model based on perceived risk, social influence and behavioural uncertainty. Simul. Model. Pract. Theory 2016. [Google Scholar] [CrossRef]
Figure 1. Geographic Information System (GIS) and Agent-Based Model (ABM) interaction concept.
Systems 05 00053 g001
Figure 2. Conceptual framework of agent and environment interaction.
Systems 05 00053 g002
Figure 3. Hazard zonation for the area around Merapi [132].
Systems 05 00053 g003
Figure 4. The dynamic changes of hazard level of the zones during the simulation in two different scenarios [132].
Systems 05 00053 g004
Figure 5. Main agent (people) characteristics.
Systems 05 00053 g005
Figure 6. Agents—environment mechanism and interaction flowchart.
Systems 05 00053 g006
Figure 7. Screenshot of model implementation using AnyLogic. Red dots at (A) are the initial spatial distribution of people at risk. Grey dots are the people outside the danger zones. Subsequently, the people dots change to yellow with the increment of hazard levels at (BD). The movements of people and the changing of the spatial distribution of individuals are displayed at (BD). The monitor chart is (a) monitoring the simulated volcanic activity level; (b) monitoring the number of people at risk and (c) monitoring the percentage of people evacuating.
Systems 05 00053 g007
Figure 8. Example of result analysis of people at risk in different time steps using GIS.
Systems 05 00053 g008
Figure 9. Example of the simulation outcomes of various scenarios. VEI: volcanic explosivity index, CL: crisis length (days). This can be adjusted based on the preferred scenario. The scenario setup shows the length of each activity phase, which can be adjusted to match with the real crisis situations. The top chart shows that the percentage of people at risk is continuously decreasing along with the increase in the percentage of people evacuating.
Systems 05 00053 g009
Figure 10. Example of the result of route density analysis.
Systems 05 00053 g010
Figure 11. Example of the results of evacuee distribution simulations.
Systems 05 00053 g011
Figure 12. Clearance time for various scenarios. VEI: volcanic explosivity index, CL: crisis length (days).
Systems 05 00053 g012
Figure 13. Temporal dynamic of evacuees through the crisis period in 2010. (a) the issuance of the first evacuation order on 3 November 2010; (b) the issuance of the second evacuation order on 3 November 2010; (c) the issuance of the third evacuation order on 5 November 2010 (Source: Volcanic Crisis Chronology [4] and Evacuation data [161]).
Systems 05 00053 g013
Figure 14. Comparison of the average simulation result (10 runs) with the real data for the 2010 evacuation. Note: the returning home process is excluded from this comparison.
Systems 05 00053 g014
Table 1. Existing studies of Mount Merapi.
No.Research FocusReferences
1Disaster/risk management[7,11,12,13,14,15]
2Decision support for disaster/crisis management[16,17,18,19]
3Historical events[2,3,20]
4Sediment/deposit characteristics[21,22,23,24]
5Hazard mapping/modelling[25,26,27,28,29,30]
6Impact of eruption[30,31,32]
7Seismicity[33,34]
8Activity monitoring[35,36,37]
9Population response, characteristics, perception and vulnerability[38,39,40,41,42,43,44]
10Factors influencing evacuation decision[9,45]
11Hazard characteristics[46,47,48,49]
12Lessons from past evacuation management[4,50]
Table 2. Existing research on evacuation modelling.
Modelling Type and MethodHazard
Macroscopic
Agent-Based ModelHurricane [76]
Geographic Information SystemVolcanic [59,60,77];
Earthquake [61]
Generic hazard [78]
Mathematical/numerical modelEarthquake [69];
Generic hazard [70];
Genetic algorithmGeneric hazard [79];
Flood [58]
Discrete choiceHurricane [80]
Mesoscopic
ABM and numerical simulationTsunami [64]
Linear programmingHurricane [72]
Microscopic
Agent-Based ModelFire/building-damage-related hazard [65,81,82,83,84,85];
Generic hazard [66,86,87];
Tsunami [67,88,89];
Hurricane [63,68,90,91,92];
Earthquake [93,94];
Flood [95,96]
Wildfire [97]
Cellular automataGeneric hazard [71,98];
Fire [99]
Dijkstra’s algorithm, virtual reality VisualisationFlood [100]
Particle swarm optimization algorithmGeneric hazard [62]
Game theoryFire [73]
Micro-simulationGeneric hazard [101]
Mixed logitTerror attack [102]
Table 3. Overview of entities and attributes.
EntityAttribute NameAttribute TypeDescription
VolcanoLatitudeDoubleLatitude of the volcano location
LongitudeDoubleLongitude of the volcano location
Activity lengthIntegerThe duration of crisis
Activity levelDoubleThis represents the level of volcanic activity expressed qualitatively from low (1) to high (4)
VEI Volcanic Explosivity Index
Activity ScenariosList<double>Contains the list of the scenarios of activity length of each level (low to high)
PeopleDistrict IDIntegerNumber of districts where people live
LatitudeDoubleLatitude of current location
LongitudeDoubleLongitude of current location
Home latitudeDoubleLatitude of home location
Home longitudeDoubleLongitude of home location
Movement speedDoubleSpeed of movement (km/h)
Hazard levelIntegerThe hazard level of the agent location
DestinationShelterThe selected destination for evacuation
LinksList<People>List of people generated randomly to express agents’ relationship
AgeIntegerAge of person generated from custom distribution based on census data
EducationIntegerEducation level of person generated from custom distribution based on census data
SexIntegerGender (male = 1, female = 2) of person generated from custom distribution based on census data
StakeholderAlert levelIntegerAlert level as a result of volcanic activity observation
LinksList<People>List of random people who directly receive the alert
EnvironmentDistrictsList<Polygon>The boundaries of districts (polygon)
Hazard zoneList<Polygon>The hazard zones (see Figure 1)
SheltersList<Point>Location of shelters as evacuation destinations
RoutesList<Object>Routes where people are moving loaded from OSM
Table 4. Matrix of relationships of the hazard level with VEI and hazard zone (Source: [132]).
VEI1234
Zone
HighHighHighHighHigh
MediumMediumMediumHighHigh
LowLowLowLowLow
Table 5. Matrix of relationships of the hazard level with hazard zone and volcanic activities (Source: [132]).
ActivityLowMediumHigh
Zone
LowLowLowLow
MediumLowMediumMedium
HighLowMediumHigh

