1. Introduction
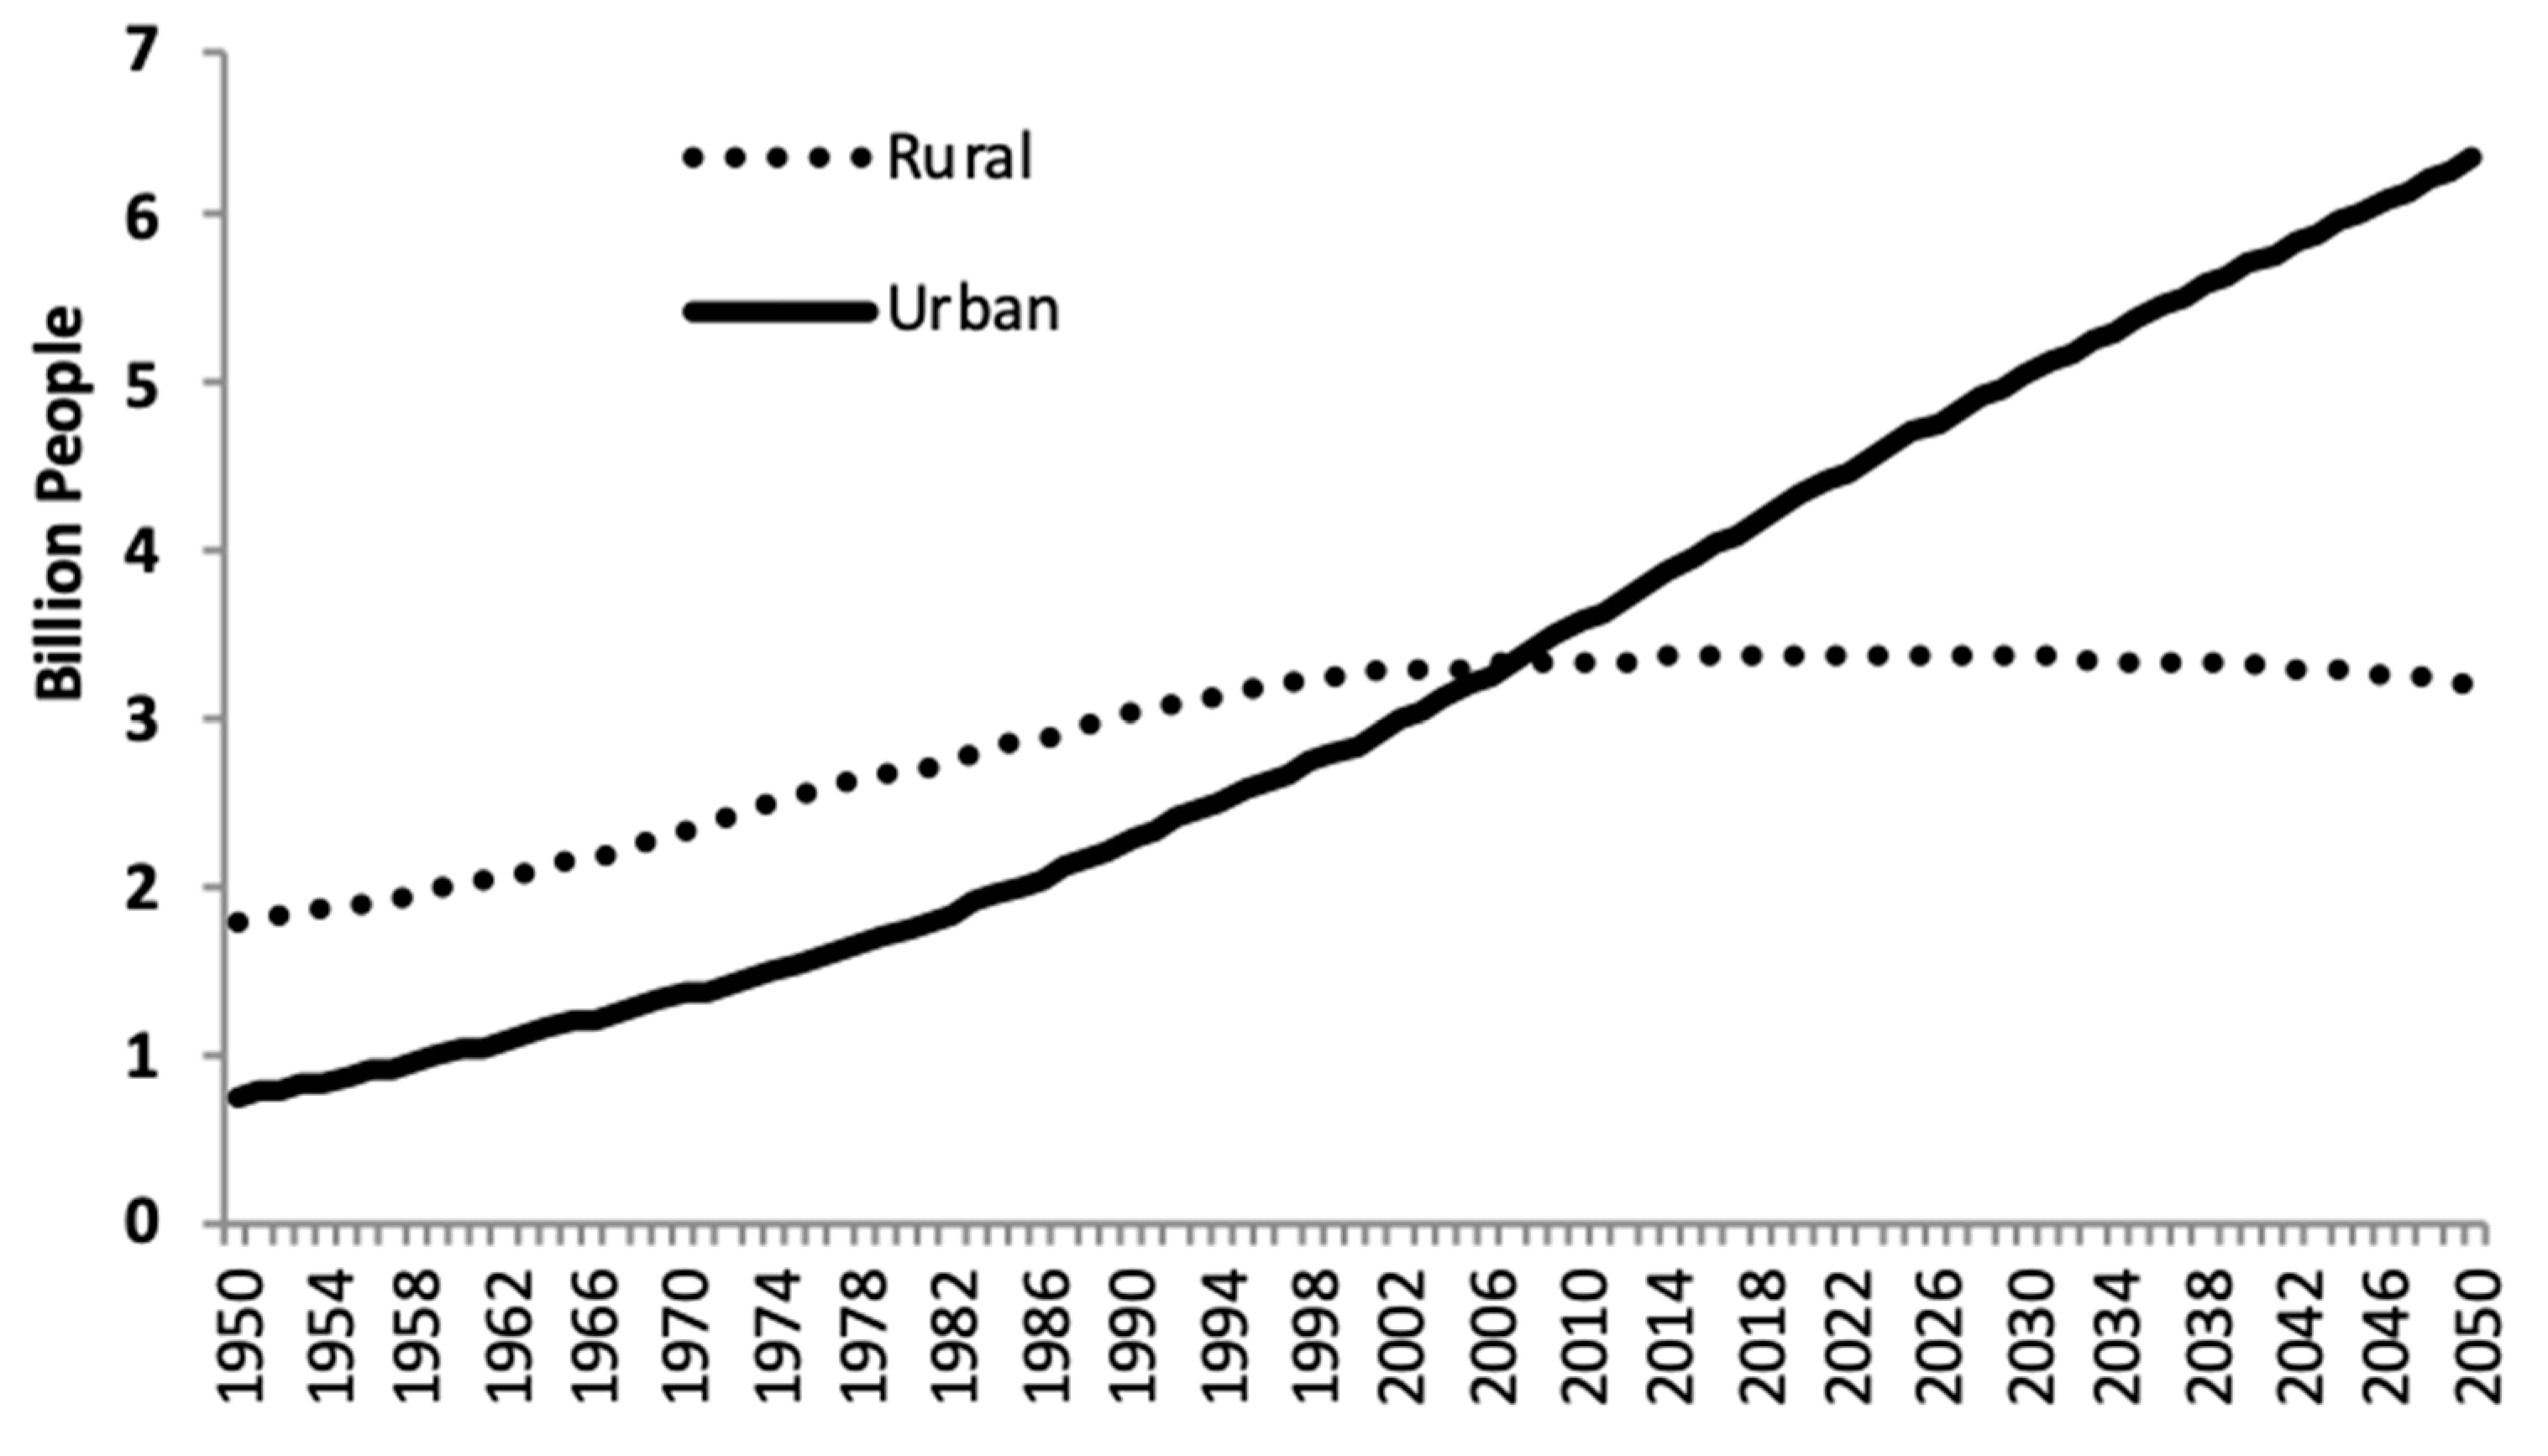
During the past 50 years, several international organizations, using different methodological approaches, have predicted the increase of world’s population and, therefore, food demand for the next decades. A large increase in urban population has been observed until now and predicted for the future (
Figure 1). The rapid growth of urban population, and its related food demand, in developing countries and those in transition, has a strong impact on the extent to which good quality and safe food can be made available to urban households. Urbanization affects urban food security in terms of competition between demand for housing and agricultural production, traffic congestion and pollution, changes in consumption behavior and habits, as well as food accessibility difficulties for low-income urban households. A change of perspective is required while looking at the current economic and biophysical dynamics, and a proportional increase of organizational strategies of food systems and cities is also recommended in order to improve food security. Effective, concerted and sustainable interventions, framed within local policy, strategy and planning perspectives, are required to increase the efficiency, dynamism, inclusiveness and sustainability of food supply and distribution systems [
1].
A detailed overview of food systems was reported by the document from the FAO “Studying Food Supply and Distribution Systems to Cities in Developing Countries and Countries in Transition—Methodological and Operational Guide (Revised Version)” [
1]. This document is used as FAO’s guide Framework for Food Supply and Distribution Systems Analysis (FFFA) in [
2]. FFFA includes an overview of the characteristics of food supply chains, food distribution and markets, the involved stakeholders, the main opportunities and weaknesses of cities and nearby rural areas. Aragrande and Argenti [
1] highlight the need for effective, coordinated and sustainable interventions into developing and in-transition countries. The FFFA essentially shows a detailed picture of the Food Supply and Distribution Systems (FSDS) and listing action and policies aimed to improve food availability in target regions. The publication explicitly calls for a systemic perspective [
1] (p. 4): “
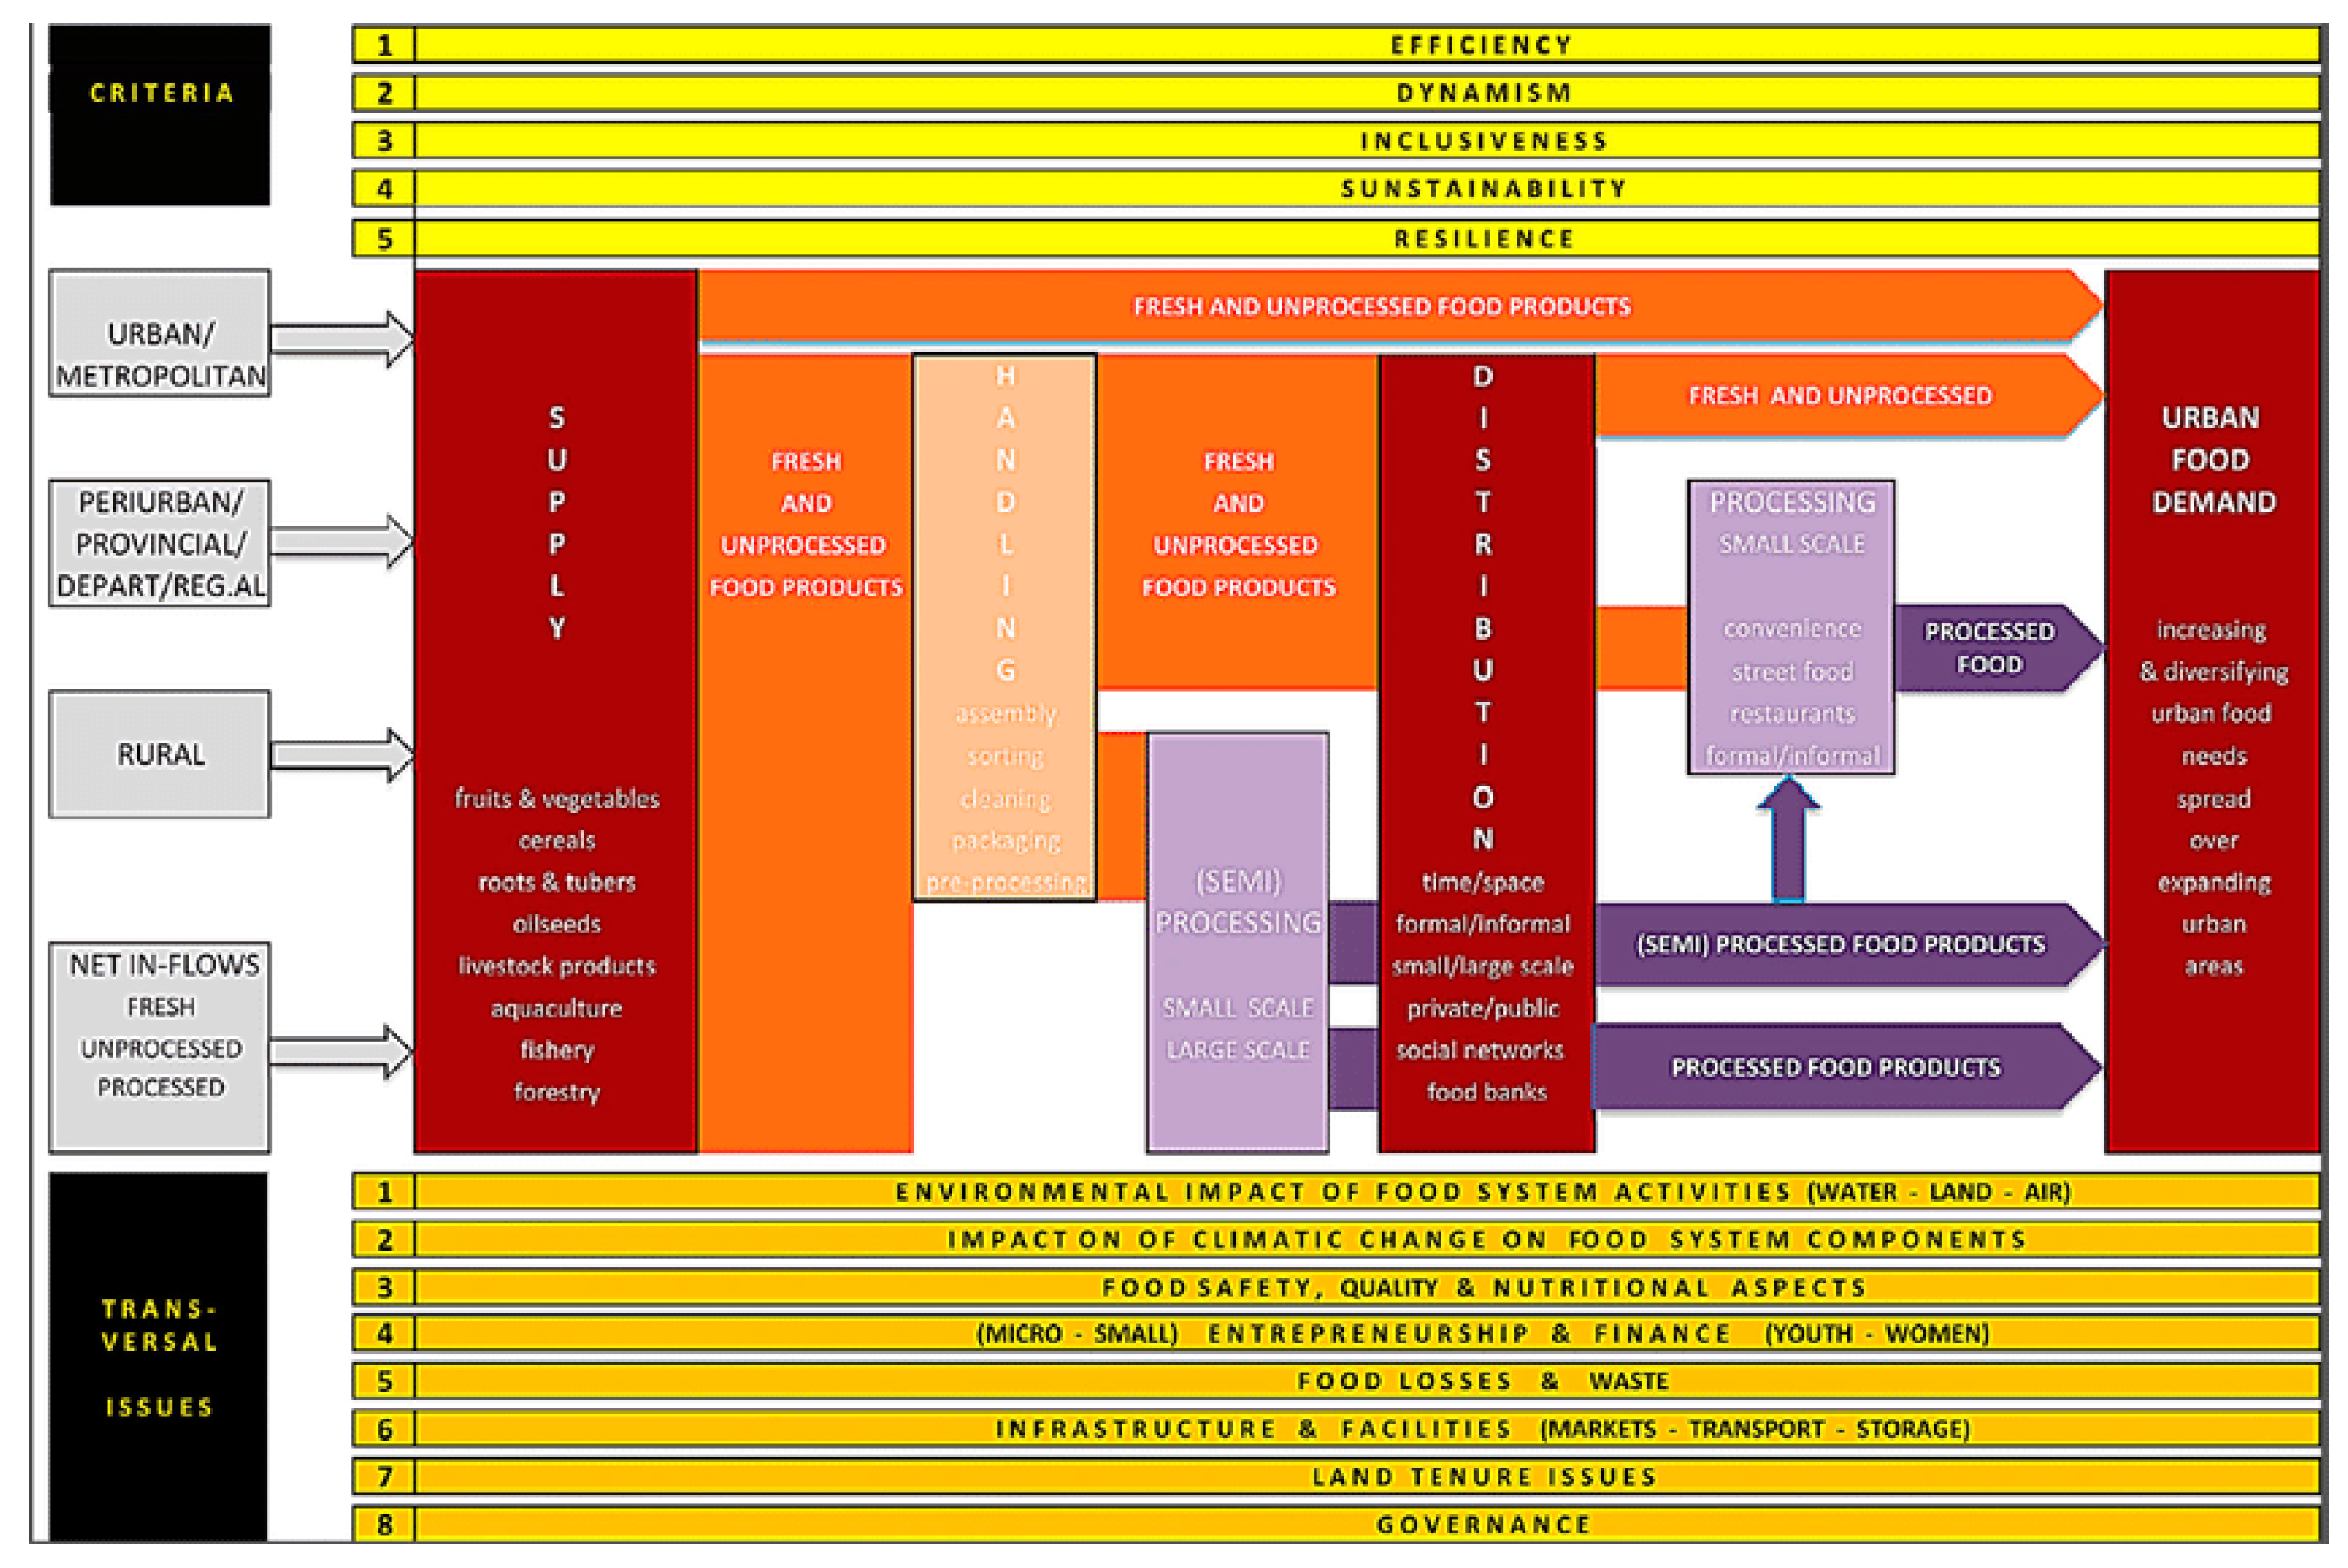
A systems approach is required because the food security of urban populations is the outcome of a long series of interrelated decisions, events, factors, etc., which affect the various subsystems of production, processing, marketing, distribution and consumption. Interventions in any subsystem are likely to have multiple repercussions.” Although some clarifications could be made to the former statement, it captures the systemic perspective of FSDS, which is relevant to clarify: Problem, goal and feasible and effective solutions. which might require the combination of other methodologies and disciplines for their assessment, as we will explain later in this work. Nevertheless, the systemic perspective was not applied to elaborate the operational activities or managerial priorities. The indicated FAO description of the dynamics is in fact performed in a linear way, without any identification of causal effects and feedbacks connections (
Figure 2). A holistic and systemic perspective of food supply to cities is supposed to be beneficial for the success of the analysis, but, in practice, the referred FAO analysis was not carried out by using a systemic perspective. Linear approaches for describing food supply and distribution to cities have been a norm until a preliminary work on this topic was performed in 2015 by Armendariz et al. [
3].
The FAO guidelines, aimed at solving technical problems in the food supply and distribution systems, are however valid in their conceptualization. Other studies allowed integrating the FFFA perspective with systemic techniques so to address a louder holistic understanding of the problems, actions and consequent behavior. In addition, in the last two decades the priorities of developmental strategies and policies have been changing, revealing higher and fundamental emphasis on sustainability and socioeconomic consequences arising from anthropogenic activities.
From this point of view, the Sustainable Development Goals (SDGs) of the Agenda 2030 promoted by the United Nations can be considered the most concise example of production guidelines and demonstrate the scale and ambition of a new, universal approach to sustainable development for our planet. The 17 SDGs [
4] integrate and balance the fundamental dimensions and complex dynamics of interconnected economic, social and environmentally sustainable development, both on a global and local scale. These goals are challenging due to an increasingly interconnected world, characterized by a global web of ecological, economic, social, cultural and political dynamic processes. Hence, these complex challenges cannot be addressed and solved in isolation or with mono-dimensional mindsets anymore.
In this sense, also the FFFA needs to be put into the perspective of the Agenda 2030 framework, by evidencing a matching/mapping (or even just some kind of relationship) between the Sustainable Development Goals (SDGs) and the areas addressed by FAO in their policy guidelines. Also, there is the need to maintain a certain coherence between the systems approach and the holistic vision of the Agenda 2030 [
5], so to promote proper and efficient actions aimed at hitting those ambitious targets.
This work aims at revising the causal map of the FFFA and more in detail to include the relationships among the structure and the components of the food supply and distribution systems as well as identifying which SDGs are impacted (and interconnected).
From a research and policy point of view the main gap of managing food supply and distribution systems is still related to the definition of strategies aimed at covering the nutritional gap, both in terms of the quantity and quality of food. Solutions and policies attempting to bridge nutritional gaps by acting on rural and urban areas are destined to cause consequences that have an impact on aspects that are strictly connected with a few of the 17 sustainable development goals.
In this work we specifically aim at: (i) Revising the conceptual framework of the FFFA under a systemic view, using causal loop diagrams and highlighting the main components of the system structure in the rural and urban side. Then, (ii) link the FFFA to the Agenda 2030 framework by identifying which of the SDGs could be affected in each part of the developed model. This will provide a systemic map of the food supply layered with the SDGs potentially affected by direct or side effects of food policies. In turn, this will lead to an integrated view of the FFFA for policy making support. (iii) Translate the revised FFFA for applicative uses in a preliminary system dynamics simulation model. The model will be calibrated for the city of Bogota initially addressing mainly the supply and demand of milk in this area.
The work presents a brief list of SD models applied to the food systems then the methodological steps followed to revise the FAO version of the FFFA and the development of the systemic perspective of the food supply and distribution systems. In addition, an explanation of the connections among the most relevant components of FSDS with the SDGs from the Agenda 2030 is provided, and particularly how the SDGs are embedded in the systemic perspective.
Finally, we present an evolution of the systems thinking model into a quantitative system dynamics model, which will be preliminary tested on the case of milk production/milk consumption in the city of Bogota (Colombia).
2. Literature Review
Food Supply and Distribution Systems can be defined as complex systems based on their characteristics of entirety, non-linearity, self-organization, feedback oriented, counterintuitive nature, emergence adaptation and hierarchical organization [
3]. Complex-system dynamic perspective can shed light on the analysis of complex food-systems meeting urban food needs and contribute to the understanding of the formulation of development policies, strategies and investments plans. Georgiadis, et al. [
6] explained how past researches failed in the analysis of complex food systems because they did not consider interdependencies among operations and partners involved in the whole food system, missing the holistic approach. Recent works also bases the policy formulation only on the quantification of information about the values of inflows and outflows of the urban materials without considering patterns of system behavior [
7]. Standard methods are considered useful in the analysis of steady systems, having no variability in demand, but not able to manage systems with unique characteristics as the food supply ones.
A state of the art on the use of complex system methodologies to the analysis and management of food systems carried out by Armendariz et al. [
3] showed that: (1) Food Supply and Distribution Systems present complex systems properties and, in fact, complex systems methodologies have been progressively used to understand and manage them, (2) the formal consideration of food systems as complex systems leads to the possibility of broadening the use of complex system methodologies to analyze, understand, simulate and manage specific aspects of food systems or deal with them as a whole by integrating the use of different methodologies. The same authors performed a qualitative comparison between Agent Based Modelling (ABM), Social Network Analysis (SNA) and System Dynamics methodologies and showed that System Dynamics (SD) stands out as a methodology capable of addressing FSDS in relation to their complex systems properties and nature. An interesting previous study on Food Systems Analysis and Design using the SD approach was conducted by Giraldo et al. [
8], where a description of models on Food Security and its approaches were analyzed, concluding that projections and prediction were often based on black-box correlations and with high lack of insights on the causal relationships in the system. They displayed SD models as appropriate for policy evaluation in food systems, providing an assessment of long-term effects based on the causation of variables. Several SD models have been used for the analysis of basic issues related to Food Systems such as resource availability, energy, food and population (
Table 1; integration of the original list of Giraldo et al. [
8]). The same paper of Giraldo et al. [
8] can be considered an example of application of the System Dynamics methodology for food availability gaps in developing countries. It starts from the definition of the causal map of the problem, the building of the stock and flow diagram with mathematical relationships among variables and the quantitative simulation of different scenarios with description of future behaviors of perceived food availability in Colombia.
Additionally, several other contributions have been proposed where System Dynamics and Systems Thinking have been put forward as a viable approach to deal with the complex relationships among the various SDGs. Among the many contributions, [
29] studied the systemic interactions of all 17 SDGs on the specific case of Tanzania; developing a system dynamics model—Threshold21 integrated SDG (iSDG)—that simulates the trends for the SDGs until 2030 for each of the SDG indicators under a business-as-usual scenario, and supports analysis of alternative policy scenarios; Zelinka and Amadei [
30] propose the conjunction of two techniques into one system dynamics model (a modified logistic innovation-diffusion model is used to represent the progress of individual SDGs over time, while a matrix transposition approach is used to model the SDGs’ interactions); Sedehi and Ferri [
31] propose a causal-loop diagram representing a qualitative SDGs systemic interdependence and even propose to add 3 more new SDGs to the current Agenda 2030 list; Ragnarsdottir and Sverdrup [
32] have stated that the current SDGs formulation lacks the capability to address the issue of finite natural resources for technology and food production, nor do they address issues of infrastructure and materials, hence by means of the famous World model they have come to preliminary conclusions about changes that are necessary to achieve the goals, also showing that there are some important missing systemic elements that are needed to deliver the SDGs.
Apart from the above-mentioned relevant research and given the very wide available literature on these topics, it appears clear how SD stands as a methodology with the capacity to be applied in combination with integrative frameworks for food systems and Agenda 2030 goals.
The methodological mismatch among the practical approach adopted by FAO’s guide and the potential support offered by the Agenda 2030 and systemic approaches gives us the opportunity to suggest updates in the system understanding and organizational processes oriented to reduce the gaps of food access in rural and urban environment.
3. Materials and Methods
The work was carried out through the following main steps: (i) Analyze the possibility to describe the FFFA under a systemic point of view, (ii) link the FFFA to the Agenda 2030 framework by identifying which of the SDGs are addressed in the model, (iii) propose a revised systems thinking map of FFFA concepts integrated with the SDGs, (iv) propose a first version of a FFFA quantitative SD model followed by a preliminary application to the analysis of the dairy sector dynamics in the area of Bogota.
The FFFA and complementary publications from the FAO’s Food into Cities collection were studied in order to gather evidence of variables, define connections among those variables and identify the limitations of approaches used until now to model food supply to cities. The application of the systems thinking (ST) and system dynamics (SD) methodological approaches [
33] was chosen to systemically study the FSDS, in light of their relevance to the various SDGs.
SD allows describing the system’s structure and its behavior over time to identify high leverage points for intervention on the system, to test (by applying them in a virtual environment) possible policies and to forecast the outcomes of such decision on the system through simulation [
33]. An integrated assessment of changing technical, economic, social and environmental conditions affecting both, the urban and the rural areas, is calling not just for the use of new tools, capable of evaluating how dynamic elements interact among themselves, but also for a new understanding capable of revealing a systemic structure coherent with real world FSDS and urban issues.
A causal loop diagram (CLD), supporting the understanding of the FSDS complexity, was designed after having identified and analyzed the problem, goal and solutions according to FAO’s guide, re-conceptualized the structure of FSDS, based on FAO’s literature. The causal diagram annotation rules follow the indications found in [
33].
The quantitative system dynamics model was then developed by translating the qualitative CLD into a Stock and Flow diagram as also suggested in [
33]. The Stock and Flow diagram was developed in order to run quantitative simulations of the FFFA.
The system dynamics model was populated based on the data retrieved from the FAOSTAT website (
www.faostat.org) and literature publications reporting data on milk production and consumption in the area of Bogota, Colombia [
34]. Only official sources were considered in order to guarantee the data reliability and affordability. Such data was used to calibrate the quantitative FFFA model. Results of the simulations were discussed, and several considerations and conclusions were drawn. Matches among historical data, observed for the case study in Bogota, and model simulations were evaluated with a linear regression among observed versus predicted values and considering the determination coefficient as indicator of the model precision [
33].
3.1. Narrative Description of the FAO’s Methodological Targets and the SDGs
The FFFA consists in a fundamental study for the characterization of food supply and distribution systems based on the observation of developing countries and countries in transition. Aragrande e Argenti [
1], covering the description of the food supply and distribution systems in those developing countries and the economic, social and institutional contests.
Although, FFFA does not make a direct reference to a single main problem, from its narrative and complementary publications, one problem can be elicited. FAO [
35] states: “The increasing urbanization of transition and developing countries represents the need to organize food production, processing and marketing facilities so as to satisfy an urban demand characterized by growing poverty levels.” In addition, urbanization and poverty (the latter being a key SDG) are mentioned as significant issues for the increasing urban population, which, besides, has been attributed to play a role in the food accessibility. In some cities as Lagos, Dhaka, Freetown, La Paz, Kinshasa, Guatemala, the poverty rate is up to 50% of the total population [
36]. FFFA defines Food Supply and Distribution Systems as “complex combination of activities (production, handling, storage, transport, process, package, wholesale, retail, etc.) operated by dynamic agents, enabling cities to meet their food requirements”.
From Armendariz et al. [
2] we know that FAO identified the increasing urbanization as the main obstacle to the efficiency and effectiveness of FSDS, and any other problem in FSDS is derived from this main one. Four basic related issues were also highlighted: (a) Land competition between housing, industry, and infrastructure and agricultural production within and around cities; it also includes the competition among land use for biomass production destined to food, feed or renewable energy; (b) increasing quantities of food required to feed cities and its distribution within the expanding urban areas; (c) consumption habits and food purchasing behaviors modifications; (d) low-income households and food accessibility problems due to the likelihood to reside far from food markets and the lack of basic infrastructure—roads, electricity and water.
These are all aspects that are also related to several SDGs and hence systemically connected under a systemic perspective, as already mentioned.
Three policy goals (at the time referred to as Millennial Goals) were also defined by FAO [
35]:
- -
Economic (to achieve low cost food) → which maps to SDG 8;
- -
Social (minimizing food insecurity in poor households, job opportunities) → which maps to SDGs 1 e 10 in a first instance;
- -
Health and Environmental (better hygiene and sustainable food production, processing retailer and consumption) → which map to SDGs 3 and 6.
It is interesting to note that, with reference to the FAO report [
35], none of the economic, social and health and environmental goals are related to the main one “Meeting urban food needs”. Particularly interesting is the fact that none of these was deliberately related to the main problem, the increasing urbanization, which makes it clear that there’s a risk of not selecting significant policies to meet the goal because the problem is unaddressed. It is also important to mention that, in the FFFA guide, the concept of “urban food security” is not presented. Understanding how a system works requires an appropriate approach through which the system can be observed. Treating both human and ecosystem spheres as separated contexts and considering them as linear, predictable and controllable are two primary errors when dealing with environmental issues.
3.2. From FAO Narrative to a Systems Thinking and System Dynamics Modeling Approach
Following the purpose explained in the previous paragraphs, a Causal Loop Diagram has been developed. This CLD wants to be a first attempt to tie together rural and urban point of view in a FSDS, including some aspects and variables highlighted by the FAO framework. Through the use of a systemic approach and the development of a causal loop diagram, many intrinsic relationships are revealed, and this enables a deeper study of the food service and distribution system. The CLD is based on what has been done in Armendariz et al. [
2], but in this paper we want to give more details about the macro-elements identified in the previous work. In particular, in the presented qualitative model and in the subsequent quantitative model, we focused on the two major subsystems of the previous model: the food production subsystem and the food-distribution subsystem. They are the most important complex systems that need to be considered in order to have a deeper explanation of food dynamics. In short, the CLD in this paper is a model refinement of the one showed in [
2] (which was, in turn, based on FAO document [
1]), defining more clearly the scope of the model and its main variables. This activity was then useful to better design the Stock and Flow model, which, in this case, is the mere translation of what the CLD has identified as main variables and links in a final simulation model.
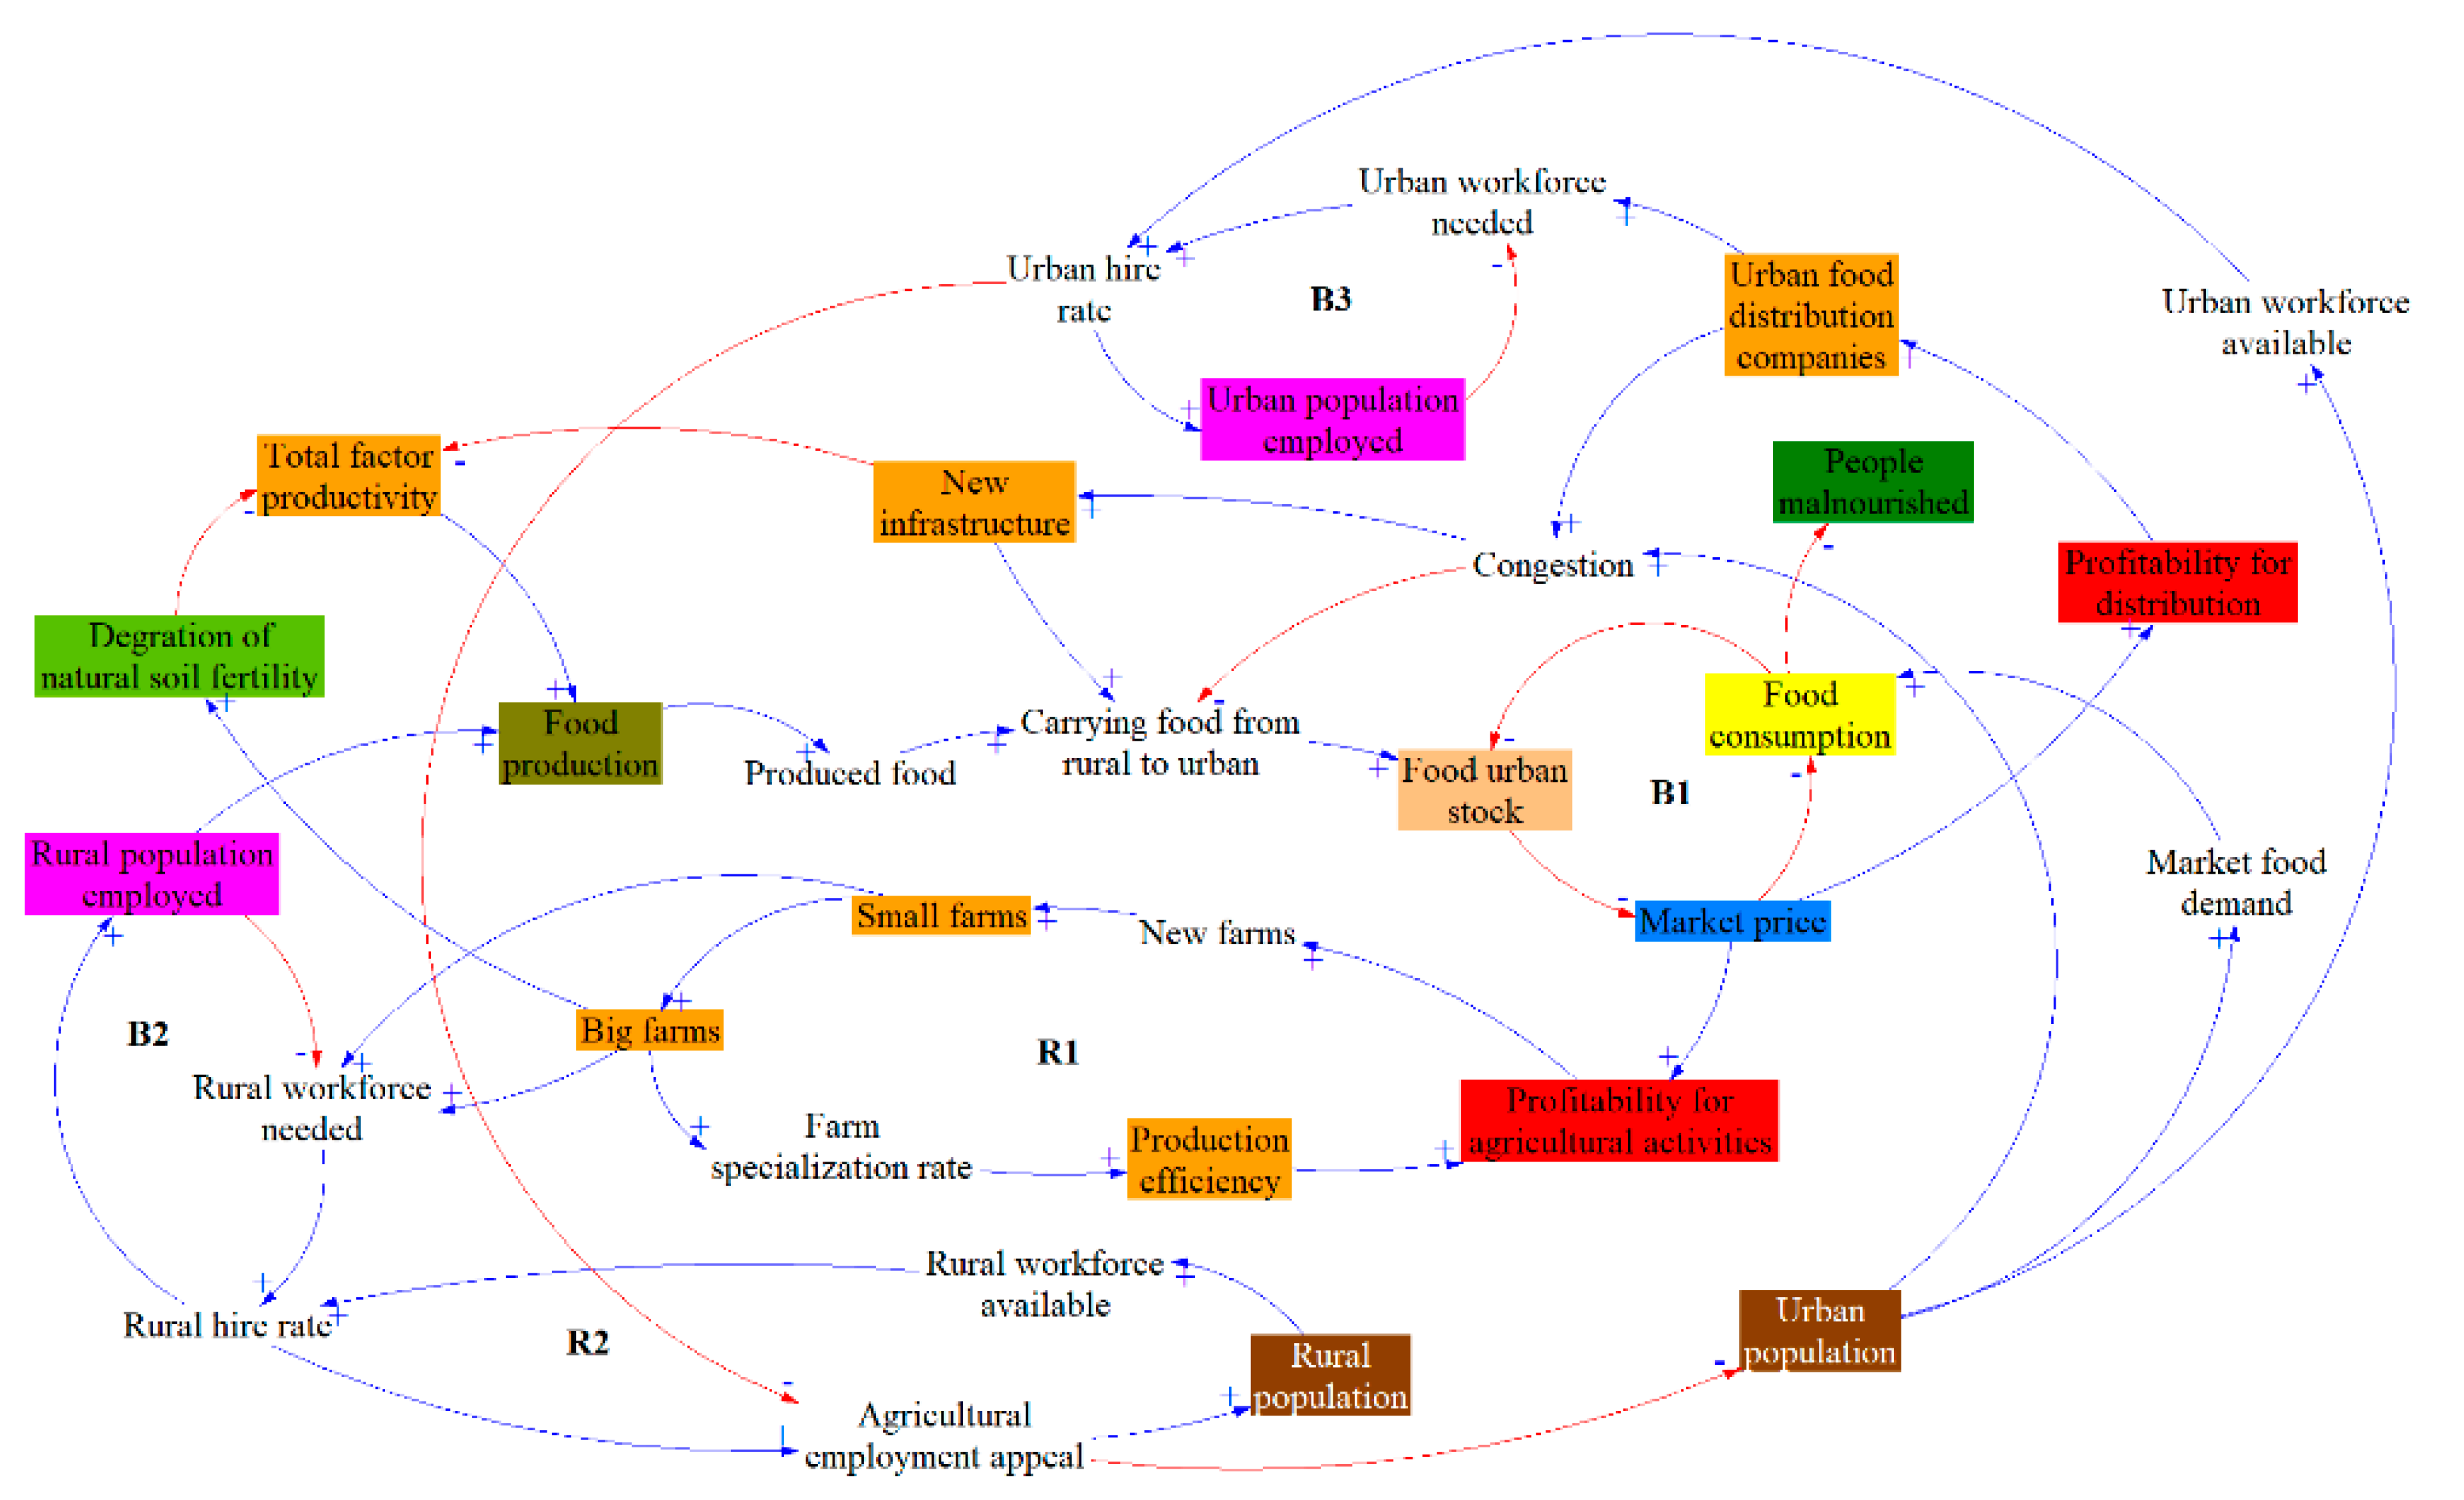
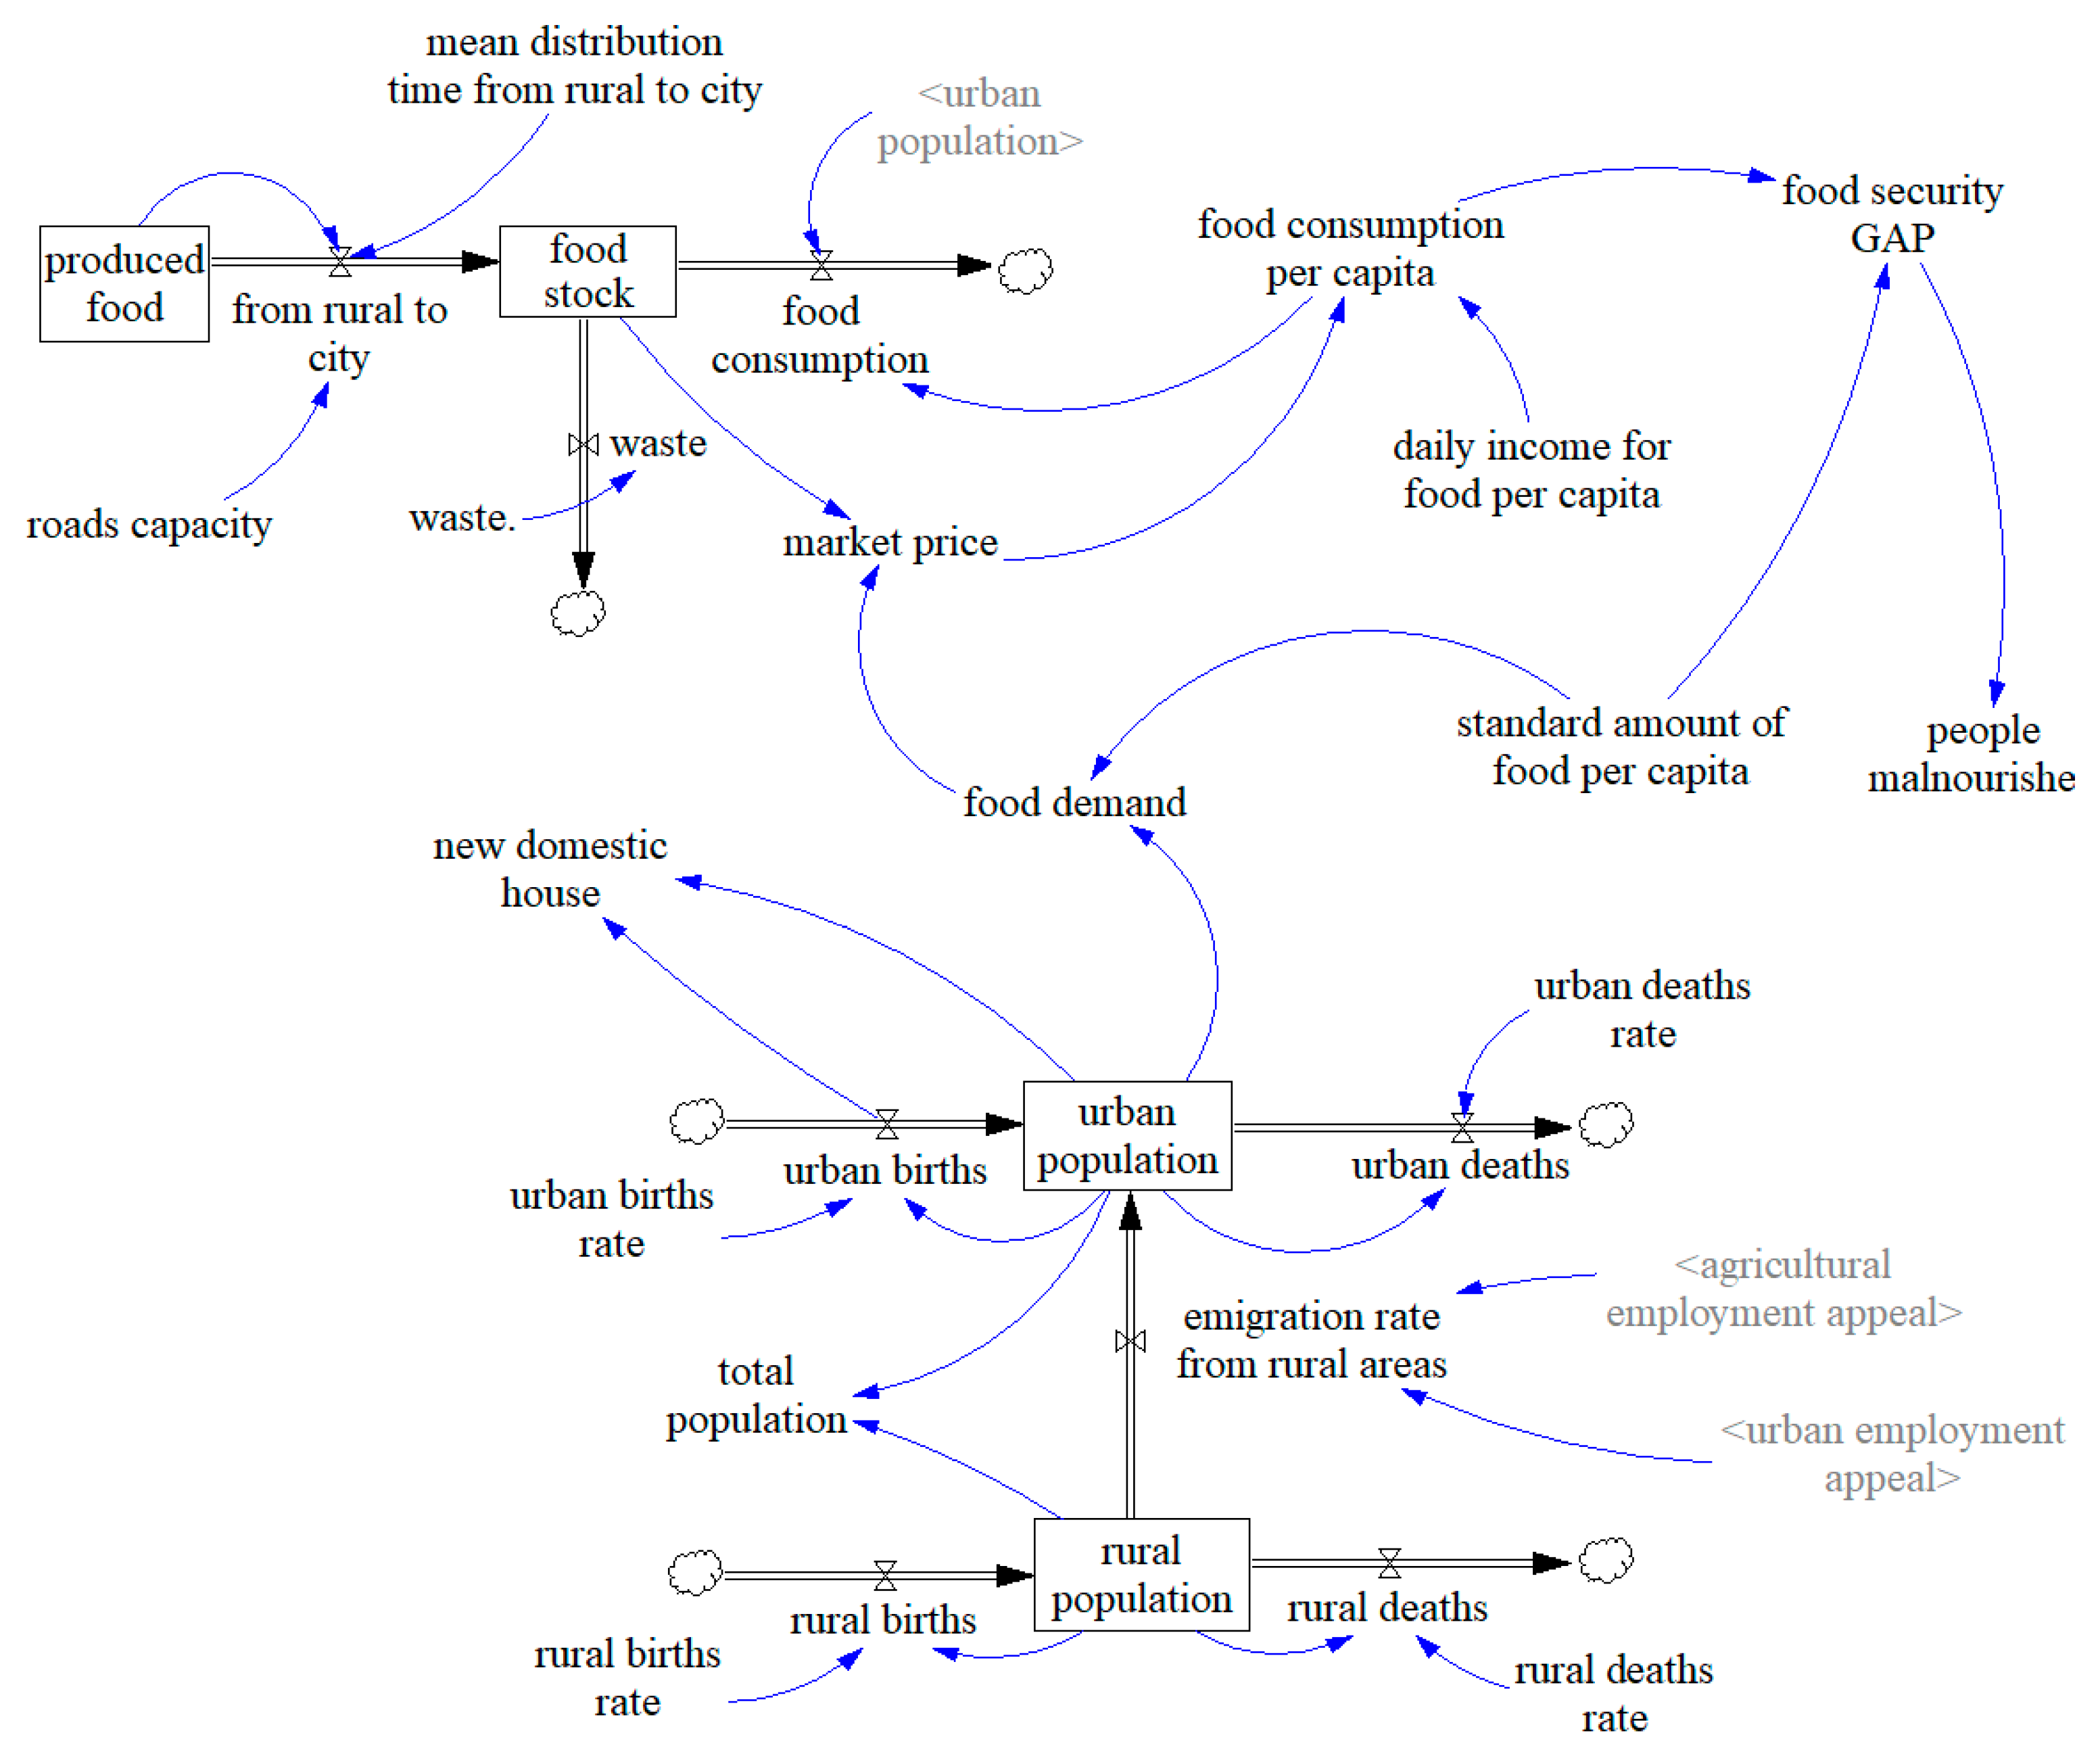
The final CLD (
Figure 3) consists of different areas of interest:
Rural production (farms and workforce);
Urban distribution (distribution companies and workforce);
Food market (supply and demand);
Total factor productivity.
These areas will be described individually, showing the emerging loops.
Inside the Casual Loop Diagram (
Figure 3) presented in this paper, only the main model variables and their interrelations are proposed. Furthermore, the variables will be highlighted with different colors in order to easily relate them to the corresponding SDG objective, following the color codes identified in
Table 2 below.
It is worth noticing that
Table 2 reports only a subset of the SDGs that are accounted for in our CLD, and namely: (i) Those SDGs that can be linked to some of the variables in the CLD, (ii) how “relevant” such variables in the model are to the specific SDGs and (iii) the colors used to represent the belonging of certain variables in the model to the related SDG area, so to better identify also the systemic relationships across the very same SDGs. In other words,
Table 2 is meant to summarize which SDGs are accounted for in our model and through which variable(s) of the model, and how relevant such variables are to the referenced SDG.
“Relevance” here is explained as follows:
- (1)
Core: the related variables are essential aspects in the description of the connected SDG;
- (2)
Central: the related variables are aspects that can be retrieved by the description of the related SDG and that are pretty clearly connected to it;
- (3)
Limited: the related variables are marginal aspects to the related SDG but can be connected to it through other variables or relationships.
3.3. Causal Loop Diagram (CLD)
Figure 3 presents the overall Causal Loop Diagram (CLD), that is a qualitative model representing the causal relationships among the most important aspects (variables) in our model.
Figure 3 is meant to provide an overall glimpse of our qualitative model and due to its complexity, it may seem a bit difficult to follow. For this reason, and also in order to systemically appreciate the whole model, we will drive the reader in understanding its main feedback loops, on which we have put a focus in the following.
Let’s first analyze a few basic loops:
The reinforcing loop R1 regards the number of rural farms which often gather together in bigger farms, improving efficiency (taking advantage from economy of scale) and profitability of sector;
The reinforcing loop R2 regards the rural workforce available that depends on rural population, which increase if the hiring rate of farms guarantees enough employment. the urban counterpart has also the same loop (not indicated in the figure), which is affected by the agricultural employment appeal in a opposite way compared to the rural population;
The balancing loops B2–B3 regard the workforce requested by the new farms and the distribution companies;
The balancing loop B1 identify a simple economic sub-system which includes market price, food consumption and food stock at urban level.
Beside these basic loops there are other loops which consist of variables from different areas of interest.
In
Figure 4 two loops are highlighted. The reinforcing loop R3 (green arrows) explain the relationship between the market price and the production of food; when market price rises also the profitability rises, the effect is an over-exploitation of soil due to increase in production. In the long run the total factor productivity will decrease drastically making it difficult to produce new food, which drops the urban stock (supply) and raises the price.
To counteract this loop there are two balancing loops. One is the B1 previously explained, the other is B4 (orange) which shows that the more the profitability for agricultural activities the less population at urban level (they move to rural because of the raising in workplaces).
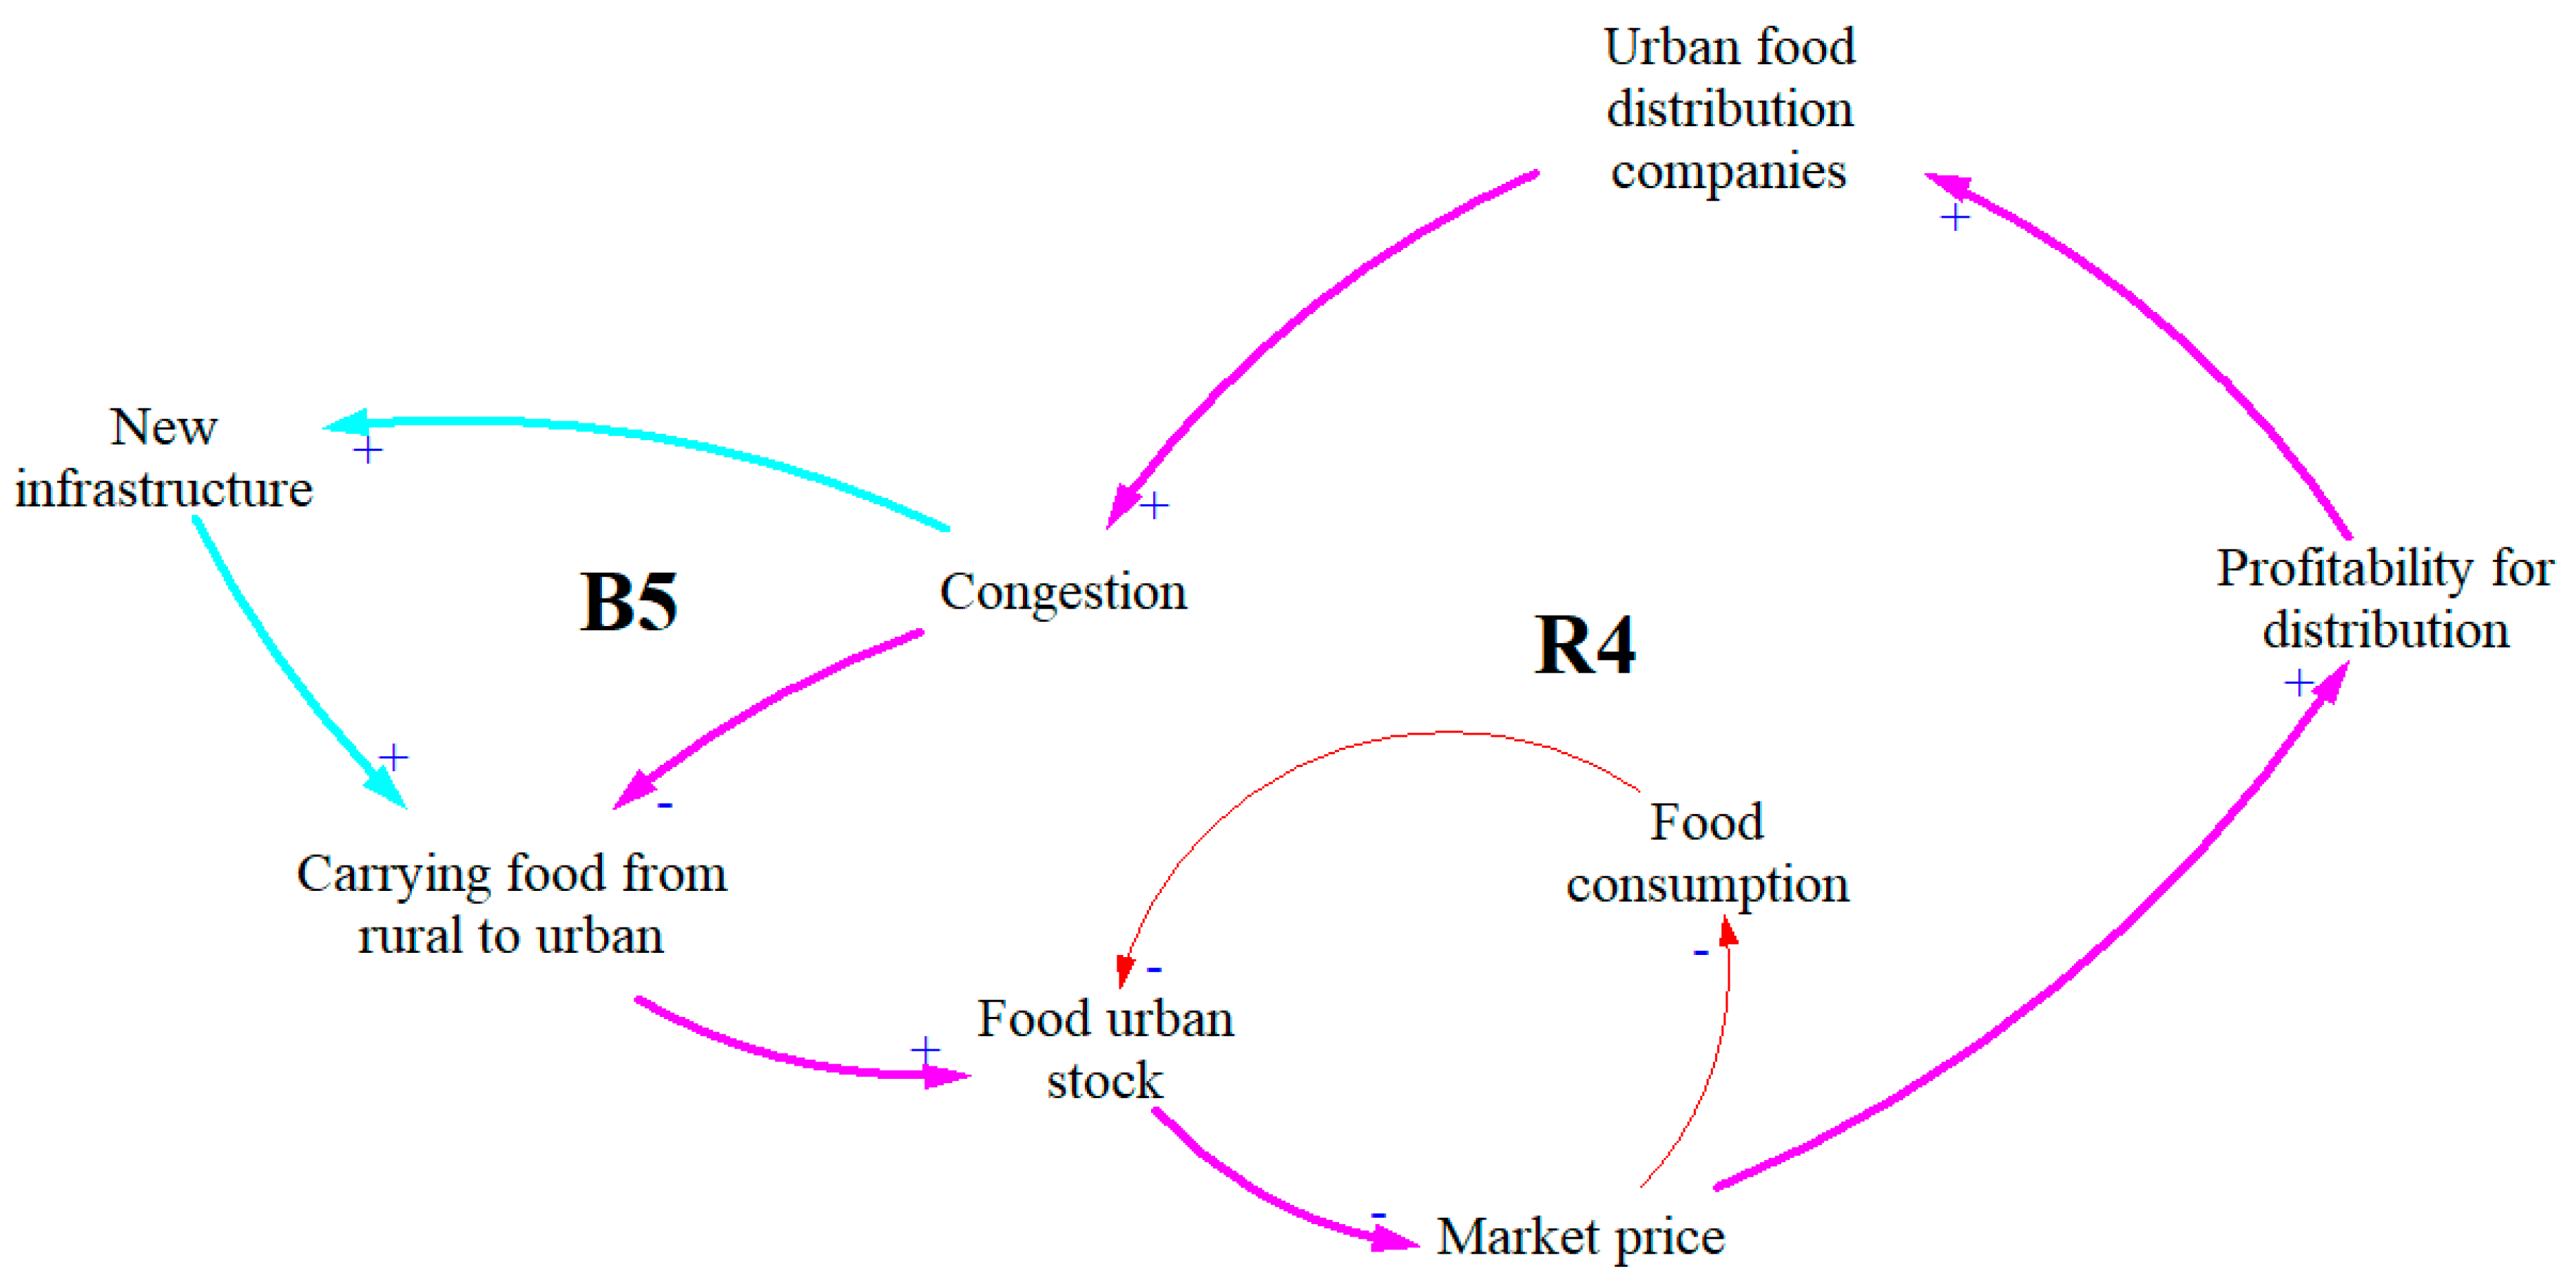
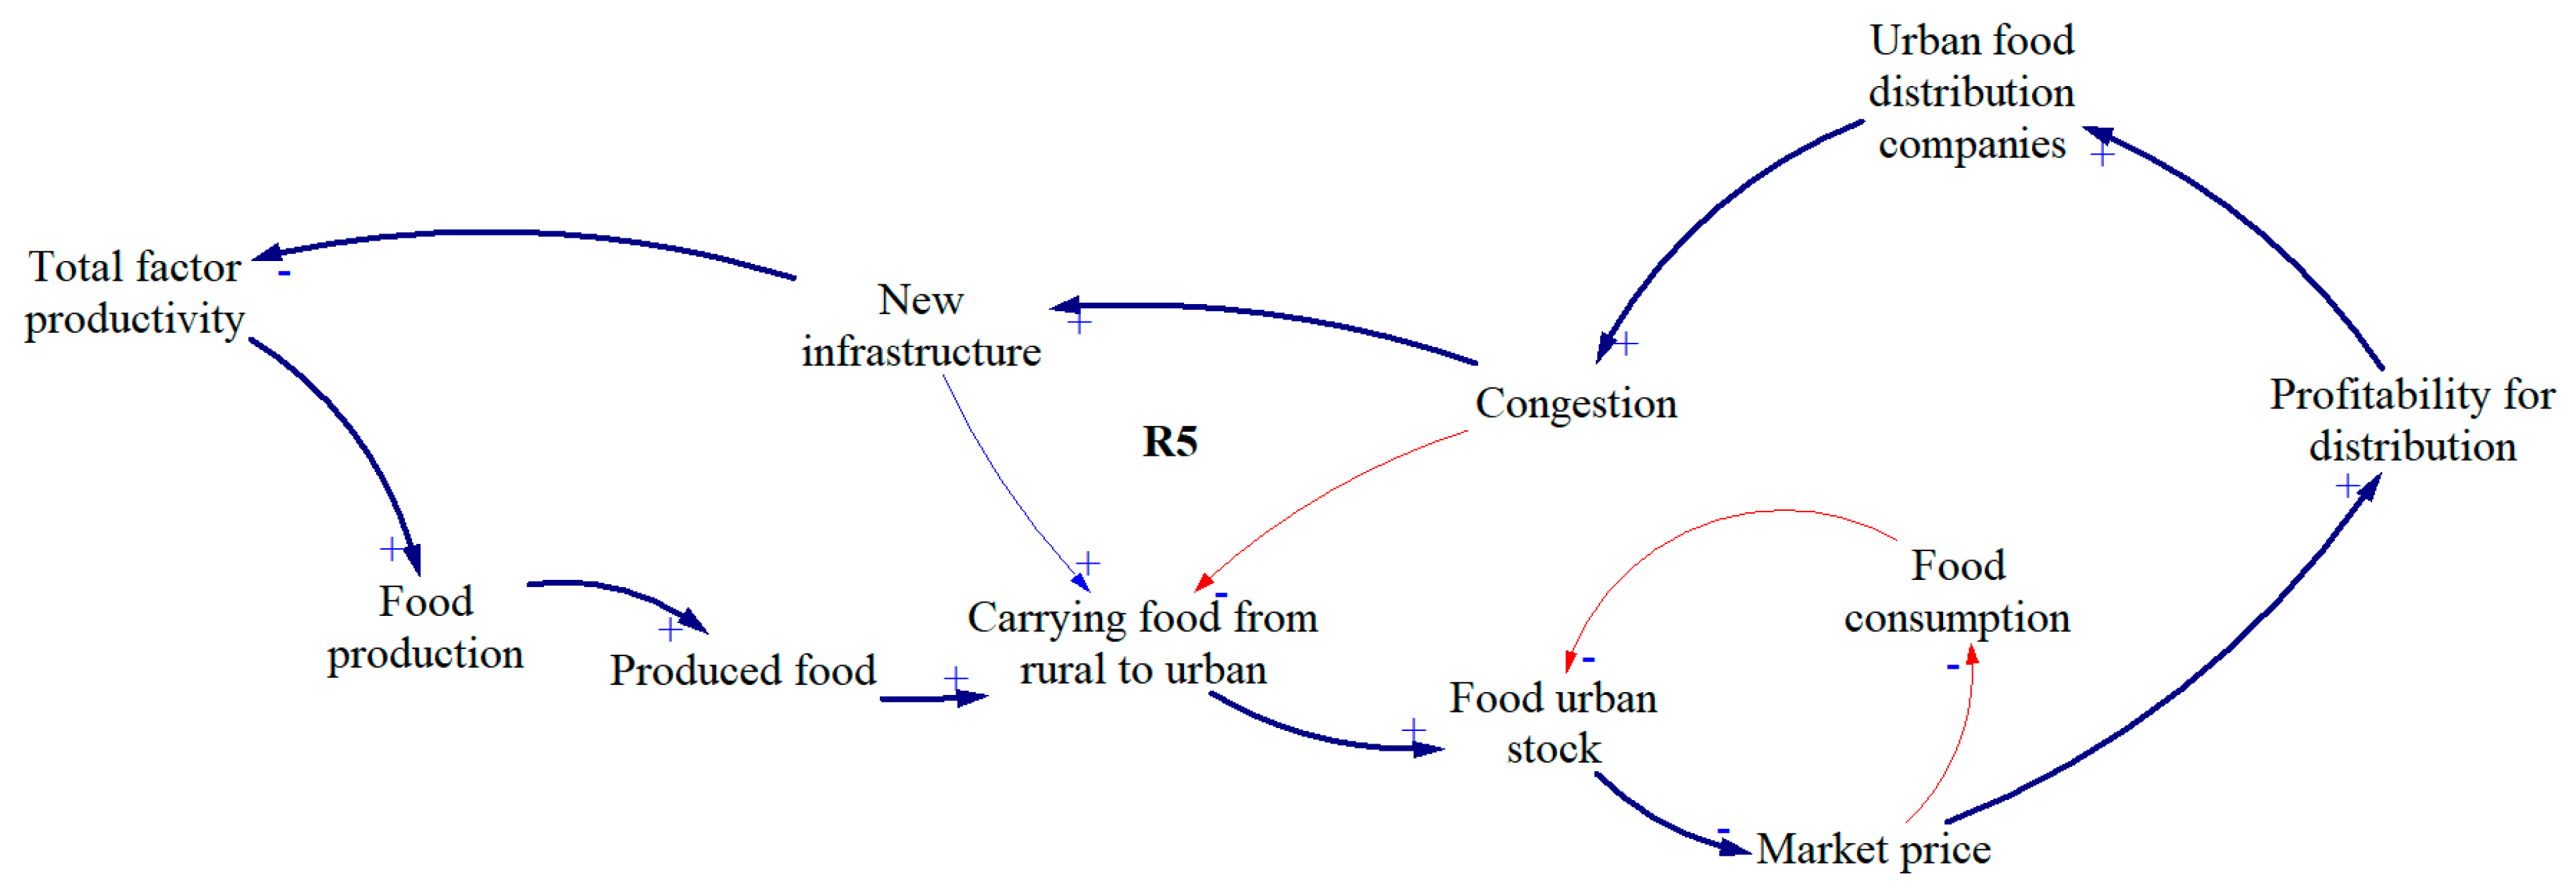
In
Figure 5 we evidence two more loops. The reinforcing loop R4 (magenta) shows the relationship between urban food distribution companies and congestion of urban street. The congestion causes difficulties in carrying food from rural to urban, which in turn creates an insufficient level of food availability, that raises the price and the profitability of distribution sector.
This loop is counteracted by the balancing loop B1 and by balancing loop B5 (cyan). This last is due to the dynamic of building new infrastructure when congestion becomes unbearable.
Nevertheless, building new infrastructure has a side effect which has important consequences on total factor productivity. In fact, building new infrastructure not only decreases land availability (which will be no more used for agriculture activities), but also increase the pollution. All these things weaken the total productivity factor, feeding a new reinforcing loop R5 (blue) showed in
Figure 6.
The drop of total productivity factor weakens the food production, this increases the price and the number of distribution companies, the need of new infrastructure increases, and the total productivity factor decrease much more.
4. Model Simulation, Development and Results
The causal loop diagram described in the previous paragraphs could be considered a good starting point to develop the Stock and Flow diagram, which represents a preliminary quantitative System Dynamics model of the FFFA.
The model was built taking into account the main areas already mentioned in the CLD (population dynamics for rural and urban areas; production chains in rural areas including land use, farms, workforce and incomes; urban demand of food and markets due to population dynamics; distribution, roads and infrastructures; food security gap affecting population dynamics, food companies and pressures on food policies). The core element of the model is the human population stock and its flows, which drives the food demand, and the organizational quality of the system and limits (or favor) the food consumption. A preliminary application was performed using historical data from the population of Bogota and the milk production and consumption in the Colombian capital. Comparisons among model simulations and historical trends of population and milk production observed in Bogota were shown in the results.
4.1. Stock and Flow Diagram
The structure of the quantitative model is presented from
Figure 7,
Figure 8,
Figure 9 and
Figure 10, encompassing the food production and distribution sectors and the relation with demographic dynamics in the country. This will allow the specification of the dynamic hypothesis for the problem discussed in this paper, i.e., what should be the policies to meet urban food needs in developing countries and those in transition. In fact, policies are often developed with a short time horizon and a unidimensional level of action, in order to mitigate the actual state of crisis of a country. However, eradicating the problem require a long-term focus and strenuous multidimensional efforts to reach an equilibrium between economy, population and resources. By thinking under short-termism, resources are going to be always allocated to firefighting, leaving even less resources to building capabilities and reach the equilibrium mentioned above. The model proposed in this paper wants to give help to this kind of new decision-making perspective, giving advices on which are the right investments to do and how long it takes to see real improvements in society.
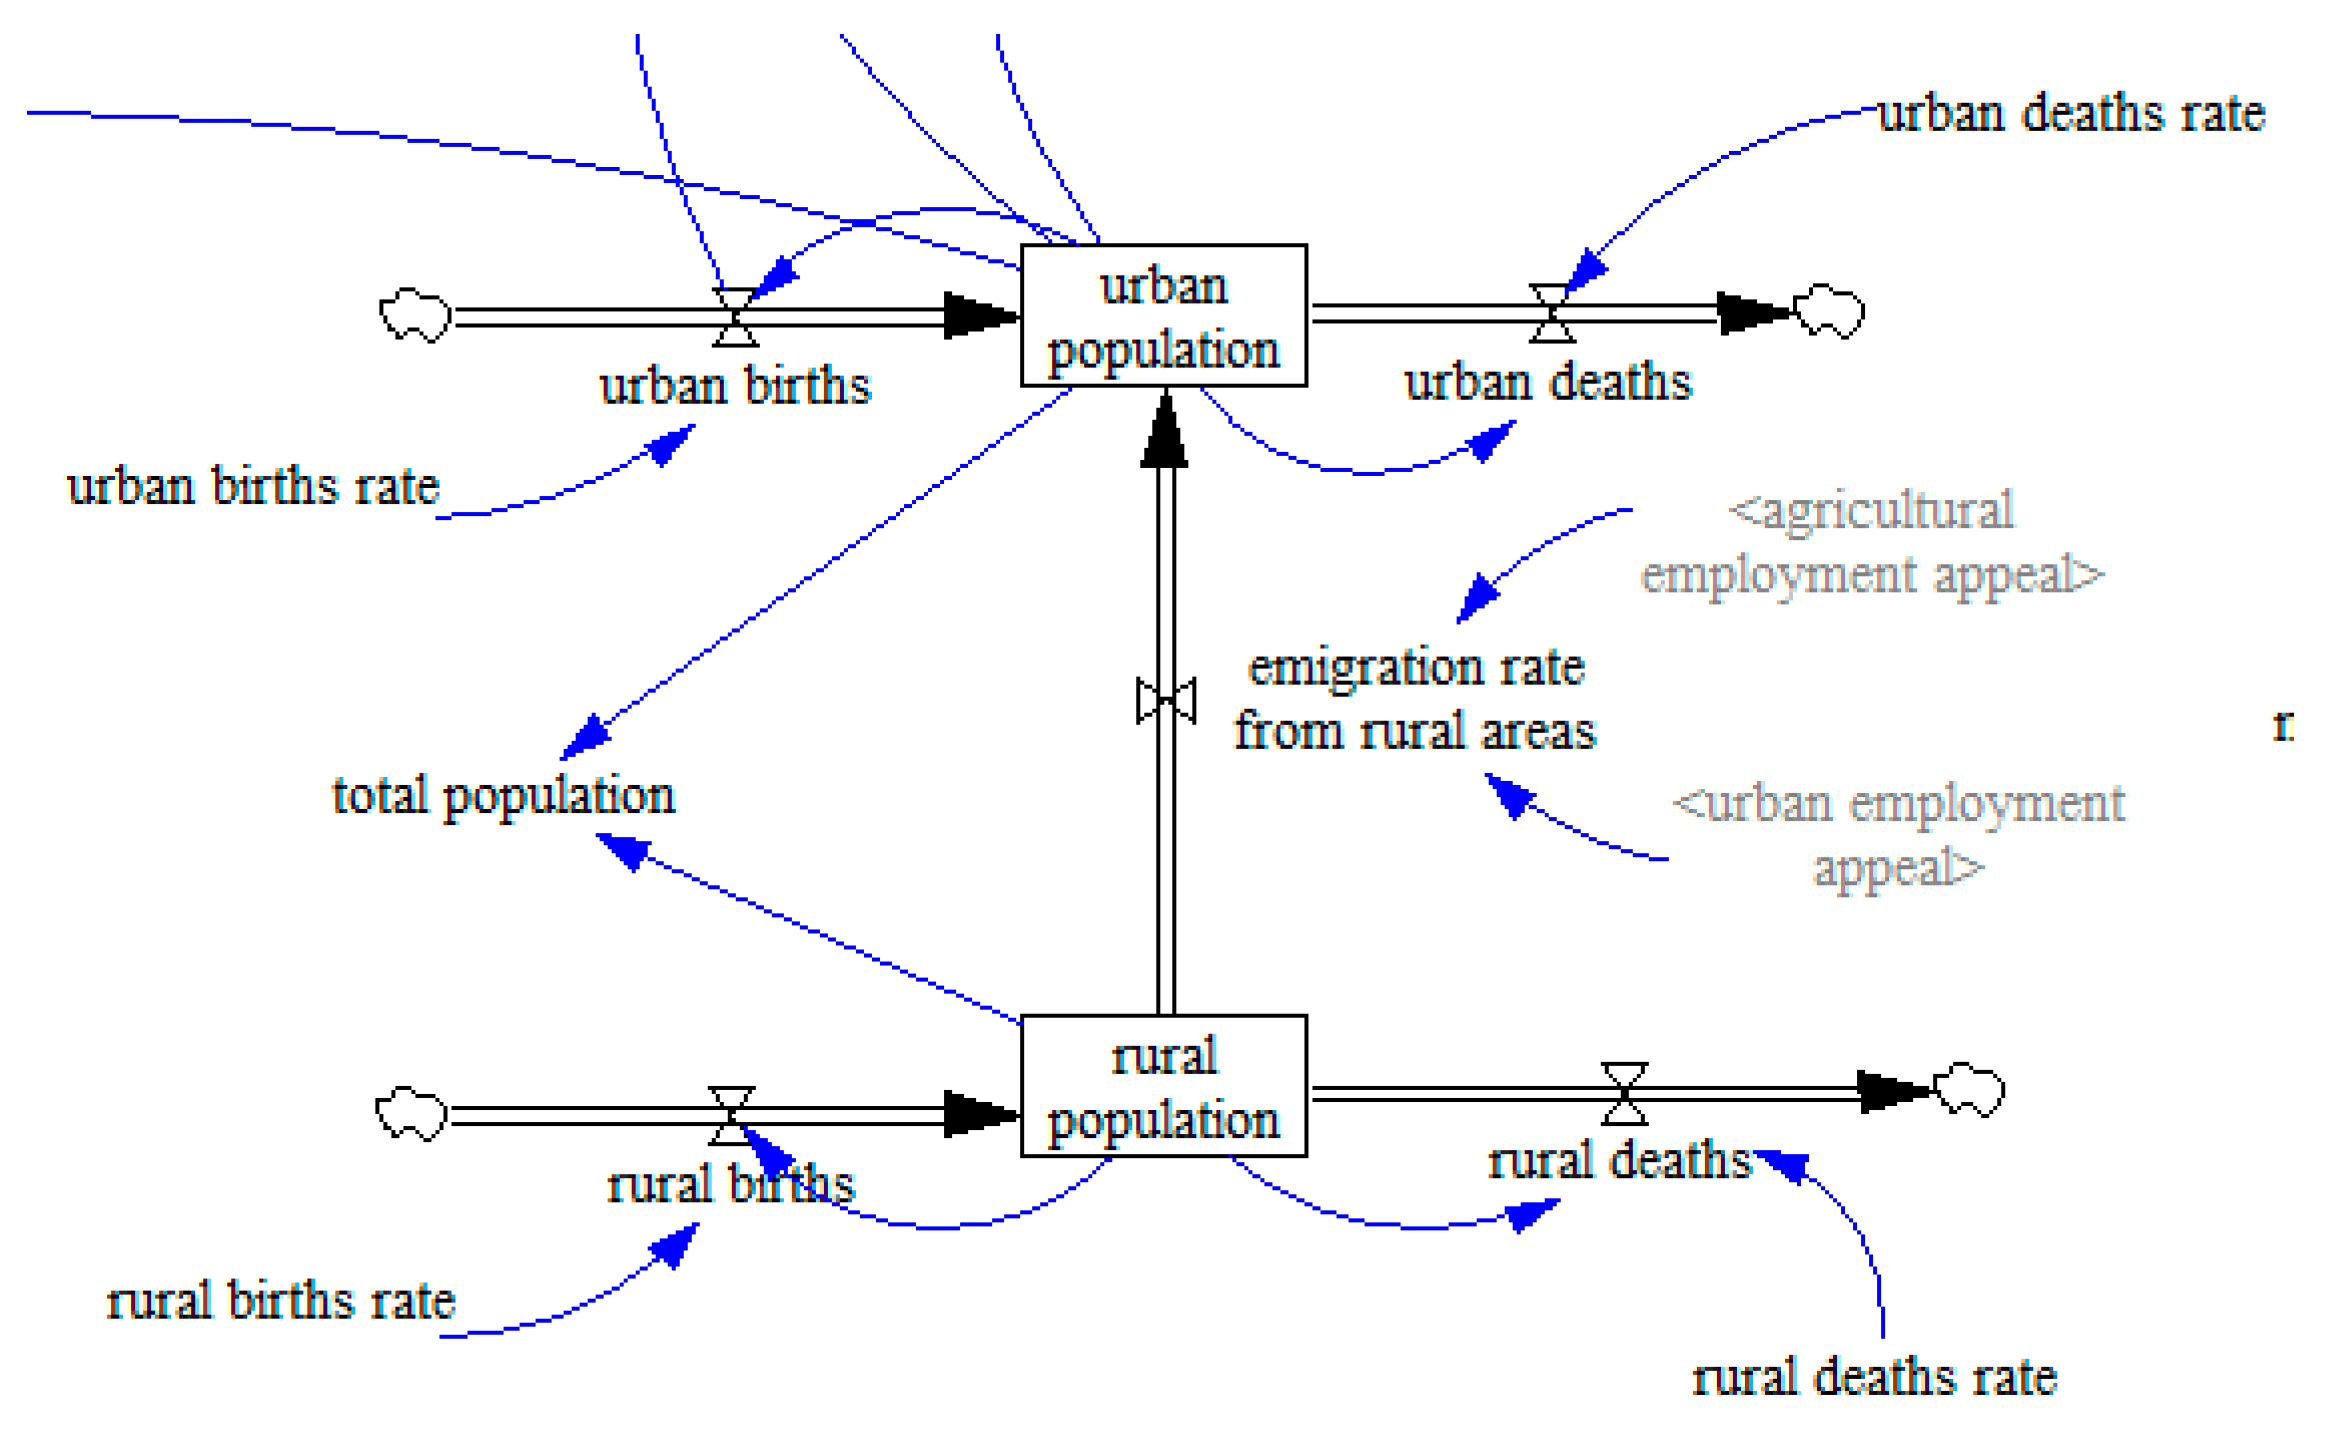
The stock and flow diagrams of the supply and distribution systems shows the main elements of the rural and urban areas including population driving food demand; farms trying to cover food demand with production; emigration flows from rural to urban areas and vice versa depending on the employment opportunities and family incomes. Modeling development assumed that a strong balancing loop act on the rural urban equilibrium and food demand could be a driver of rural growth at local level, boosting food security and rural development, having as main consequence the increase of employment rate at rural level and the achievement of an equilibrium in the rural-urban population flows.
Population dynamics included births, deaths and migration flows (
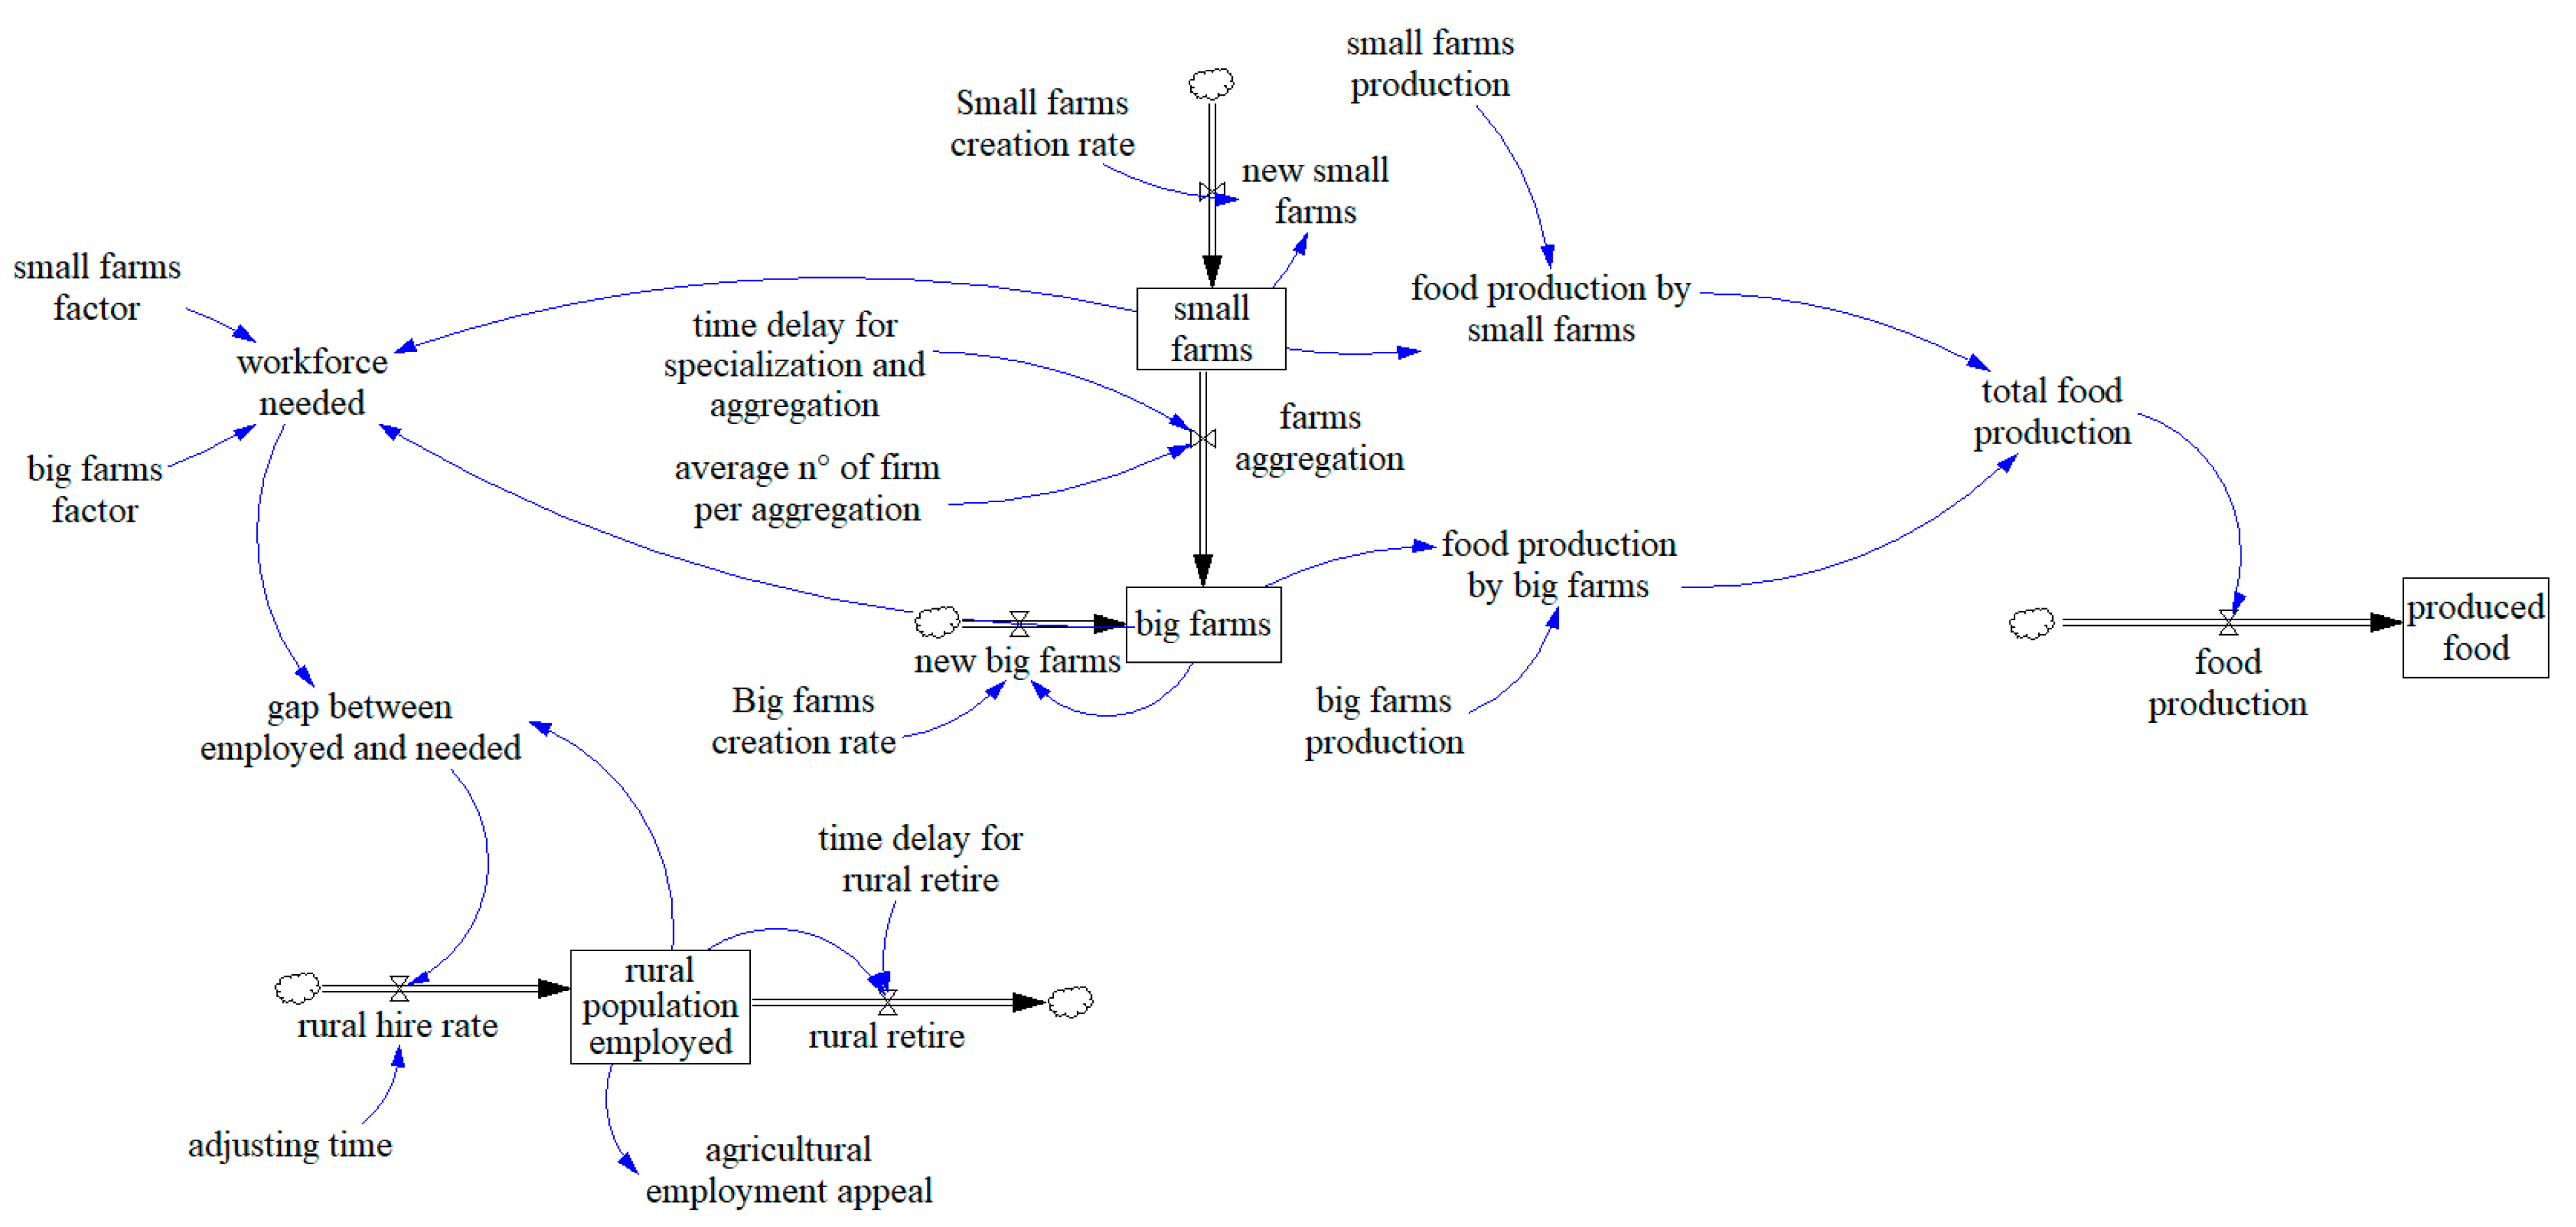
Figure 7). The population consumes food that is in part produced in the rural area. Food production in rural areas pulls labor needs, employments and growth of the agricultural and livestock farms both in size and in production levels. In the same way the food produced in this area must be sent to the city (
Figure 8), the creation of new small farms is also determined by the food security gap. The higher the gap the more pressure in the food production nearby the city. It assumes that food import form other regions and countries is not enough structured for the emerging markets and it must be even more effective for fast population growth in the cities.
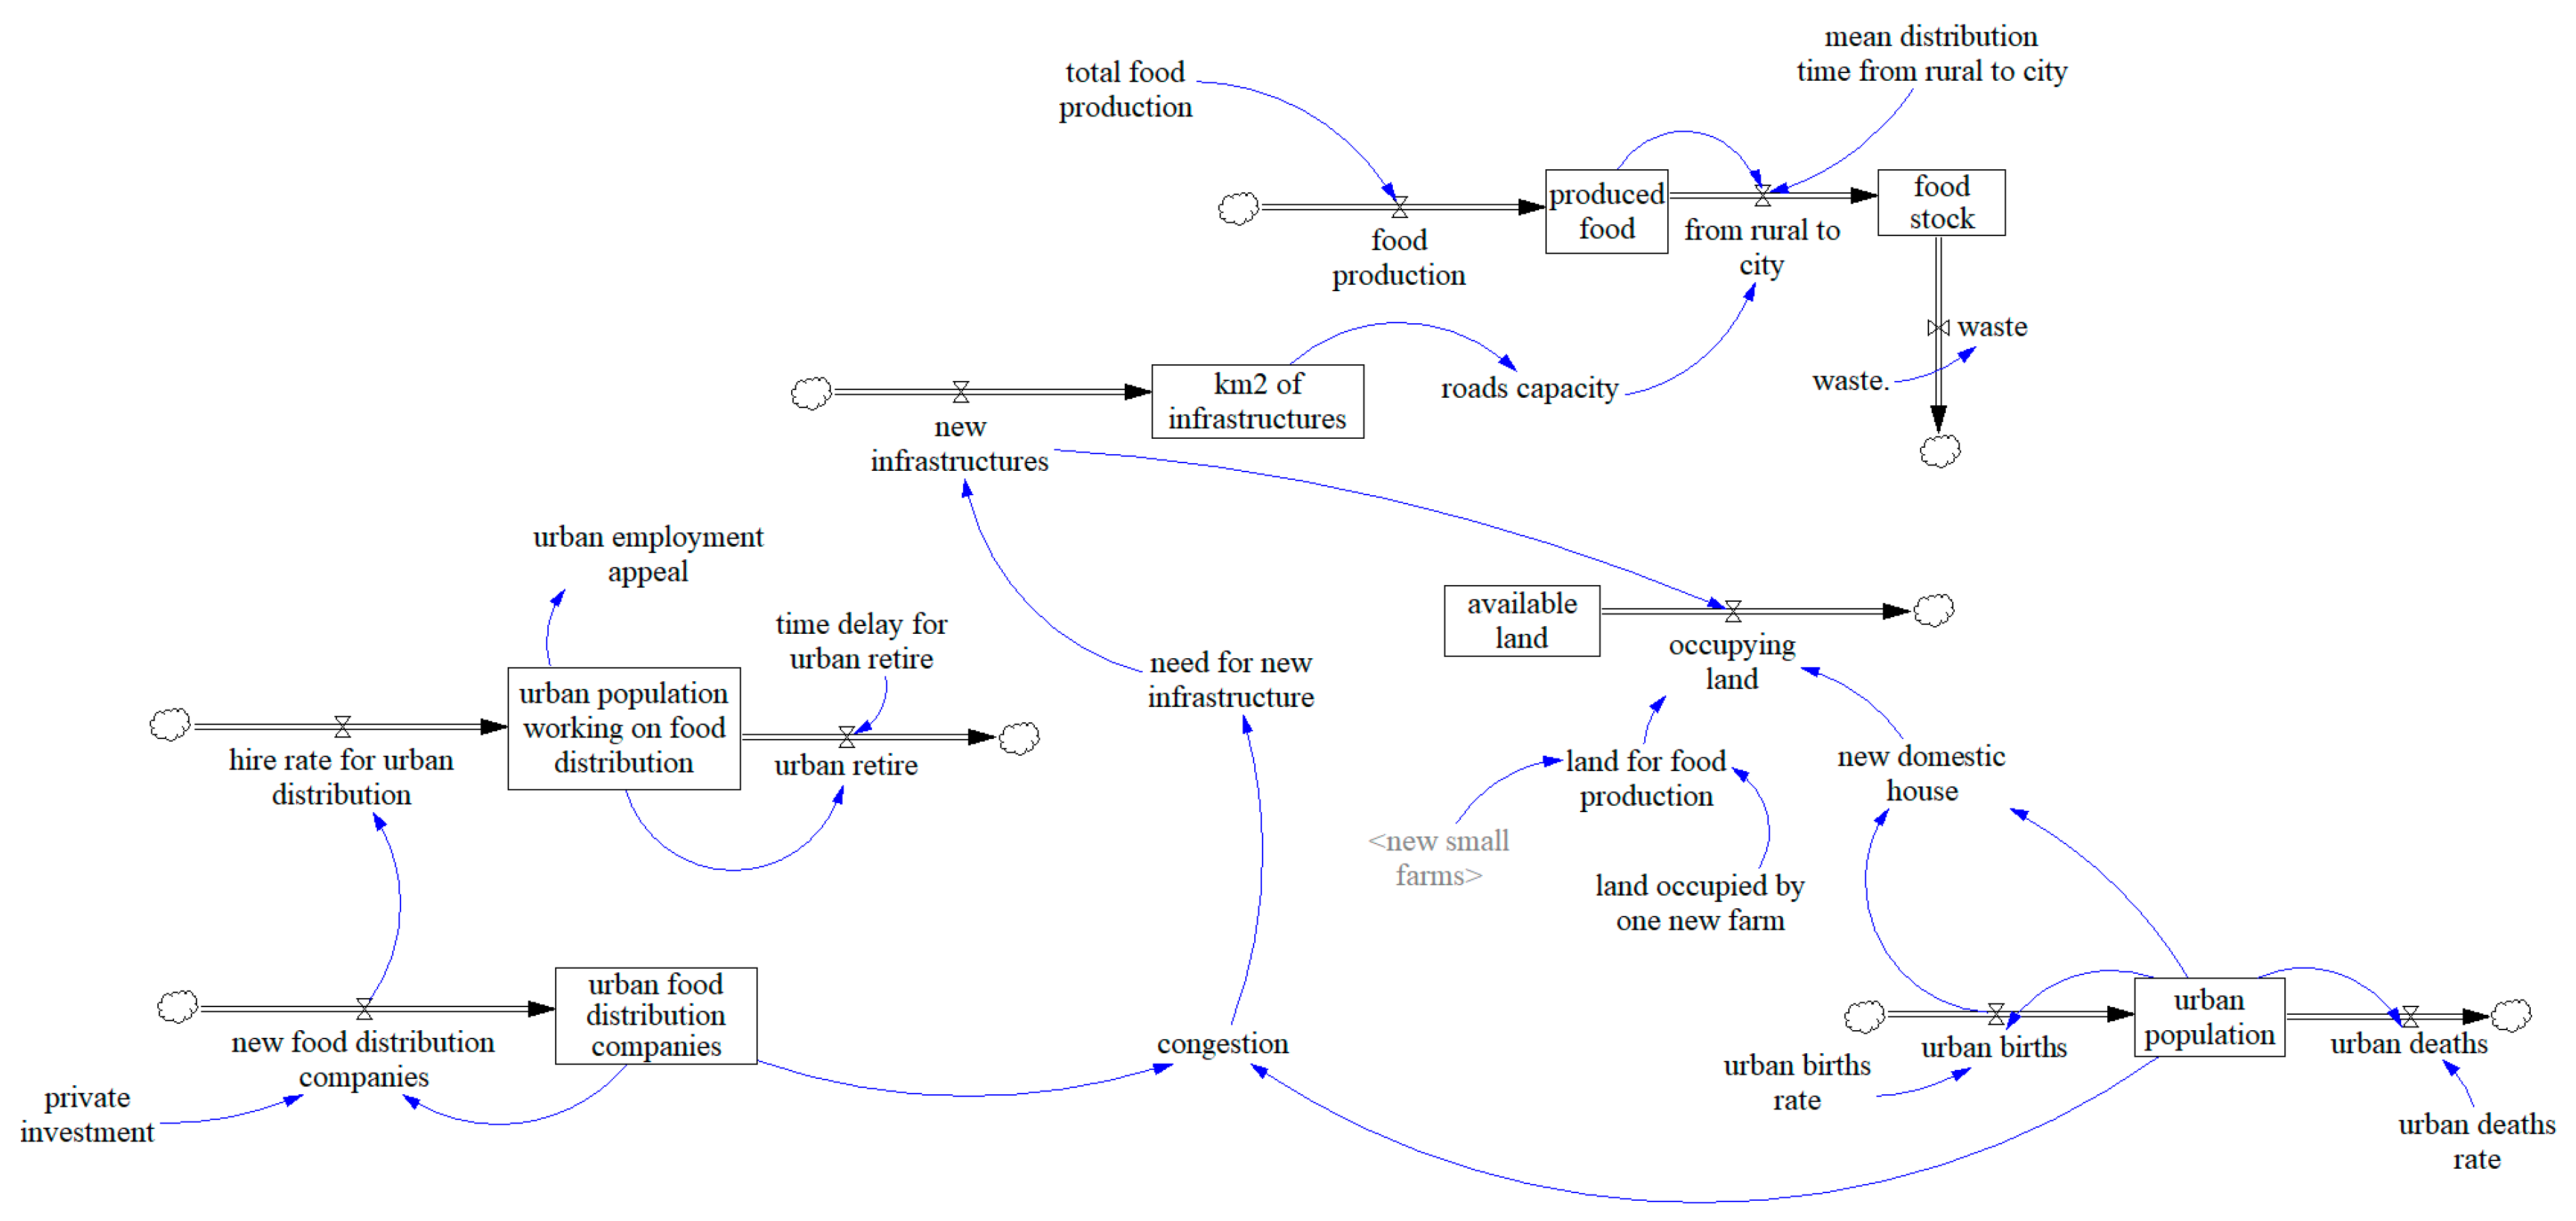
However, food production in the farms at local level is usually affected by environmental factors such as rain or droughts that might cause floods or dry periods with scarcity of feed availability for animals and lower production due to adverse climatic conditions. As well, soil conditions are affected, which is a variable that affects production not optimum for the crop, for this reason the average annual rainfall was taken into account. The operation of transporting food from the countryside to the city takes time, while in the city there are some companies responsible for the distribution of these foods with employment and growth needs according to the dynamics of the market and the population (
Figure 9).
The food production and consumption dynamics mainly depends on population growth in the city. It also generates waste. If the supply of food does not meet the demand, there is a need to bring food from rural areas (local production) or other region and countries (import) in order to cover the demand. In addition, the unequal distribution of food or lack of food supplies can cause malnutrition especially in children and young cohorts (
Figure 10).
4.2. Model Evaluation and a Preliminary Application in the Area of Bogota (Colombia)
The stock and flow diagram was then tailored to describe an application of this framework to the city of Bogota in Colombia relatively to the dairy sector and the milk production and consumption. Model settings included a time interval from 2005 to 2017 which represent the historical period with observed data for milk production in the area of Bogota. The production and consumption stocks were considered equal to milk production in the Bogota District and milk consumption in the city of Bogota. Differences among milk consumption and milk production were assumed to be imported from other Colombian regions or nearby countries. Model parametrization was performed using literature values as reported in
Table 3. The model was integrated with climate effects considering that milk production is highly affected by climate. Considering the air temperature quite constant in the region, rainfall was considered the most important variable affecting pasture production and animal performance, thus was integrated in the model. Data of rainfall were gathered from local sources (
Table 4). A comparison among milk production observed and predicted trends was then performed in terms of pattern of behavior.
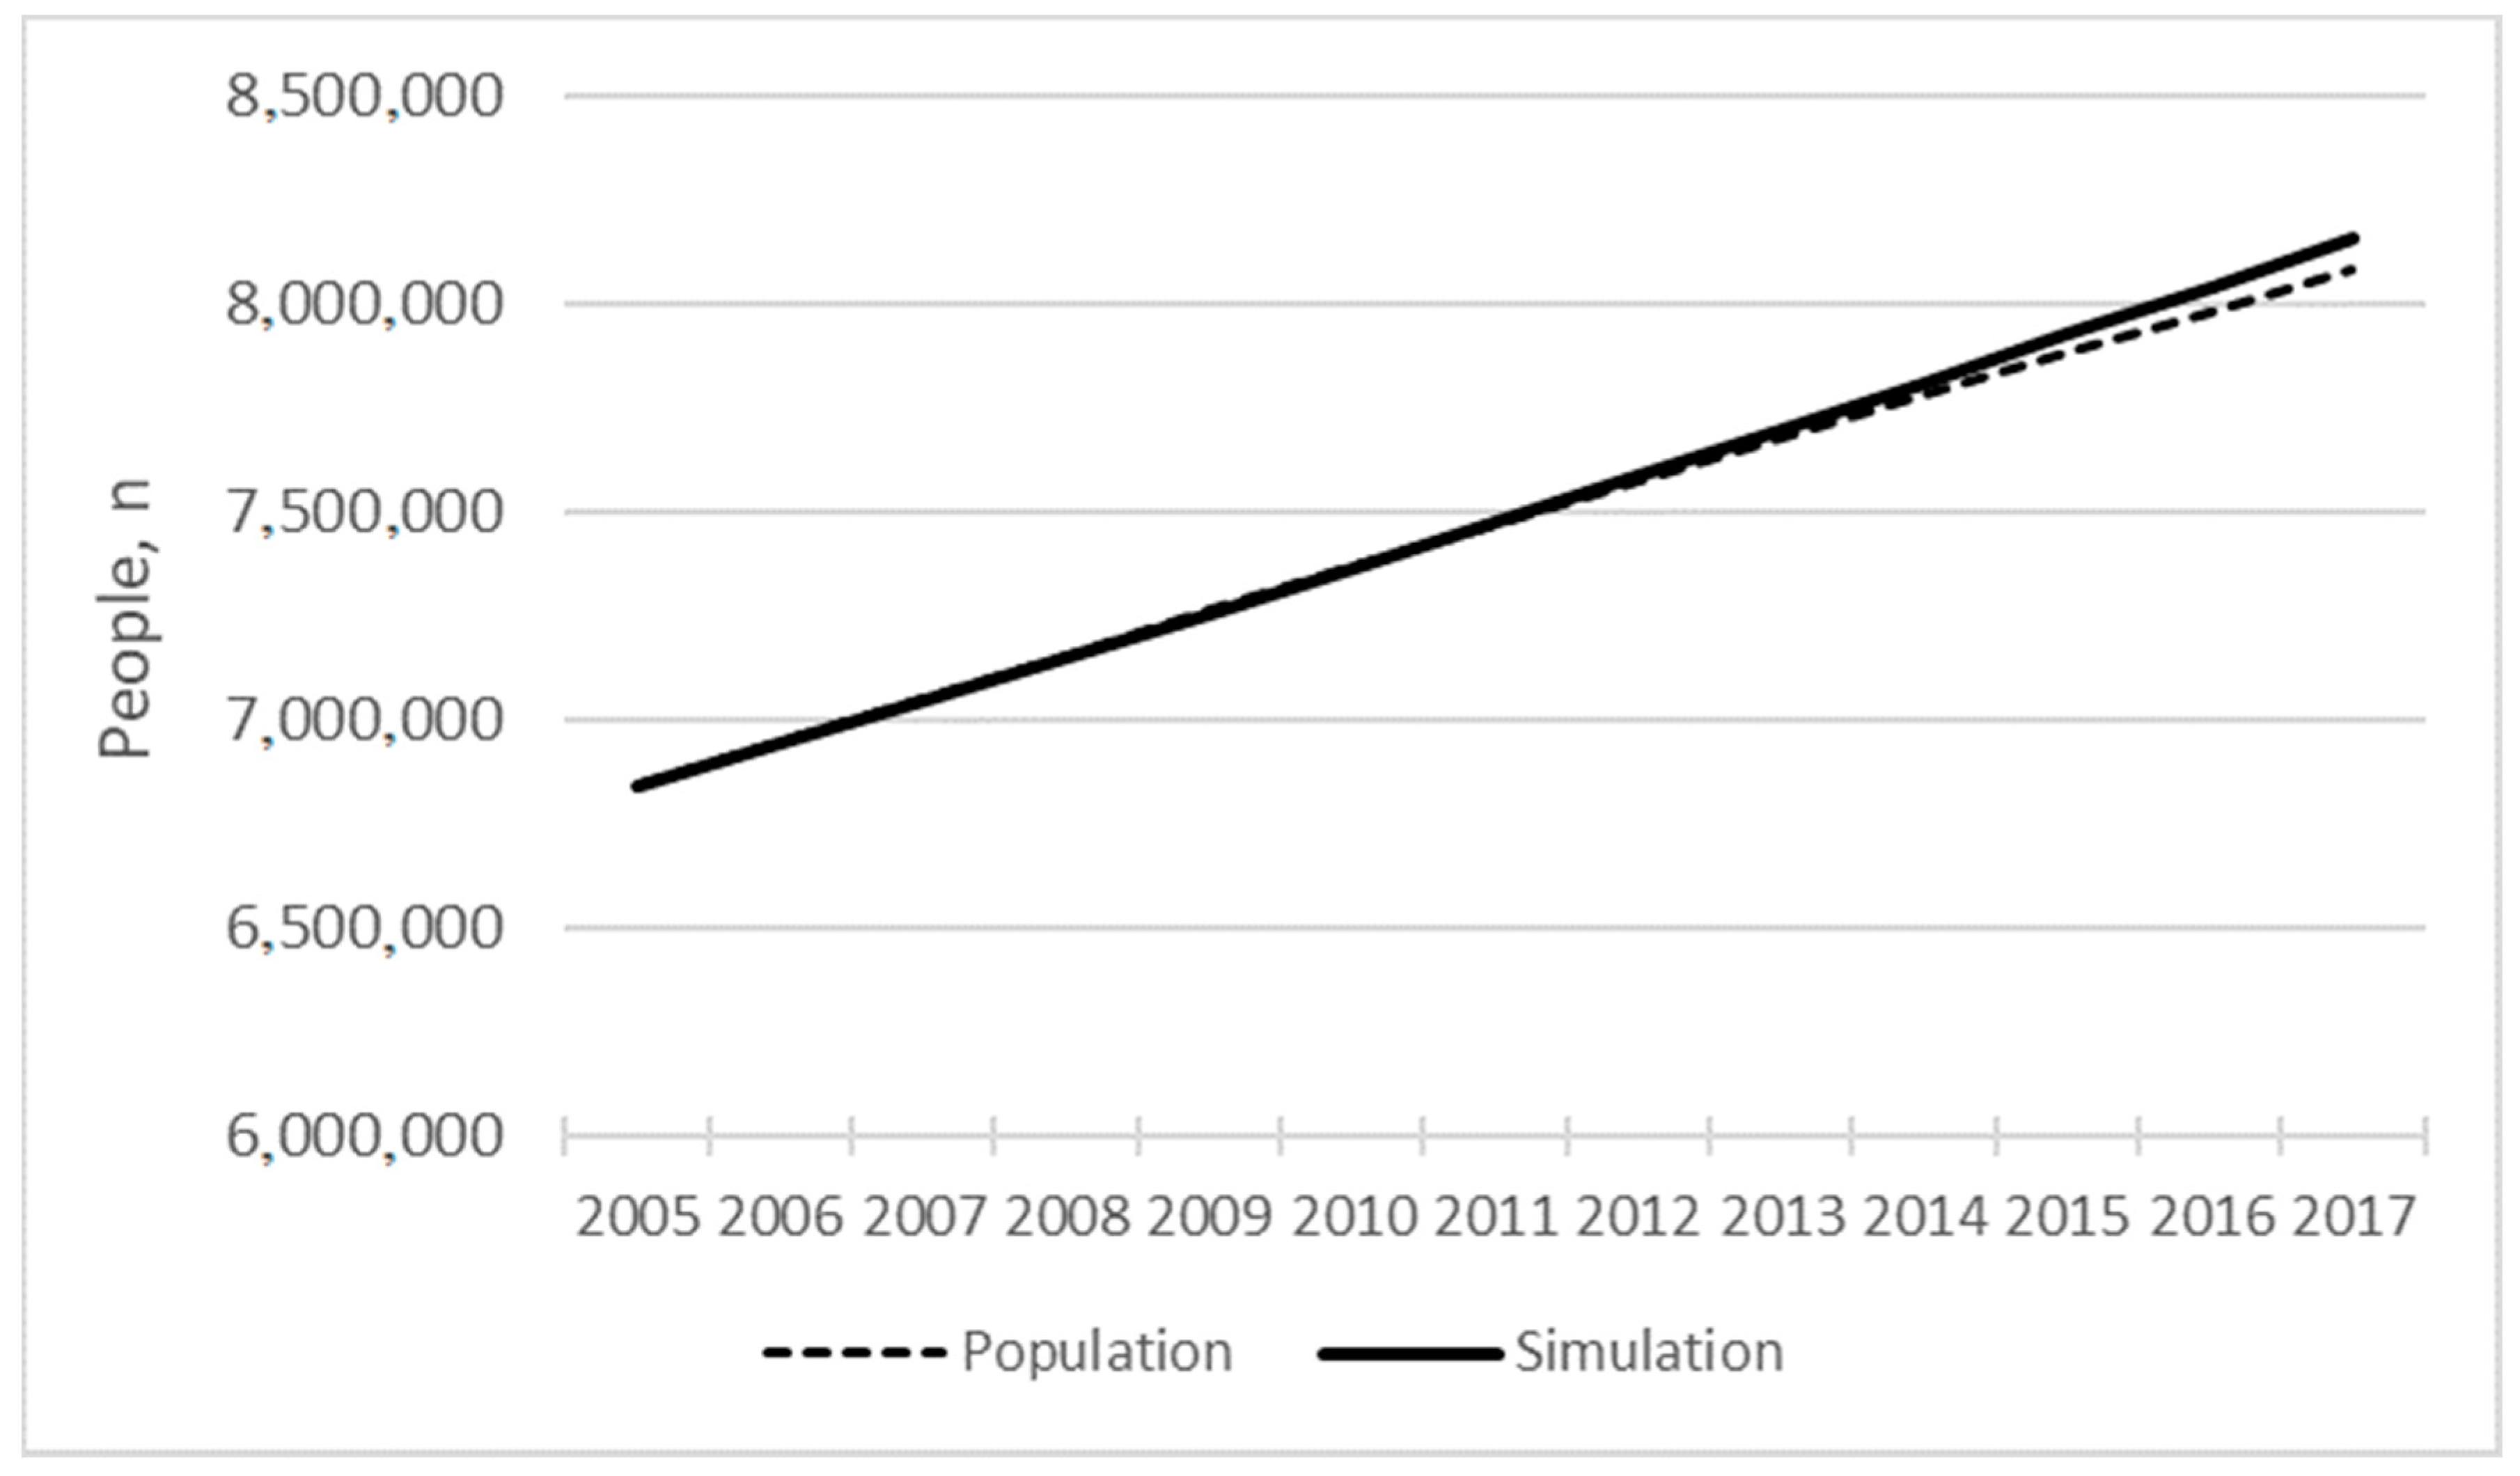
As mentioned, the developed model was populated with data from the city of Bogota considering several references to gather initial values of the model variables and simulation and also to get reference mode of the historical pattern of behavior. These reference values were used for a preliminary evaluation. For the calibration, two variables were used: the population and the milk production. Population data derived from the National Administrative Department of Statistics (DANE) from the year 2005 to the year 2017. Milk production data were taken from FAOSTAT (
www.faostat.it) for Colombia and from the Third Agricultural Census conducted by the Ministry of Agriculture and the DANE in Colombia, where it is stated that milk production in Bogota corresponds to 0.2% of national production (
Table 3).
As said, rainfall was considered the most important variable to account for climate effects on agricultural and milk production. For the rain data, the annual average in the city of Bogota was taken into account, for the same period of time, also for the production of milk (
Table 4). The rates included in the model for the population flows allowed to have a strong correspondence among observed vs predicted data (R
2 = 0.99;
Figure 11).
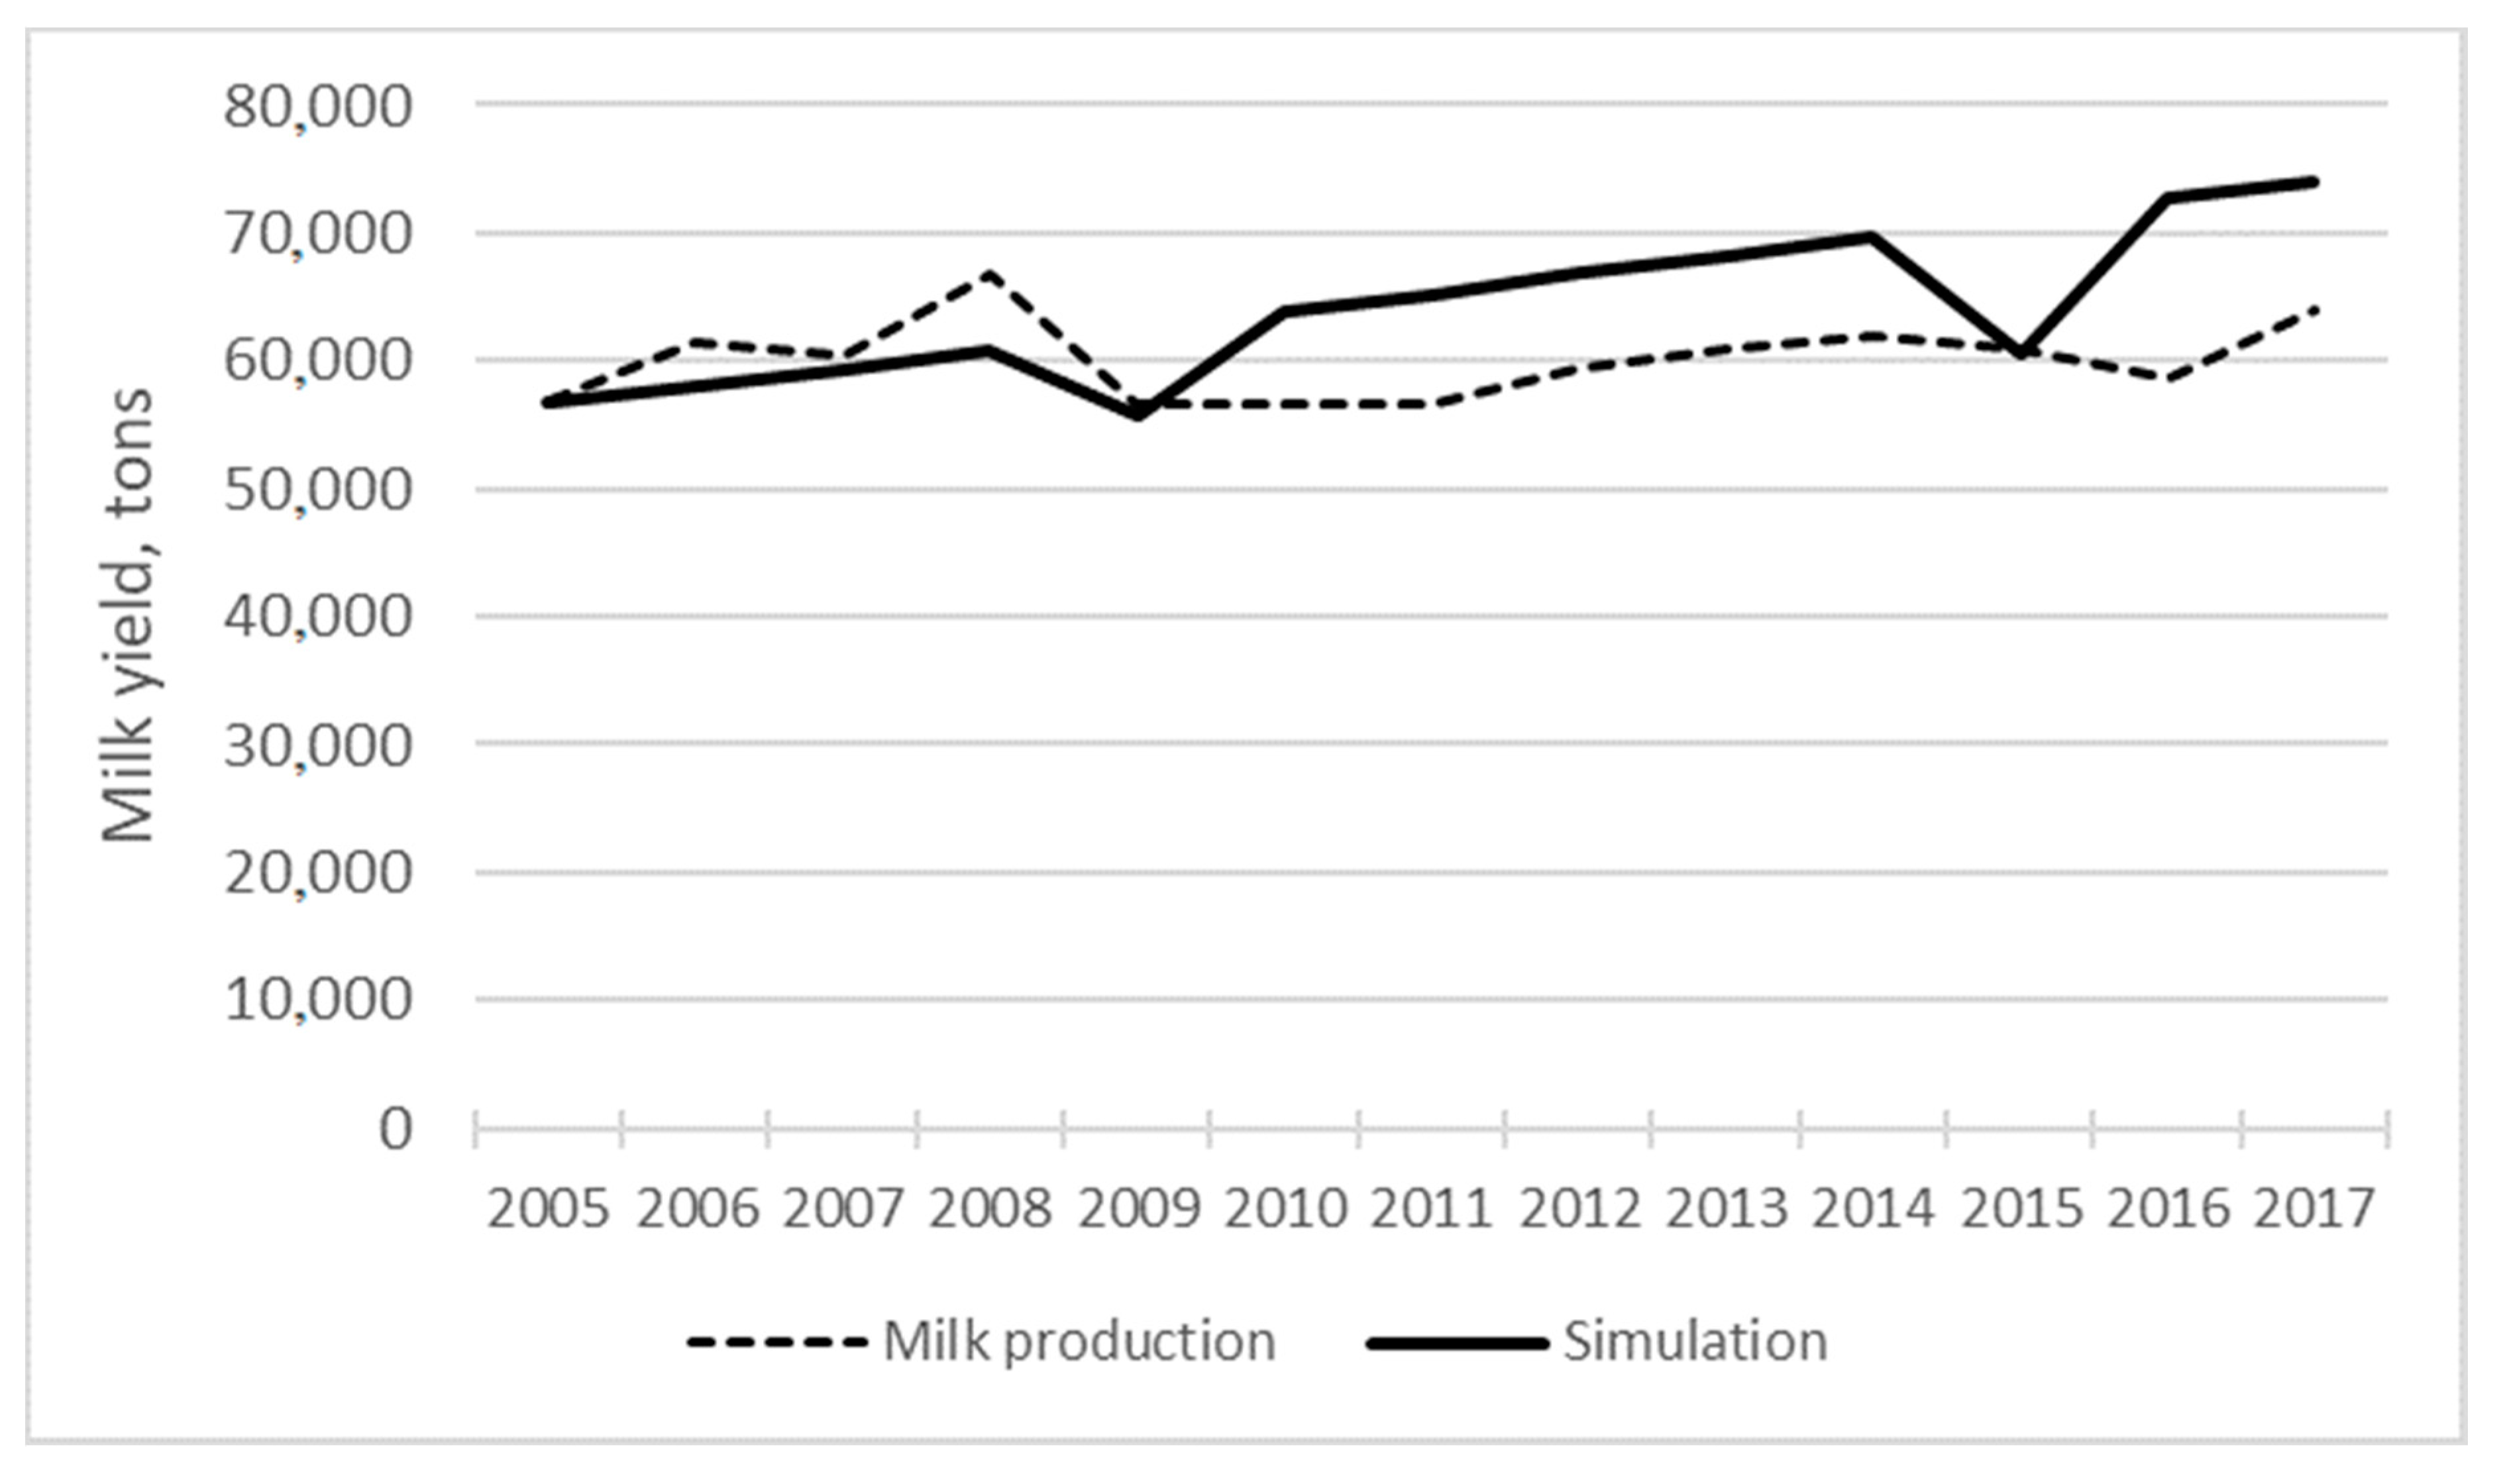
Simulated milk production pattern showed a similar trend to that observed indicating the model structure was able to capture the system elements that are responsible of the most relevant dynamics (
Figure 12). The milk market and dynamics usually have very complex dynamics and this model simply tried to address few aspects related with urban-rural dynamics.
From a policy point of view the model might give advice on how to stimulate the rural development and establish the equilibrium in the cities. It might happen by tuning the factors affecting rural and urban population and food production and supply dynamics. In our idea the food dynamics in the cities should be monitored and managed to boost local food production nearby to cities and favoring the rural employment and development.
The model applications have to be considered a preliminary extent of the quantitative model of the FFFA. The model reports in quantitative terms the main variables described in the causal diagram and fundamental to capture the complexity of the system behavior: limitations of the model have to be highlighted in terms of exhaustively and applicability. The model was originally built to increase complexity understanding in developing and transition countries which makes difficult to get reliable data from these areas to develop complete and exhaustive models directly applicable for policy formulations. This model version does not allow simulating and trusting predictions of future scenarios. Even though, at this level, it represents a simple application in the Colombia’s case, it allowed having a first running model that could be improved with specific sub-model testing.
5. Conclusions
FAO’s FFFA presents a variety of rural—urban situations as well as specific problems belonging to different stakeholders, institutional process and environmental and land dynamics, among which the urbanization process and its consequences were elicited as the most significant. This work allowed to map the complex relationships among the food system components as decisional support to answer the question “what would the optimal policy to meet urban food needs be?” and act with a systemic perspective to assess food policies. The identification of main stocks and dynamics of FSDS according to FFFA has been conceptualized in a causal loop diagram which connects the dynamics between land, population, distribution and production processes, resources and job dynamics. This work also allowed to link the food system components with the sustainable development goals of the Agenda 2030 (hence demanding intrinsically for a holistic and systemic approach) and improve the organizational efficiency of the food production and distribution processes, to increase the food supply to cities, also reducing costs and waste. One fundamental insight was that food-related policies are pushed and stimulated by the increase in food availability or food access gaps. The main consideration obtained from reading the FFFA diagram is that socioeconomic conditions and people dynamics drives the food equilibrium at urban level. Sustainability arises when integrated policies between rural and urban sides are considered and not only focusing on the city-food problem. Effective leverages on food systems aimed to minimize food gaps have to be indirectly obtained by tuning the policies applied in other sectors (land use, road logistics, job dynamics, urban dynamics, resource use efficiency, health, finance, etc.) and trying to enhance the synergies among rural and urban boundaries. SDG number 2 (Zero hunger), 3 (good health and well-being), 9 (Industry innovation and infrastructure,), 12, Responsible consumption and Production), and 15 (life on land) were found to be the fundamental SDGs related to the food systems and FFFA. Testing effects on these SDGs from the urban and rural policies formulated by institutional decision makers will return the main scenarios of the system viability and feasibility.
An applicative quantitative model was also presented in this work focusing milk production and consumption in Bogota using data from literature. The model showed that fostering local production of perishable food, like milk, in the area nearby the city could help to stimulate the filling of food security gap and at the same time to regulate part of the equilibrium among the rural–urban population especially improving socioeconomic sustainability of rural economies and generating employment and incomes. It also advantages the reduction of the emigration from rural to urban side.
Our findings are promising and suggest that institutions such as FAO and other key global stakeholders supporting sustainable food systems and good nutrition in the current urbanization era could promote the understanding of FSDS complexity for improving organizational capacities to ensure food security. Among the scientific community, multidisciplinary and co-disciplinary approaches are encouraged to develop quantitative models and sub-models of the proposed framework on the basis of FFFA, background and expertise.

 ,
, 


