Effectiveness of Molecules for Quantum Cellular Automata as Computing Devices


Department of Electronics and Telecommunications, Politecnico di Torino, Turin 10129, Italy
*
Author to whom correspondence should be addressed.
J. Low Power Electron. Appl. 2018, 8(3), 24; https://doi.org/10.3390/jlpea8030024
Submission received: 29 June 2018
/
Revised: 23 July 2018
/
Accepted: 26 July 2018
/
Published: 28 July 2018
(This article belongs to the Special Issue Quantum-Dot Cellular Automata (QCA) and Low Power Application)
Abstract
:Notwithstanding the increasing interest in Molecular Quantum-Dot Cellular Automata (MQCA) as emerging devices for computation, a characterization of their behavior from an electronic standpoint is not well-stated. Devices are typically analyzed with quantum physics-based approaches which are far from the electronic engineering world and make it difficult to design, simulate and fabricate molecular devices. In this work, we define new figures of merits to characterize the molecules, which are based on the post-processing of results obtained from ab initio simulations. We define the Aggregated Charge (AC), the electric-field generated at the receiver molecule (EFGR), the Vin–Vout and Vin–AC transcharacteristics (VVT and VACT), the Vout maps (VOM) and the MQCA cell working zones (CWZ). These quantities are compatible with an electronic engineering point of view and can be used to analyze the capability of molecules to propagate information. We apply and verify the methodology to three molecules already proposed in the literature for MQCA and we state to which extent these molecules can be effective for computation. The adopted methodology provides the quantitative characterization of the molecules necessary for digital designers, to design digital circuits, and for technologists, to the future fabrication of MQCA devices.
1. Introduction
The high switching frequency associated to the reduced power dissipation, which is ensured by the absence of electrical conduction, is the most attracting feature of Molecular Quantum-dot Cellular Automata (MQCA) [1,2] that proposes it as a potential emerging technology for computation. A second fundamental expectation relies on their molecular nature, a feature that paves the way to fabrication methods which overcome the lithography limitations and enables the use of molecular assembly.
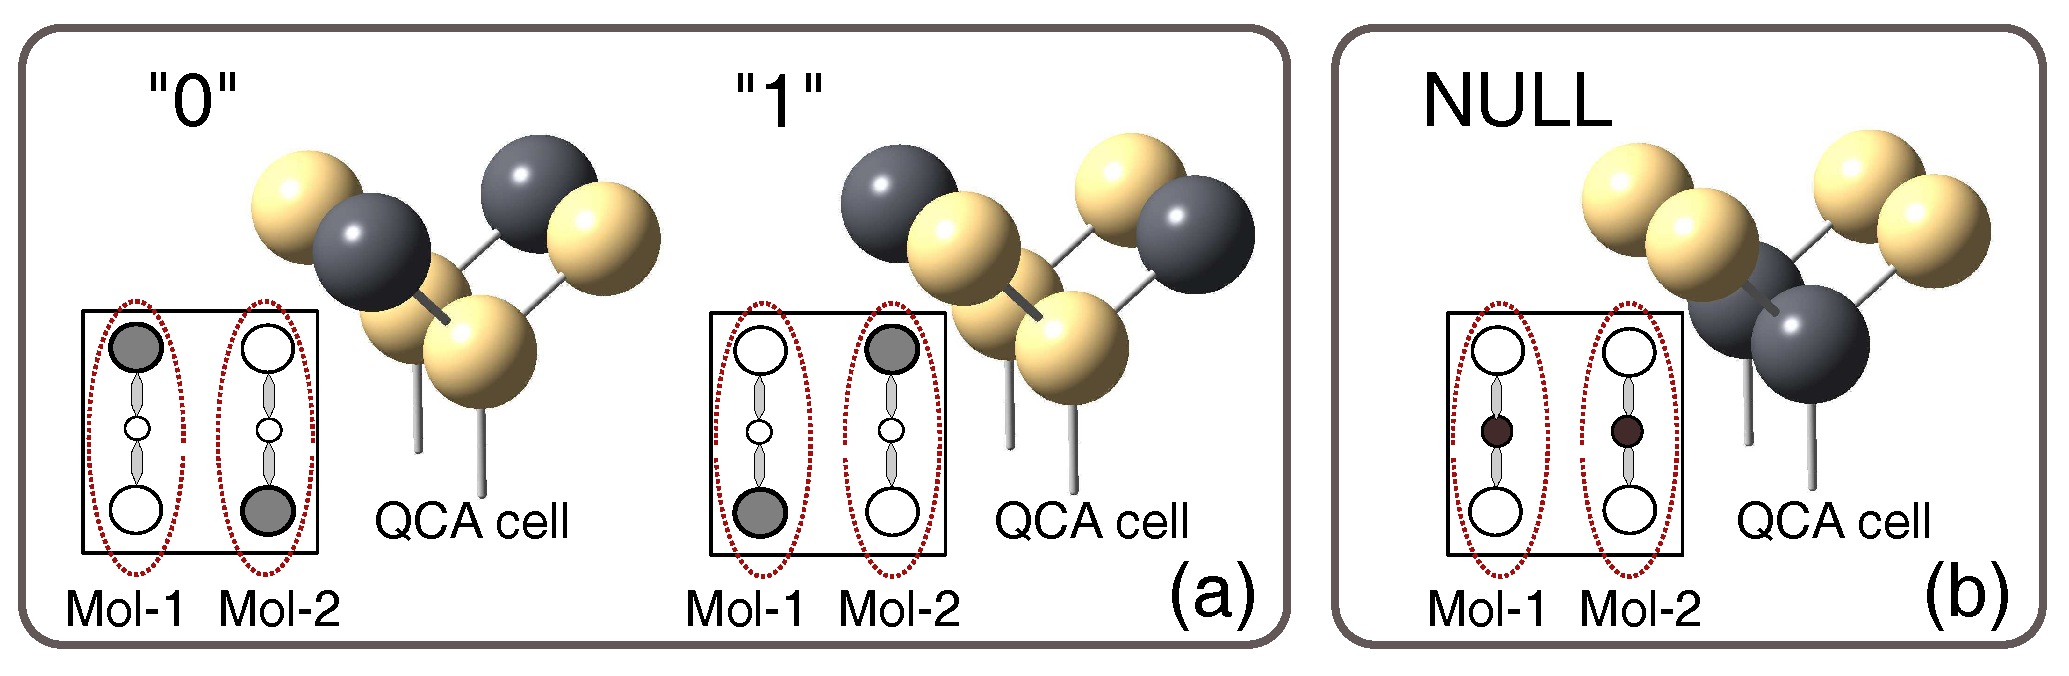
Ideal QCA cells are composed of six quantum dots iand two electrodes. The two electrons are forced to stay in the cell and can occupy all the six quantum dots; the position of electrons in the dots, and thus the distribution of charge, encode the binary information. Figure 1 shows the possible three configurations of a QCA cell. Logic states 0 and 1 (dark circles represent the occupied dots) are encoded when the electrons occupy the antipodal dots; the third state, named NULL, is encoded when the electrons occupy the central dot. The NULL state does not encode logic information, but it is necessary to favor the switching between logical states [2]. Thanks to the confinement of charges in the cell, electrons do not leave the cell. The interaction between neighboring cells is provided by the electrostatic repulsion among electrons which encode the logic states assumed by adjacent cells. It has been shown that it is possible to obtain complex computation systems by organizing QCA cells in specific layouts [3]. For example, by aligning cells on a line, it is possible to obtain QCA wires that propagate the logic information from a point to another [4,5]. When the input cell is switched from 0 to 1, the following cells arrange their charge distribution to minimize the electrostatic repulsion, reaching a minimum energy condition. The logic state of each cell in the wire changes from 0 to 1 in a “domino”-like way. No electrical current is involved in the propagation of the logic information; this property limits the power consumption and represents the most interesting feature of these devices, especially if compared to scaled CMOS circuits and their current trend in terms of power dissipation [6]. Section 2 will clarify further backgrounds on MQCA.
From the literature analysis, a very important and critical point arises: the lack of tools and methodologies to analyze MQCA potentials as effective devices for computation. Molecules are normally analyzed using ab initio calculations that provide results fundamental to deeply understand the physical–chemical behavior of molecules. However, ab initio simulations are computationally expensive and the obtained results are far from the quantities necessary to understand the capabilities of a system of molecules as computing device; not to mention their usability in tools normally used to design and simulate complex logic circuits.
Some analyses have been performed by Lent and coworkers to match the molecular device with the methodology used for standard QCA cells [4] by approximating a molecule as a two-state system [7], without considering the NULL dot, or a three-state system [8,9] also considering the presence of the third dot. These approximations are based on the principles of quantum mechanics and provide a good description of molecules for QCA paradigm.
In this paper we want to enrich the methodology adopted for the study of MQCA technology on the electronic engineering side. We introduce new figures of merit which characterize the molecules and provide precise quantitative information on the effective electrostatic behavior. The quantities are thought to be used by electronic designers, with the aim of designing digital circuits, and to technologists, with the aim of fabricating the devices.
Filling this gap between the fully physical methodology and the engineering world is mandatory to really put MQCA in competition with CMOS technologies and with, especially, other emerging technologies. Only when a complex circuit can be really designed and simulated maintaining a strong link with the technology and with the physical behavior of the device, only then, MQCA can be assessed as a potential competitor in the emerging technology scenario.
In this paper, we define new figures of merits such as the Aggregated Charge (AC), the electric-field generated at the receiver molecule (EFGR), the Vin–Vout transcharacteristics (VVT), the Vin–AC transcharacteristics (VACT), the Vout maps (VOM) and the MQCA cell working zones (CWZ). The figures of merit are defined and described in details in Section 3; we analyze, using the figures of merit, the information that can be derived from the molecule to evaluate its effectiveness as computing device.
2. Background: Molecular QCA
In terms of physical implementation, metallic and magnetic solutions, that successfully demonstrated the QCA principle, were presented in [10,11]. However, according to the Lent theory [2], the best implementation of the QCA cell, in terms of performance and size, is the molecular cell, as discussed herein. The molecular implementation enables the production of uniformly sized devices [7] and it promises very low power consumption at very high frequency and ambient temperature [12].
In the molecular implementation, a QCA device is represented by a system of molecules having redox centers acting as QCA dots. A redox center is a site of the molecule favorable for attracting or releasing an electron, becoming negatively or positively charged respectively. In order to enhance the performance of the MQCA cell, the molecule should be considered in the oxidized or reduced form. In the former case, one electron is missing and the molecule has a net positive charge; while in the latter case an additional electron is available and the molecule has a net negative charge.
Usually, both reduction and oxidation are chemically performed during the molecule synthesis process, introducing in the solution an element that acts as counterion. The counterion is responsible for attracting (or releasing) an electron from (or to) the molecule during the oxidation (or reduction) process, becoming negatively (or positively) charged. In this way, the molecule and the counterion form a neutral system. Another possibility to oxidize or reduce a molecule is given by the cyclic-voltammetry (CV); with this method, the redox processes are performed electrically requiring though to work in a liquid solution.
The standard QCA cell has four logical dots, which are used to encode the information, and additional dots for the encoding of the NULL state. Considering a molecule with three redox centers, as sketched in Figure 1, it represents a half cell since it has not enough dots to implement a complete standard QCA cell; two molecules can be juxtaposed to implement the complete QCA cell.
In the Molecular QCA, the logic encoding is obtained thanks to the localization of the oxidation/reduction charge on one of the molecule dots. In Figure 1 the filled circles in the square-shaped box, or the gray spheres in the molecule cartoon, represent the dots occupied by the free charges. When the charges are localized along one of the two diagonals, logic states “1” and “0” are encoded. Forcing the free charges to occupy the central molecule dots; as shown in Figure 1b, it is possible to implement the NULL state, which is used to synchronize the propagation. The clock consists in an electric field that can move the charge to the NULL dot, making the adiabatic propagation possible. The in-depth analysis of the clock issue is out of the scope of this paper; we then refer to the literature for any further explanation [13,14].
In the literature, several molecules were presented as QCA candidates [8,13,15,16], two or more redox centers represent the dots. All these molecules are ideal systems, because they perfectly satisfy the theoretical QCA properties, but are not easily synthesizable. In addition, these molecules have been almost studied in the vacuum and do not have the possibility to be bound to a substrate to perform a real experiment. More recently, some other molecules which are based on diboryl monoradical anions have been proposed [17]. Some research is also devoted to the study of molecular QCA devices based on the actin protein [18,19]. Unlike the metallic and the magnetic cases, only one experimental attempt has been carried out on a mixed-valence complex [20], measuring a charge transfer within molecules in a film. However, a molecular QCA prototype has not been fabricated yet.
In this work, we describe a new methodology for the analysis of molecules as the basic block of MQCA devices and circuits. Therefore, we perform a comparative analysis among three molecules: the diallyl-butane and the decatriene, which have been proposed by Lent and his coworkers and are often used as a reference in the MQCA literature [8,15], and the bis-ferrocene. This latter molecule has been synthesized ad-hoc for MQCA technology [21,22] and already discussed as possible QCA candidate [5,23,24,25,26]. In particular, the authors in [25] presented a preliminary study which demonstrates the possibility to use a simple quantity (The Aggregated Charge, figure of merits which will be analyzed in detail in Section 3) to describe the molecule as computing device. In this work the evaluation of this figure of merits is refined and all the consequential figures of merits are presented.
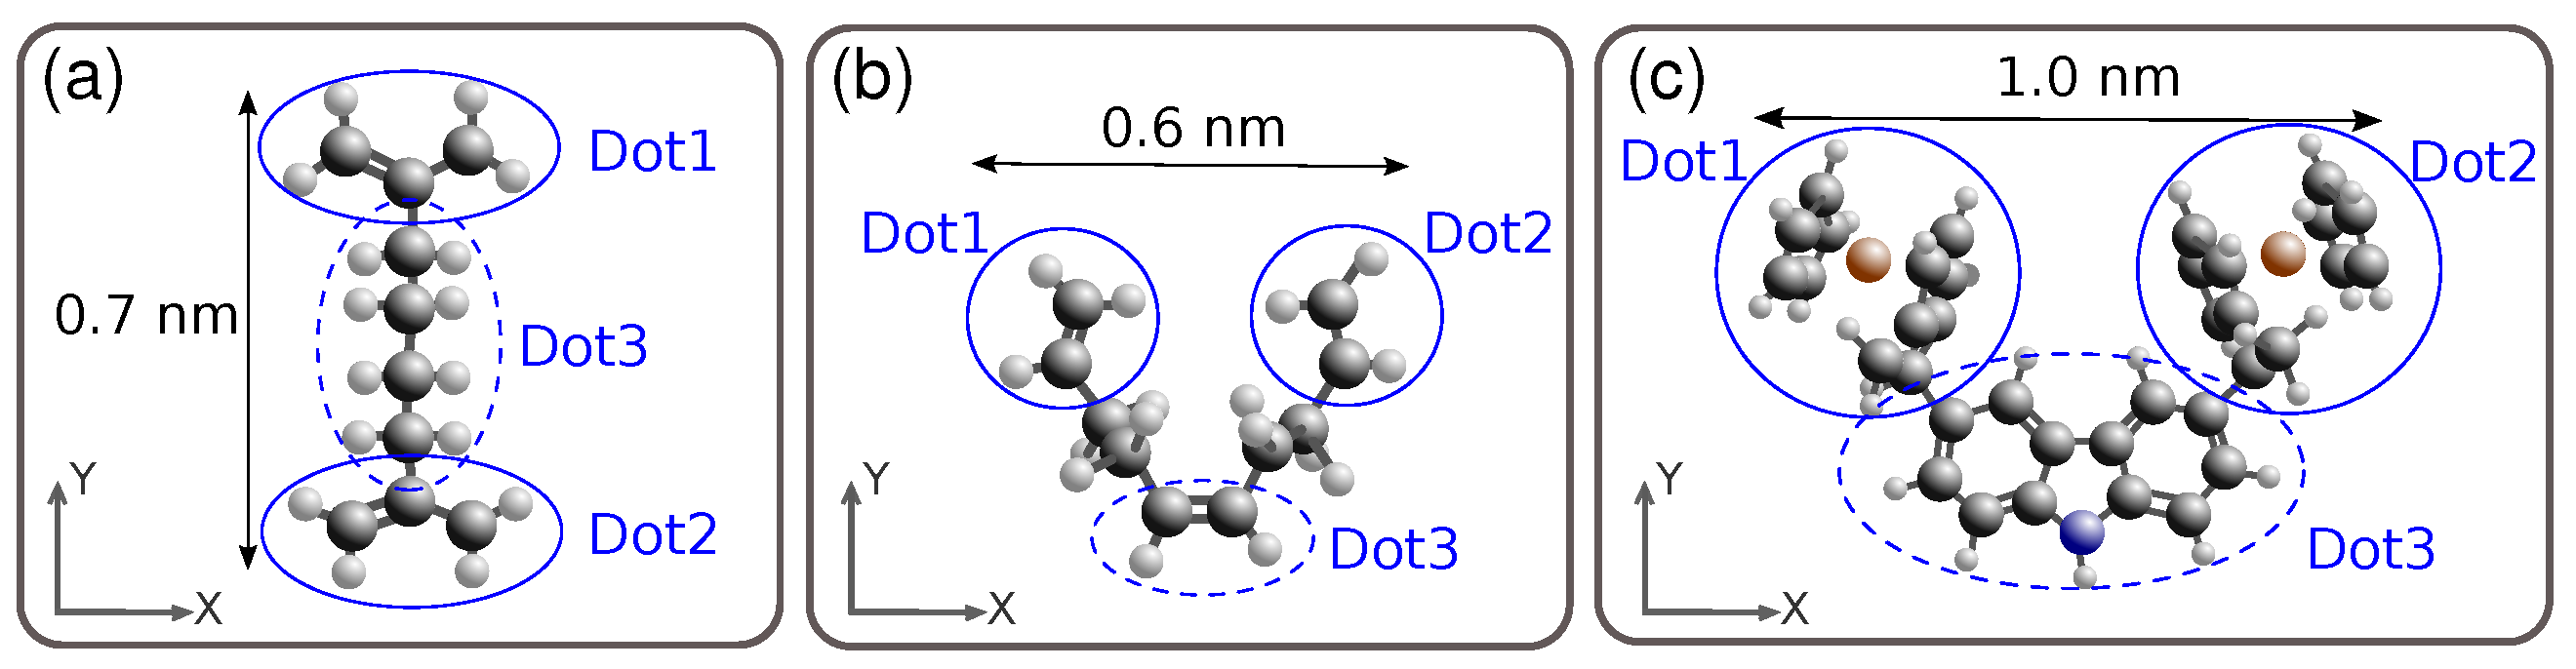
Figure 2a shows the structure of the diallyl-butane molecule. It was proposed as a two-dot molecule [15], whose dots are represented by the allyl groups, circled in the figure, and named hereinafter as Dot 1 and Dot 2. In this figure, we sketched also a fictitious third dot (dotted circle) to facilitate the analysis of charge balancing. The length of this molecule, defined as the distance between the two main dots, is nm.
Figure 2b shows the structure of the decatriene molecule [8]; this molecule has three real dots represented by three ethylene groups. The two top dots represent the active dots used to encode the binary information (Dot 1 and Dot 2), while the third central one is related to the clock issue [27] (Dot 3). The length of the molecule is nm.
Figure 2c shows the structure of the bis-ferrocene molecule [21,22] where three dots are present. The two ferrocene groups represent the working dots (Dot 1 and Dot 2) while the carbazole bridge act as the central dot, named (Dot 3). The lenght of the bis-ferrocene is nm.
All these molecules implement a half QCA cell, therefore, it is necessary to align side by side two molecules (as shown in Figure 1) to build a complete MQCA cell. In particular, for an ideal square-shaped QCA cell, the two molecules should be placed at a distance which is 0.7 nm, 0.6 nm and 1.0 nm for the diallyl-butane, the decatriene and the bis-ferrocene respectively. These values, named ideal intermolecular distances, coincide with the distances among corresponding active dots (redox centers).
3. Methodology: A Quantitative Approach for MQCA Characterization
The methodology used in this work is named MoSQuiTo (Molecular Simulator Quantum-dot cellular automata Torino) and has been introduced with a preliminary approach in [28], with the aim of making possible the study and the analysis of large molecular systems. This study would not be feasible using pure ab initio analyses. In the present work, we complete the MoSquiTo methodology refining and analyzing the previously introduced figures of merit [28]; we define new figures of merit and we introduce a third stage with the aim of studying the molecule interaction at the system level. The complete methodology is composed of three stages that are discussed below: ab initio simulation, post-processing of ab initio simulation and system-level analysis.
- Ab initio simulation: accurate ab initio simulations based on quantum chemistry, are performed to analyze the electronic structure and the physical properties of the molecule. External stimuli are inserted in the simulation to study the molecule in different conditions: electric fields and point charges emulate the synchronizing clock, switching fields and driver.
- Post processing of ab initio simulation: from ab initio simulations we derive the key features, as figures of merit, describing the electrostatic behavior of the molecule which are used to describe the interaction with other molecules and to provide the quantitative information necessary for the analysis of molecular circuits. The figures of merit encase all the physical-chemical properties of the molecules in quantities which can be used by engineers to understand, simulate, design and fabricate MQCA devices.
- System-level analysis: the figures of merit defined in the second step of MosQuiTo enable the study of molecular circuits at the system level. The information propagation in MQCA circuits can be evaluated considering parameters which are closer to the electronic engineering techniques: the engineer does not have to deal with the physics of the device and can analyze it from a higher level of abstraction. An algorithm for the evaluation of molecular propagation in large MQCA circuits, which exploits the figures of merit, has been developed and published in [29].
Our analysis focuses on the evaluation of two main aspects: (i) the switching capability of the molecules when subjected to an electric field generated by external electrodes or other molecules; (ii) the effectiveness of the switched molecule in potentially influencing the nearby molecule, and the effectiveness in transferring the information. We thus define new macro-quantities, derived by the post-processing of ab initio results: simple quantities provide a complete characterization of molecules when embedded in real systems. These figures of merit are presented and discussed in the following sub-sections.
Since this work is mainly focused on the validation of the figures of merit, it is necessary to specify the approach used for the first stage. Gaussian09 is used for ab initio simulations [30]. All the results reported here are computed using the HF theory with the STO-3G and 6-31G basis-sets for the diallyl-butane and decatriene, respectively, as reported in [8,13]. For the bis-ferrocene, the DFT/B3LYP theory was used to better consider the electron correlation, as suggested in [22] and the LANL2DZ basis-set is used to better consider the presence of iron atoms [31]. Both the neutral and the cationic form (oxidized molecule) of the three molecules will be considered in this work, to assess whether the oxidation process is necessary or not.
3.1. Aggregated Charge (AC)
The localization of the charge in the molecule and the capability of the molecule to electrostatically interact with nearby molecules are the two key features which are required for the encoding and the propagation of the information. Therefore, the charge distribution of the three molecules is the most important quantity for the description of the information encoding and propagation.
Definition AC: We compute the atomic charges of the three molecules using the ESP approximation [32] and we define the so-called Aggregated Charge (AC) of the dots simply by summing the charges of the atoms constituting the dot, as shown in Figure 2a–c for the three considered molecules.
The Aggregated Charge distribution is defined as the first figure of merit and it is used in this work as the starting point for the definition of the other figures of merit which characterize the electrostatic properties of the molecules.
The Aggregated Charge distribution can be also used to evaluate, with good precision, the dipole moment, which is often used in the literature to analyze the effectiveness of molecules [15,16]. It states the polarization of the molecule, therefore, it can be correctly used to define the logic information encoded in the molecule i.e., in the MQCA cell: given the set of molecule Aggregated Charges associated to the positions , the dipole moment can be calculated with respect to a reference point as:
For what concerns this work, we use directly the new concept of Aggregated Charge, which provides the high precision in the description of molecular electrostatic properties for the study of interaction with nearby molecules. A comparison between the potential calculated with the dipole moment and the Aggregated Charge is shown in Section 3.3. In Section 4 and Section 5, we show the Aggregated Charge behavior for the three molecules as a function of the externally applied electric field.
3.2. Electric-Field Generated at the Receiver (EFGR)
The Aggregated Charges of the molecule (herein also mentioned as the Molecule-Under-Test and abbreviated as MUT), obtained in given bias conditions (e.g., with a switching field forcing the polarization of the molecule), enables the calculation of the electric field generated by the molecule in surrounding points using simple electrostatic equations. In particular, it allows the evaluation of the electric field which is responsible for the switching of nearby molecules.
Definition EFGR: As sketched in Figure 3b, we suppose to have a fictitious nearby molecule, named Receiver, at the ideal distance from the MUT (distance that leads to a square-shaped QCA cell). We compute the electric field, generated by the charge distribution of the MUT, that impacts the virtual Receiver molecule. The computed electric field is the electric field generated at the Receiver, herein EFGR.
Notice that, the application of an electric field to a molecule varies the distribution of dot charges. Moreover, the component of the field which is mainly responsible for the switching of the molecule is the one parallel to the active dot axis (i.e., parallel to the segment connecting Dot 1 with Dot 2). Nevertheless, in the results we will analyze the EFGR for the three molecules in the three components.
3.3. Vin–Vout Transcharacteristics (VVT) and Vin–AC Transcharacteristics (VACT)
According to MQCA paradigm, the communication among molecules is made possible by local field interaction. When a molecule is inserted in an electric field, generated by electrodes or by nearby molecules, the molecule varies its charge distribution to minimize the electrostatic energy of the system. The new charge distribution changes the field generated by the molecule, differently influencing nearby molecules.
Definition Vout: The voltage at the MUT named input voltage or Vin, is evaluated by integrating the electric field that influences the molecule along the segment connecting the active dots of the MUT. Vin is a practical ‘measure’ of the field that causes the MUT to change its charge distribution. The field which is considered in the evaluation might be generated by nearby molecules, as shown in Figure 3a, or by a switching field inserted in the ab initio simulation, as shown in Figure 3b.
Clarification: The evaluation of the potential could be performed also using the dipole moment, that can be obtained from the Aggregated Charge distribution using Equation (1), instead of integrating the electric field generated by the Aggregated Charge distribution. The potential generated by a dipole moment can be evaluated in a generic point as
The formula is valid provided the far distance from the source (i.e., , where l is the distance between the dots encoding the logic state). However, QCA interaction is based on the Coulomb interaction between molecules which are positioned at distances comparable with their size (typically, ). Results worsen if the shape of the molecule is very different from the typical geometry of a dipole (i.e., two charges positioned at distance l).
The ESP atomic charges and the Aggregated Charge provide the high precision which is necessary for the evaluation of electrostatic properties in the vicinity of molecules. The dipole moment cannot be used with the same precision in this context, especially for molecules whose shape is not dipole-like (e.g., the bis-ferrocene). For this reason, all the figures of merit that we define and validate in this work, evaluate the potential via electric field integration.
Figure 4a shows an example of potential evaluation using the dipole, the atomic charges, the Aggregated Charges and the ab initio software. The voltage obtained using the dipole moment is calculated using Equation (2). The Aggregated Charge turns out to be very precise for the evaluation of the molecule potentials.
Definition VACT: We define the Vin–AC Transcharacteristics (VACT) as the relation between the input voltage and the Aggregated Charge. The VACT is an function, where N is the number of Aggregated Charges describing the molecule. The VACT is independent of the Receiver position (i.e., the VACT can be used to evaluate the field generated by the molecule, when inserted in an electric field, in any point of the space), therefore, it generalizes the study of the intermolecular interaction.
Definition Vout: The voltage at the Receiver, named output voltage or Vout, is evaluated by integrating the electric field generated by the MUT (EFGR), computed using the Aggregated Charges, on the segment that connects the Receiver active dots (Dot 1 and Dot 2). Vout, again, is a practical measure of the field generated by the MUT. The output voltage is in evidence in Figure 3a,b.
Definition VVT: The relation between the two voltages, Vin and Vout, is the Vin–Vout transcharacteristics (VTT) and it provides a description of the molecule operation. Clearly, the VTT can be obtained from the VACT.
In this work, the derivation of the VVT is based on ab initio simulations, therefore, it provides an accurate description of the intermolecular interaction.
Clarification: A similar relation has been proposed for a two-dot molecule in [7] following a probabilistic approach, using Two-State Approximation (TSA). The polarization of the MUT is evaluated analytically approximating the molecule as a two-state quantum system. The two states that represent the logic states are named and and the wave function of the molecular system is written as . The molecule polarization is defined as .
Evaluating the Hamiltonian of the two-state system and solving the associated eigenvalue problem, the relation between the polarization of the driver () and the polarization of the molecule is found. Therefore, knowing the polarization of the molecule, the polarization (i.e., the logic state) of the adjacent molecule can be evaluated.
The proposed VVT can be linked to the methodology adopted in [4,7] enhancing the characterization of the molecule with a more geometry-independent version. The polarization can be linked to the input and output voltages using Equation (3).
where e is the elementary charge and l the ideal intermolecular distance. Hence, the VVT can be obtained by solving Equation (3) for and and substituting the two results in the characteristics given in [7]. The parameters and needs to be introduced to use the TSA theory, in particular, is the tunneling energy associated the two quantum states whereas describes the bistable nature of the molecule [7]. The VVT resulting from the computation is reported in Equation (4).
Figure 4b shows an example of VVT evaluated for the bis-ferrocene using both the TSA theory and the ab initio simulation. Starting from the ab initio simulation, we have evaluated the parameter and computed the VVT using the TSA theory. The two curves, obtained using ab initio directly and approximating the molecule as a two-state system respectively, are similar. In this work, we chose to analyze the molecules using the VVT obtained from ab initio simulations which is more accurate and it is closer to the molecule nature, as it does not involve approximations. The higher precision can be exploited in the future to analyze molecular circuits.
Similarly, also the VACT can be obtained by evaluating and . The VACT enables the calculation of the logic state of molecules embedded in MQCA circuits, considering the effects of all the nearby molecules [29]. In addition, since the position of the receiver does not affect the derivation of the VACT, it can be used to study the propagation in presence of misalignment among molecules.
3.4. Vout Maps (VOM) and MQCA Cell Working Zone (CWZ)
The study of the effectiveness of the molecule, in terms of possible interaction with neighboring molecules, is enriched by means of a map that we baptized Vout map (VOM).
Definition VOM: The VOM is a map of the input voltage Vin that the Receiver experiences when placed in a surrounding position with respect to the MUT. An example of VOM is shown in Figure 3c.
In other words, we suppose that the Receiver position is not fixed. It can be anchored on different possible points around the MUT. The goal is to highlight the region where the Receiver could be bound still receiving a sufficient EFGR to allow the information transfer.
To identify the Receiver in the map, only the center of the Receiver is represented: the middle point between the two dots. The VOM is a two-dimensional plot: the X-Z coordinates (abscissa and ordinate axis respectively) represent the position of the receiver, as shown in Figure 3d. The origin of the map is the center of the MUT. The horizontal axis of the VOM represents the misalignment between the MUT and the Receiver molecule whereas the vertical axis is the distance between the two molecules. The VOM is thus obtained by evaluating the Vout, considering the receiver not at the ideal distance, but anchored on a point that depends on X and Z coordinates.
In this analysis, we assume that the axis of the Receiver is always parallel to the MUT axis (the axis of the working dots) and it is never tilted.
To better identify the interesting regions, we use isopotential curves in the map representation. We emphasize the isopotential curves that enclose the regions where the voltage drop on the Receiver (Vout) is larger than a specific voltage value, a given threshold. In other words, the region identified by the minimum value of the input voltage that switches the Receiver, that is the region where Vout is bigger than the mentioned threshold, can be considered as the region where the Receiver can be successfully placed to ensure the information transfer.
Comparing the Vout maps obtained with different MUT bias conditions (equilibrium, positive and negative switching field), and for different charge distributions of the molecule, it is possible to understand in which area the Receiver will encode the two logic states (logic 1 and logic 0).
VOM is particularly interesting for evaluating the quality of a molecule for QCA applications. They actually allow assessing how the isopotential curves (and inner regions) are transformed when the MUT state changes from the equilibrium state to a switched state. Moreover, not only the shape of the regions is interesting, but especially their size; a wider region increases the probability that the molecule receives the correct information.
Furthermore, an enhanced use of VOM consists in measuring how large are the regions where the Receiver is affected by the minimum voltage necessary to encode both two logic states at the same time.
Definition CWZ: We define the Cell Working Zone (CWZ) as the intersection between the two regions where the Receiver can encode the two logic values when induced by the proper EF. The CWZ is the real working zone of the Receiver
4. Results: Neutral Molecules
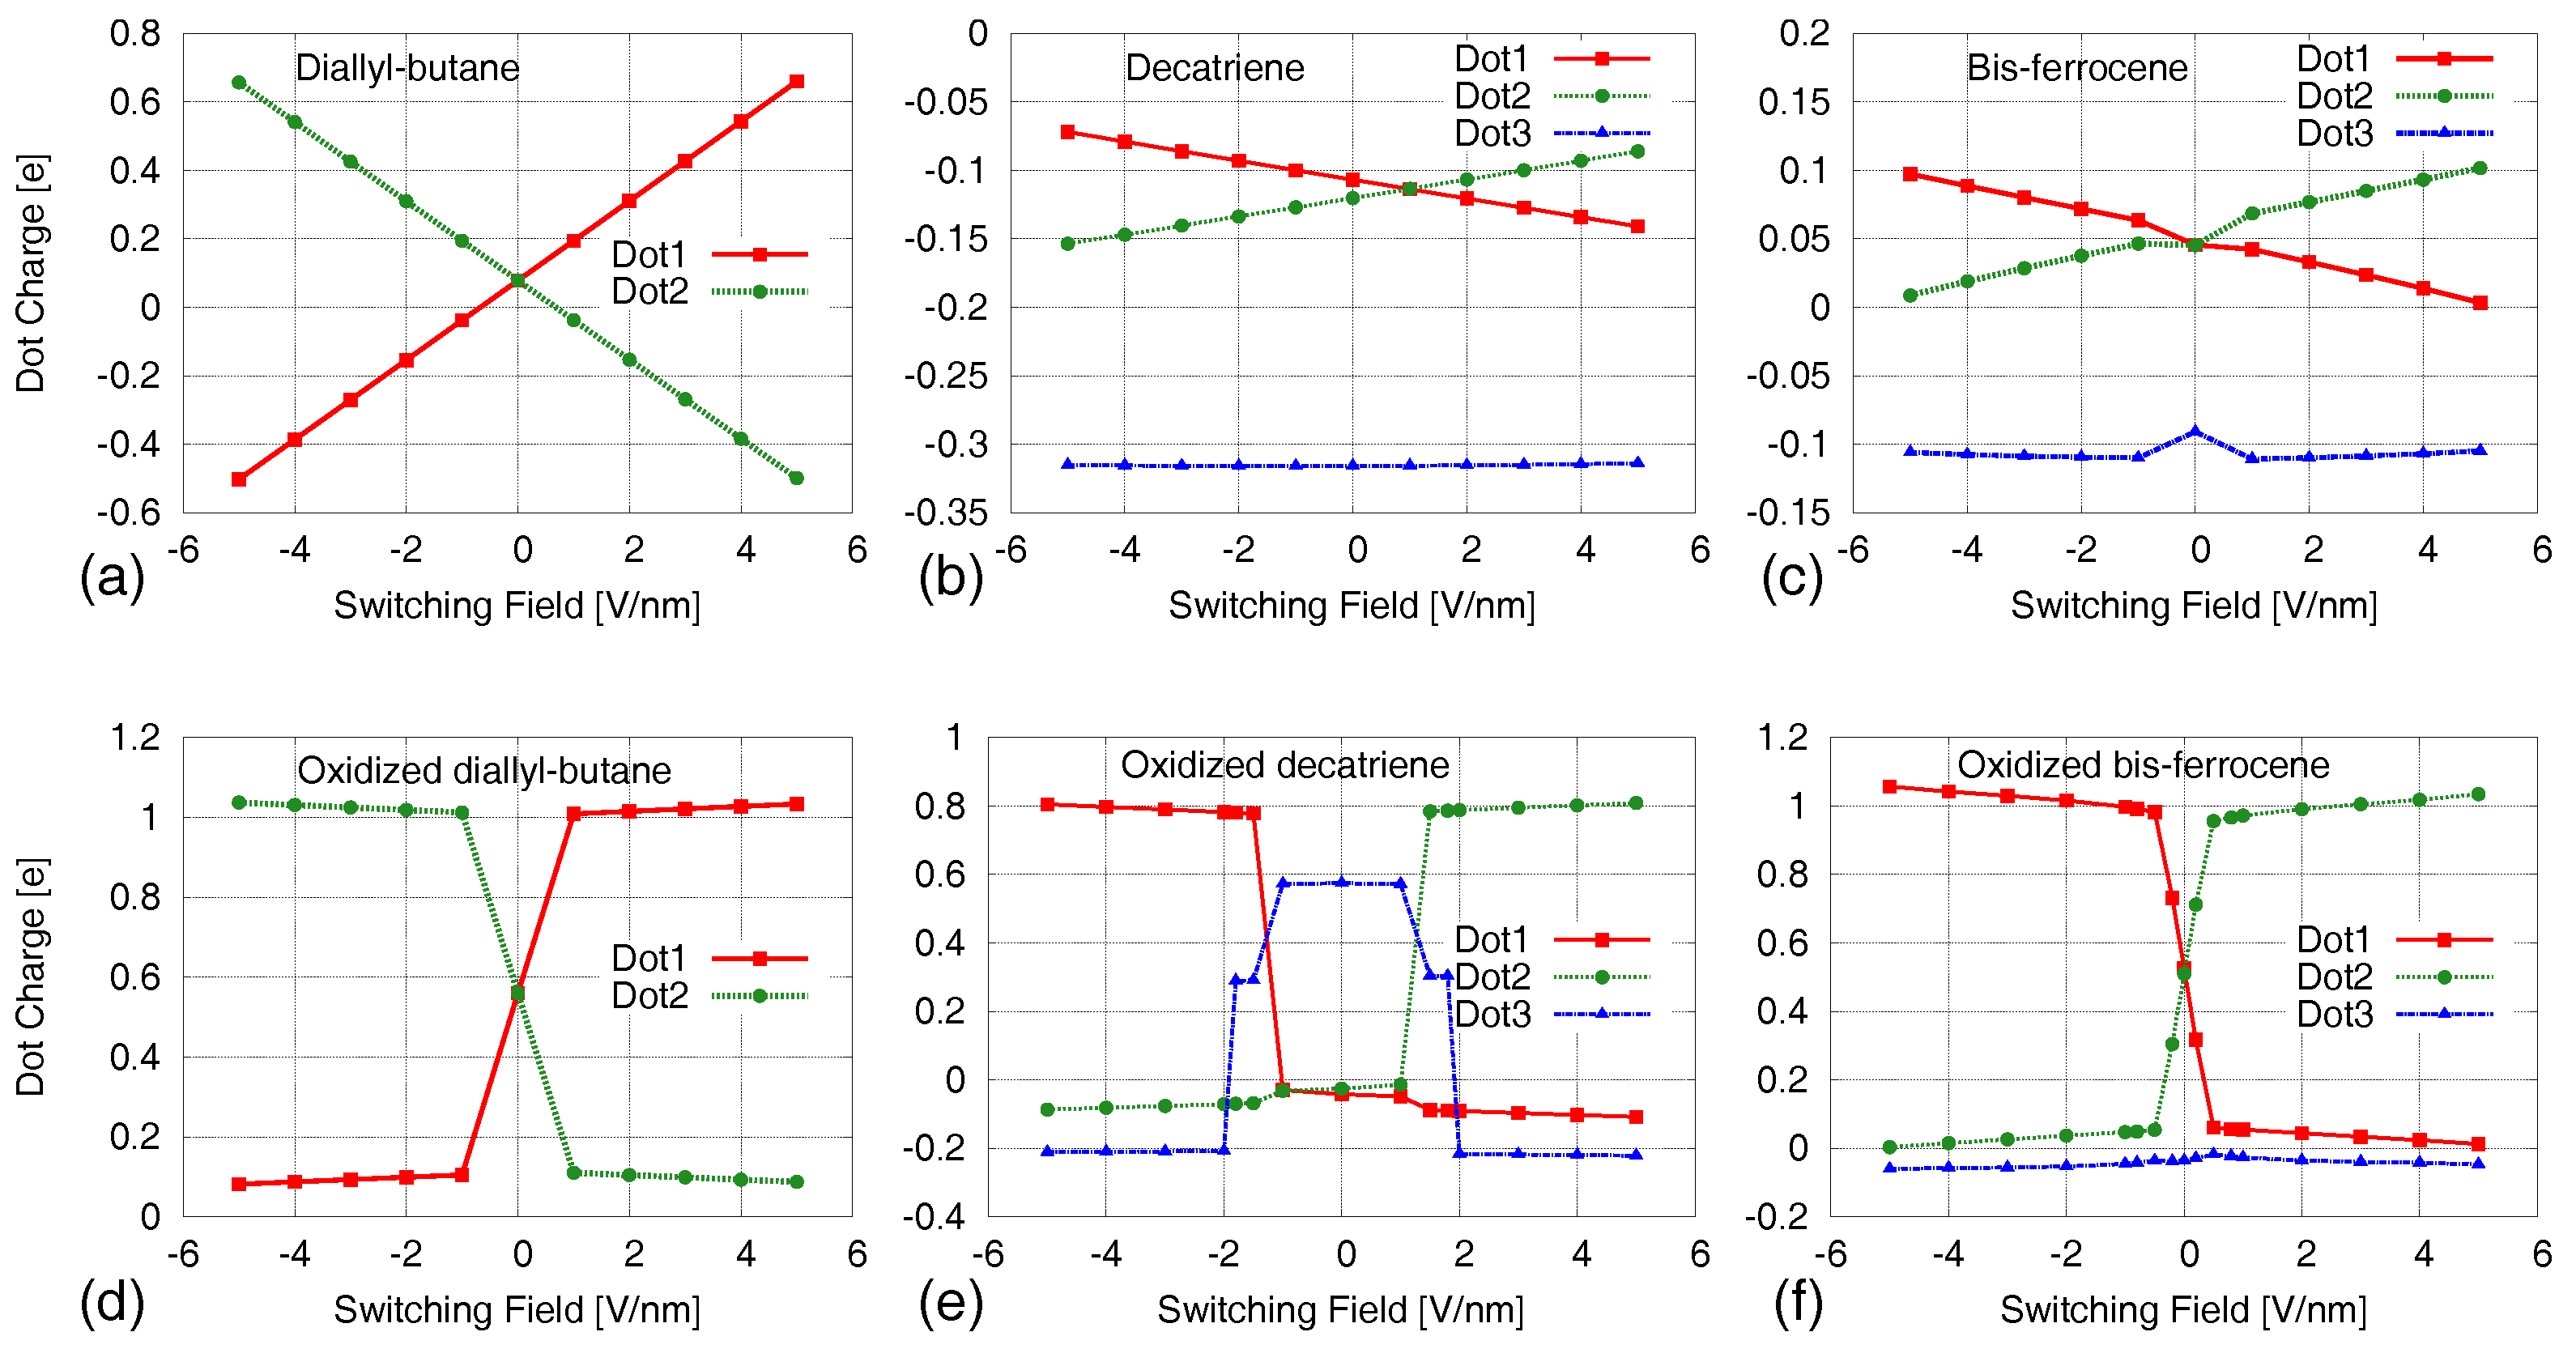
Figure 5a–c shows the VACT of the three molecules, i.e., diallyl-butane, decatriene and bis-ferrocene respectively, in the neutral form (Results are partially elaborated from a previous version in [28,33] where only the Aggregated Charge was presented). The figures report the AC associated to the active dots as a function of the switching electric field which is applied to the MUT. For all the three molecules, the charge separation between active dots appears to increase as the absolute value of the electric field increases. Even with a small value of the field, it is possible to appreciate a charge separation.
For what concerns the decatriene and the bis-ferrocene molecules, the charge occupying the third dot is almost constant. However, comparing the amount of dot charge displacement in the three molecules, it follows that only the diallyl-butane—which is a pure theoretical molecule though—shows an effective charge localization. Indeed, the quantity of charge occupying the two active dots is large enough in all the conditions out of equilibrium.
For the other two molecules, the charge separation between the active dots is small (around 0.1 e in the best case) and cannot ensure the distinguishability of the logic states. For these reasons, we believe that further characterizations of these neutral molecules are useless since the results could be not relevant for the QCA computation; this is also sustained by the results obtained from the oxidized molecules reported in Section 5. It is actually necessary to enhance the charge available for switching. Therefore, we could assess that the oxidation process is strictly necessary for the correct information encoding and to enable interaction between QCA cells.
5. Results: Oxidized Molecules
5.1. Aggregated Charge–AC/VACT
We compute the AC for the oxidized molecules (molecules presenting a net free positive charge) as a function of the applied switching field (VACT), obtained by ab initio simulations. The results are reported in Figure 5. The three molecules show a similar behavior: at the equilibrium, the electric field is null and the active dots have the same value of charge, consequently, the logic state is undefined; when an electric field is applied, the free charge of the molecule is entirely localized on one of the two dots. In this case, the charge separation is enough to encode a logic state, as it is detectable and as it enables the information to propagate correctly; the capability to propagate the information will be demonstrated further on in our characterization.
In addition, changing the sign of the electric field, the charge moves to the opposite dot. The symmetry with respect to the sign of the electric field is preserved, and this confirms the capability of the three molecules to encode the two logic states.
For all the molecules, we define a threshold value of the electric field (called threshold switching field, ) that ensures the state encoding, and above which the amount of charge in the occupied dot does not change significantly. In particular, for the diallyl-butane, the threshold value is very small. This implies that a small perturbation (i.e., a small electric field) causes the molecule to switch in a logic state which depends on the sign of the electric field. In the case of the decatriene, the threshold for the electric field is V/nm. Above this value, the charge mainly occupies one of the two dots (Dot 1 and Dot 2), whereas below this value the free charge is localized almost in the third dot.
For the bis-ferrocene the minimum electric field for writing a logic state is about V/nm. Below the threshold, the free charge is delocalized between the two working dots (Dot 1 and Dot 2) and the third dot (Dot 3) charge is negligible.
This effect is consistent with the results provided by Lu et al. [8]. Indeed, the transition of the charge (the electron) between the two active dots is not direct. The charge occupies Dot 3 when the molecule is subjected to a sufficiently small electric field.
In summary: the AC analysis allows us to clearly characterize the information encoding in the molecules and to quantitatively underline the difference between the neutral and the oxidized form.
5.2. Generated Field
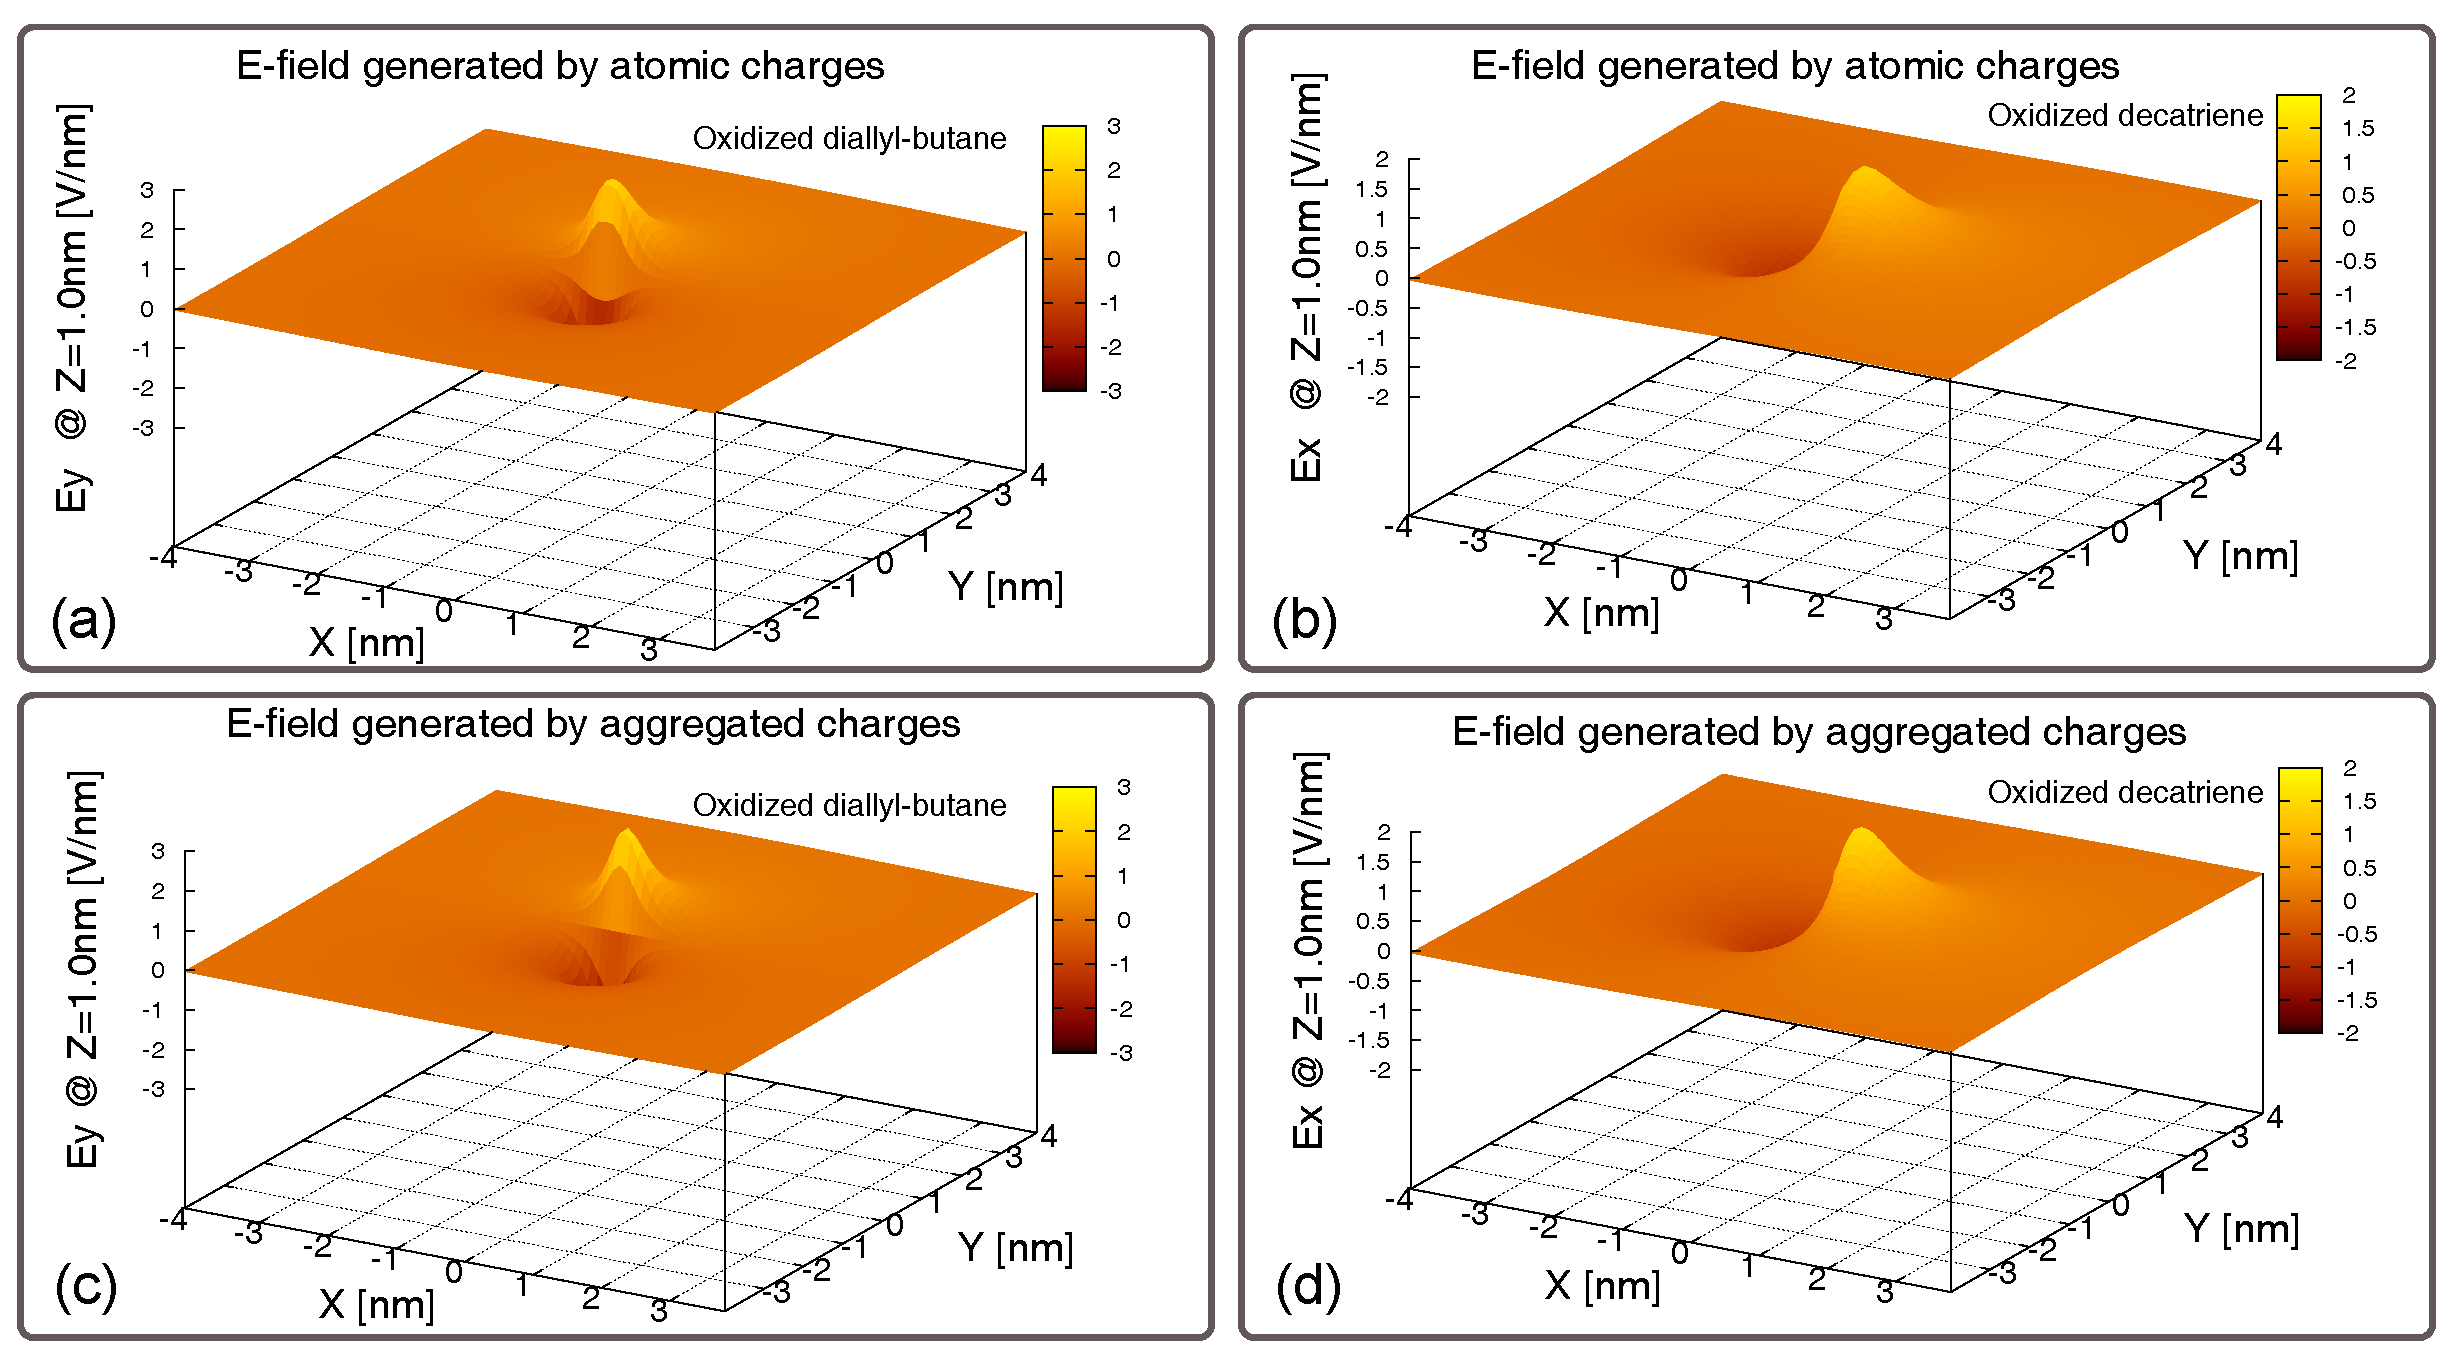
In order to evaluate the effectiveness of these molecules to generate an electric field that could influence nearby molecules, we compute the electric field generated by the above-mentioned charge distributions of the molecules. In particular, as shown in Figure 6, we compute the electric field generated by the neutral bis-ferrocene along all the three spatial components (X, Y, and Z).
We calculate the electric field using all the atomic charges of the molecule (Figure 6a–c) and using the aggregated charges (Figure 6d–f). A comparison of the fields generated using the two methods (atomic charges and Aggregated Charges), in all the spatial components, reveals that the electric field generated by the two systems of charges are very similar. This allows us to assess that the AC we defined and used to model the molecule is a valid figure of merit. Moreover, modeling the molecules with the Aggregated Charges (the dot charges) does not lead to a lack of accuracy in our results.
This is confirmed by the results obtained comparing the electric fields generated by the diallyl-butane molecule and the decatriene molecule, computed firstly basing on all the atomic charges and then on the Aggregated Charges and reported in Figure 7. In these cases, we report only the component parallel to the working dot axis, which is the most important and interesting for our analysis.
5.3. Generated Field at the Receiver–EFGR
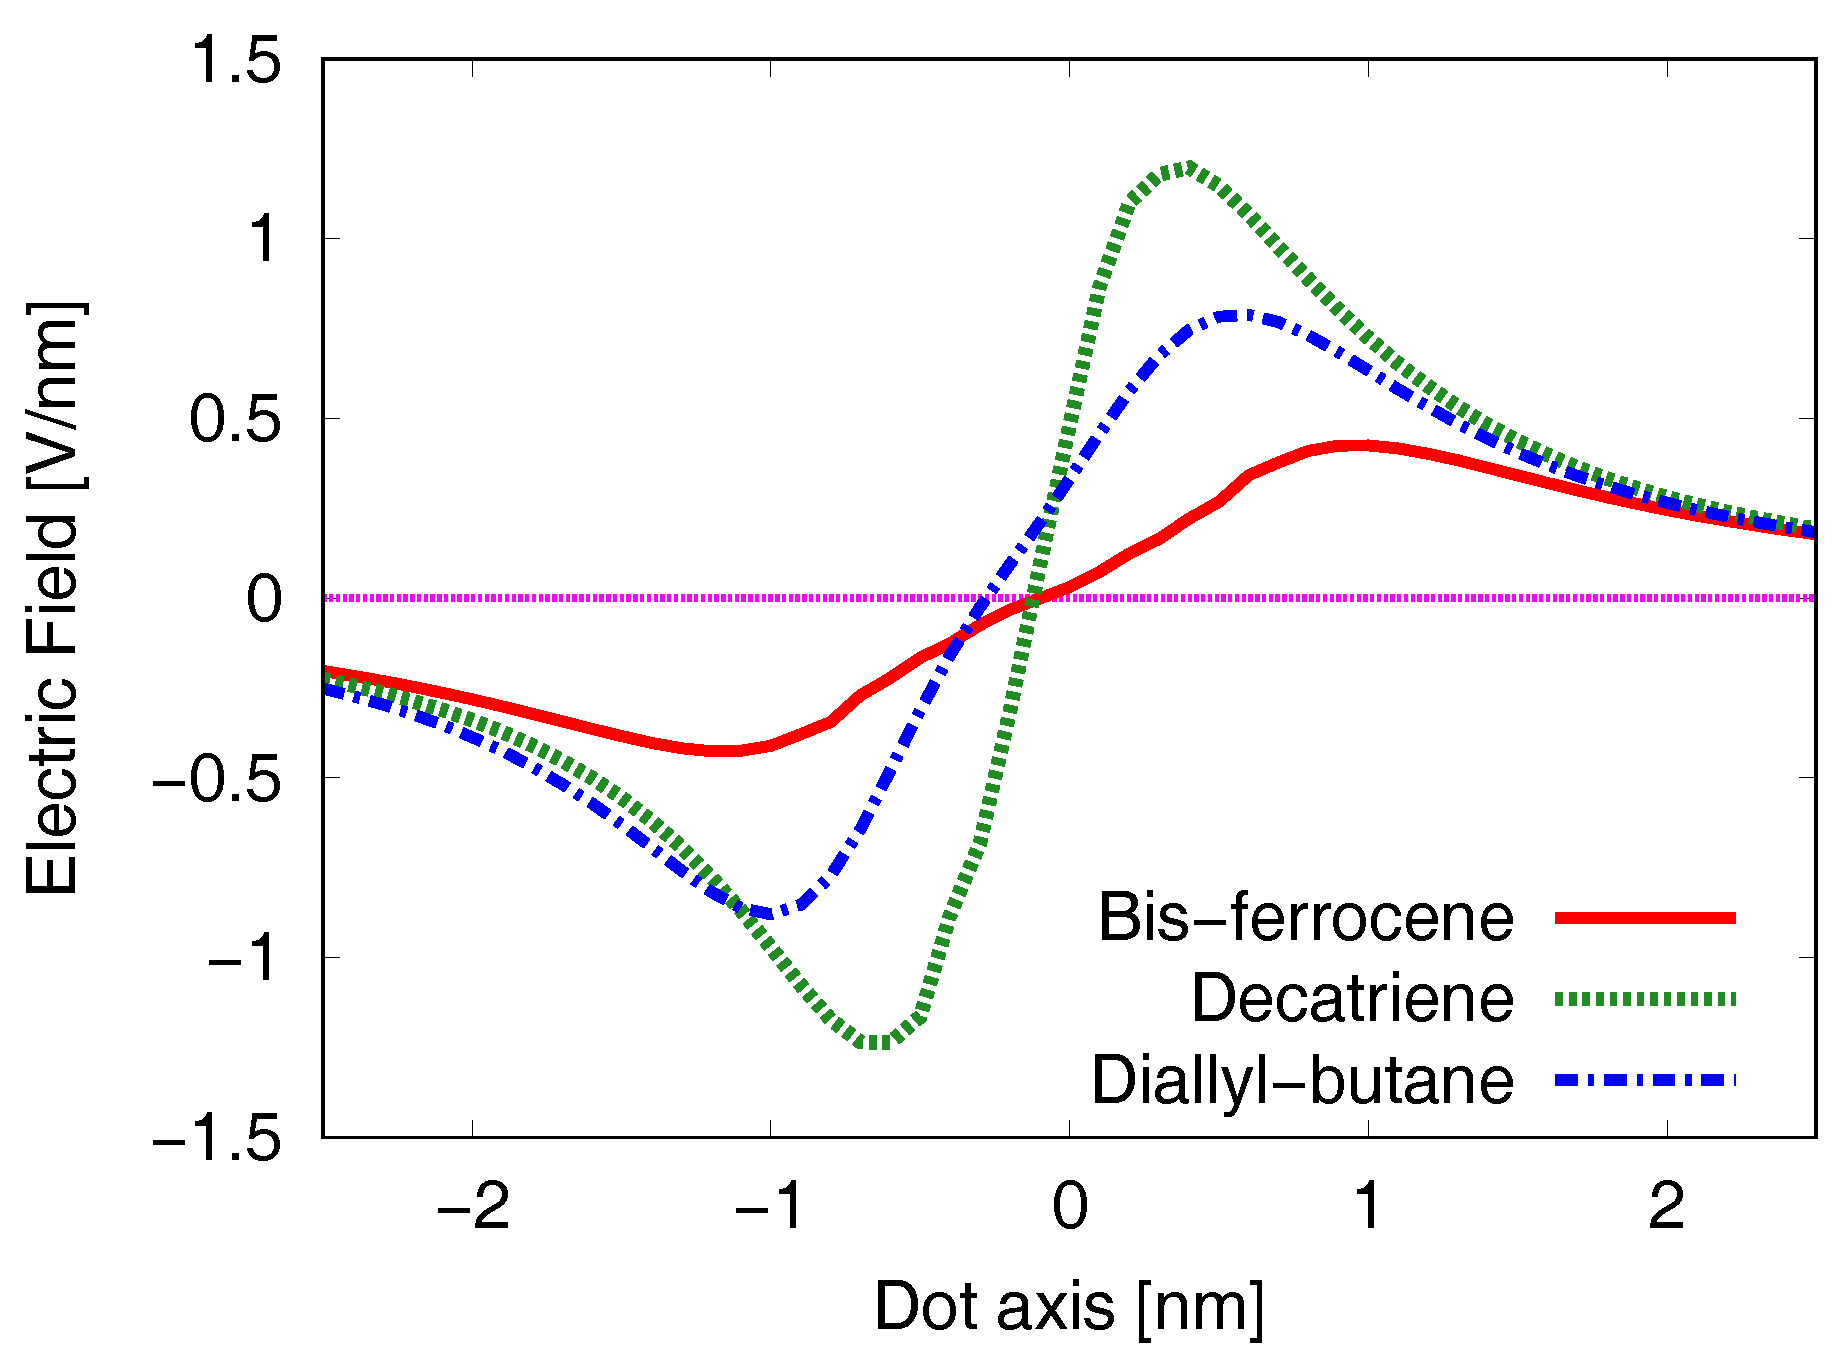
The previous analysis gives an idea of the electric field behavior in the whole 3D space around the MUT. It is now worth to evaluate the effects of the field on the Receiver. For this reason, it is necessary to cut the surfaces of Figure 6 and Figure 7 along the axis where the active dots of the Receiver stand. This means fixing the position of the Receiver on the Z-axis (see the coordinate system in Figure 2d) and considering the axis along the direction where the active dots of both the MUT and the Receiver stand (Y-axis for the diallyl-butane, X-axis for both the decatriene and the bis-ferrocene).
The results are reported in Figure 8 for the three molecules at the equilibrium, i.e., when the molecule is not subjected to any external electric field for biasing. The dash-dotted (blue) curve is related to the diallyl-butane, the dotted (green) one to the decatriene and the solid (red) one to the bis-ferrocene. To evaluate the effects of the electric field generated by the MUT on the Receiver (EFGR), the curves have to be considered only in the range limited by the two Receiver Dots which depends on the molecule length ( nm, nm and nm for diallyl-butane, decatriene and bis-ferrocene, respectively). In all the cases, the values of the electric fields calculated at the two Receiver Dot 1 and Dot 2 show almost equal intensity but opposite sign (i.e., opposite direction). We evaluate the equivalent voltage at the Receiver as the line integral, calculated on a path connecting Dot 1 and Dot 2, of the electric field.
The result is almost zero: this means that the molecule at the equilibrium does not influence an ideal Receiver.
We then turn to the molecule biased by an externally applied switching electric field. We can calculate the electric field generated by the MUT outside the equilibrium condition using the AC distribution.
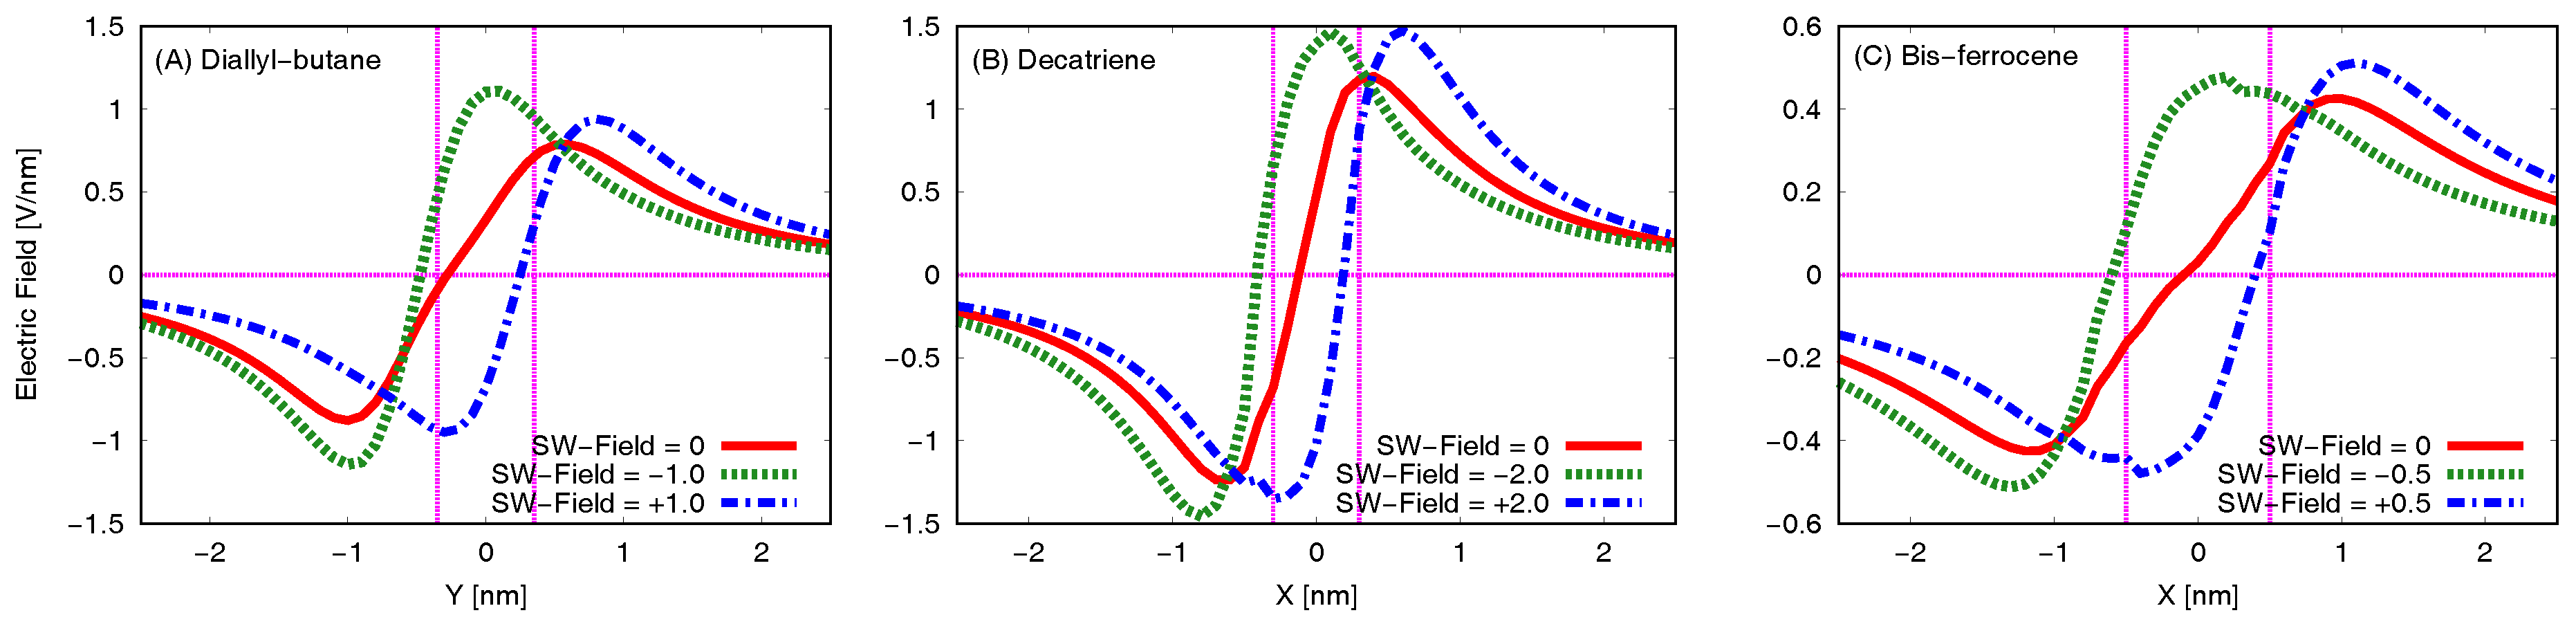
Figure 9 reports the electric field generated by each molecule and evaluated at the Receiver position (EFGR). For the sake of simplicity we show here the superposed curves obtained without bias (solid red line, V/nm), with one negative bias value (dotted green line, for example for the bis-ferrocene V/nm) and with one positive bias value (dash-dotted blue line, for example for the bis-ferrocene V/nm). Vertical lines in the figures highlight the position of Dot1 and Dot2 along the Receiver axis, i.e., the range of interest for the evaluation of the EFGR.
In the case of the negative applied switching field, the positive peak of the generated electric field moves backward with respect to the unbiased case and it is centered in the Receiver range of interest. The sign of the EFGR integral in the range of interest is positive and is opposite with respect to the sign of the switching field applied to the MUT. The Receiver will then react with an internal charge distribution that encodes a logic state opposite to the MUT one. Analogously, in the case of MUT positive biasing the consequences are dual: the curve is shifted right, the integral in the range of interest is negative, and again MUT and Receiver encode opposite states.
The effects on the Receiver are more pronounced in the case of diallyl-butane and decatriene (Figure 9a,b, respectively). Actually, for the bis-ferrocene molecule (Figure 9c) the values of the electric fields are smaller than those of the other two molecules, but the potential at the Receiver is equivalent since the two dots are more distant. This consideration will be confirmed by the VVT analysis.
In summary: the EFGR analysis allows us to clearly understand the physical phenomena involved in the information propagation. The EFGR can be used to analyze in a quantitative way the capability of the MUT to propagate the information by evaluating the electric field to which the Receiver is subjected.
5.4. Molecule Transcharacteristics–VVT
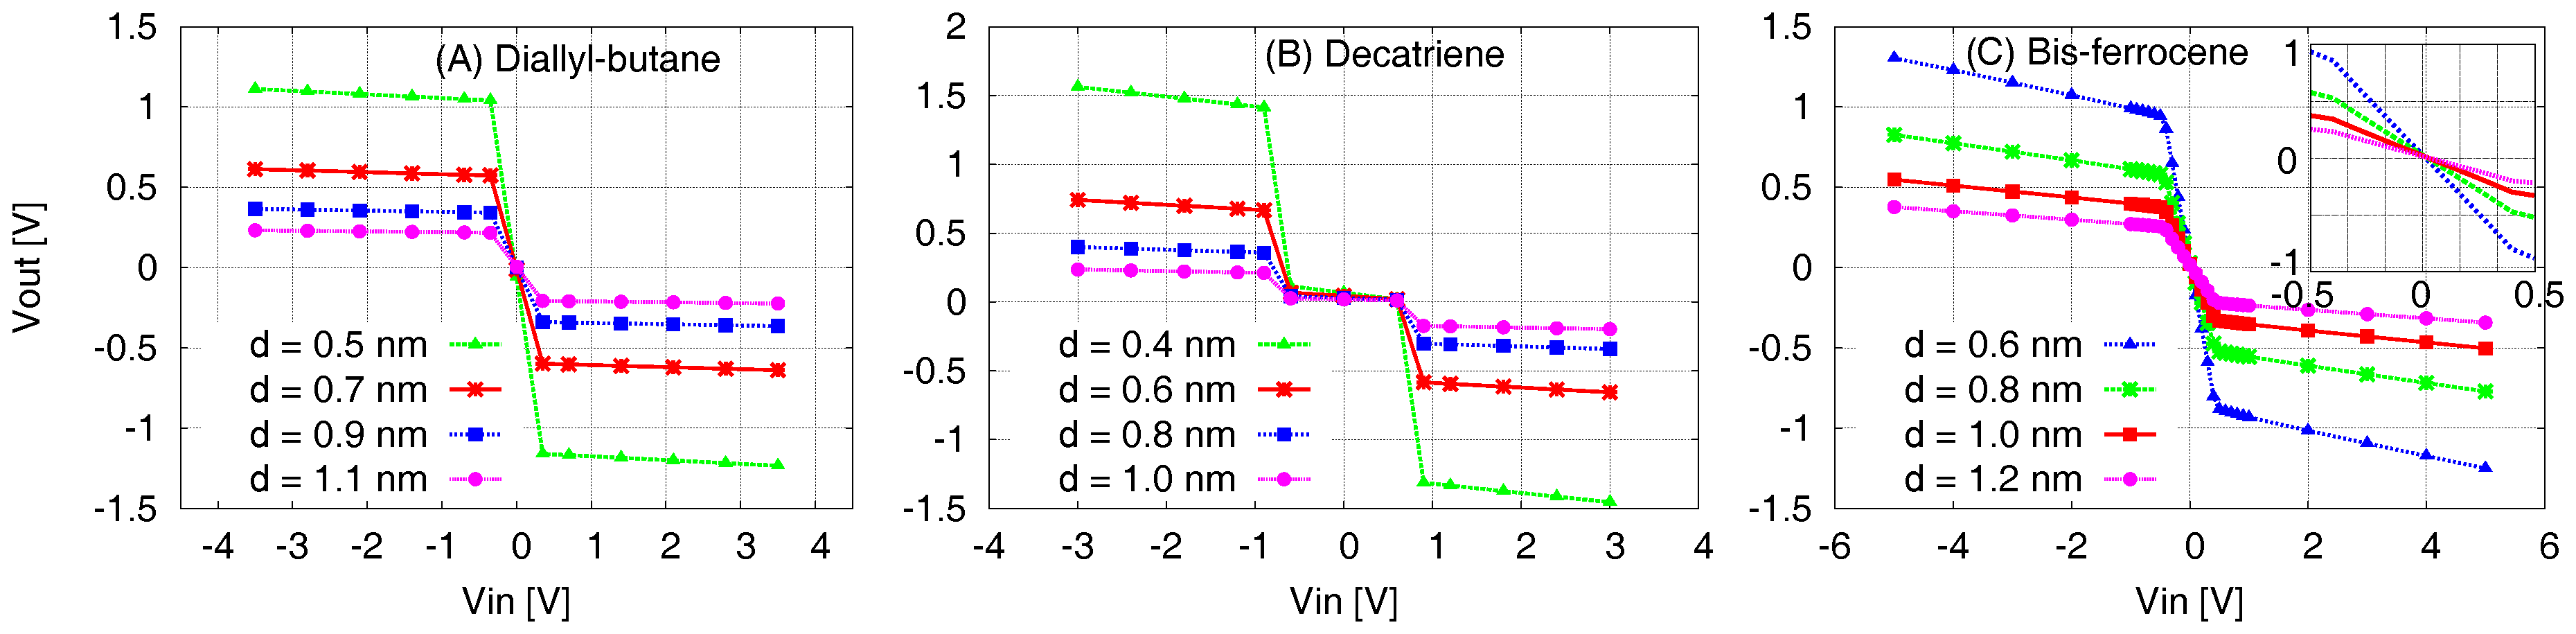
In order to validate the results expressed by the EFGR, we evaluate the molecule transcharacteristics VVT as defined in Section 3. Figure 10 displays the output voltage Vout at the Receiver as a function of the Vin at the MUT for the three molecules. Each graph shows the superposition of four VVT curves obtained considering different values of MUT-Receiver distance for the three molecules. If the distance between MUT and Receiver increases, then Vout decreases and this is a consequence of the decreasing generated electric field, as depicted in Figure 6 and Figure 7. On the other hand, placing the Receiver closer to the molecule leads to a higher equivalent voltage at the Receiver, since the generated electric field is stronger near the molecule.
In all the cases a non-linear behavior is evident, reflecting the trend of the Aggregated Charges, and, especially, underlining the optimal behavior of the cell in soundly propagating the information. The graphs clearly highlight the inverting response, that demonstrates that all the molecules generate an output signal that could influence the Receiver to encode a state opposite to the molecule one, thus properly implementing the QCA cell. In particular, considering the ideal Receiver position (solid red curve for all the molecules), this capability is confirmed for the diallyl-butane and the bis-ferrocene, since the output voltage reaches the minimum value necessary to force the molecule in a logic state. This value is derived from the , simply multiplying it by the length of the molecule.
For example: in the bis-ferrocene case, as is V/nm and the length is 1 nm, the input threshold switching voltage is V. For bigger than the Receiver voltage reaches a maximum values. This is confirmed for all the MUT-Receiver distances.
Due to this saturation, in order to assure a correct information propagation (i.e., without losses), it is important that the Vout at the Receiver assumes a value at least of the same amount of the . This requires placing the Receiver at a proper distance, that for the bis-ferrocene should be around 0.8 nm.
In summary: the VVT and the VACT reach a very important point in the characterization of the MQCA devices, as they give a mean to clearly describe the cell behavior from an electronic point of view. The description is both qualitative (inverting logic behavior) and quantitative (threshold values). This figure of merit relates the output quantities (Vout/AC) to the input quantity (Vin) providing the typical transcharacteristics used for the description of traditional logic devices.
5.5. Output Voltage Maps–VOM
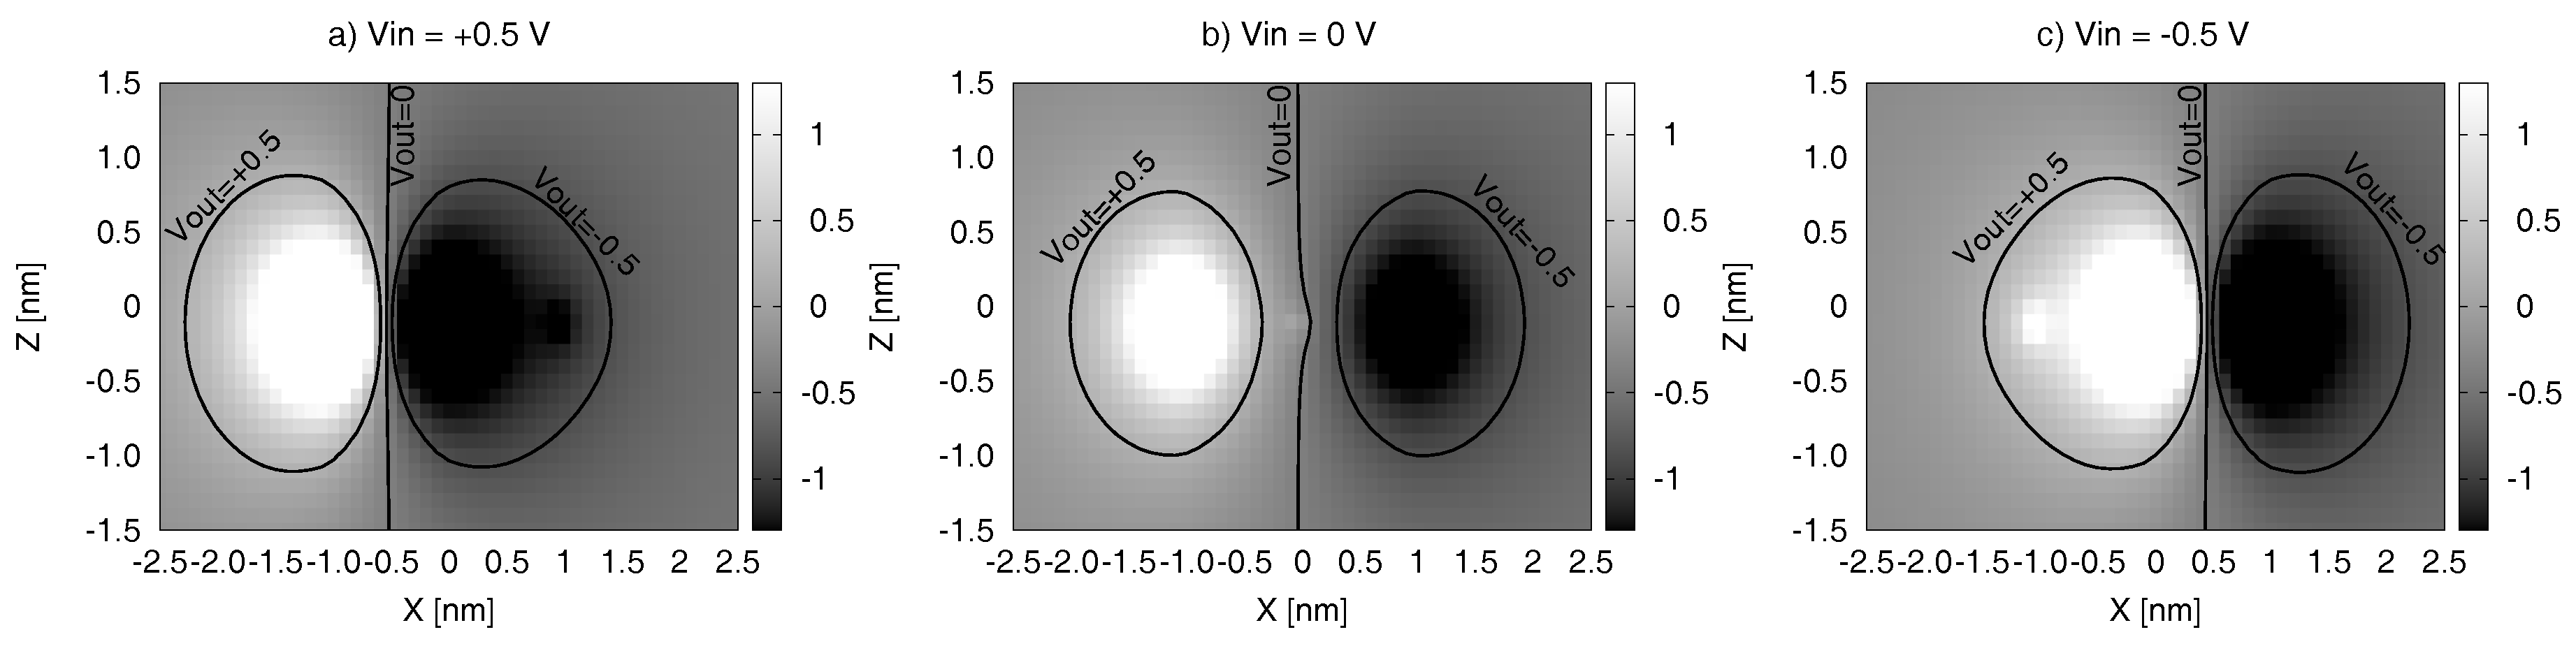
Figure 11 reports the Vout maps (VOM) for the molecule charge distributions at the equilibrium and in the two logic states. For the sake of brevity, we show the results for the bis-ferrocene only. VOMs, defined in Section 3, are shown in the Z-X plane, where Z represents the MUT-Receiver distance, and X represents the misalignment between the Receiver and the MUT, evaluated with respect to the center of the MUT active dots. VOM is evaluated in three MUT conditions: at the equilibrium ( V), and under the effect of an input voltage that we identified as a threshold for both the logic states in the previous analyses (i.e., V ).
Figure 11b. shows the results obtained for the molecule at the equilibrium ( V). If the Receiver is perfectly aligned to the MUT (i.e., the Receiver center is in X = 0 nm while Dot 1 and Dot 2 are in position X = −0.5 nm and X = +0.5 nm, respectively), it experiences a voltage equal to 0 (highlighted by the isopotential line V), independently on the MUT-Receiver distance (Z axis). This is consistent with what we showed in Figure 8. If the Receiver is not aligned, but shifted along X, it experiences a positive or negative Vout (identified by the isopotential curves V and V, respectively). This condition leads the Receiver in a wrong logic state.
In order to understand the information propagation, the values reported in Figure 11a,c should also be analyzed. In particular, in the case of a positive input voltage applied to the MUT (e.g., in the case of Figure 11a, for V) we assume that the MUT encodes a Logic ‘1’. If the Receiver is aligned with the molecule (X = 0 nm) a negative output voltage can be detected. This leads the Receiver in a state opposite to the MUT one (i.e., Logic ‘0’).
On the contrary, when V the MUT encodes a Logic ‘0’ (Figure 11c). If the Receiver is perfectly aligned with respect to the MUT, it experiences a positive Vout, encoding Logic ‘1’. From the Figure 11a,c, it is also evident that the positive and the negative areas (enclosed by the isopotential curves V and V, respectively) are shifted symmetrically with respect to the center of the molecule (placed at the origin of the axes): in particular, a left shift occurs for positive input voltage whereas a right shift occurs for negative input voltage, respectively. The symmetry of the VOMs increases the effectiveness of the QCA element when the real molecular arrangement is analyzed.
Comparing the three VOMs in Figure 11 we see how the Receiver can be switched to both states. Moreover, from a technological point of view, it is worth evaluating the maximum misalignment () of the Receiver that ensures a correct information propagation. For example, when the Receiver is centered in nm and nm, the Vout is negative in all the conditions of input voltage and lower than −0.5 V. In other words, the Receiver is always in a Logic ‘0’ and can not be switched even if the MUT switches. This means that a Receiver placed in this position does not allow a correct information propagation. This analysis is important to define the working zones, as described in the next sub-section.
In summary: the VOMs allow the measurement of the area where the Receiver can be bound still being able to encode a logic value: due to the difficulty in the fabrication process, this characterization is extremely important to give to technologists some feedbacks on the procedures, and to circuit designers a more realistic evaluation of the MQCA behavior considering process variations.
5.6. MQCA Cell Working Zone–CWZ
If we now consider the effectiveness of the information propagation in MQCA, it is necessary to overlap the zones where the Receiver can encode a Logic ‘1’ correctly with those where it can encode a Logic ‘0’ correctly.
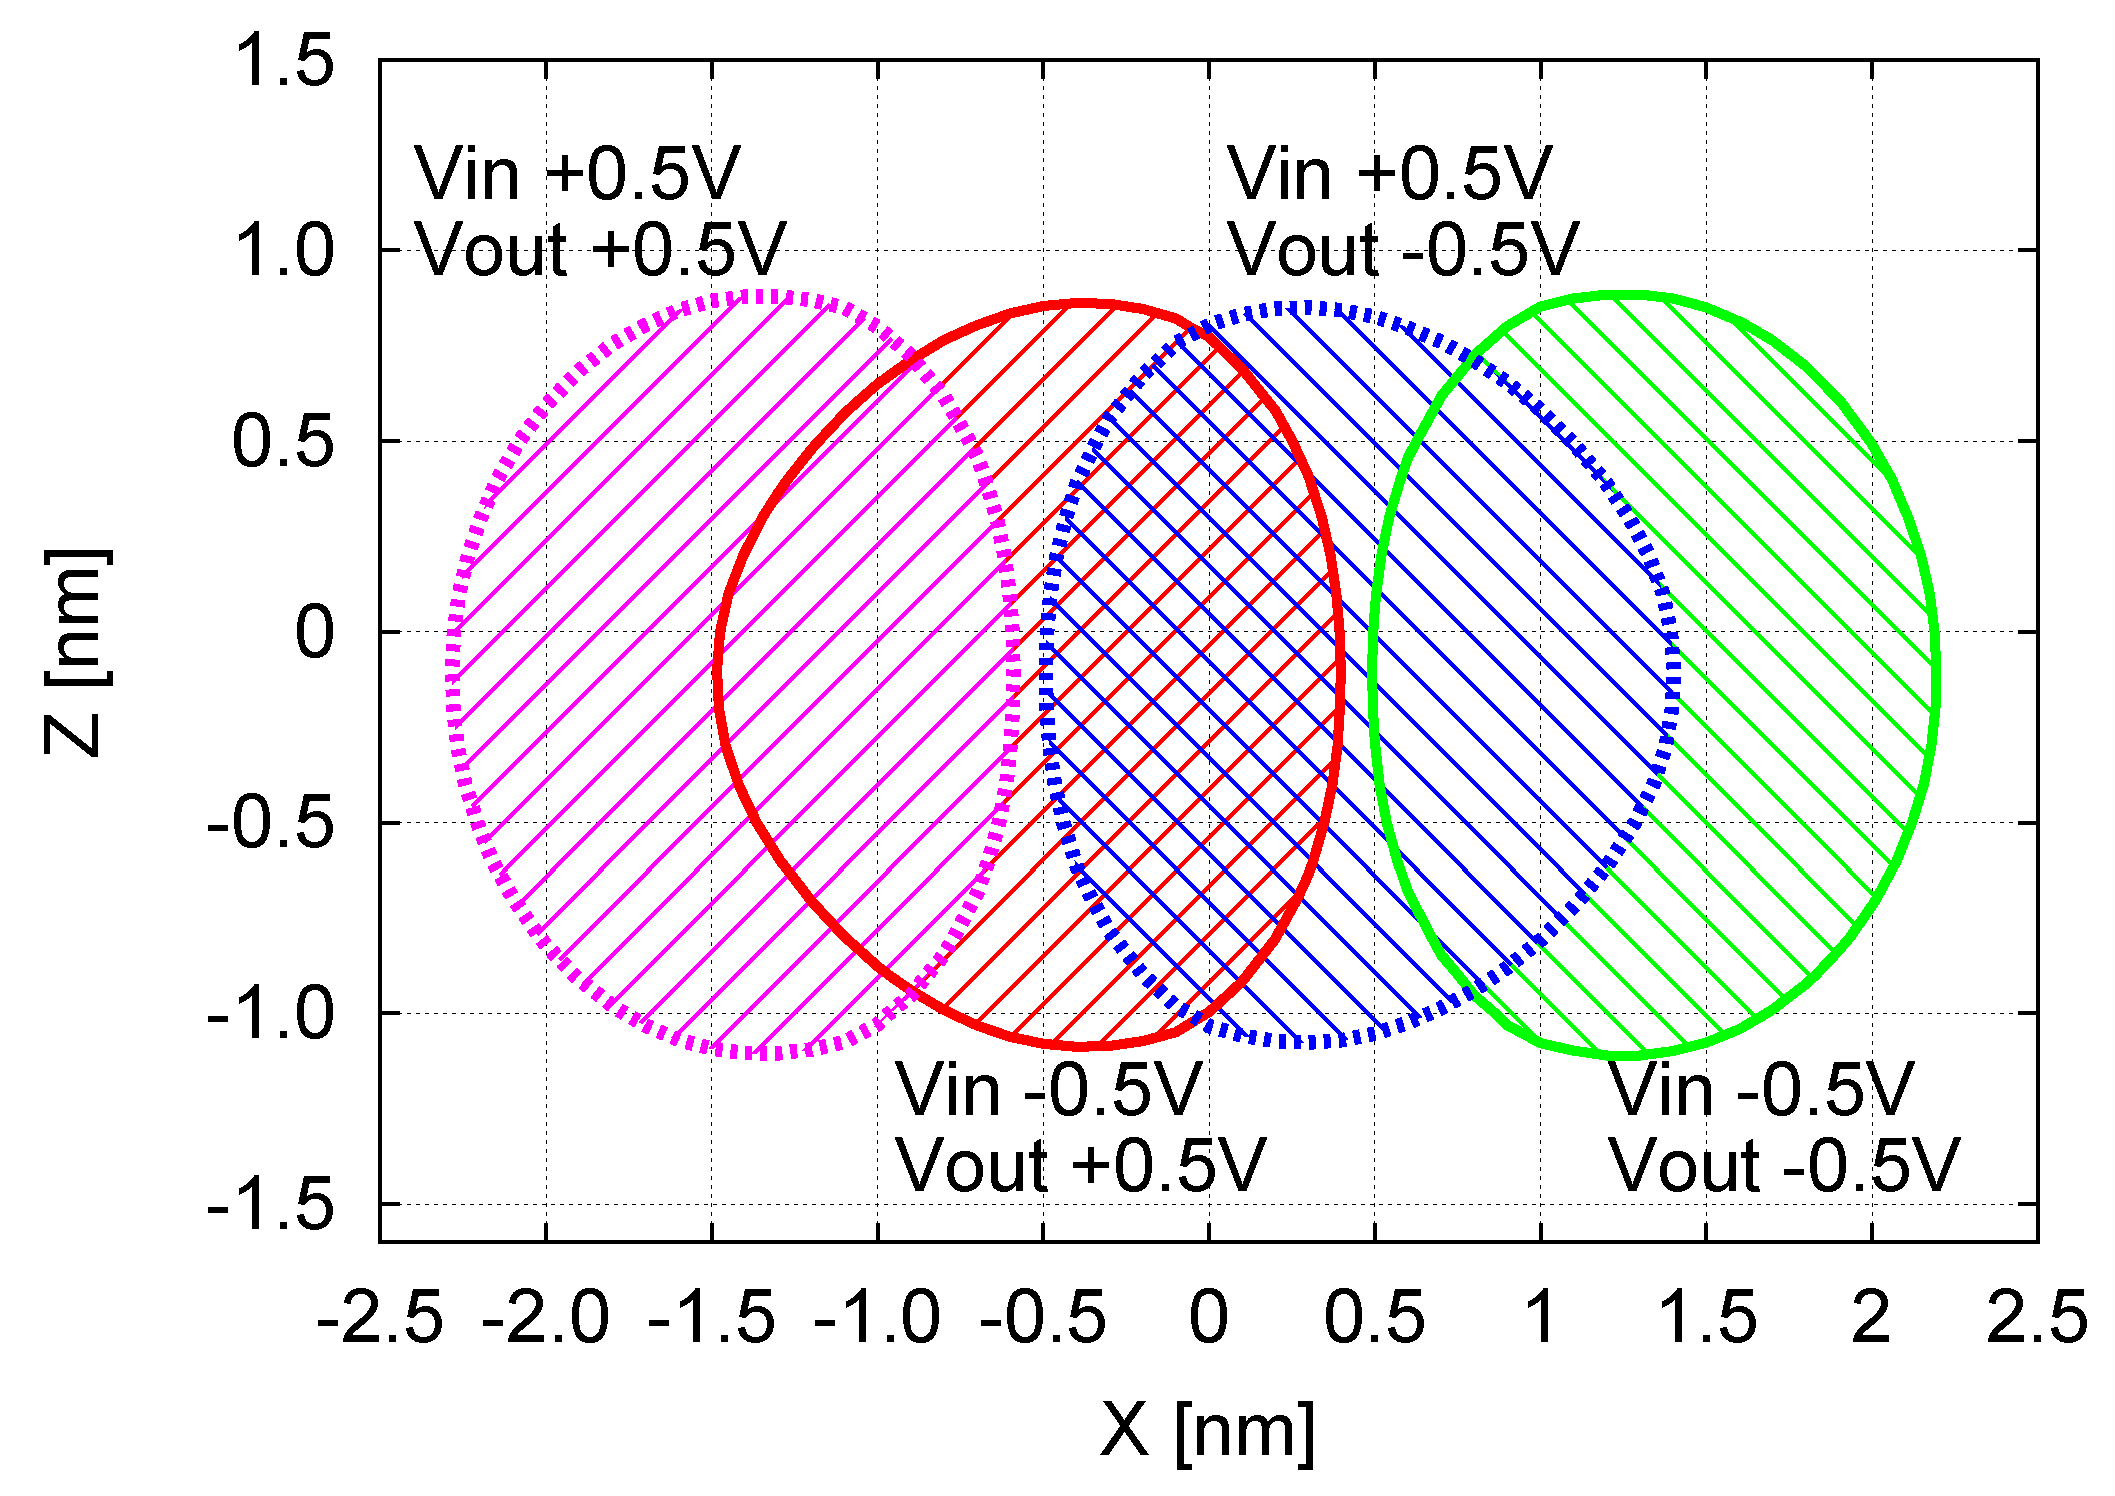
In Figure 12, the two VOMs (Figure 11a,c) are superposed and labeled with both the related and conditions. In particular, the two regions of Figure 11a are reported with the label V, whereas the regions of Figure 11c are labeled with V. Different patterns and colors are used to differentiate the four regions.
Since the information propagation is properly performed only when the Vin–Vout inverting behavior occurs, we have to focus only on the regions where the sign of Vout is opposite with the respect to Vin sign. In other words, the Receiver will work properly only if placed in the area where the region where V and V is overlapped to the region where V and V. The overlap region is named CWZ. In particular, this area includes the positions of the Receiver with nm (thus perfectly aligned with the MUT) and nm. When the Receiver is aligned with the MUT, the range along the Z axis is the maximum in terms of possible MUT-Receiver distance. In case of MUT-Receiver misalignment (X displacement), the range along the Z axis is smaller and is equal to 0 when the Receiver is centered at nm or nm. Outside these ranges on both X and Z axes, the Receiver will not work properly.
In summary: CWZ allows to assess the realistic capabilities of an MQCA system (MUT-Receiver) to propagate the binary information. The CWZ and the VOM proceed towards the direction of defining a technological Safe Operating Area for the anchoring of molecules. These figures of merit can be used by technologists for the fabrication of devices, and by digital designers for the robust design of digital circuits, taking into account possible process variations and defects.
6. Conclusions and Future Works
The molecular implementation of Field-Coupled Nanocomputing, known as Molecular Quantum-dot Cellular Automata, has been assessed as a possible technology to overcome the issues related to CMOS scaling. The molecular devices have been deeply studied from the chemical and physical point of view by chemists and physics, yet from the electronic engineering point of view it has not been analyzed with the same effort, making the realization, the design and the simulation of real devices difficult. The effectiveness of molecules, to provide computing capabilities is not yet clearly defined from the engineering point of view.
In this work, we provided a new method to approach the analysis of MQCA in a sound quantitative way and we applied it to three different molecules proposed in the literature: the diallyl-butane, the decatriene and the ad-hoc synthetized bis-ferrocene.
To study the behavior of the molecules from an electronic perspective we introduced several new quantities: the Aggregated charge (AC), the electric field generated at the receiver molecule (EFGR), the Vin–Vout transcharacteristics (VVT), the Vout maps (VOM) and the MQCA cell working zones (CWZ).
The Aggregated Charge (AC) models the electrostatic behavior of the molecule and allows us to underline the capability of the molecule to encode the information in a quantitative way, by looking at the difference of charge among the active dots. Using AC, we demonstrated that the oxidation of the considered molecules is necessary to ensure a correct information encoding, especially if a real molecule is considered, indeed the charge separation among the active dots is low for the neutral molecules. Our analyses also point out that the oxidized bis-ferrocene molecule—the only one among the three that has been really synthesized for MQCA—shows very good performance.
The Electric Field Generated at the Receiver (EFGR) enables the quantitative analysis of the capability of the molecule to interact with the molecules positioned in the surrounding space. The Vin–Vout Transcharacteristics characterize the response of the molecule to the surrounding electric field and clarify the behavior of the molecule (and of the cell) from an electronic standpoint.
The EFGR, the VVT and the VACT allowed us to (i) quantify the input bias necessary to induce a clear logic encoding for the three molecules; (ii) demonstrate a sound inverting behavior for the three molecules; (iii) quantify the dependence of correct logic encoding at the cell output on the molecules distance; (iv) compare the effectiveness of the three molecules in propagating the information.
The VOut Map (VOM) together with Cell Working Zone (CWZ) enable the identification of the geometrical areas where a Receiver molecule can be placed around the MUT that is still being able to receive the information. These tools provide important quantitative results for the future fabrication of a molecular device.
These new metrics can hereinafter be used to qualify MQCA technology using a “dictionary” which is clear enough to compare different molecules, but also to initiate the path toward a fair analogy between MQCA systems and standard technology logic cells. In addition, we demonstrated that molecules such as the bis-ferrocene could be good candidates for approaching a real experiment for MQCA.
With the defined figures of merit, we provide important quantitative results which are of interest for the future fabrication of devices.
Author Contributions
Conceptualization, Y.A., M.G. and G.P.; Data curation, Y.A.; Formal analysis, Y.A. and A.P.; Investigation, Y.A. and M.G.; Methodology, Y.A., A.P. and F.R.; Project administration, M.G.; Resources, F.R.; Software, Y.A. and A.P.; Supervision, M.G. and G.P.; Validation, A.P., M.G. and G.P.; Visualization, M.G. and F.R.; Writing—original draft, A.P.; Writing—review & editing, Y.A. and F.R.
Funding
This research received no external funding
Acknowledgments
We acknowledge Massimo Ruo Roch, from the Electronics Department of Politecnico di Torino, for his precious help with the software management.
Conflicts of Interest
The authors declare no conflict of interest.
Abbreviations
| AC | Aggregated Charge |
| CMOS | Complementary Metal-Oxide Semiconductor |
| CV | Cyclic-Voltammetry |
| CWZ | Cell Working Zone |
| DFT | Density Functional Theory |
| EF | Electric Field |
| EFGR | Electric Field Generated at the Receiver molecule |
| HF | Hartree-Fock |
| MQCA | Molecular Quantum-dot Cellular Automata |
| MUT | Molecule Under Test |
| QCA | Quantum-dot Cellular Automata |
| TSA | Two-State Approximation |
| VACT | Vin–Aggregated Charge Transcharacteristics |
| VOT | VOuT Map |
| VVT | Vin–Vout Transcharacteristics |
References
- Lent, C.S.; Tougaw, P.D.; Porod, W. Bistable saturation in coupled quantum dots for quantum cellular automata. Appl. Phys. Lett. 1993, 62, 714–716. [Google Scholar] [CrossRef]
- Lent, C.S.; Tougaw, P.D.; Porod, W.; Bernstein, G.H. Quantum cellular automata. Nanotechnology 1993, 4, 49–57. [Google Scholar] [CrossRef] [Green Version]
- Vacca, M.; Graziano, M.; Zamboni, M. Nanomagnetic Logic Microprocessor: Hierarchical Power Model. IEEE Trans. VLSI Syst. 2012, 21, 1410–1420. [Google Scholar] [CrossRef]
- Lent, C.S.; Tougaw, P.D. Lines of interacting quantum-dot cells: A binary wire. J. Appl. Phys. 1993, 74, 6227–6233. [Google Scholar] [CrossRef]
- Pulimeno, A.; Graziano, M.; Wang, R.; Demarchi, D.; Piccinini, G. Charge distribution in a molecular QCA wire based on bis-ferrocene molecule. In Proceedings of the IEEE/ACM International Symposium on Nanoscale Architectures, New York, NY, USA, 15–17 July 2013. [Google Scholar]
- Pulimeno, A.; Graziano, M.; Piccinini, G. UDSM Trends Comparison: From Technology Roadmap to UltraSparc Niagara2. IEEE Trans. VLSI Syst. 2012, 20, 1341–1346. [Google Scholar] [CrossRef]
- Lu, Y.; Lent, C.S. A metric for characterizing the bistability of molecular quantum-dot cellular automata. Nanotechnology 2008, 19, 155703. [Google Scholar] [CrossRef] [PubMed]
- Lu, Y.; Liu, M.; Lent, C.S. Molecular quantum-dot cellular automata: From molecular structure to circuit dynamics. J. Appl. Phys. 2007, 102, 034311. [Google Scholar] [CrossRef]
- Timler, J.; Lent, C.S. Maxwell’s demon and quantum-dot cellular automata. J. Appl. Phys. 2003, 94, 1050–1060. [Google Scholar] [CrossRef]
- Orlov, A.; Imre, A.; Csaba, G.; Ji, L.; Porod, W.; Bernstein, G.H. Magnetic quantum-dot cellular automata: Recent developments and prospects. J. Nanoelectron. Optoelectron. 2008, 3, 55–68. [Google Scholar] [CrossRef]
- Vacca, M.; Graziano, M.; Zamboni, M. Majority Voter Full Characterization for NanoMagnet Logic Circuits. IEEE Trans. Nanotechnol. 2012, 11, 940–947. [Google Scholar] [CrossRef]
- Timler, J.; Lent, C.S. Power gain and dissipation in quantum-dot cellular automata. J. Appl. Phys. 2002, 91, 823–831. [Google Scholar] [CrossRef]
- Lent, C.S.; Isaksen, B. Clocked molecular quantum-dot cellular automata. IEEE Trans. Electron Devices 2003, 50, 1890–1896. [Google Scholar] [CrossRef]
- Graziano, M.; Vacca, M.; Chiolerio, A.; Zamboni, M. A NCL-HDL Snake-Clock Based Magnetic QCA Architecture. IEEE Trans. Nanotechnol. 2011, 10, 1141–1149. [Google Scholar] [CrossRef]
- Lent, C.S.; Isaksen, B.; Lieberman, M. Molecular quantum-dot cellular automata. J. Am. Chem. Soc. 2003, 125, 1056–1063. [Google Scholar] [CrossRef] [PubMed]
- Lu, Y.; Lent, C.S. Theoretical Study of Molecular Quantum-Dot Cellular Automata. J. Comput. Electron. 2005, 4, 115–118. [Google Scholar] [CrossRef]
- Wang, X.; Yu, L.; Inakollu, V.S.S.; Pan, X.; Ma, J.; Yu, H. Molecular Quantum Dot Cellular Automata Based on Diboryl Monoradical Anions. J. Phys. Chem. C 2018, 122, 2454–2460. [Google Scholar] [CrossRef]
- Siccardi, S.; Adamatzky, A. Actin quantum automata: Communication and computation in molecular networks. J. Appl. Phys. 2015, 6, 15–27. [Google Scholar] [CrossRef]
- Sadhu, T.; Das, B.; De1, D.; Das, J.C. Design of binary subtractor using actin quantum cellular automata. IET Nanobiotechnol. 2018, 12, 32–39. [Google Scholar] [CrossRef]
- Qi, H.; Sharma, S.; Li, Z.; Snider, G.L.; Orlov, A.O.; Lent, C.S.; Fehlner, T.P. Molecular quantum cellular automata cells. Electric field driven switching of a silicon surface bound array of vertically oriented two-dot molecular quantum cellular automata. J. Am. Chem. Soc. 2003, 125, 15250–15259. [Google Scholar] [CrossRef] [PubMed]
- Zoli, L. Active Bis-Ferrocene Molecules as Unit for Molecular Computation. Ph.D. Thesis, Universitad́i Bologna, Bologna, Italy, 2010. [Google Scholar]
- Arima, V.; Iurlo, M.; Zoli, L.; Kumar, S.; Piacenza, M.; della Sala, F.; Matino, F.; Maruccio, G.; Rinaldi, R.; Paolucci, F.; et al. Toward quantum-dot cellular automata units: Thiolated-carbazole linked bisferrocenes. Nanoscale 2012, 4, 813–823. [Google Scholar] [CrossRef] [PubMed]
- Pulimeno, A.; Graziano, M.; Abrardi, C.; Demarchi, D.; Piccinini, G. Molecular QCA: A write-in system based on electric fields. In Proceedings of the IEEE International NanoElectronics Conference, Tao-Yuan, Taiwan, 21–24 June 2011. [Google Scholar]
- Pulimeno, A.; Graziano, M.; Demarchi, D.; Piccinini, G. Towards a molecular QCA wire: Simulation of write-in and read-out systems. Solid-State Electron. 2012, 77, 101–107. [Google Scholar] [CrossRef]
- Pulimeno, A.; Graziano, M.; Piccinini, G. Molecule Interaction for QCA Computation. In Proceedings of the IEEE-NANO, Birmingham, UK, 20–23 August 2012. [Google Scholar]
- Pulimeno, A.; Graziano, M.; Sanginario, A.; Cauda, V.; Demarchi, D.; Piccinini, G. Bis-ferrocene molecular QCA wire: Ab-initio simulations of fabrication driven fault tolerance. IEEE Trans. Nanotechnol. 2013, 12, 498–507. [Google Scholar] [CrossRef]
- Vankamamidi, V.; Ottavi, M.; Lombardi, F. Clocking and Cell Placement for QCA. In Proceedings of the IEEE-NANO, Cincinnati, OH, USA, 17–20 July 2006; Volume 1, pp. 343–346. [Google Scholar]
- Pulimeno, A.; Graziano, M.; Antidormi, A.; Wang, R.; Zahir, A.; Piccinini, G. Understanding a Bisferrocene Molecular QCA Wire. In Field-Coupled Nanocomputing; Anderson, N., Bhanja, S., Eds.; Lecture Notes in Computer Science; Springer: Berlin, Heidelberg, 2014; pp. 307–338. Volume 8280, ISBN 978-3662437223. [Google Scholar]
- Wang, R.; Chilla, M.; Palucci, A.; Graziano, M.; Piccinini, G. An effective algorithm for clocked field-coupled nanocomputing paradigm. In Proceedings of the IEEE Nanotechnology Materials and Devices Conference (NMDC), Toulouse, France, 9–12 October 2016. [Google Scholar]
- Frisch, M.J.; Trucks, G.W.; Schlegel, H.B.; Scuseria, G.E.; Robb, M.A.; Cheeseman, J.R.; Scalmani, G.; Barone, V.; Mennucci, B.; Petersson, G.A.; et al. Gaussian09 Revision A.1; Gaussian Inc.: Wallingford, CT, USA, 2009. [Google Scholar]
- Ding, F.; Chen, S.; Wang, H. Computational Study of Ferrocene-Based Molecular Frameworks with 2,5-Diethynylpyridine as a Chemical Bridge. Materials 2010, 3, 2668–2683. [Google Scholar] [CrossRef] [Green Version]
- Singh, U.C.; Kollman, P.A. An approach to computing electrostatic charges for molecules. J. Comput. Chem. 1984, 5, 129–145. [Google Scholar] [CrossRef]
- Pulimeno, A. Molecular Quantum-Dot Cellular Automata (QCA). Ph.D. Thesis, Politecnico di Torino, Torino, Italy, 2013. [Google Scholar]
Figure 1.
Six dots molecular QCA cell. (a) The free charges are confined in the main dots along a diagonal, encoding thus the logic states 1 and 0; (b) When the free charges are forced in the central dot the cell is in the so-called NULL state.
Figure 1.
Six dots molecular QCA cell. (a) The free charges are confined in the main dots along a diagonal, encoding thus the logic states 1 and 0; (b) When the free charges are forced in the central dot the cell is in the so-called NULL state.

Figure 2.
Structure of the QCA candidate molecules. (a) Diallyl-butane: the two allyl groups represent the dots. Here a third fictitious dot, including the butane bridge, is sketched just for charge balancing reason; (b) Decatriene: the three ethylene groups are the dots; in particular, dot1 and dot2 are the main dots responsible for the binary encoding; (c) Bis-ferrocene: the ferrocenes represent the two main dots, while the carbazole bridge acts as the third dot.

Figure 3.
Basic schematic for the derivation of figures of merit. (a) Vin–Vout scheme, evaluated in presence of a switching field; (b) Vin–Vout scheme, evaluated in presence of nearby molecules; (c) Basic schematic for the derivation of VOMs; (d) Example of VOM.
Figure 3.
Basic schematic for the derivation of figures of merit. (a) Vin–Vout scheme, evaluated in presence of a switching field; (b) Vin–Vout scheme, evaluated in presence of nearby molecules; (c) Basic schematic for the derivation of VOMs; (d) Example of VOM.

Figure 4.
Bis-ferrocene molecule analysis. (a) Comparison of the potential generated by a bis-ferrocene molecule computed using: molecular dipole moment, atomic charges and the proposed Aggregated Charge. The potential is evaluated on a segment parallel to the active segment connecting the two ferrocenes at a distance of 1 nm (typical Receiver position). In the potential calculation that uses the dipole, an additive term equal to is inserted to consider the oxidation of the molecule; (b) Comparison in the Vin–Vout Transcharacteristics evaluated using the Two-State Approximation (TSA) theory and computed with ab initio.

Figure 5.
Dot charges as a function of the applied electric field for the three molecules (VACT). (a) Neutral diallyl-butane; (b) Neutral decatriene; (c) Neutral bis-ferrocene; (d) Oxidized diallyl-butane; (e) Oxidized decatriene; (f) Oxidized bis-ferrocene.
Figure 5.
Dot charges as a function of the applied electric field for the three molecules (VACT). (a) Neutral diallyl-butane; (b) Neutral decatriene; (c) Neutral bis-ferrocene; (d) Oxidized diallyl-butane; (e) Oxidized decatriene; (f) Oxidized bis-ferrocene.

Figure 6.
Electric field generated by the charge distribution of the oxidized bis-ferrocene at the equilibrium and computed along the three spatial components. (a) EF along x, computed with the atomic charges; (b) EF along y, computed with the atomic charges; (c) EF along z, computed with the atomic charges; (d) EF along x, computed with the Aggregated Charges; (e) EF along y, computed with the Aggregated Charges; (f) EF along z, computed with the Aggregated Charges.

Figure 7.
Electric field generated by the charge distribution of molecules at the equilibrium and computed along the working dot axis. (a) EF generated by the oxidized diallyl-butane computed with the atomic charges, considering the atomic charges; (b) EF generated by the oxidized decatriene computed with the atomic charges, considering the atomic charges; (c) EF generated by the oxidized diallyl-butane computed with the atomic charges, considering the Aggregated Charges; (d) EF generated by the oxidized decatriene computed with the atomic charges, considering the Aggregated Charges.

Figure 8.
Electric field generated by the charge distribution of the three oxidized molecules at the equilibrium. The curves are computed at the position of the virtual Receiver and along the working dot axis.
Figure 8.
Electric field generated by the charge distribution of the three oxidized molecules at the equilibrium. The curves are computed at the position of the virtual Receiver and along the working dot axis.

Figure 9.
Electric field generated by the charge distribution of the three oxidized molecules under the effect of the minimum switching field that localizes all the positive charge in one of the two working dots [33]. The curves are computed at the position of an ideal Receiver and along the working dot axis. Vertical bars underline the range of interest between the two dots. Null, positive and negative electric fields are applied as biasing condition at the MUT. (a) Diallyl-butane; (b) Decatriene; (c) Bis-ferrocene.

Figure 10.
Equivalent voltage at the Receiver (Vout) as a function of the voltage applied to the molecule (Vin, given by the switching field), for different molecule-receiver distance d. (a) Diallyl-butane; (b) Decatriene; (c) Bis-ferrocene.
Figure 10.
Equivalent voltage at the Receiver (Vout) as a function of the voltage applied to the molecule (Vin, given by the switching field), for different molecule-receiver distance d. (a) Diallyl-butane; (b) Decatriene; (c) Bis-ferrocene.

Figure 11.
Vout maps (VOM) for the bis-ferrocene molecule. (a) VOM for input encoding a Logic ‘1’ V; (b) VOM at the equilibrium V; (c) VOM for input encoding a Logic ‘0’ V.
Figure 11.
Vout maps (VOM) for the bis-ferrocene molecule. (a) VOM for input encoding a Logic ‘1’ V; (b) VOM at the equilibrium V; (c) VOM for input encoding a Logic ‘0’ V.

Figure 12.
MQCA cell working zone–CWZ for bis-ferrocene with input voltage V.

© 2018 by the authors. Licensee MDPI, Basel, Switzerland. This article is an open access article distributed under the terms and conditions of the Creative Commons Attribution (CC BY) license (http://creativecommons.org/licenses/by/4.0/).
Share and Cite
MDPI and ACS Style
Ardesi, Y.; Pulimeno, A.; Graziano, M.; Riente, F.; Piccinini, G. Effectiveness of Molecules for Quantum Cellular Automata as Computing Devices. J. Low Power Electron. Appl. 2018, 8, 24. https://doi.org/10.3390/jlpea8030024
AMA Style
Ardesi Y, Pulimeno A, Graziano M, Riente F, Piccinini G. Effectiveness of Molecules for Quantum Cellular Automata as Computing Devices. Journal of Low Power Electronics and Applications. 2018; 8(3):24. https://doi.org/10.3390/jlpea8030024
Chicago/Turabian StyleArdesi, Yuri, Azzurra Pulimeno, Mariagrazia Graziano, Fabrizio Riente, and Gianluca Piccinini. 2018. "Effectiveness of Molecules for Quantum Cellular Automata as Computing Devices" Journal of Low Power Electronics and Applications 8, no. 3: 24. https://doi.org/10.3390/jlpea8030024
Note that from the first issue of 2016, this journal uses article numbers instead of page numbers. See further details here.