Article

An Experimental Characterization for Injection Quantity of a High-pressure Injector in GDI Engines

Department of Electrical Engineering, Kao Yuan University, Kaohsiung 82151, Taiwan
*
Author to whom correspondence should be addressed.
J. Low Power Electron. Appl. 2018, 8(4), 36; https://doi.org/10.3390/jlpea8040036
Submission received: 28 August 2018 / Revised: 20 September 2018 / Accepted: 27 September 2018 / Published: 3 October 2018

Abstract

:
The high-pressure (HP) injector is a highly dynamic component requiring careful voltage and pressure input modulation to achieve the required fuel injection quantities of gasoline direct injection (GDI) engines. Accurate fuel injection curves are a key influence for this technology, and therefore, will require an accurate estimation of fuel flow rate to be realized. In order to be driven to rapid response with respect to solenoid valve coils, HP injectors typically require to be designed to be capable of rapid response in GDI engines. In this paper, the design and analysis of the proposed injector drive circuit are presented. Next, the effects of total pulse width, injector supply voltage, fuel system pressure, and pulse width modulation (PWM) operation on fuel injection quantities of an HP injector are measured for achieving robust performance and stability in the presence of bounded errors of the GDI injectors due to total pulse width, injector’s supply voltage, fuel pressure and PWM operation. Additionally, the fuel injection quantities of the HP injector are measured by tuning the parameters of the injector drive circuit with the PWM operation. These are defined as the fuel injection curves. Finally, experimental results are provided for verification of the proposed injector drive circuit.

1. Introduction

Many advanced solenoid fuel injection techniques have been developed to be implemented in various investigations of gasoline direct injection (GDI) engines [1]. The effects of fuel injection pressure have been studied as a variation on PM emissions from a SGDI engine. It was found that the particle number emissions decreased at higher injection pressure. Accurate injection control with rapid response will have some benefit of reducing fuel injector deposits and reducing particulate emissions from GDI engines [2,3]. Particulate number (PN) emissions from GDI engines and their control techniques have been reviewed [4,5]. The electronic unit injector is the major component in the high-pressure fuel injection system. The injector drive circuit has been optimized and projected to generate optimal values of two-stage currents by a coupled simulation of injector electromagnetic, needle rigid body motion and a computational fluid dynamics model [6,7]. Two-stage current shapes were conducted into the analysis of the performance of the drive circuits and were found to be the optimal power strategy for driving the fuel injector under different supply pressures [8]. The design of experiments (DOE) optimized the injector drive circuit by using the Taguchi method. The experiments of the HP injector driving circuit were conducted for the fuel injection quantity of the HP injector by controlling the fuel pressure and voltage across the solenoid coil, which further increased the response speed of the valve. Experimental results showed that the current drive circuit is feasible and reliable to implement for injection quantity of the HP injector [9]. The injector drive circuit was designed in a three-stage driving current with adjustable pulse width modulation (PWM) duties added to last pulse operation, and simulated by using PSpice software. The electrical drive circuit for the high-pressure GDI injector was developed for a 500 c.c. motorbike engine [10]. The different types of power losses associated with a solenoid injector were investigated. Remarkable differences in the power losses and the performances of the injector were found while it worked within different driven strategies. Simulation results of power losses were investigated and compared to experimental results to verify its feasibility [11]. The experimental data of the HP fuel injection system was investigated by various electrical drive circuit designs proposed for the HP injector [12,13,14,15].
Controllers for GDI injectors have been established; however, further research is required to apply and conduct for the custom-made GDI injectors in the GDI engines. The methodology and fuel injection curves can give some useful directions for designers and other researchers who will do the investigations on analyzing and tuning the GDI control systems for performance and robustness. The proposed experimental investigation on the characterization of a high-pressure GDI injector, which is the main contribution of the paper, is interesting and helps researchers to achieve robust performance and stability in the presence of bounded errors of the GDI injectors due to total pulse width, first-stage turn-on pulse width, injector’s supply voltage, fuel pressure, and PWM operation. Therefore, depending on the application and required robust controller, the experimental investigation on the characterization of a high-pressure GDI injector is important. In this study, injector drive circuits were designed to satisfy the rapid response and sustain the instantaneous surge currents for various HP GDI injectors. The designed electric drive circuit was tested to verify its feasibility. The experiment for the GDI injection quantities was conducted under 60–100 bars of fuel pressure, 1200–2000 μs injecting pulse duration, and DC 40–70 V executing supply voltage. Additionally, PWM on/off control operation was introduced to the holding current during the last pulse duration for rapid response time to turn off the GDI injector. Design and analysis of the proposed injector drive circuit are presented in the paper. Next, effects of total pulse width, injector supply voltage, fuel system pressure, and PWM operation on fuel injection quantities of an HP injector were measured. The measured data of the HP injector fed by the injector drive circuit are defined in fuel injection curves. Results show that the HP fuel supply system for GDI engines is capable of operating stably and assuring the accurate injection quantities by the three-pulse power metal oxide semiconductor field effect transistors (MOSFETs) electric drive circuit.

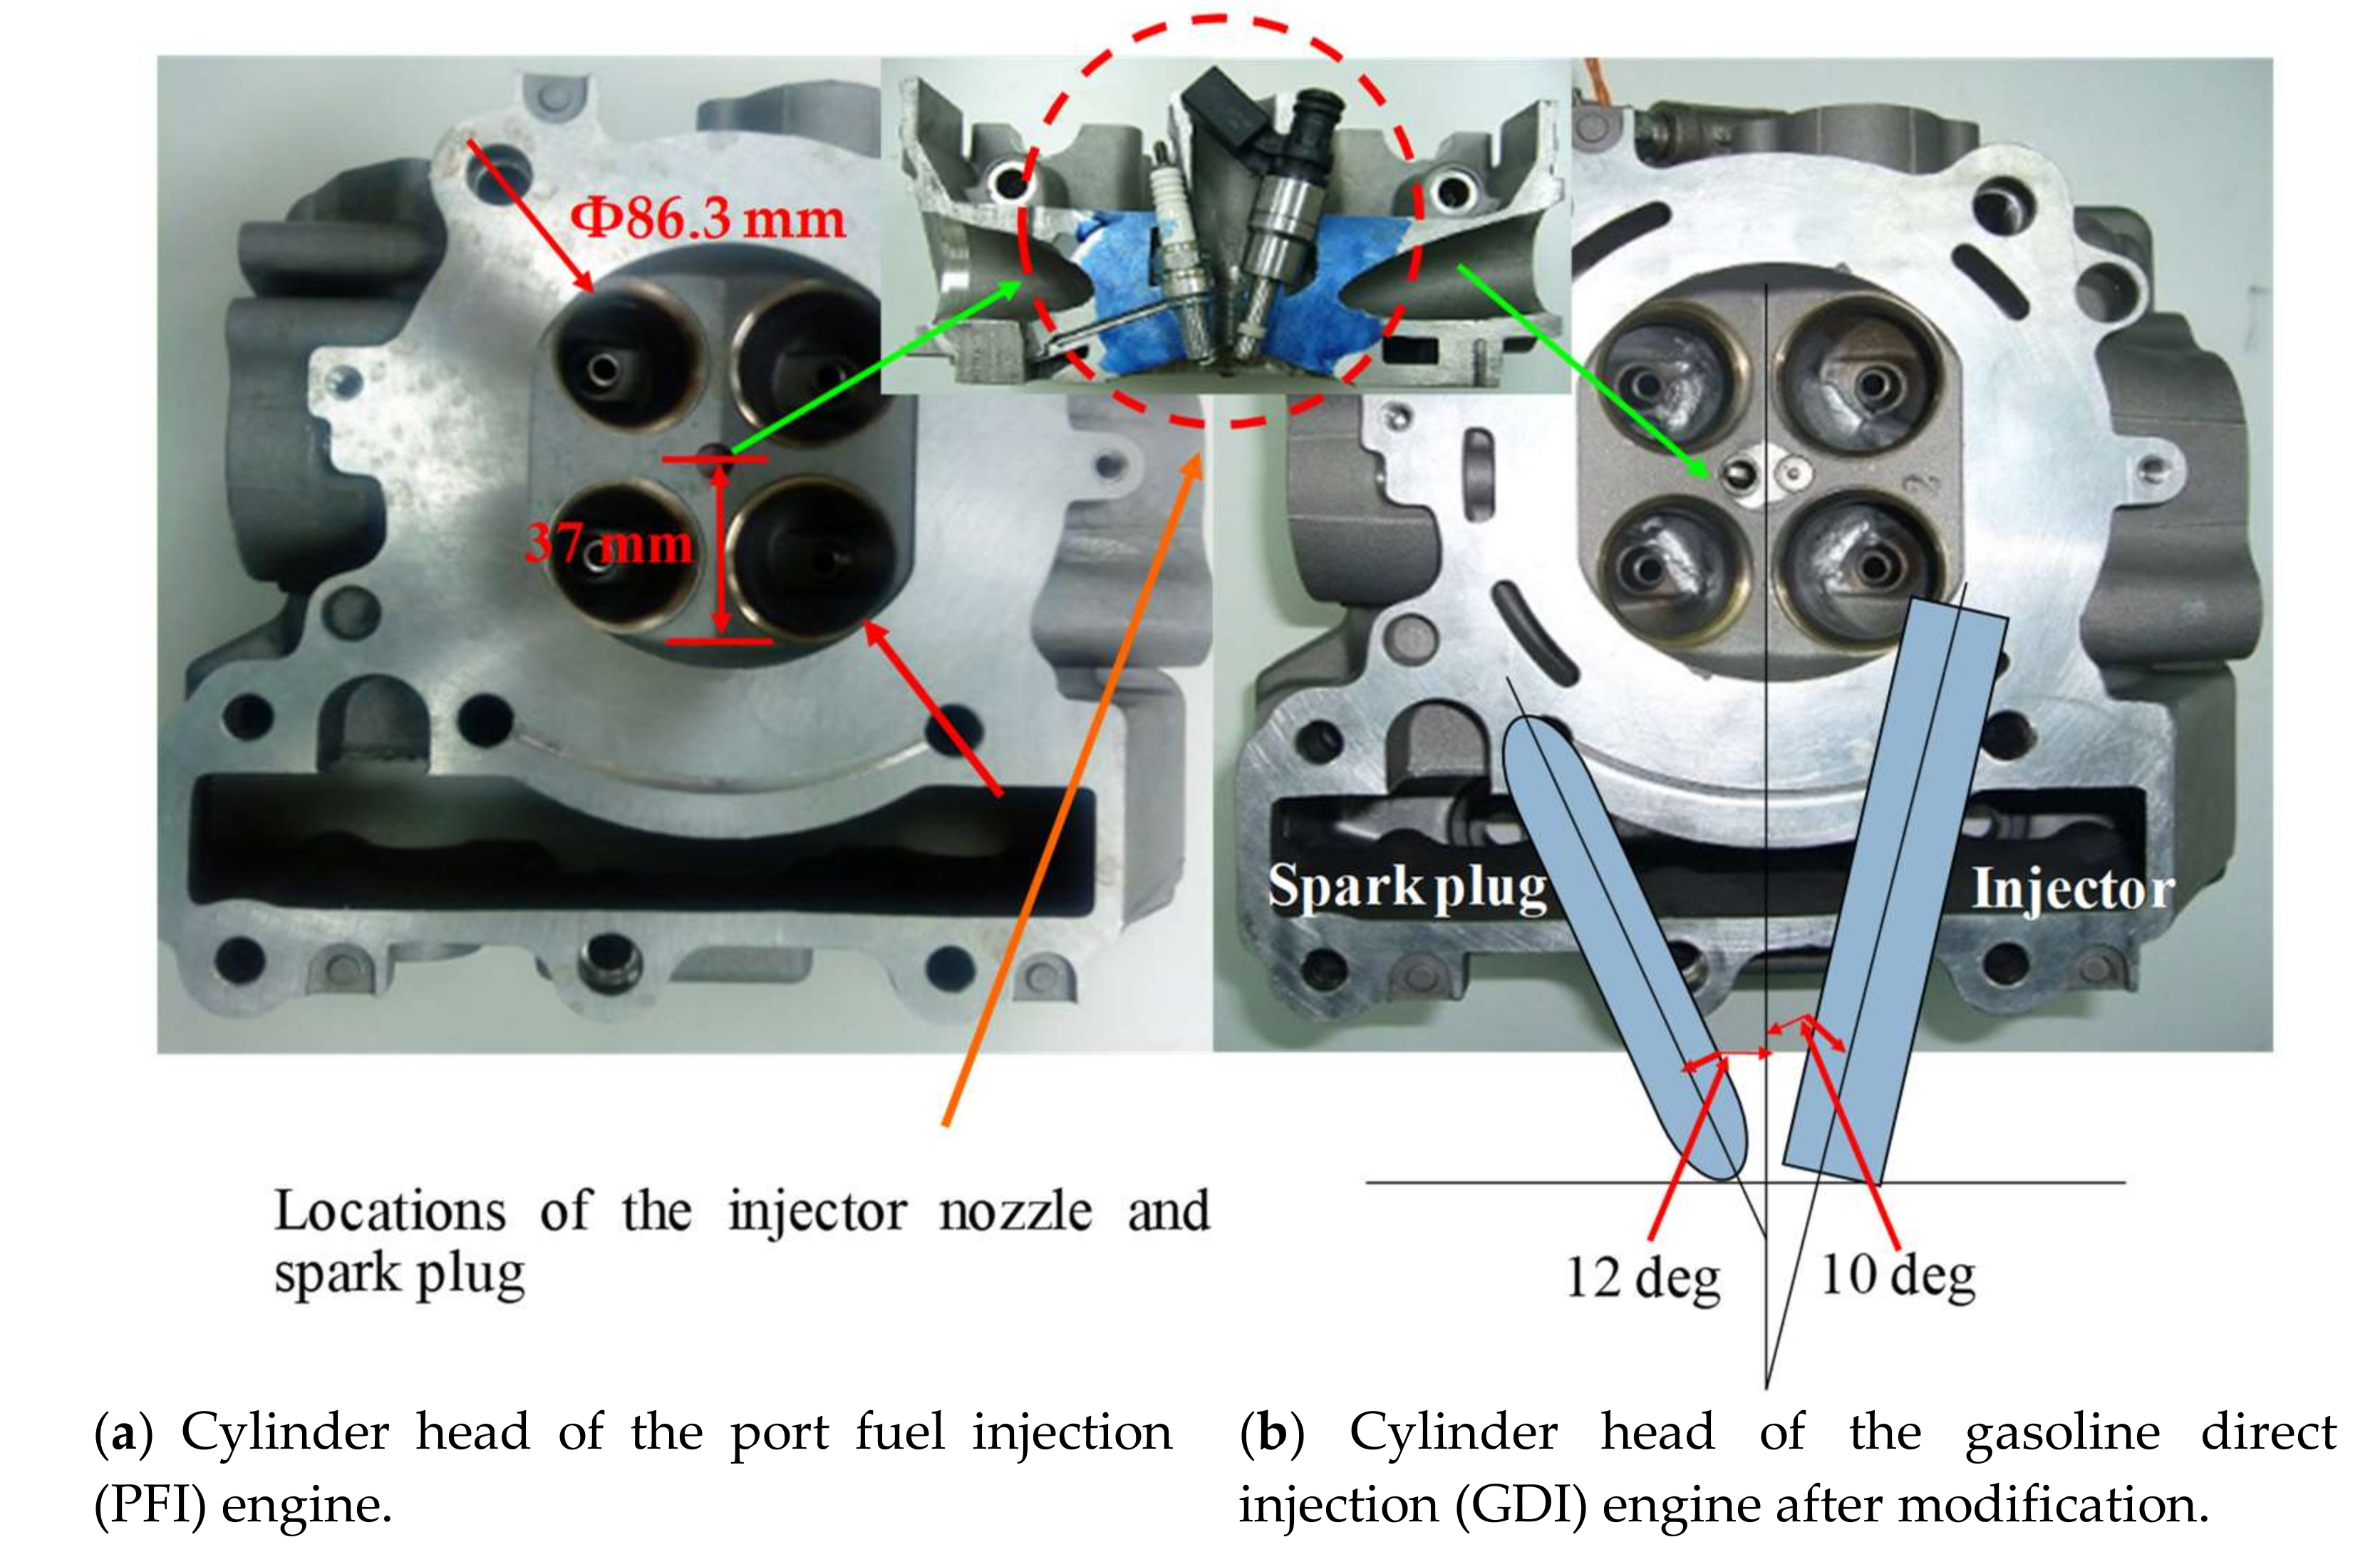
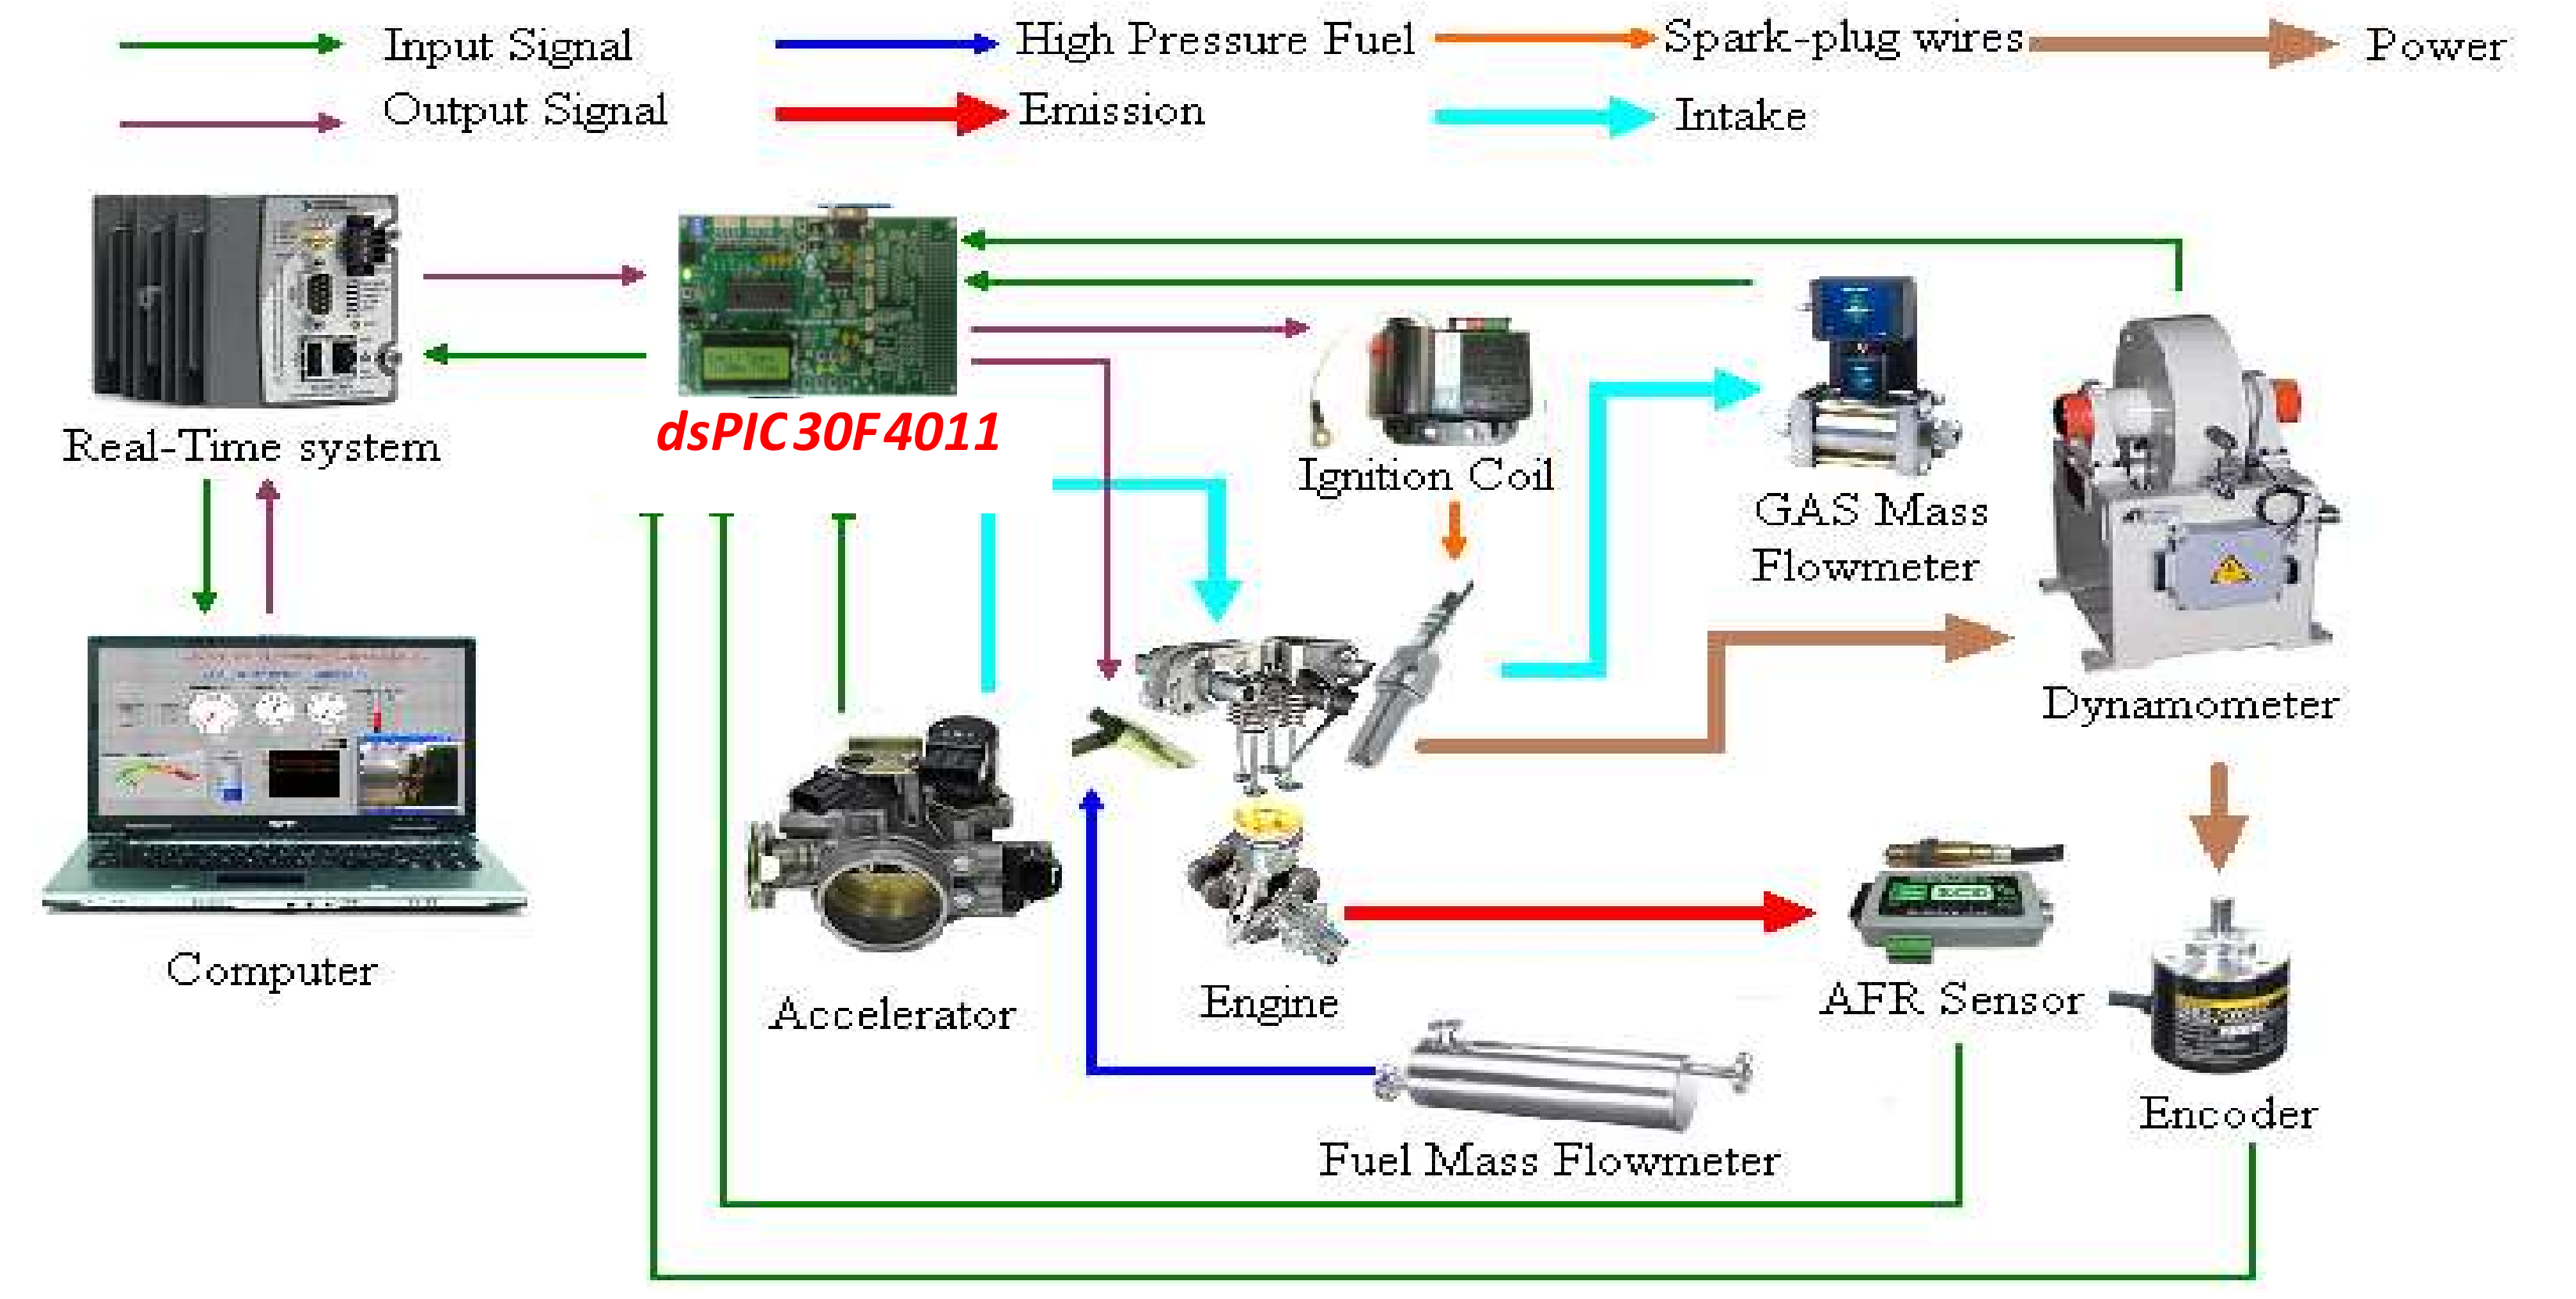
2. The Modified KYMCO Xciting-500 GDI Engine

The pressure at which the fuel is injected into the combustion chamber through an injector is an important factor, as it directly affects the performance of an engine. GDI engines are injected into the combustion chamber at pressures ranging from 100 bars to 120 bars (e.g., in 1.6 L Gamma GDI and ThetaNu 2.0 L GDI). Modern GDI injectors can even have injection pressures up to 200 bars (e.g., in 1.6 Ford Ecoboost GTDi and LambdaII 3.0 V6 GDI). However, the fuel pressure system for the present study, carried out on the modified KYMCO Xciting-500 GDI engine, is at 100 bars. Figure 1a illustrates the cylinder head of the port fuel injection (PFI) engine. The specifications of the base engine with the PFI are shown in Table 1. Figure 1b shows a schematic picture of this PFI engine, with certain modifications in its cylinder head. Limited by the structure of the cylinder head, the fuel injector and the spark plug are, respectively, center-mounted at an induced angle of the left-hand 10° and the right-hand 12° to the vertical plane between the intake and exhaust valves. A testing study was carried out on the modified KYMCO Xciting-500 GDI engine. An experimental configuration of a 500 c.c. GDI engine system is shown in Figure 2.

2.1. The High-Pressure GDI Fuel Injection System

Gasoline Direct Injection technology is a superior option due to its advantages of fuel economy and emission reduction from gasoline-powered vehicles. An HP fuel supply system in GDI engines directly injects fuel to the cylinder of the engine. The HP fuel injector is a key component of a GDI fuel injection system. The injection timing and duration is electronically controlled by an Electronic Control Unit (ECU). Various pulse durations can be sent to the fuel injector according to the engine’s actual operating conditions from the signals of engine sensors. The HP fuel injection system consists mainly of an HP fuel injector, electrical drive circuit, the fuel supply system, and an ECU. The constant pressure resource arranging from 60 to 100 bars provides for the injector of the fuel supply system. The ECU computes and analyzes the analogue and digital input signals from various engine sensors, controlling the injection pulse duration and timing of the injector. The engine performances can be improved by more rapid engine response in throttle positions, and more precise control of air/fuel ratio. In this study, a Bosch GDI single-hole injector was installed and tested on the cylinder head of a 500 c.c. motorcycle engine.

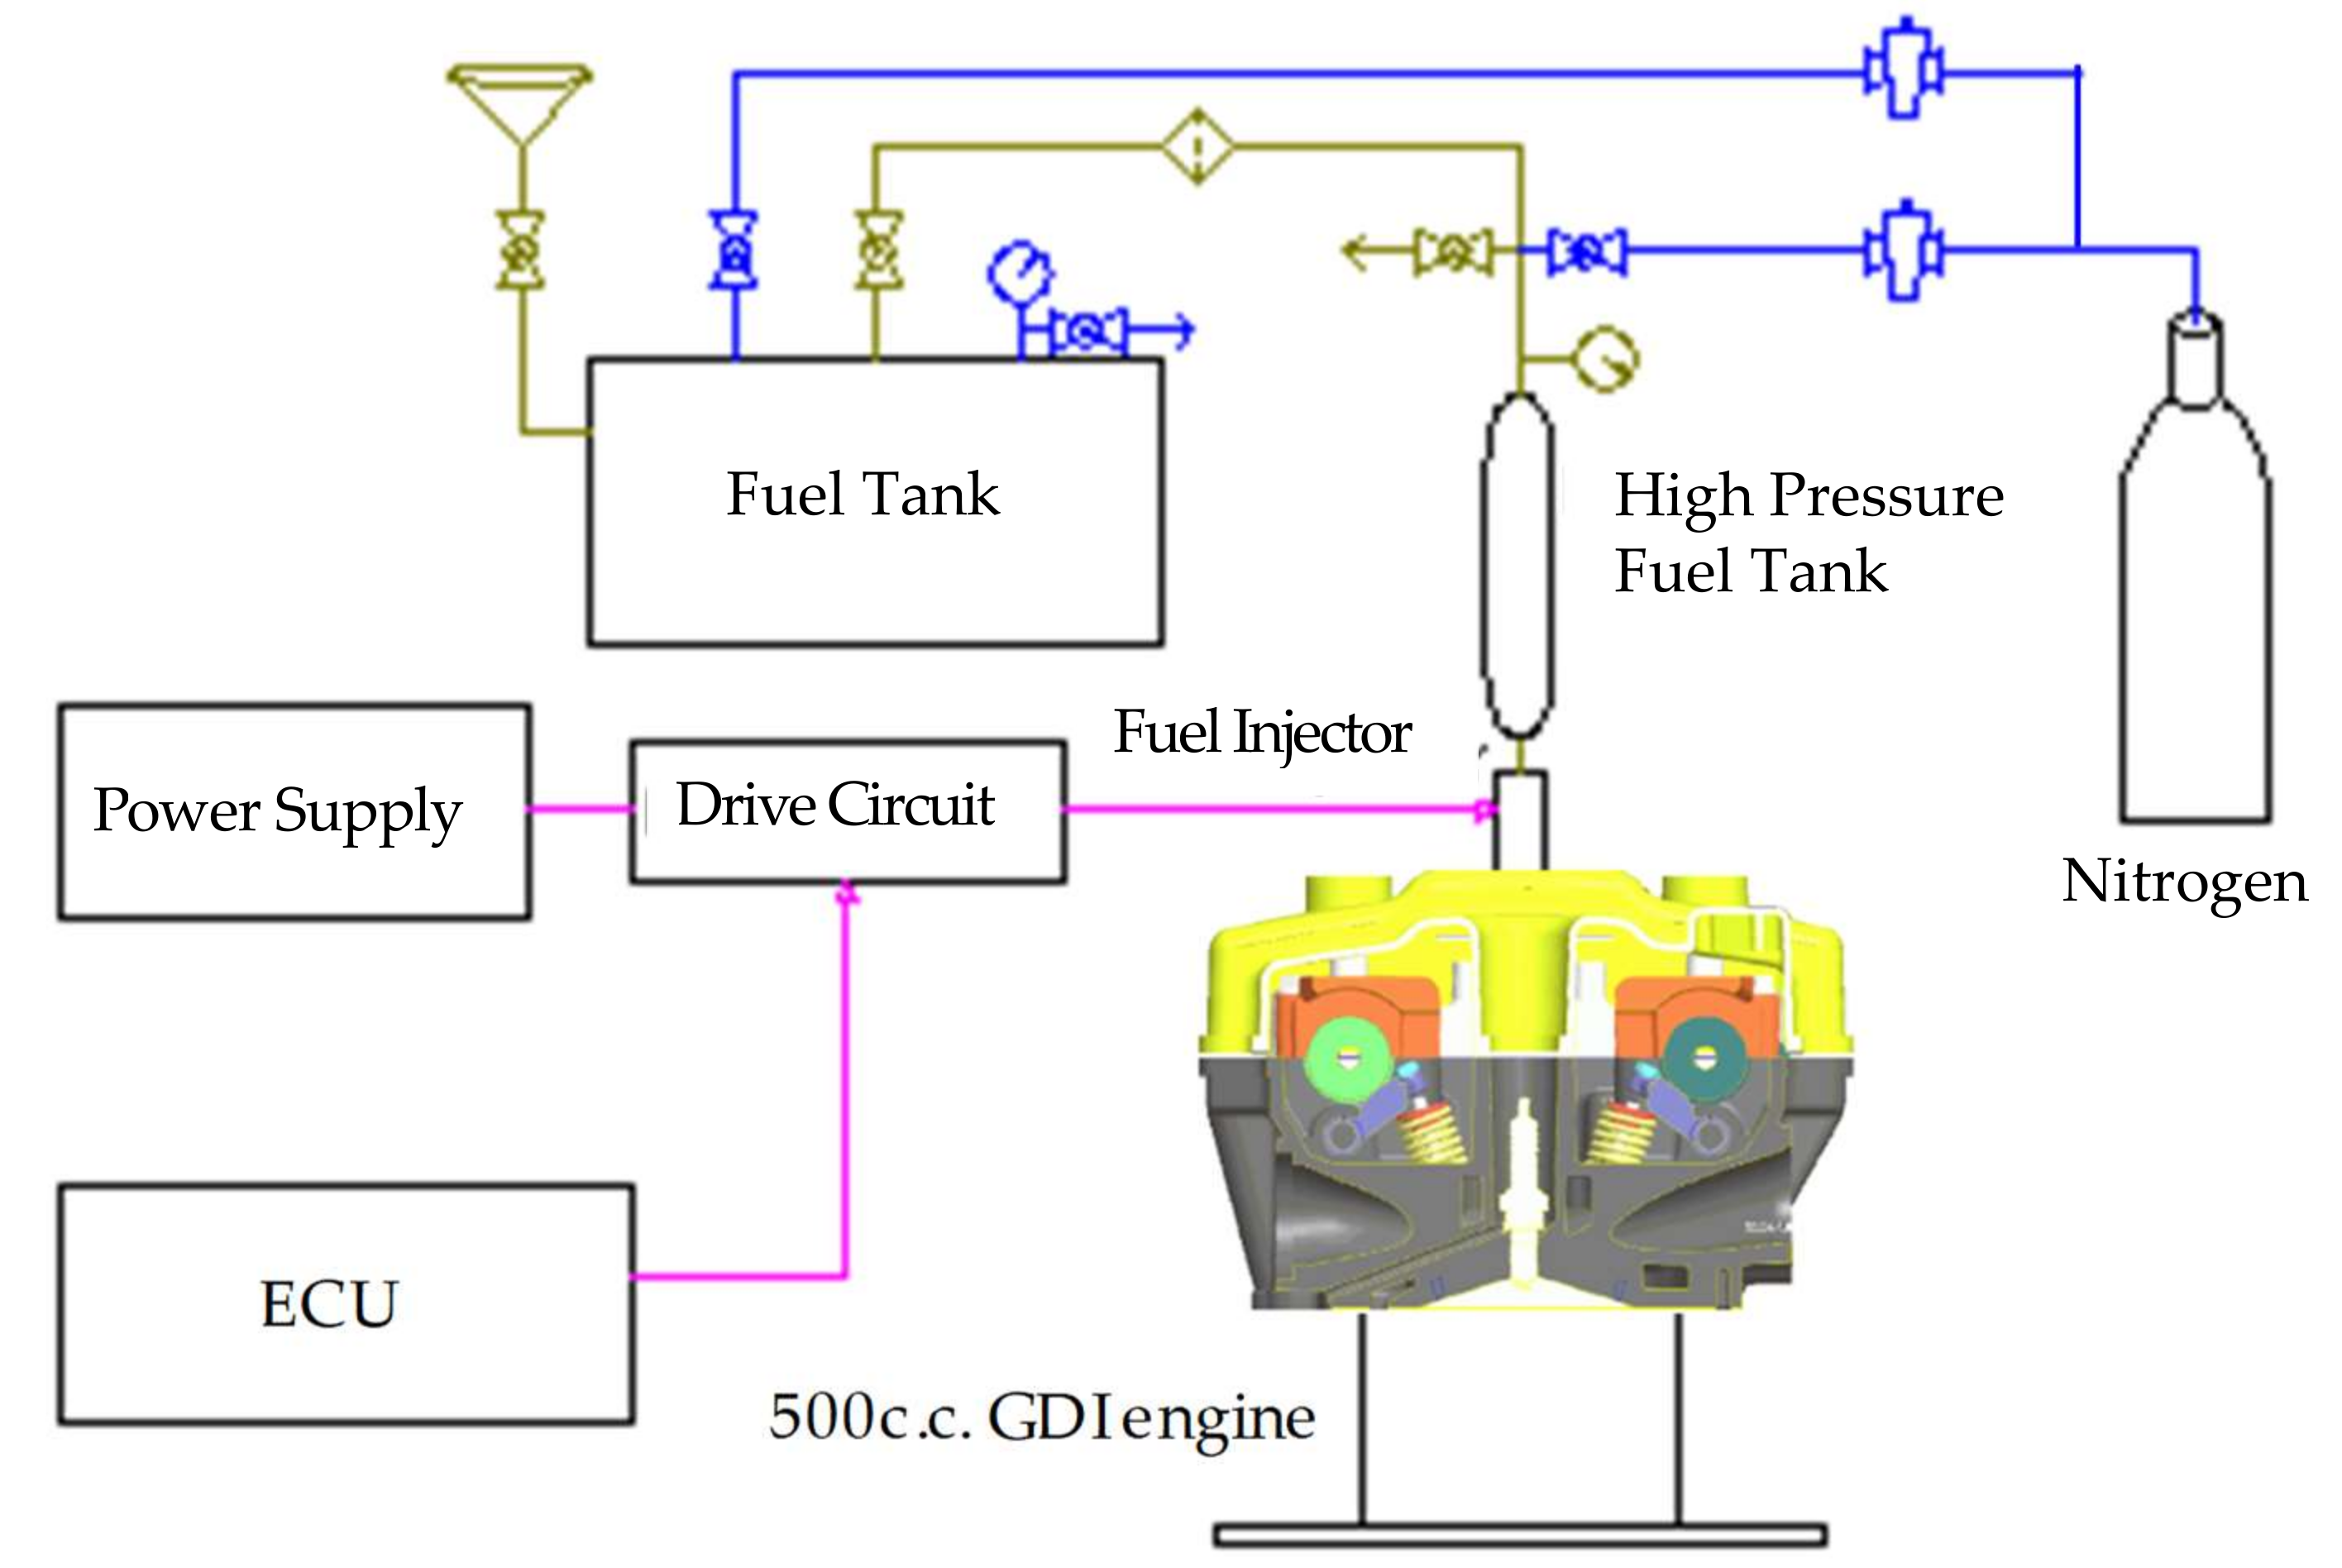
2.2. Fuel Supply System

The fuel supply system is similar to the conventional design of GDI engines in HP fuel containers. This research used a Bosch GDI single-hole injector that was installed in the test device. Its pressure could be operated between 60 and 100 bars (max) which has been commonly used in some GDI engines. In the fuel supply system illustrated in Figure 2, the HP nitrogen bottle pulls the operating pressure of the stainless fuel cylinder up to 60–100 bars (max). It was expected to maintain this constant value to avoid any disturbances to the GDI injector performance caused by the gasoline pump pressure dip at high speed operation of motorcycle engines. The cylinder pressure was maintained at a constant value through regulating HP nitrogen flow. The pressure fluctuation of the fuel container, caused by closing and opening of the nozzle, was about 0.5 bars.
The experimental equipment for characterizing the dynamic performances of the HP GDI injector is illustrated in Figure 3a. According to the test requirements, the parameters of the fuel injection system were calibrated properly to each part of the injector drive circuit. After the characterization of the injector’s dynamic performances, the fuel pressure in the GDI Bosch injector was mounted onto a 500 c.c. motorcycle engine cylinder head was set at 60–100 bars for the running test.

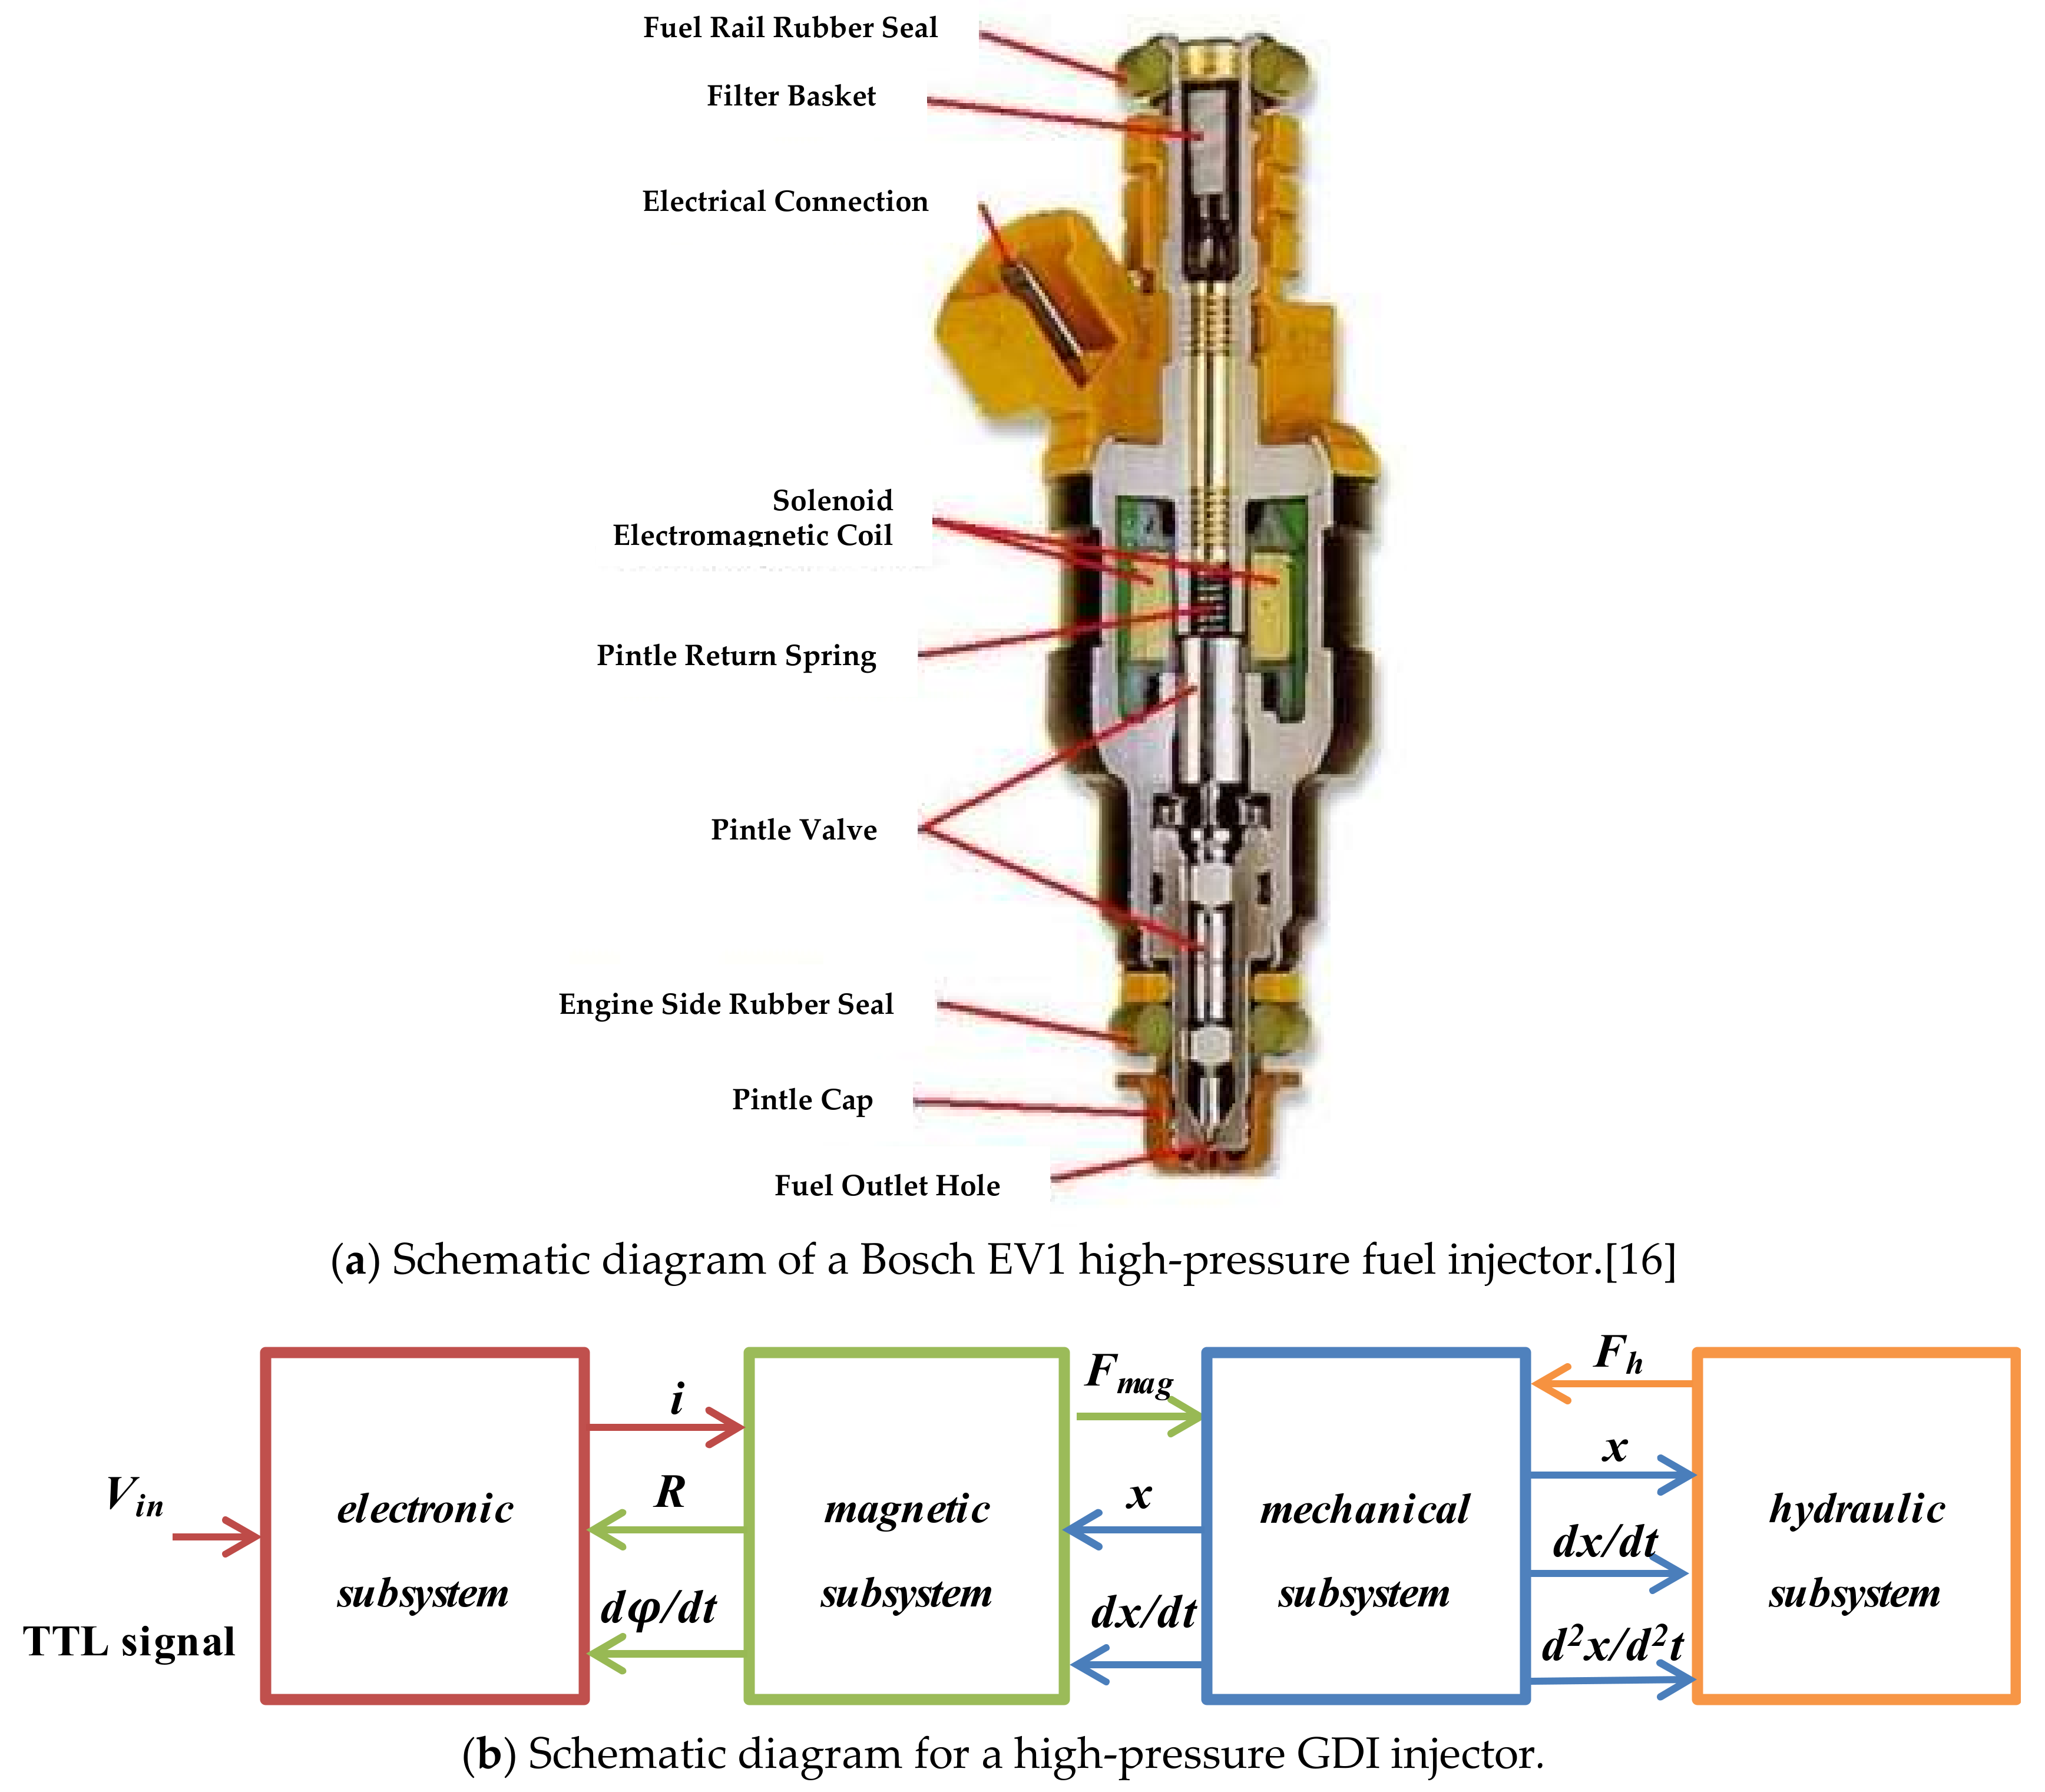
2.3. High-pressure Fuel Injector

In order to investigate the effect of the total pulse width on the fuel injection quantities, the power voltage was supplied by DC 60 V and the pressure of the fuel supply system were set to and 100 bars. An HP GDI injector is preferred for engines with small displacement in relation to the optimum angle of fuel atomization and spray penetration. However, due to the constraints of limited research into the development of small motorcycle GDI engines and the required time to design, test, modify and calibrate such a swirl injector, the Bosch GDI single-hole injector was used, based on analyzing the working principle of the electronic controlled injector. The injector was driven by a three-stage current waveform in accordance with the injector characteristics. It uses the solenoid valve as an electricity-fluid conversion element and controls the injection parameters precisely through the reference current waveforms. The minimum injection quantities are approximately 1200 μs of pulse duration with 14.07 mg in each pulse. This satisfies the requirements of the idle operation of motorcycle engines. Effects of various fuel pressures and pulse widths on fuel injection quantities for the GDI injector fed by the single-pulse (12 A) driving current was examined and characterized as illustrated in Figure 3b.

2.4. Mathematical Model

The injector uses a magnetic force to transmit energy from the solenoid actuator to the needle. A TTL signal by a pulse delayed generator is sent to the three-stage injector drive circuit as the input to the system. This triggers the driver to charge the solenoid coil up to DC 70 V. As current flows to the actuator, the 12 A current produced is sufficient to rapidly draw back the nozzle needle of the GDI injector when the fuel injecting pressure is set at 100 bars. The second drive pulse drives the GDI injector to produce the 5 A holding current and keep continuous injection. The last drive pulse of the drive circuit supplies the 3 A current to hold the nozzle needle for the GDI injector. Meanwhile, the injection status of the GDI injector continues, though it is ready to stop squirting. The schematic diagram of a high-pressure solenoid injector is shown in Figure 4a. The electromechanical model of the electronically controlled injector is comprised of two types: hydraulic volumes and moving apartments, according to each part’s hydraulic and dynamical characteristics. Fuel in hydraulic volumes can be compressed and its characteristics are based on the following equations [8]:
Δ P = Δ V V  
Fuel flow in and out of each volume can be described as Bernoulli equations:
Q = μ A 2 Δ P ρ  
According to the compression equation and the Bernoulli equation, we can get a function to describe the pressure change in hydraulic volume:
d P d t = [ Q i n + Q l e a k i n Q o u t Q l e a k o u t + A d x d t ] E V  
where Qin, Qout are the flow rate of fuel flowing in and out volume; Qleakin, Qleakout are the flow rate of fuel leaking in and out volume; A is the cross section of moving parts(needle); and x is the displacement of moving parts (needles). The dynamics of the moving components of the injector (needle and control piston) is calculated with the following, one-dimensional momentum equation [8]:
m d 2 x d t 2   +   ζ d x d t + kx = F m + F h + F e  
where x is the displacement of moving component; Fm the mechanical force; Fh the hydraulic force; and Fe the electromagnetic force. The electromagnetic actuator is one of the most important parts of the injector. The actuator can be sorted into electronic subsystem, magnetic subsystem, mechanical subsystem, and hydraulic subsystem. The simulation model is shown in Figure 4b. The relationships among each subsystem were formulated in the following equations:
{ ( L s +   L a )   d i d t   +   ( R s +   R a + R L )   i   +   V c   = V o i = C d V c d t d 2 x d t 2 = 1 m F m a g 1 m k ( x + x 0 ) 1 m F h 1 m ζ d x d t F m a g = μ 0 ( N i ) 2 S a 2 ( δ x ) 2 F h = f ( x , d x d t , P c o n , P b p a )  
where Ls/La are the input inductance and the actuator inductance, i is the actuator current; Rs/Ra are the input inductance and the actuator resistance; RL are the resistance to limit the peak current flow; Vo is the initial injector actuator voltage across the actuator, Vc and Cp-capacitor charge voltage and capacitance; x, m, ζ are the armature displacement, moving mass and damping constant; Fmag is the magnetic force; μ 0 is the magnetic permeability in vacuum; N is the coil number; Sa is the magnetic flux cross section area; δ is the initial gap; Fh is the hydraulic force; Pcon is the control volume pressure; and Pbpa is the back pressure of actuator.

2.5. Data Acquisition Card and ECU Controller

The Electronic Control Unit (ECU) was designed to be capable of precise A/F ratio control according to the requirements of various engine operating conditions. The injection pulse width and throttle angle can be tuned by the ECU to ensure proper A/F ratio and stable power output requirements (as depicted in Figure 5). The ECU includes the dsPIC30F4011 controller, signal acquisition card, and the printed circuit board (PCB), generating the three-stage injection pulses as well as the PWM control signal. The signals such as engine speed, top dead center (TDC), throttle position, fuel flow volume, air flow, water temperature, fuel supply pressure, etc., were received from various engine sensors. These signals were processed and then transmitted to the microchip dsPIC30F4011 for monitoring the operating conditions of motorcycle engines. The controller performed a logic operation for the A, Z, and proximity switch signals of motorcycle engines to determine the TDC on intake and compression of engines. The TDC on compression of engines is a reference (based) point. By using the reference point, the dsPIC30F4011 performed an arithmetic computation of engine parameters as speed, torque, throttle position, air flow, and fuel supply pressure to achieve the delay timing and duration of the injection driving pulse. The PWM control was added to the last pulse duration of injector driving current to rapidly turn off the GDI injector. The pulse and PWM control circuit output the two different duration injection pulses and a PWM control signal to drive the power MOSFETs in the injector driving circuit. Therefore, three-stage (12/5/3 A) peak and holding current profiles were supplied to the solenoid valve coils of the injector to induce the electromagnetic force to draw back and hold the nozzle needle of a GDI injector. The control system configuration for the 500 c.c. motorcycle engine is illustrated in Figure 5.

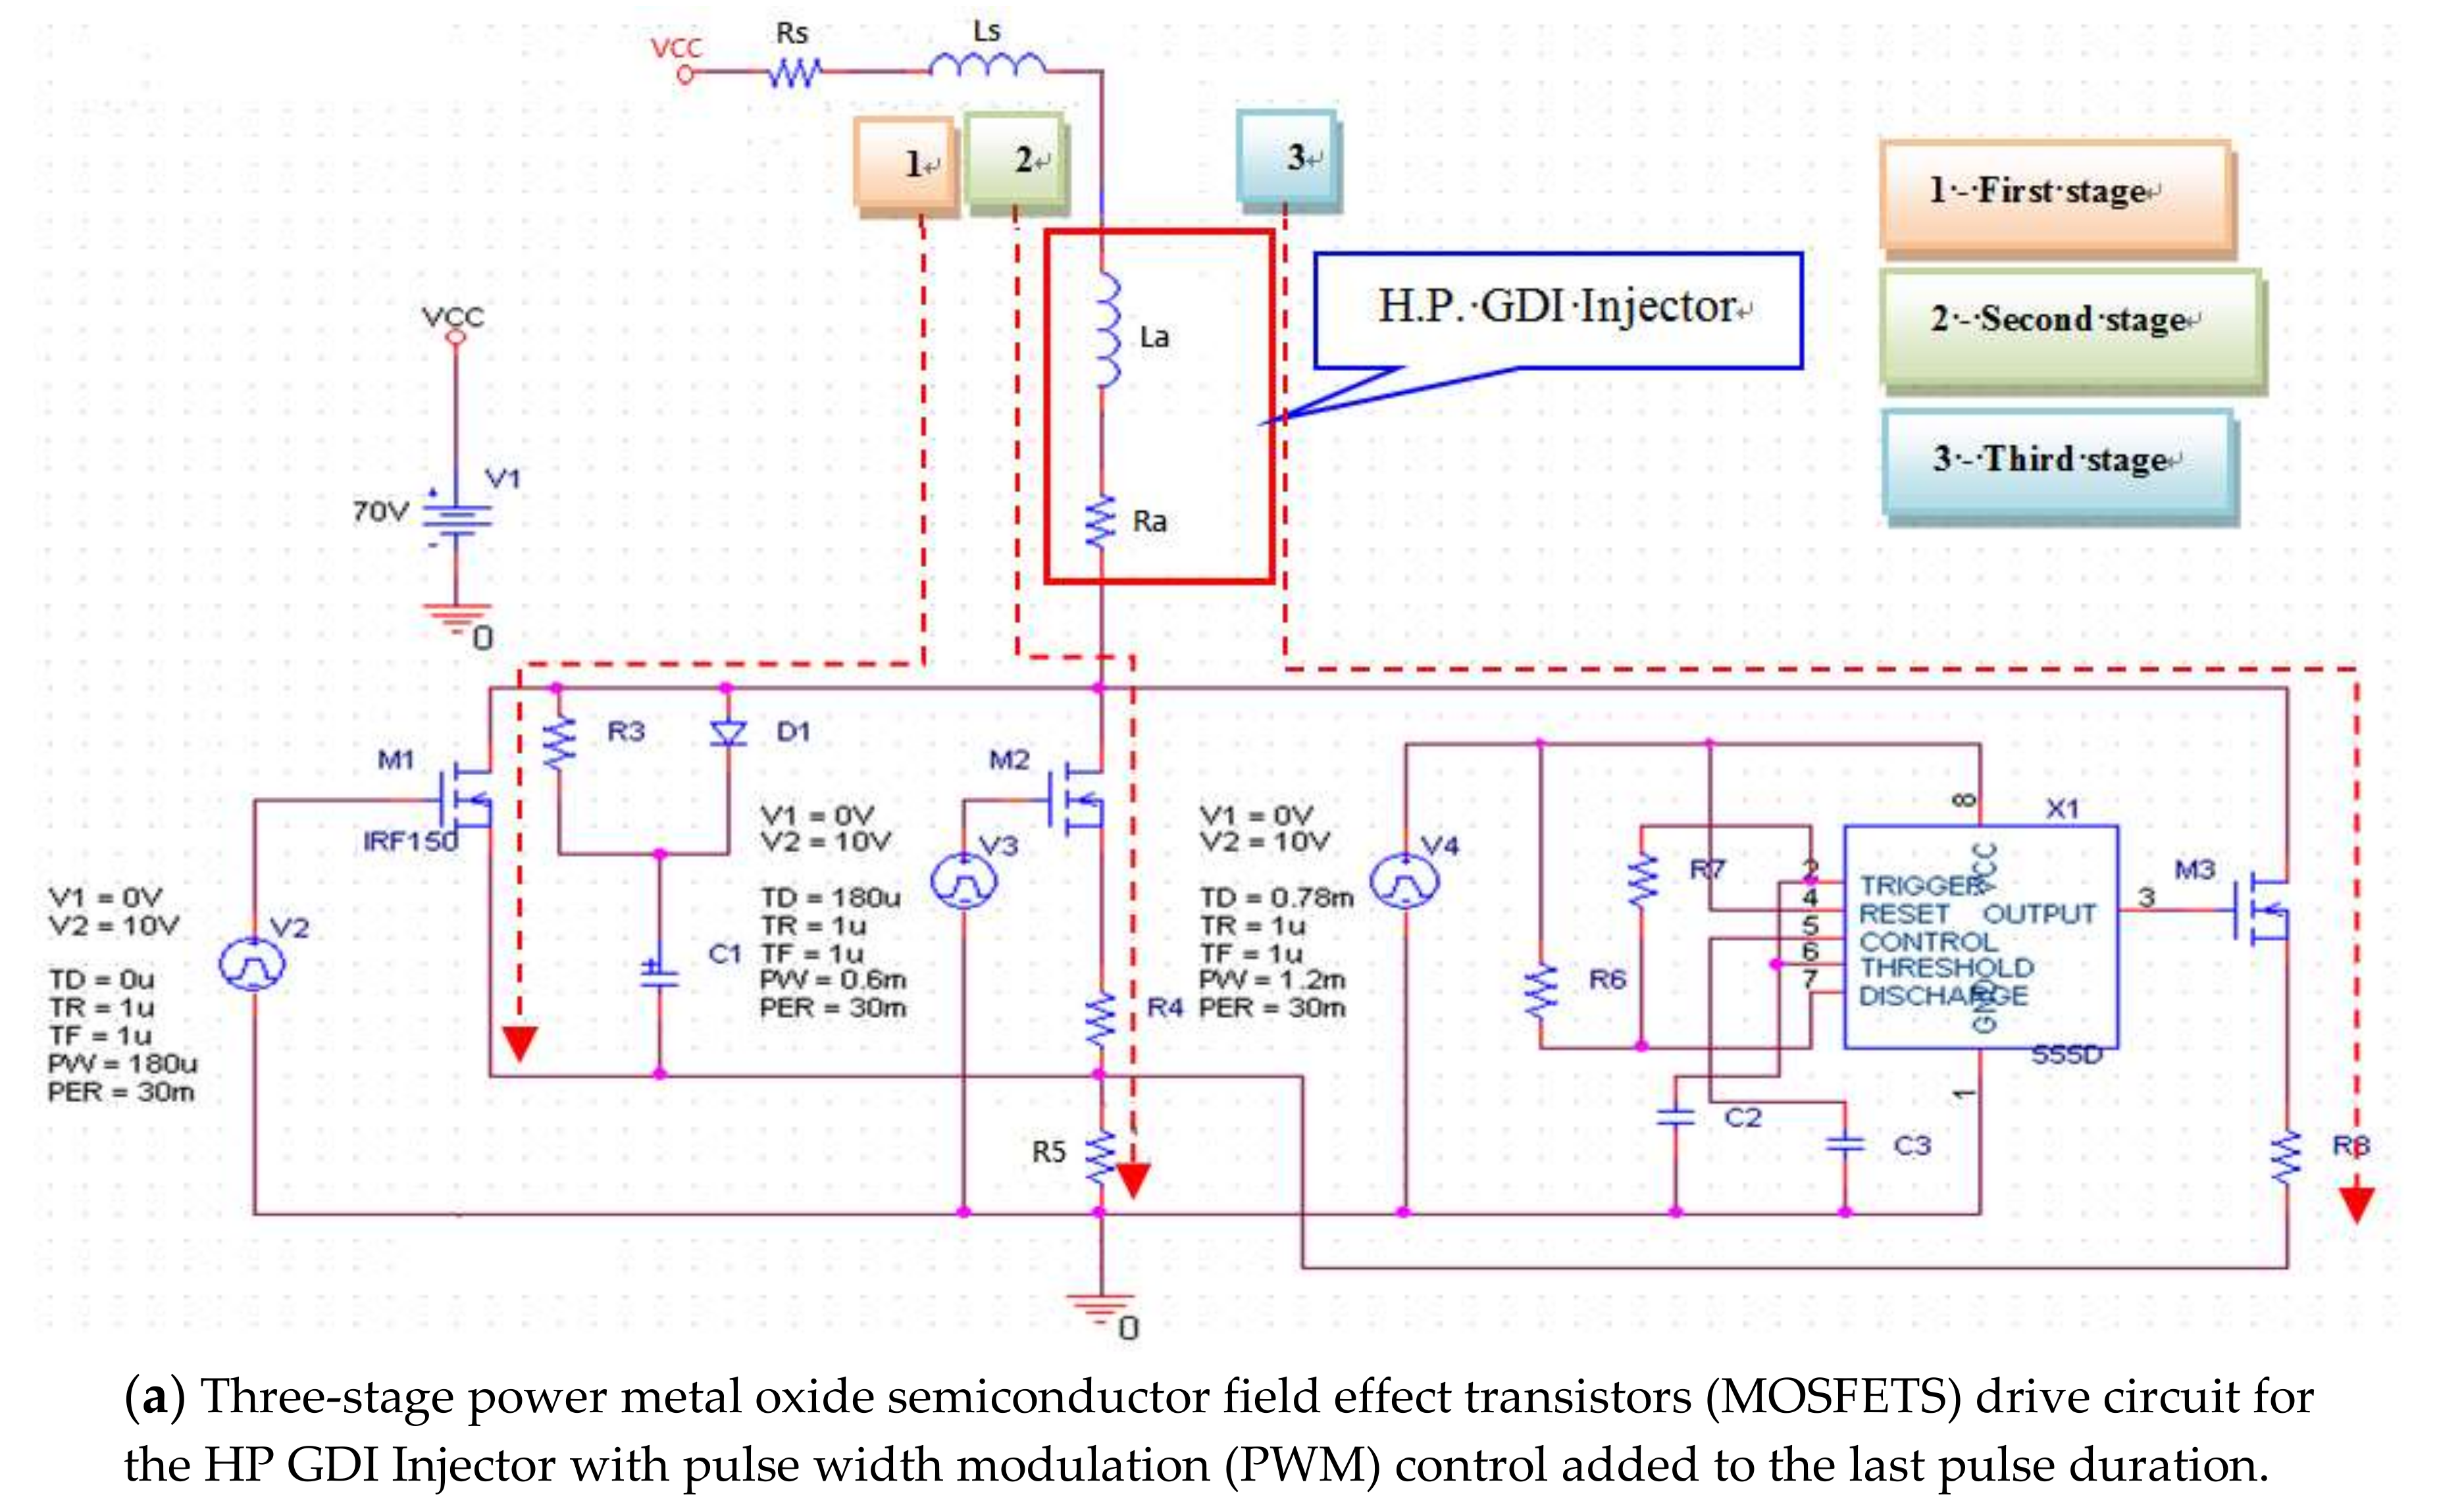
3. Development of Fuel Injector Drive Circuit

This research developed various drive circuits for the HP fuel supply system of a 500c.c. GDI motorcycle engine. The initial design of the drive circuit for the HP GDI fuel supply system was developed by three-stage power transistors. The designed drive circuit was tested with a high-frequency drive pulse to execute the experiments of high-speed fuel injection quantities. The anti-noise photo coupler 4N35 drive ICs, driven by the first and second pulses, were usually damaged due to surge voltages and currents exceeding their operating rating. To improve the above faulty design or simplify the drive circuit, three-stage power MOSFETs drive circuits were developed. The GDI injector drive circuits were developed to be a practical printed circuit board (PCB) to test the effect of engine speeds, pressures of the GDI fuel supply system, driver supply voltages, first stage turn-on driving currents, pulse durations, and PWM control added to the last pulse duration on the dynamic performance of the GDI injector. Therefore, the power MOSFETs components were adopted to design the GDI injector drive circuit under the operations of high-frequency surge voltages and currents. The procedures for the simulation and practical designs are illustrated as below.

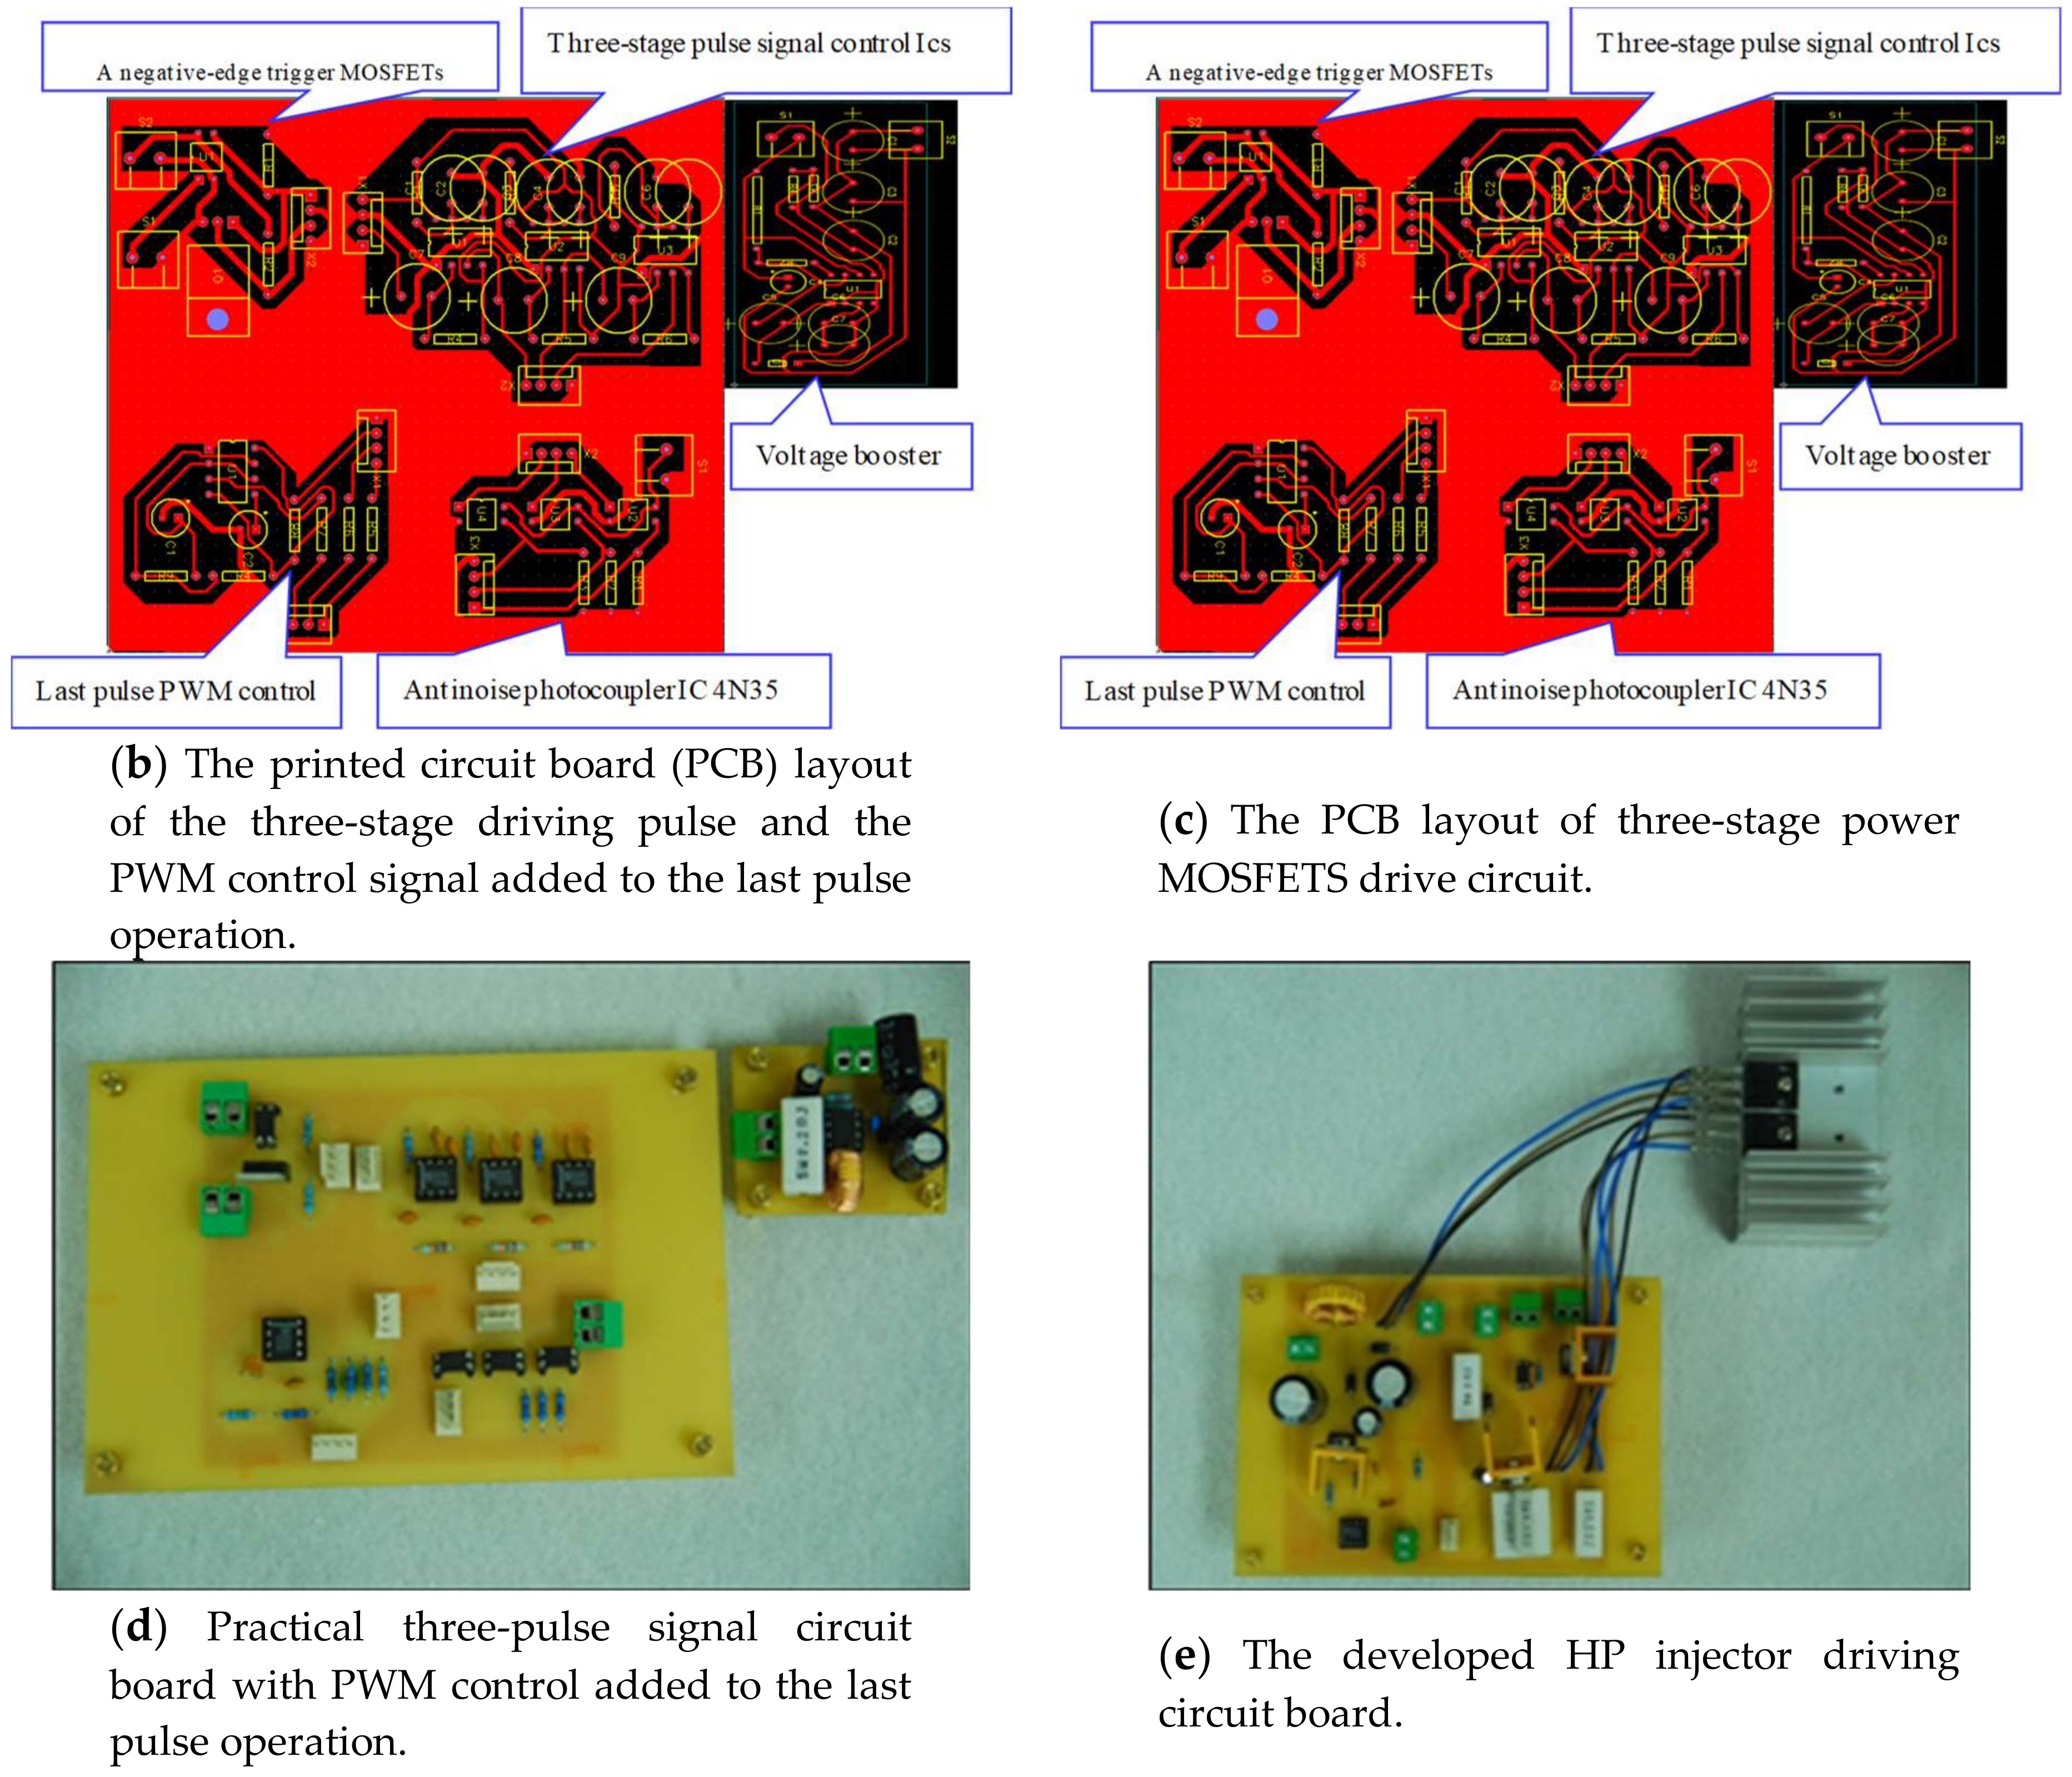
3.1. Injector Drive Circuit

The governing equation is then obtained for the simple resistor-inductor circuit (RL Circuit) using KVL as follows:
V S C = I S C   R S C   +   L S C   d I S C d t  
where VSC is the voltage across fuel injector solenoid coils; RS is the resistance of fuel injector solenoid coils; and LSC is the inductance of fuel injector solenoid coils.
From the above Equation (7), the coil current is expressed by:
I S C ( t ) =   V S C R S C ( 1 e R S C t L S C )   =     V S C R S C ( 1 e t τ )
where τ is the electrical subsystem time constant.
The following expression for inductance of the fuel injector solenoid coil is given by [7]:
L S C   =   N 2 µ 1 π 4 d 2 h dw 2   +   Δ x h
where μ1 is the permeability in the air [H/m]; N is the number of solenoid coil turns; h is the pintle height [mm]; d is the pintle disk diameter [mm]; Δ x is the air gap [mm]; and w is the non-magnetic strip width in millimeters.
In order to carry out the experiments under the operation of high-frequency surge voltages and currents, three-stage power MOSFETs were introduced in the design of the injector drive circuit. The electric drive circuit was designed and simulated for the requirements of the GDI injector characteristics in the Pspice simulation software. The Pspice model of the three-stage power MOSFETs electric drive circuit is illustrated in the Figure 6a. After simulation and experimental test, the improved electric drive circuit and PWM control were added into the last pulse duration, which was required to make a practical PCB. The PCB layouts of three-stage drive pulse and PWM control signal circuit as well as power MOSFETS drive circuit are presented in Figure 6b,c, respectively.
By taking the procedures of exposure, photography development, and metallurgy etching, two circuit boards were developed, after which the parts were soldered onto the PCB board. A programmable drive module based on the working principle of the injector electric drive circuit was designed, which is shown in Figure 6d,e.
Three drive pulse signals were supplied to drive the power MOSFETs switches of the electrical drive circuit via the photo coupler drive IC 4N35. The functions of the photo coupler drive IC 4N35 were anti-noise for signal processing. The DC 5 V trigger signals from ECU output were required to raise up to at least 15 V voltage level using IC 4N35 photo coupler circuit to be able to drive the power MOSFETs switches M1–M3 as depicted in Figure 6a. Total turn-on injection pulse duration of the GDI injector was set at a range between 1200 μs and 2000 μs, in which the first, second, and third pulse duration were 200 μs, 600 μs, and 400–1200 μs, respectively. The PWM frequency (30–200 kHz) has been experimentally applied in the last pulse. It was considered to be the best compromise between reducing current ripple and limited switching action from the components: this ensured a good injector squirting response.

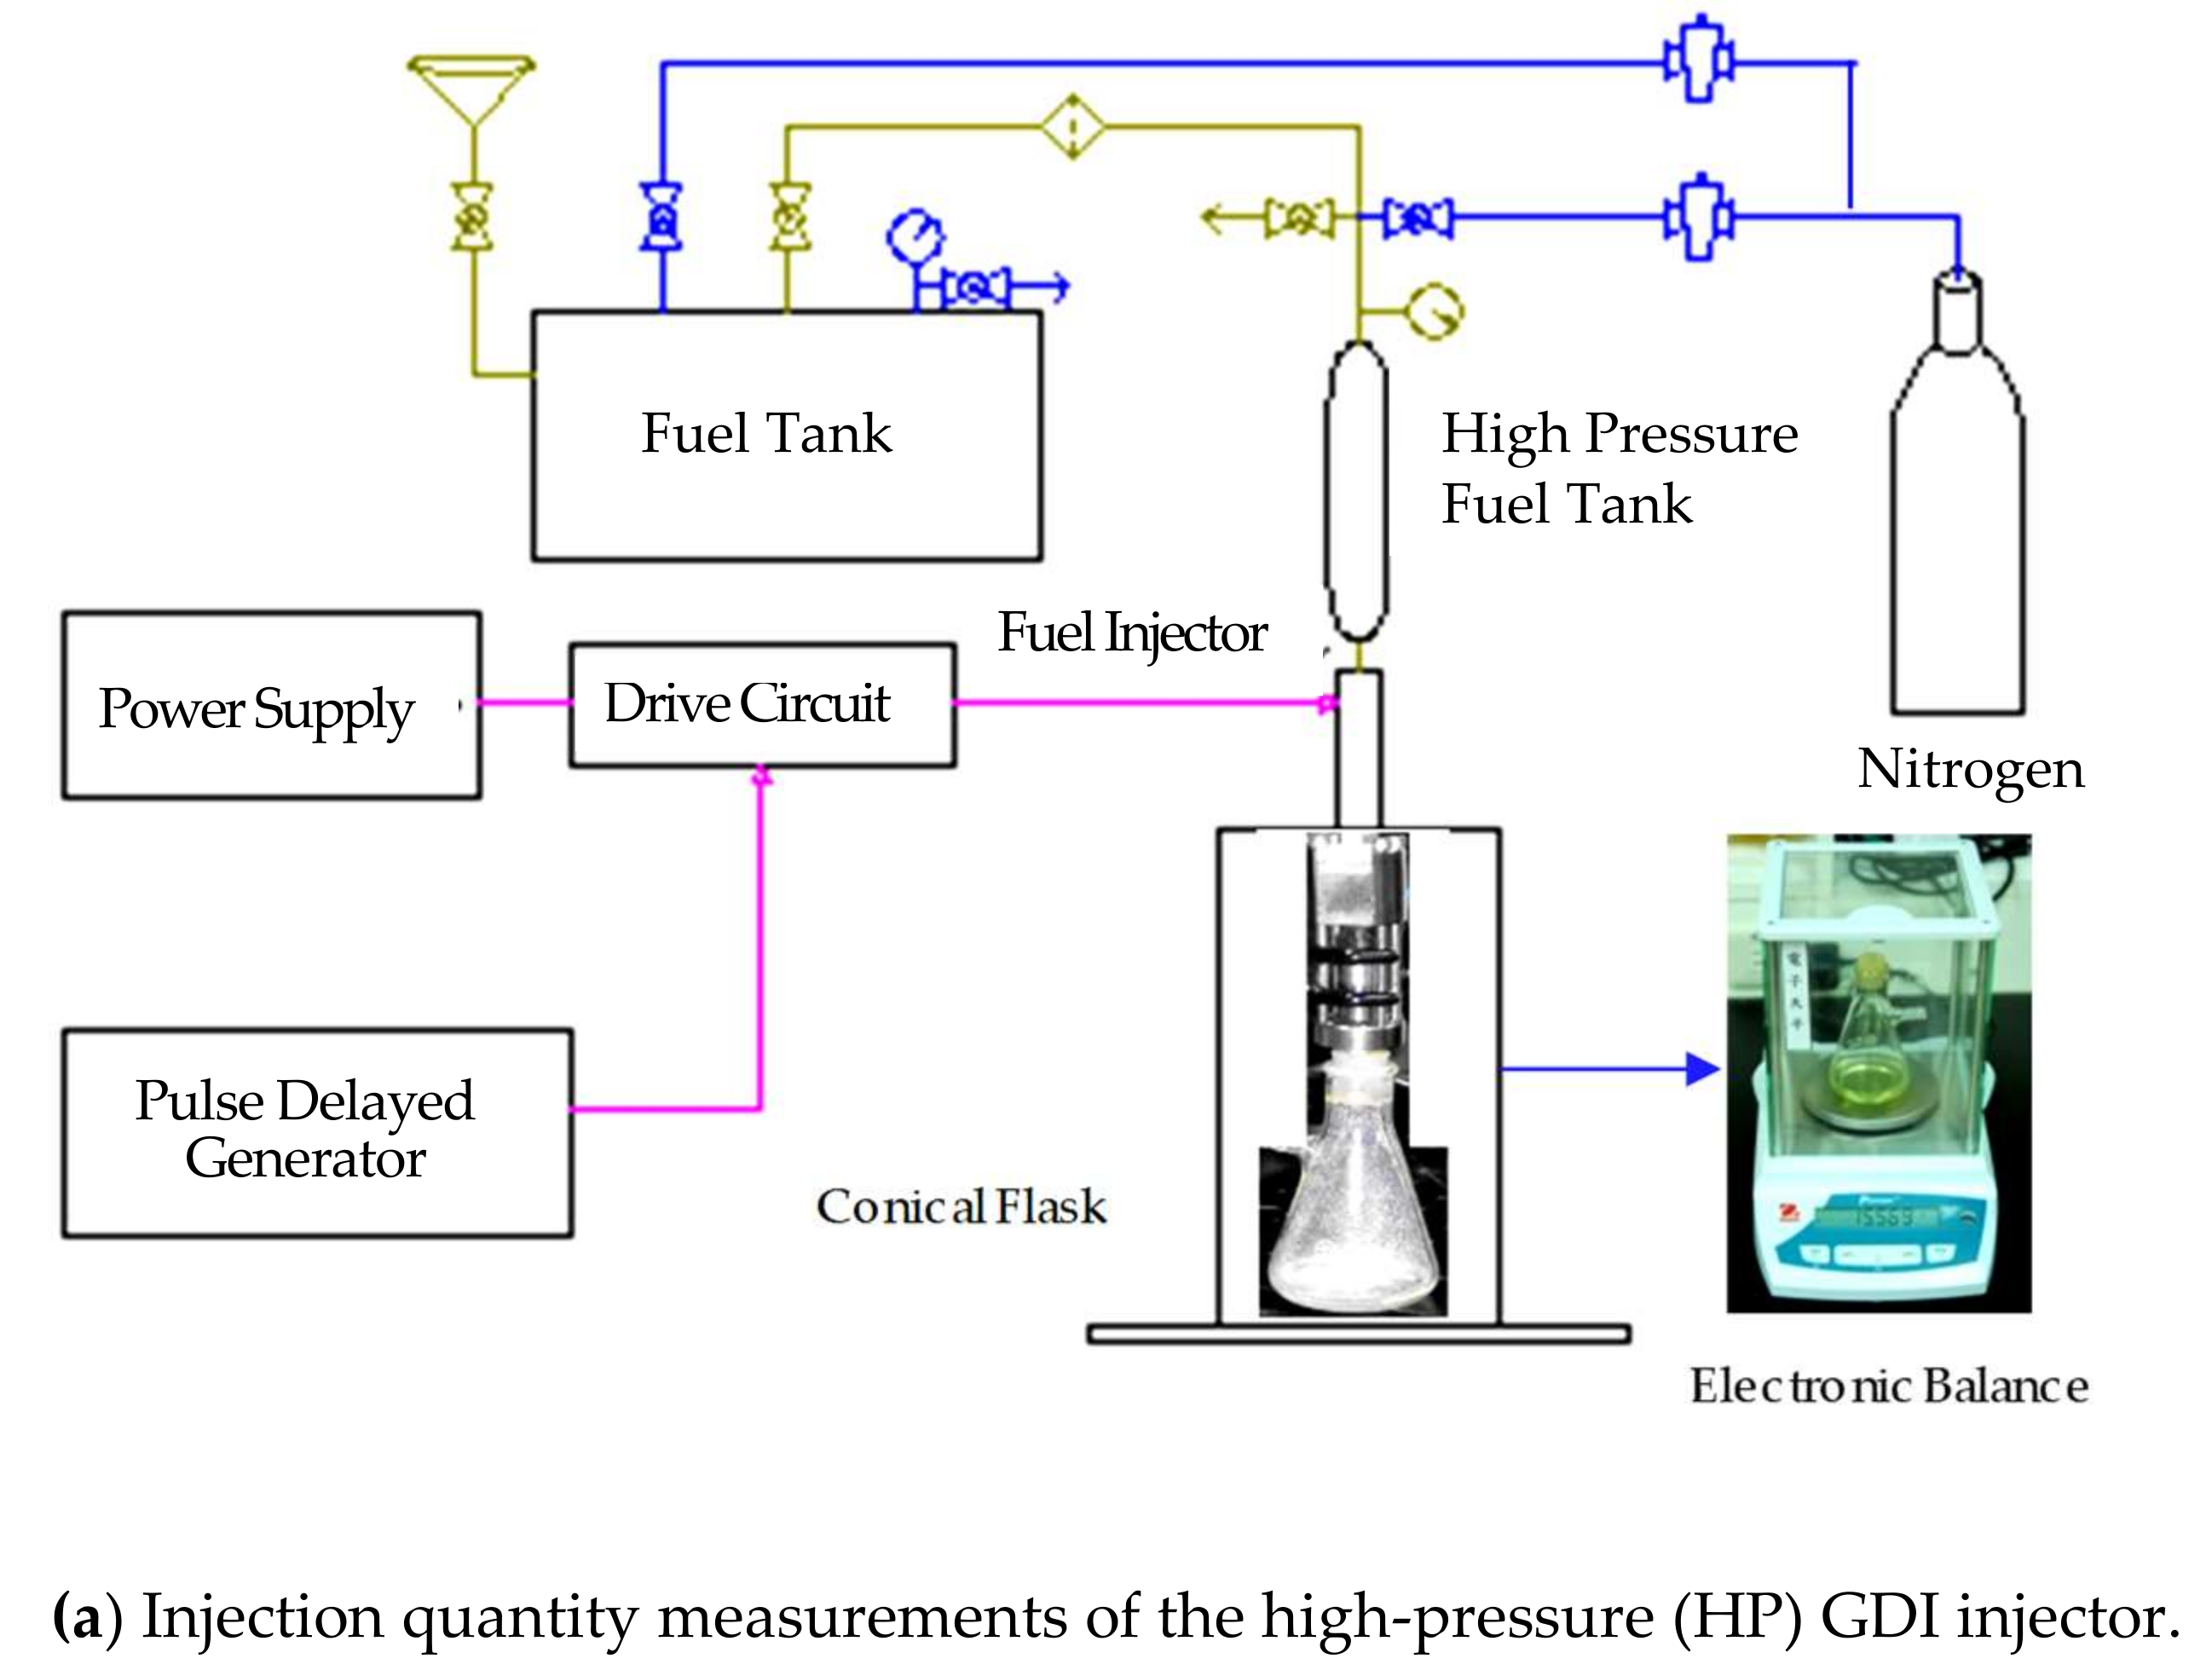
3.2. Experimental Procedures and Measurement Conditions

Fuel injection quantities of the GDI injector can be controlled by adjusting the drive pulse duration. In order to understand the dynamic performance of a GDI injector, the interrelationships between the parameters of the fuel injecting system and its fuel injection quantities must be investigated. These includes total drive pulse duration, first stage turn-on peak current, the injector driver supply voltage, the operating modes added to third pulse operation to cut off the injector, and the pressure of the fuel supply system. The executing driver supply voltages, output drive pulses, and currents for the HP GDI injector were measured and displayed on the digital storage oscilloscope to meet the operating requirements of the GDI injector.
An injecting pulse signal from an ECU was fed into the three-stage power MOSFETs PCB to generate the three-stage (12/5/3 A) driving current waveforms. The GDI injector should be supplied by the three-stage 12/5/3A driving currents for 3 A holding current added to the last pulse duration. The holding voltage at Holding stage I (5 A) was still at a high level, though much lower than the peak voltage. At this stage, the holding voltage I is used to maintain the coil and core in firm contact. At Holding stage II (3 A), when the coil and core attraction remained stable, the voltage was kept at a further reduction as based on holding stage I, to prepare for the ball valve closing. The driving method used in the three-stage current profile had the following two advantages: (1) at the holding stage, the ball valve remains open with a low current supply from the drive circuit, thus, the energy stored in the electromagnetic coil was lower, which was of benefit to decrease the closing delay time; (2) a lower hold current can protect the solenoid valve coil. At the same time, less energy can avoid the hazard of high temperature caused by a large current, and hence, effectively improve the dynamic response of the GDI injector. The GDI injector current profile without and with adding PWM control to last pulse duration including three-stage drive pulse signals are presented in Figure 7a,b. The orange waveform represents the first turn-on pulse signal (Ip1 = 200 μs). The 12 A current produced was sufficient to rapidly draw back the nozzle needle of the GDI injector when the fuel injecting pressure was set at 100 bars. The second drive pulse as shown in the green waveform drove the GDI injector to produce the 5 A holding current and keep continuous injection. For the last drive pulse, the blue waveform, the drive circuit supplied the 3 A current to hold the nozzle needle of the GDI injector. Meanwhile, the injection status of the GDI injector continued, though it is ready to stop squirting. The three-stage currents were supplied to drive the actuators in the GDI injector for carrying out the fuel injection experiments. In the experiments, the driver supply voltage varied between 40 V and 70 V. The pressure of the fuel supply system was set at a range between 60 bars and 100 bars. A power MOSFETs-switch GDI driver was designed with a wide range of injection pulse durations (1200–2000 μs). The fuel injection quantities for four corresponding engine speed settings, 1200 rpm, 2400 rpm, 6000 rpm, and 9000 rpm were measured. After completing 1000 fuel injections, the fuel injection quantities were measured in the electronic balance, and total measured fuel mass (g) was divided by 1000 to obtain the average fuel injection quantities (mg) per injection. The results characterize the dynamic performances of the GDI injector fed by the electrical drive circuit and provide the engine air-fuel ratio (AFR) control with the precise fuel injection quantities to achieve superior dynamic performances of a GDI injector.

4. Results and Discussions

This type of GDI injector requires the three-stage drive circuits fed by a supply voltage to acquire three-stage driving currents. Experimental configuration is described in Table 2 and was verified based on a single-hole Bosch GDI injector. The electrical drive circuit was installed and tested in the GDI fuel injection system as illustrated in Figure 3a. The injection pulse duration was normally defined between 1200–2000 μs to evaluate the operating stability of the GDI injector application. A 5 V Square-pulse signal was inputted to the electrical drive circuit. The supply voltage was adjusted to range from DC 40 V to 70 V and fed the GDI injector actuator to investigate the effects of the injector supply voltage on the fuel injection quantities. Finally, experiments for two different first pulse turn-on currents (12/10 A) were conducted and compared. The experimental configuration for the spray test of the GDI injector and injection performance were observed at first pulse turn-on time (Ip1 = 200 μs).Drive signal duration is 1500 μs.

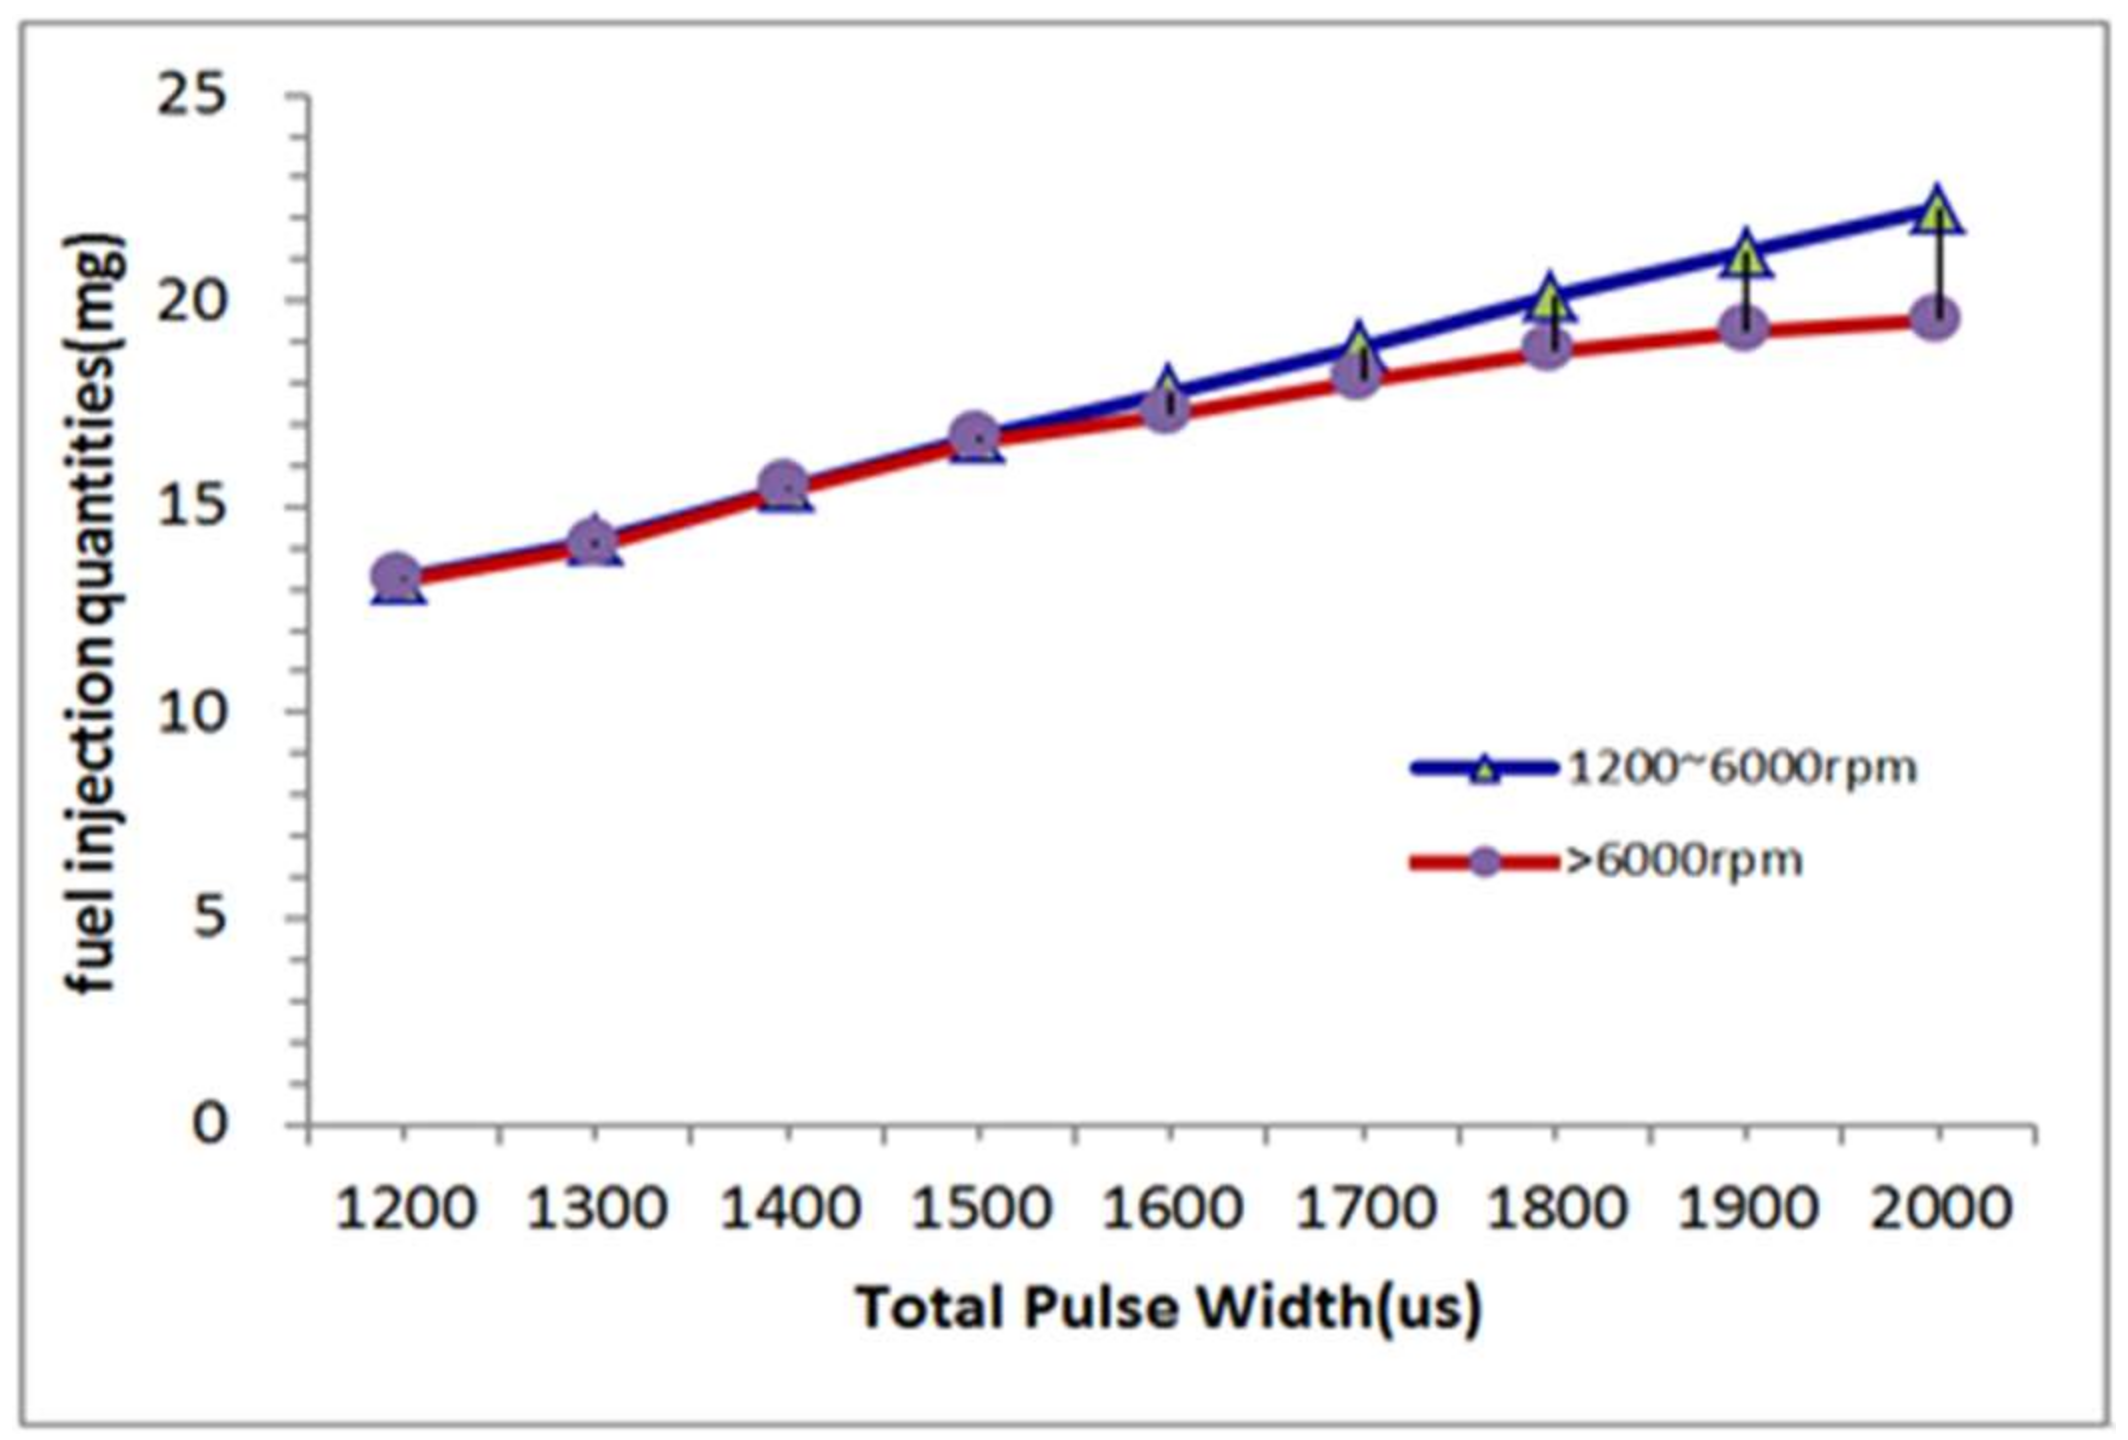
4.1. Effect of Total Pulse Width

The power supply voltage and the pressure of the fuel supply system are set at DC 60V and 100 bars, respectively, to measure the fuel injection quantities by adjusting total pulse width. The injection frequency and drive pulse duration were adjusted at the above sampling speeds to measure the average fuel injection quantities. Effects of various speeds and pulse widths on fuel injection quantities of the HP injector fed by the three-stage (12/5/2.5 A) driving current are represented in the Figure 8. The following equations for characterizing the fuel injection curves are given by:
m fuel   =     1.0984 t p   +   11.567   between   1200   and   6000   rpm   ( R 2   =   0.9993 ) m fuel   =   0.0639 t p 2   +   1.4758   t p   +   11.715   for   exceeding   6000   rpm ( R 2   =   0.9968 )
where mfuel is the fuel injection mass (g) and tp is the pulse duration (μs)
PWM control was withdrawn from the last pulse duration. As the first drive pulse turns on the MOSFET, the actuator coils of the HP injector as charged by the DC 60V supply voltage. The first-pulse turn-on peak currents was, therefore, generated and flowed into the solenoid valve coils of the injector to induce the electromagnetic force to draw back the nozzle needle of an HP injector. Thus, the 100-bar fuel pressure forced the fuel into the experimental jar via the nozzle hole. Next, the second and third pulses triggered the second- and third-stage MOSFETs to produce the 5 A and 2.5 A holding currents, respectively. These two exciting currents charge the solenoid valve coils to hold the nozzle needle of the HP injector, therefore, the fuel of the HP injector would keep spurting. The HP injector was operated at an injection frequency ranging from 10 pulses/s to 75 pulses/s. The injection frequency was equal to the engine speeds from 1200 to 9000 rpm. By adjusting the fuel injection width within a range between 1200 μs and 3000 μs, the fuel injection quantities increased from 13.153 mg/pulse to 22.08 mg/pulse, of which the variation was slightly above sampling engine speeds. However, the operating frequency of the HP injector was closed to 75 pulses/s (corresponding to engine speeds at 9000 rpm); inadequate fuel injection quantities would begin to result in significant fuel variations exceeding 1600μs pulse duration.

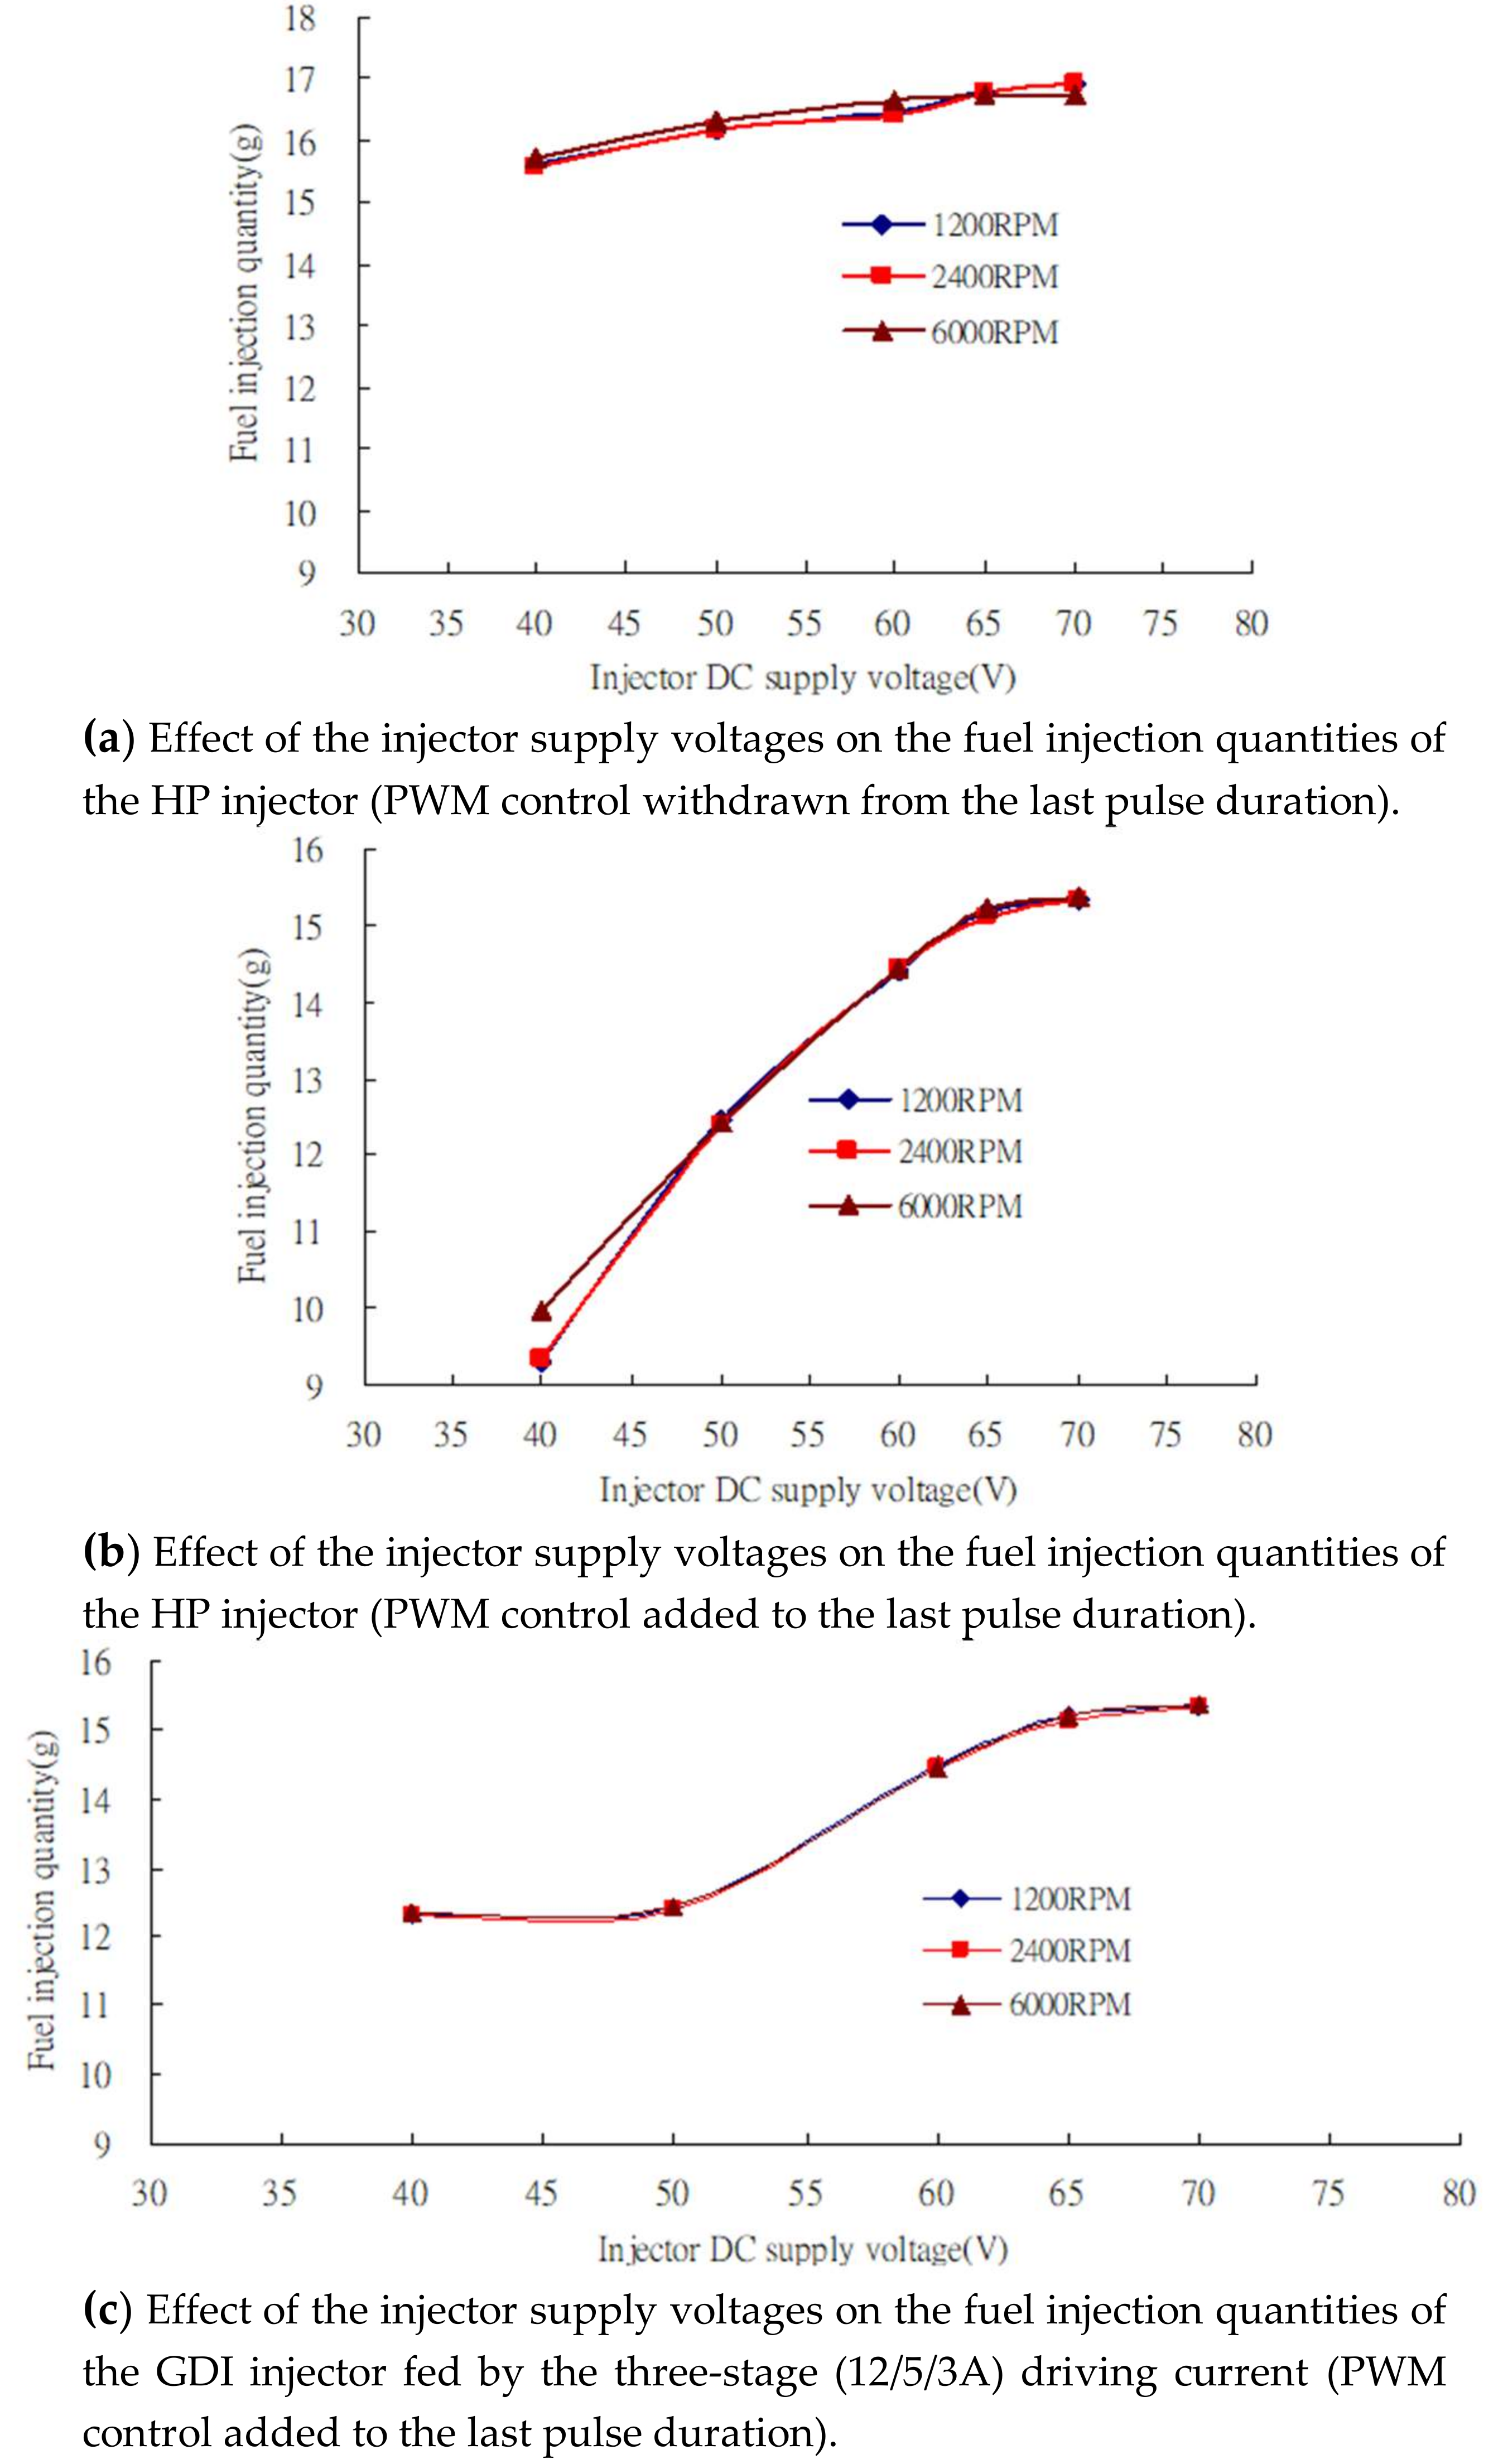
4.2. Effect of Injector’s Supply Voltage and PWM Operation

In the practical electrical circuits of motorcycle GDI engines, the injector’s supply voltage drop significantly influences the fuel injection quantities during high speed injecting operation. The effect of the injector’s supply voltage and PWM control on the fuel injection quantities was required to investigate the fuel injection experiments. An injecting pulse signal from the ECU was fed into the three-stage power MOSFETs PCB to generate the three-stage (12/5/3 A) current waveforms. The three-stage currents were supplied to drive the actuators in the HP injector. In the experiments, the driver supply voltage varied from 40 to 70 V; the pressure of the fuel supply system was set at 100 bars. A power MOSFETs-switch HP driver was designed with a wide range of injection pulse durations (1200–2000 μs). The fuel injection quantities for three engine speed settings (1200 rpm, 2400 rpm, and 6000 rpm) were measured. The DC supply voltage was supplied to drive the actuators in the HP injector for carrying out the fuel injection experiments. The effects of the injector supply voltage on the fuel injection quantities of the HP injector fed by the three-stage 12/5/2.5 A (without PWM mode) and 12/5/3 A driving current (with PWM mode) were investigated. The pressure of the fuel supply system was set at 100 bars. An injecting pulse duration (1500 μs) was sent to the three-stage power MOSFETs’ HP driver to measure the fuel injection quantities for three engine speed settings at 1200 rpm, 2400 rpm, and 6000 rpm. The effect of the injector supply voltages on the fuel injection quantities of the HP injector without PWM control added to the 2.5 A holding currents during the last pulse duration is presented in Figure 9a. In Figure 9a, the fuel injection quantities fed by the DC 40 V injector supply voltage are 15.641 g, 15.568 g, and 15.729 g at 1200 rpm, 2400 rpm, and 6000 rpm, respectively. They are almost the same, irrespective of engine speeds. When the injector supply voltage raised to DC 70 V, fuel injection quantities increased to 16.935 g from 15.641 g. The equations for characterizing the fuel injection curves are given by:
m fuel   =     0.0003 V s 2   +   0.0736   V s   +   13.175   ( R 2   =   0.9992 )   between   1200   and   6000   rpm m fuel   =     0.0013 V s 2   +   0.1773   V s   +   10.722   ( R 2   =   0.9994 )   for   exceeding   6000   rpm
where mfuel is the fuel injection mass (mg/pulse) and Vs is the power supply voltage (V).
PWM control was added to the 2.5 A holding currents during the last pulse operation as shown in Figure 9b. These results show that the fuel injection quantities were varied with the injector supply voltage. However, the fuel injection quantities fed by the DC 40 V injector supply voltage showed 9.314 g, 9.328 g, and 9.952 g at 1200 rpm, 2400 rpm, and 6000 rpm, respectively (Figure 9b). When the injector supply voltage was raised to DC 70 V, the fuel injection quantities increased to 15.327 g from 9.314 g at an engine speed of 1200 rpm. As the fuel injection quantities decreased to 9.314 g, as a result of the addition of PWM control to the 2.5 A holding currents during the last pulse duration, variations of the fuel injection quantities among engine speeds became less. Simultaneously, they became more stable due to the PWM control operation added to the 2.5 A holding currents during the last pulse durations. Thus, the following characteristic equations for the fuel injection curves can be obtained:
m fuel   =     3 E - 05   V s 3     0.0003 V s 2   +   0.5339   V s     9.4735   from   1200   rpm   to   6000   rpm   ( R 2   =   0.9991 ) m fuel   =     0.0001 V s 3   +   0.0179   V s 2     0.5583   V s   +   12.136   for   exceeding   6000   rpm   ( R 2   =   0.9991 )
where mfuel is theuel injection mass (mg/pulse) and Vs is the power supply voltage (V).
The holding currents controlled by PWM operation increased to 3 A during the last pulse durations. The fuel injection quantities were kept constant at 12.4 g between DC 40 V and 50 V in Figure 9c. As is shown in the results, the addition of the last pulse PWM control to the HP injector drive circuits improved the injector’s performance and provided a more stable and accurate fuel injection quantities of the HP injector in the fuel supply and injection system at an operating voltage range between DC 60 and 70 V. Therefore, it is necessary to keep the power supply voltage operating in excess of DC 60 V, as well as adding PWM control to the 3 A holding current during the last pulse durations.

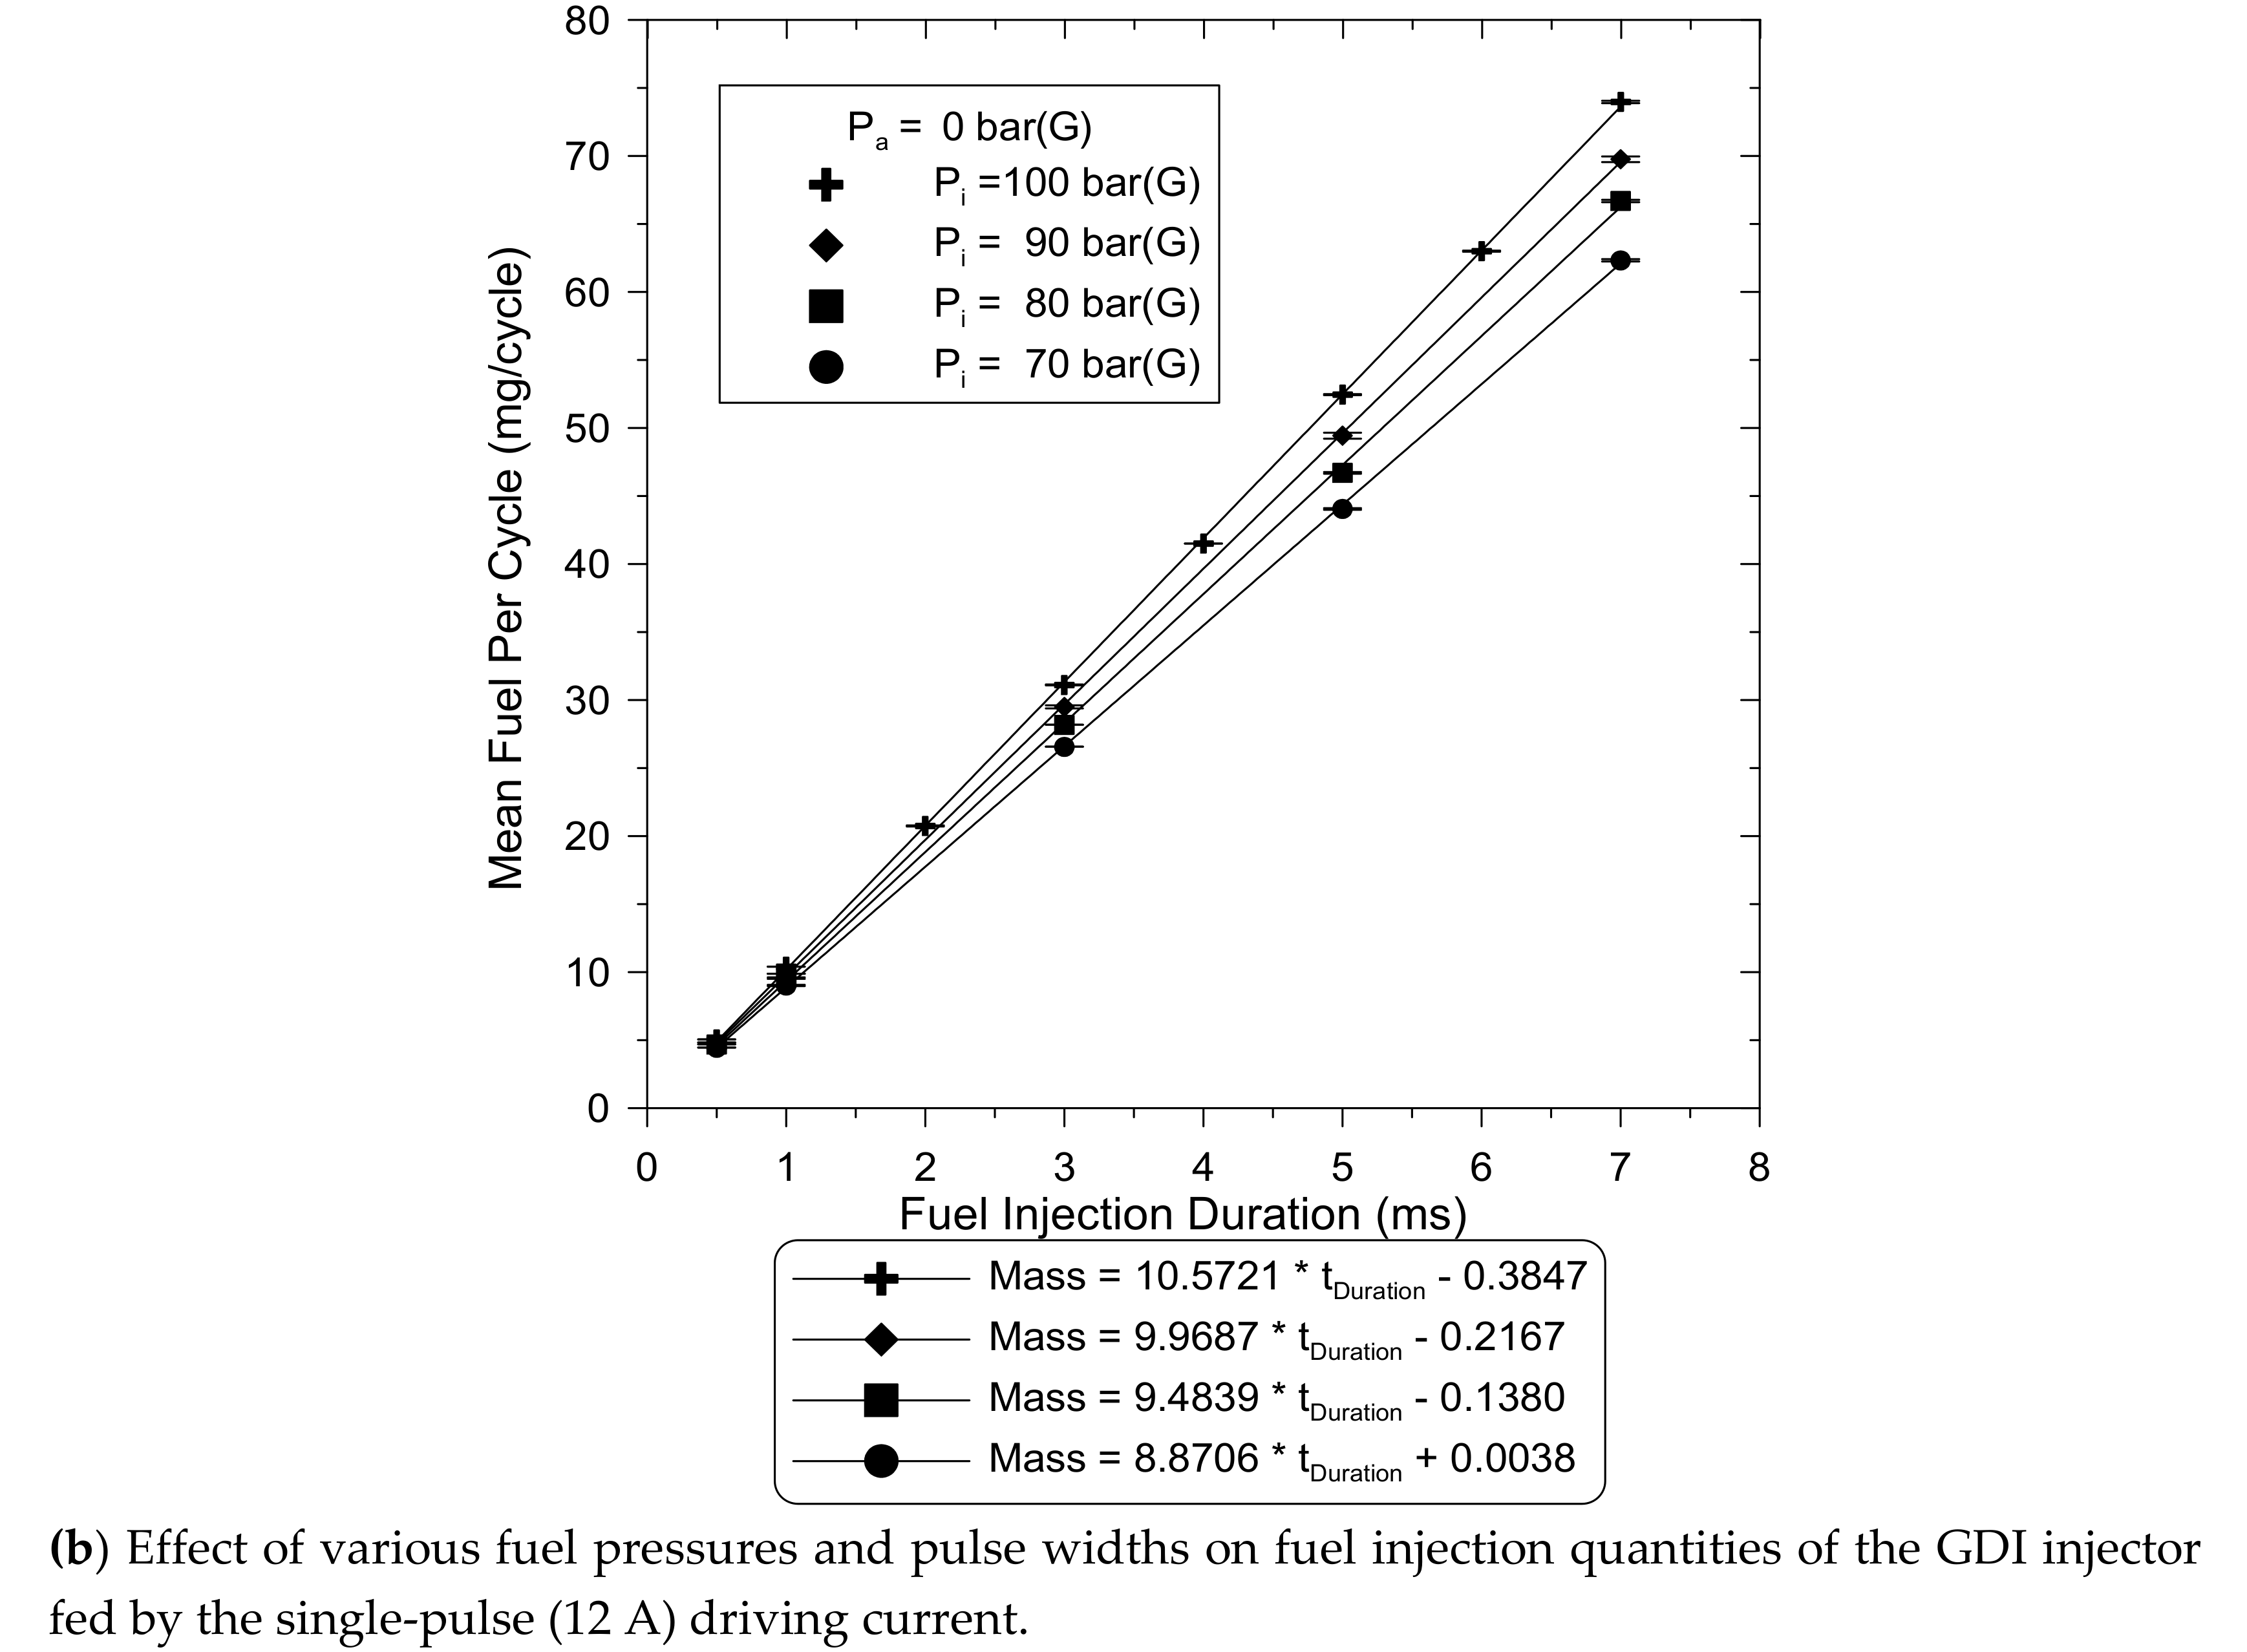
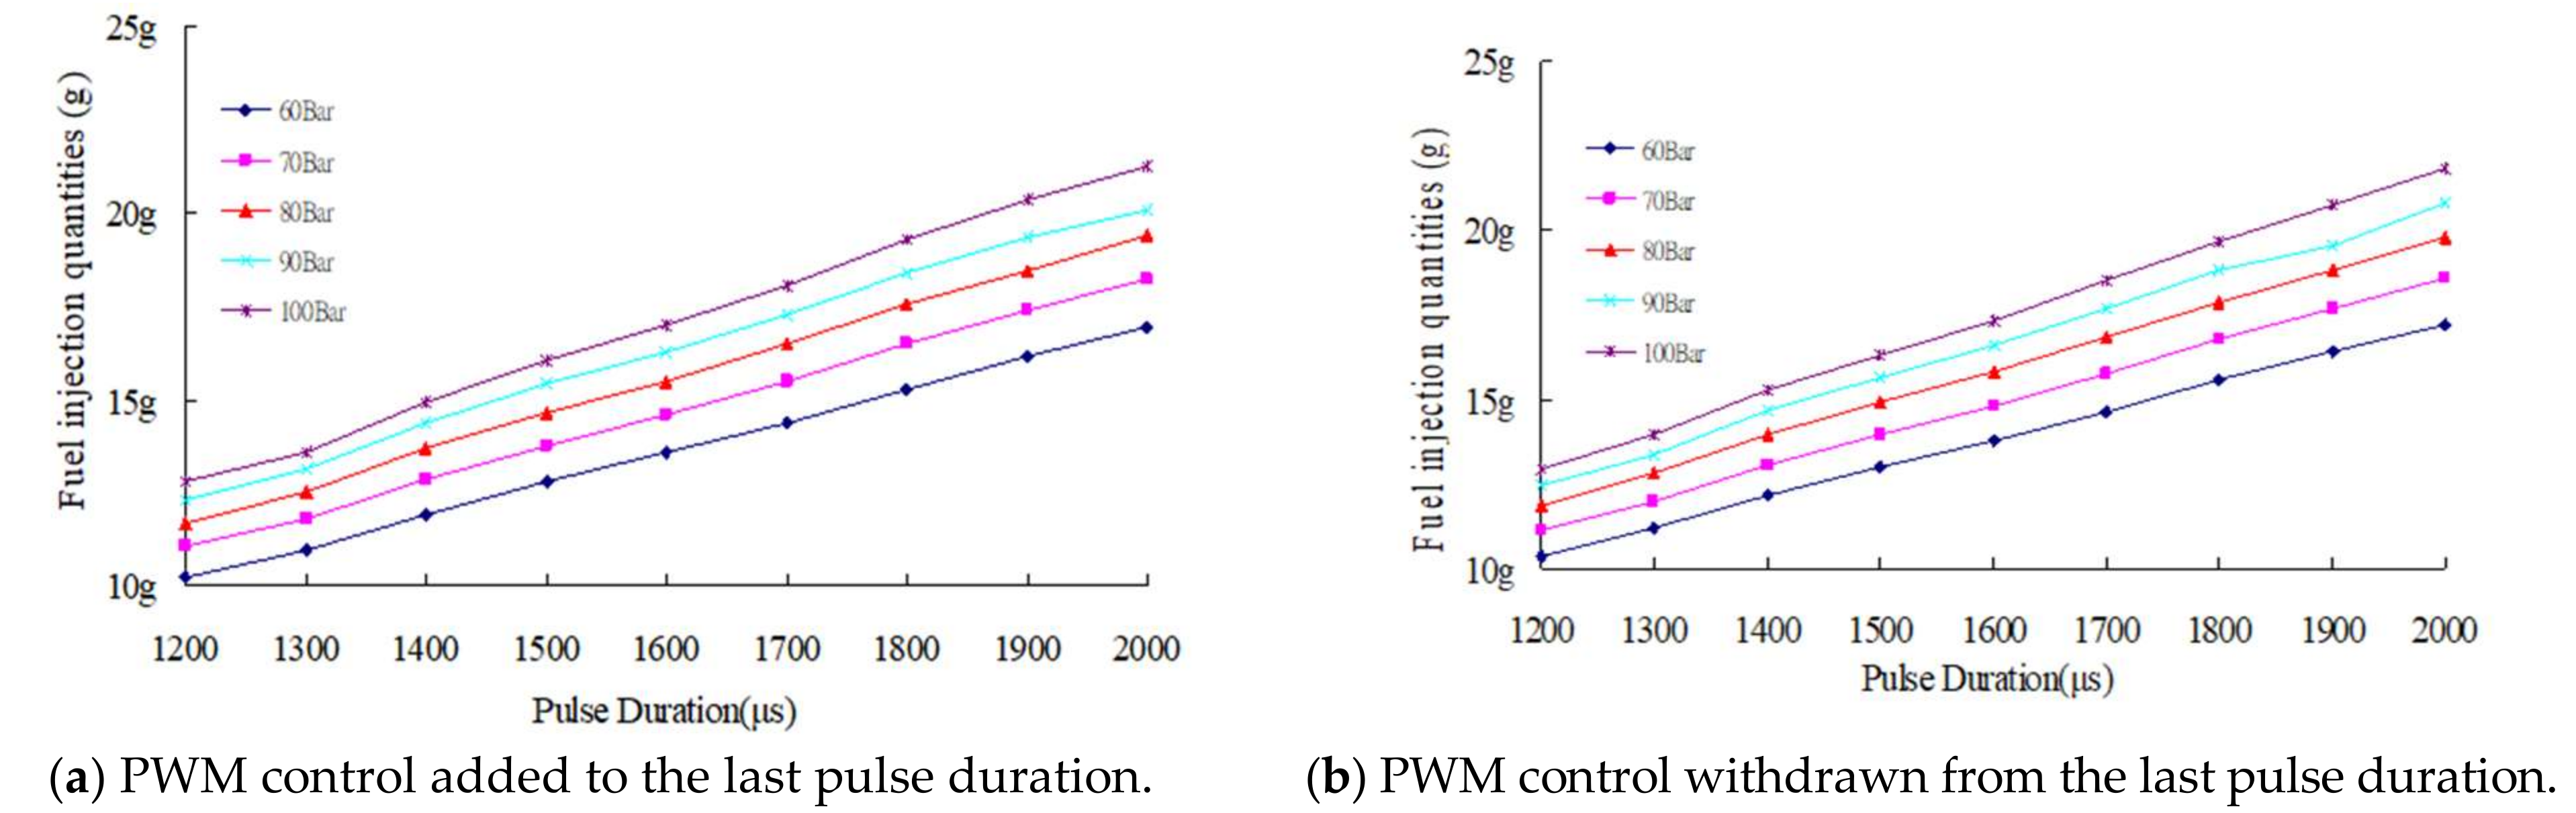
4.3. Effect of Fuel Pressure and PWM Operation

A high-pressure electronic fuel pump was used to supply the fuel and the fuel pressure to the HP injectors. The fuel pump needed to be large enough to supply more fuel than the maximum amount that the engine required, to ensure that the fuel pressure remains adequate at full throttle and at maximum RPM. When the engine operates at high speed or heavy load, the fuel pressure supplied by the fuel pump of motorcycle GDI engines usually dipped, while the pressure significantly influences the opening time and the fuel injection quantities of the HP injector. It was essential to investigate the fuel injection quantities of the HP injector at the various fuel supply pressures. The fuel injection quantities between two current operating modes and various fuel pressures at an engine speed of 6000 rpm is compared in Figure 10a,b. During the testing of fuel injection quantities of the HP injector, the electrical drive circuit was designed to supply a three-stage (12/5/3 A) current waveform to the injector coils in order to generate the electromagnetic force to draw back and hold the nozzle needle of the GDI injector. At the various fuel pressures ranging from 60 to 100 bars, the fuel injection quantities with and without PWM control added to the last holding pulse are obtained in Figure 10a,b. From the results in Figure 10, the PWM control provided the injector with a faster closure and a higher response performance. The equations for characterizing the fuel injection curves without PWM control added to the injector drive circuit can be written as:
mfuel = 1.114 tp + 11.826 for 100 bars
mfuel = 1.038 tp + 11.429 for 90 bars
mfuel = 0.994 tp + 10.879 for 80 bars
mfuel = 0.932 tp + 10.195 for 70 bars
mfuel = 0.852 tp + 9.5241 for 60 bars (R2 = 0.9988)
The equations for characterizing the fuel injection curves for PWM control adding to the injector drive circuit, are obtained as follows:
mfuel = 1.0827 tp + 11.621 for 100 bars
mfuel = 0.9965 tp + 11.297 for 90 bars
mfuel = 0.9726 tp + 10.681 for 80 bars
mfuel = 0.9067 tp + 10.089 for 70 bars
mfuel = 0.8438 tp + 9.3587 for 60 bars (R2 = 0.9985)
where mfuel is the fuel injection mass (g) and tp is the pulse duration (μ).

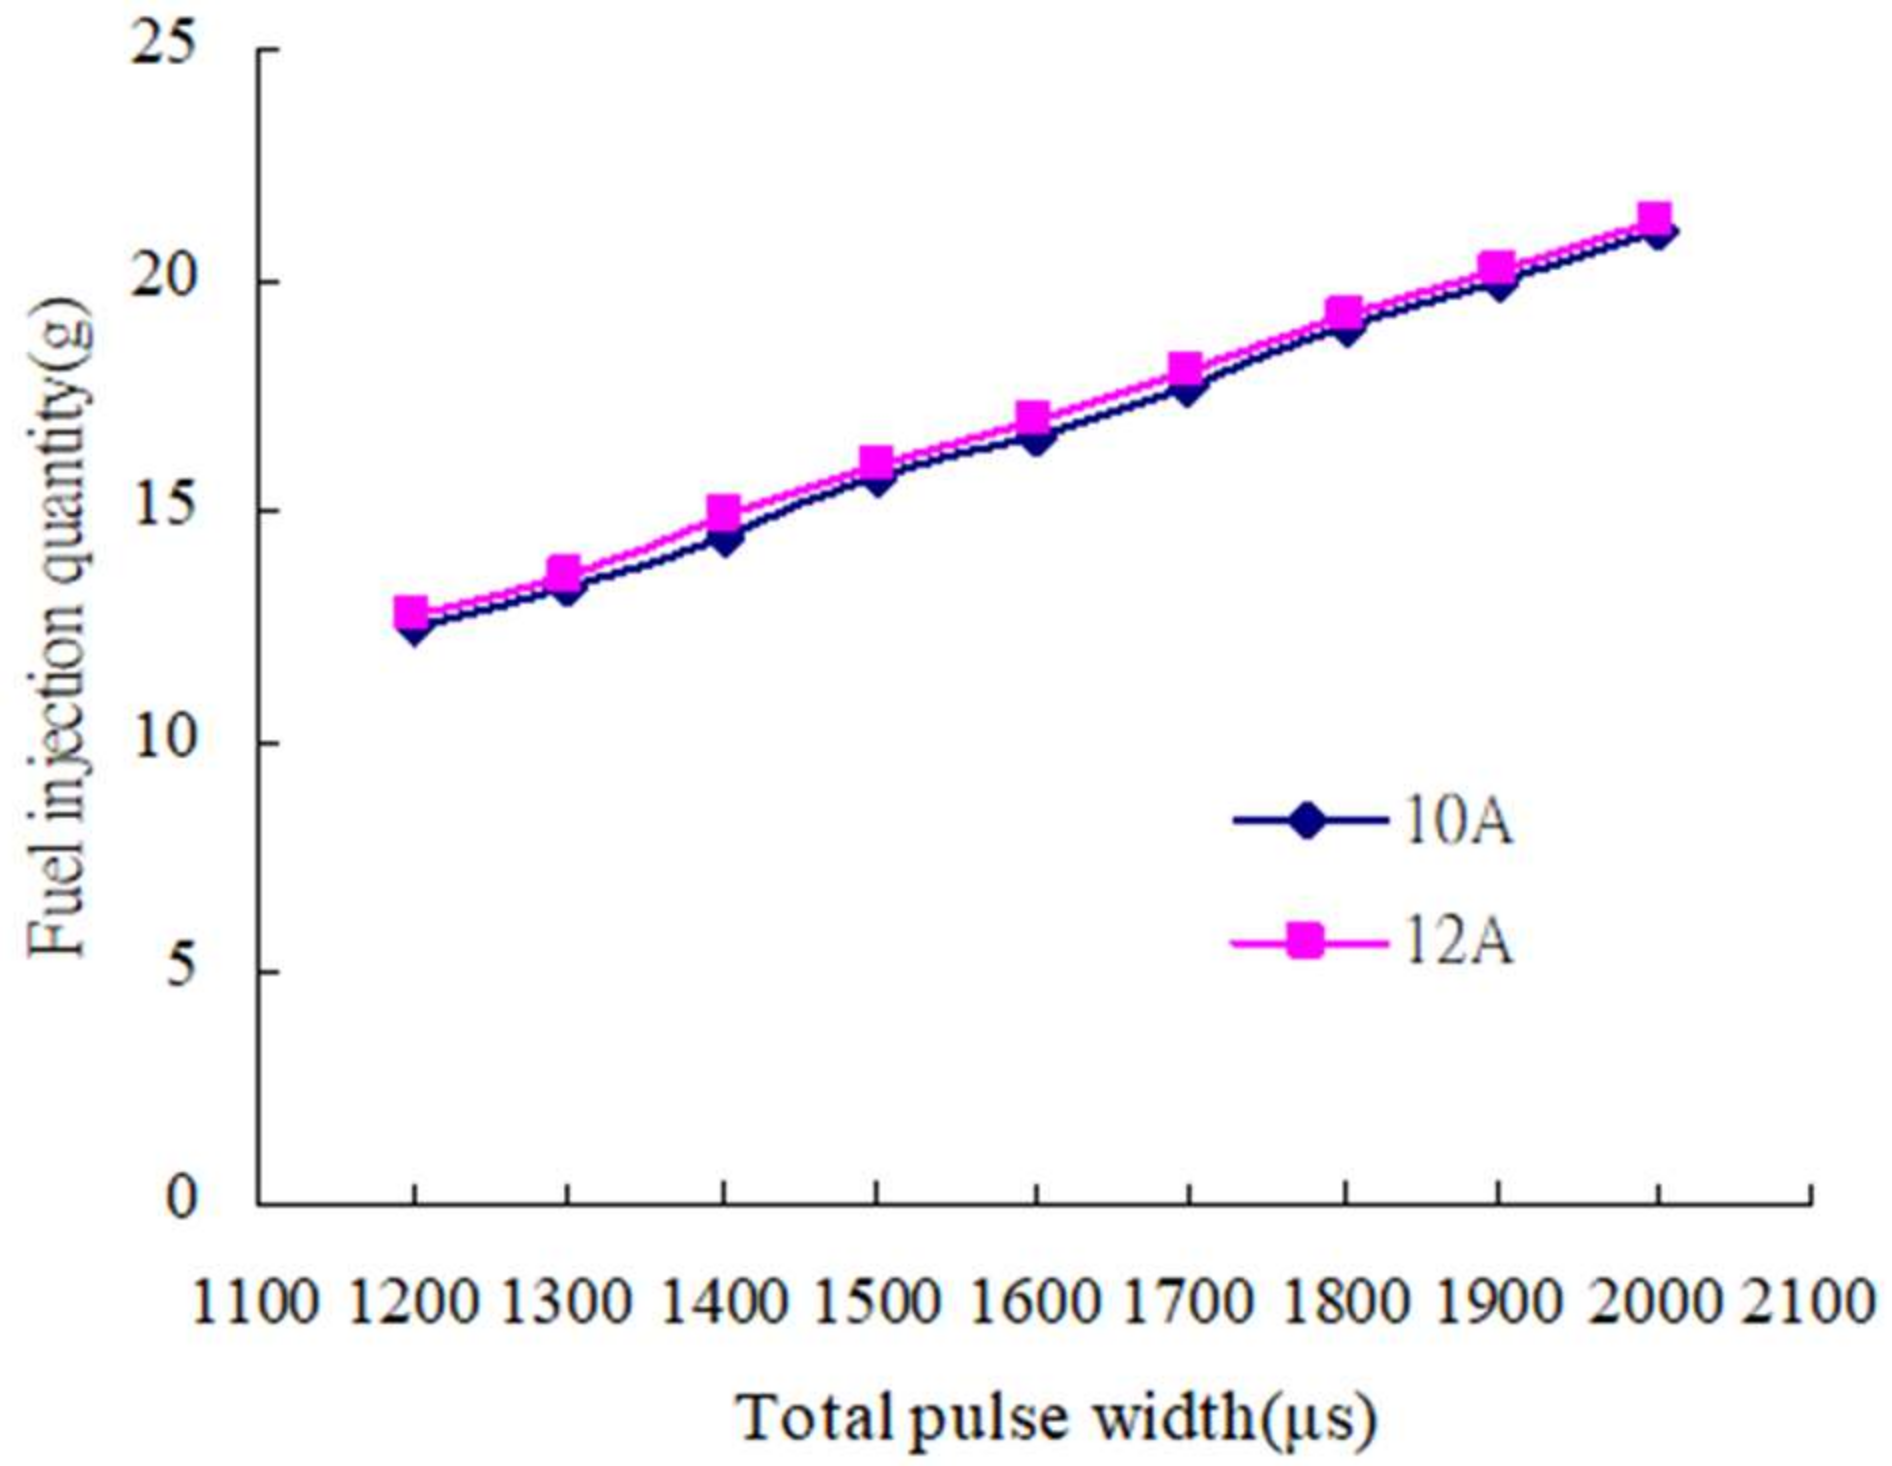
4.4. Effect of First-Stage Turn-on Pulse Width

In order to understand the effects of the first-stage turn-on pulse width on the fuel injection quantities, the total drive pulse duration was adjusted between intervals of 1200–2000 μs, the injector voltage was supplied by DC 60 V, and the pressure of the fuel supply system was set at 100 bars. The first-stage turn-on drive pulses were set at 180 μs and 200 μs to generate the 10 A and 12 A driving currents, respectively. The peak charging current amplitude during the first-stage turn-on pulse duration was interrelated to the fuel injection quantities. As for the case of 200 μs first drive pulse width in Figure 8, the drive pulse width was adequate to boost the first-stage HP injector peak current to 12 A. The HP injector peak current was able to fully draw back the needle of the HP injector; thus, it yielded stable fuel injection quantities. The effects of the first-stage turn-on 10 A and 12 A driving currents on the fuel injection quantities of the HP injector were investigated and are discussed in Table 3. It can be seen in the table that the variations in the fuel injection quantities changed from negative to positive between the 10 A and 12 A first-stage turn-on driving currents at engine speeds of 9000 rpm. At this engine speed, the 10 A first-stage turn-on driving current caused a reduction in the injector supply voltage drop, and hence, resulted in more fuel quantity squirted. At the pulse intervals ranging from 1200–2000 μs, the fuel injection quantities increased to 20.998 g from 12.452 g and to 21.325 g from 12.733 g with 10 A and 12 A driving currents, respectively. The 12 A fuel injection quantities were slightly more than those of the 10 A first-stage turn-on driving current, as shown in Figure 11. The fuel injection quantities can be derived by the following equation for characterizing the fuel injection curves:
mfuel_12 A = 1.0868 tp – 11.56 for all engine speeds (R2 = 0.9991)
mfuel_10 A = 1.0868 tp – 11.24 for all engine speeds (R2 = 0.9989)
where mfuel is the fuel injection mass (g); tp is the pulse duration (μs).
Therefore, the more favorable first-stage turn-on driving currents are ranged between 12 and 10 A for the HP injector characteristics.

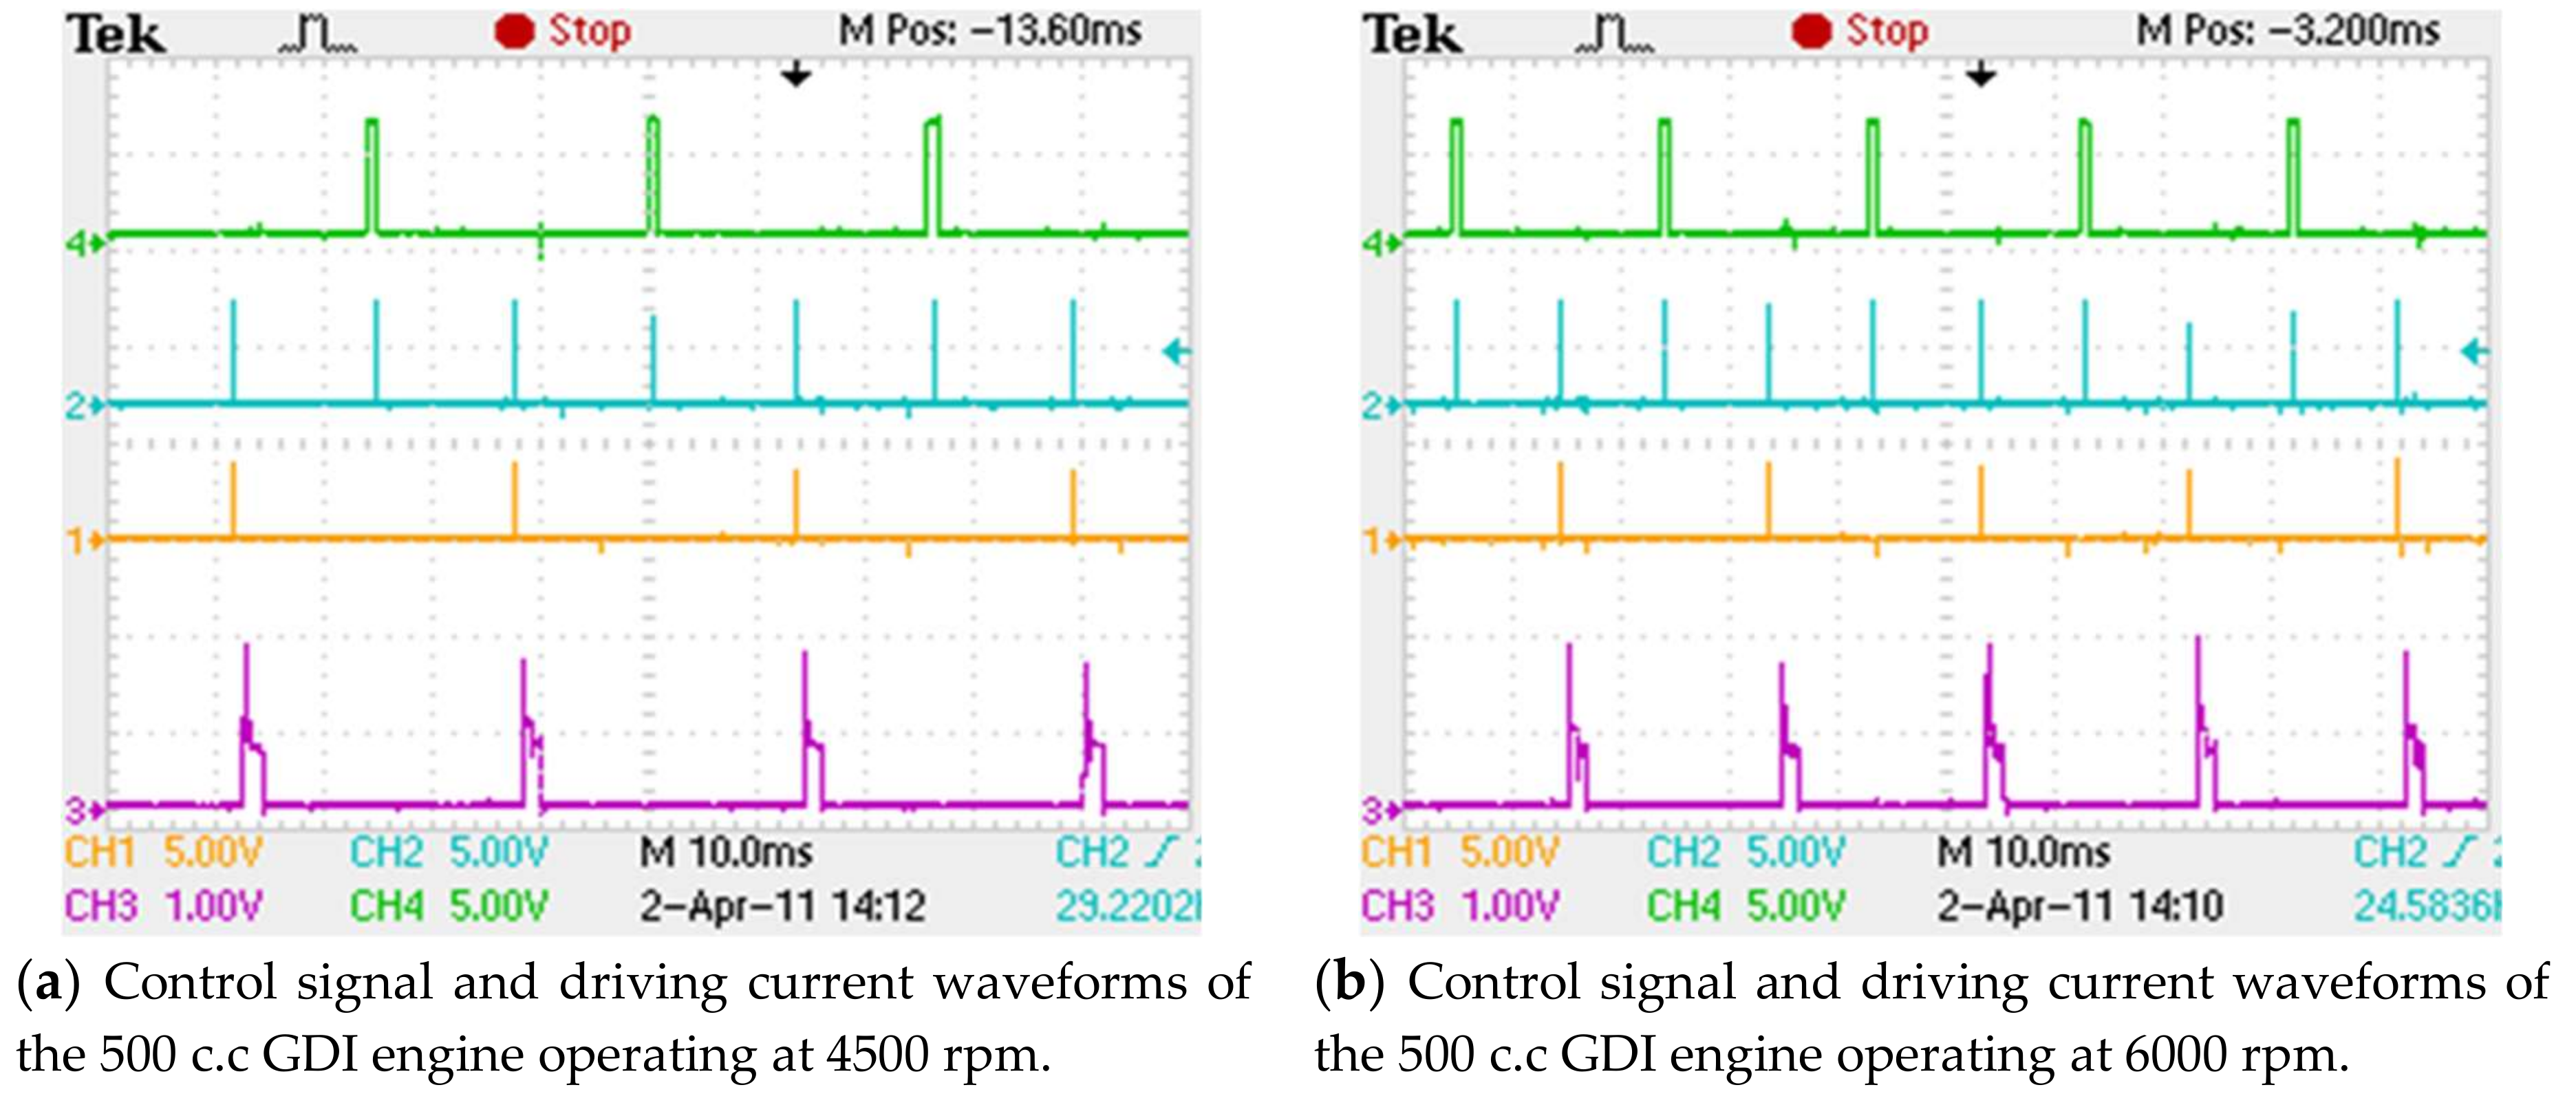
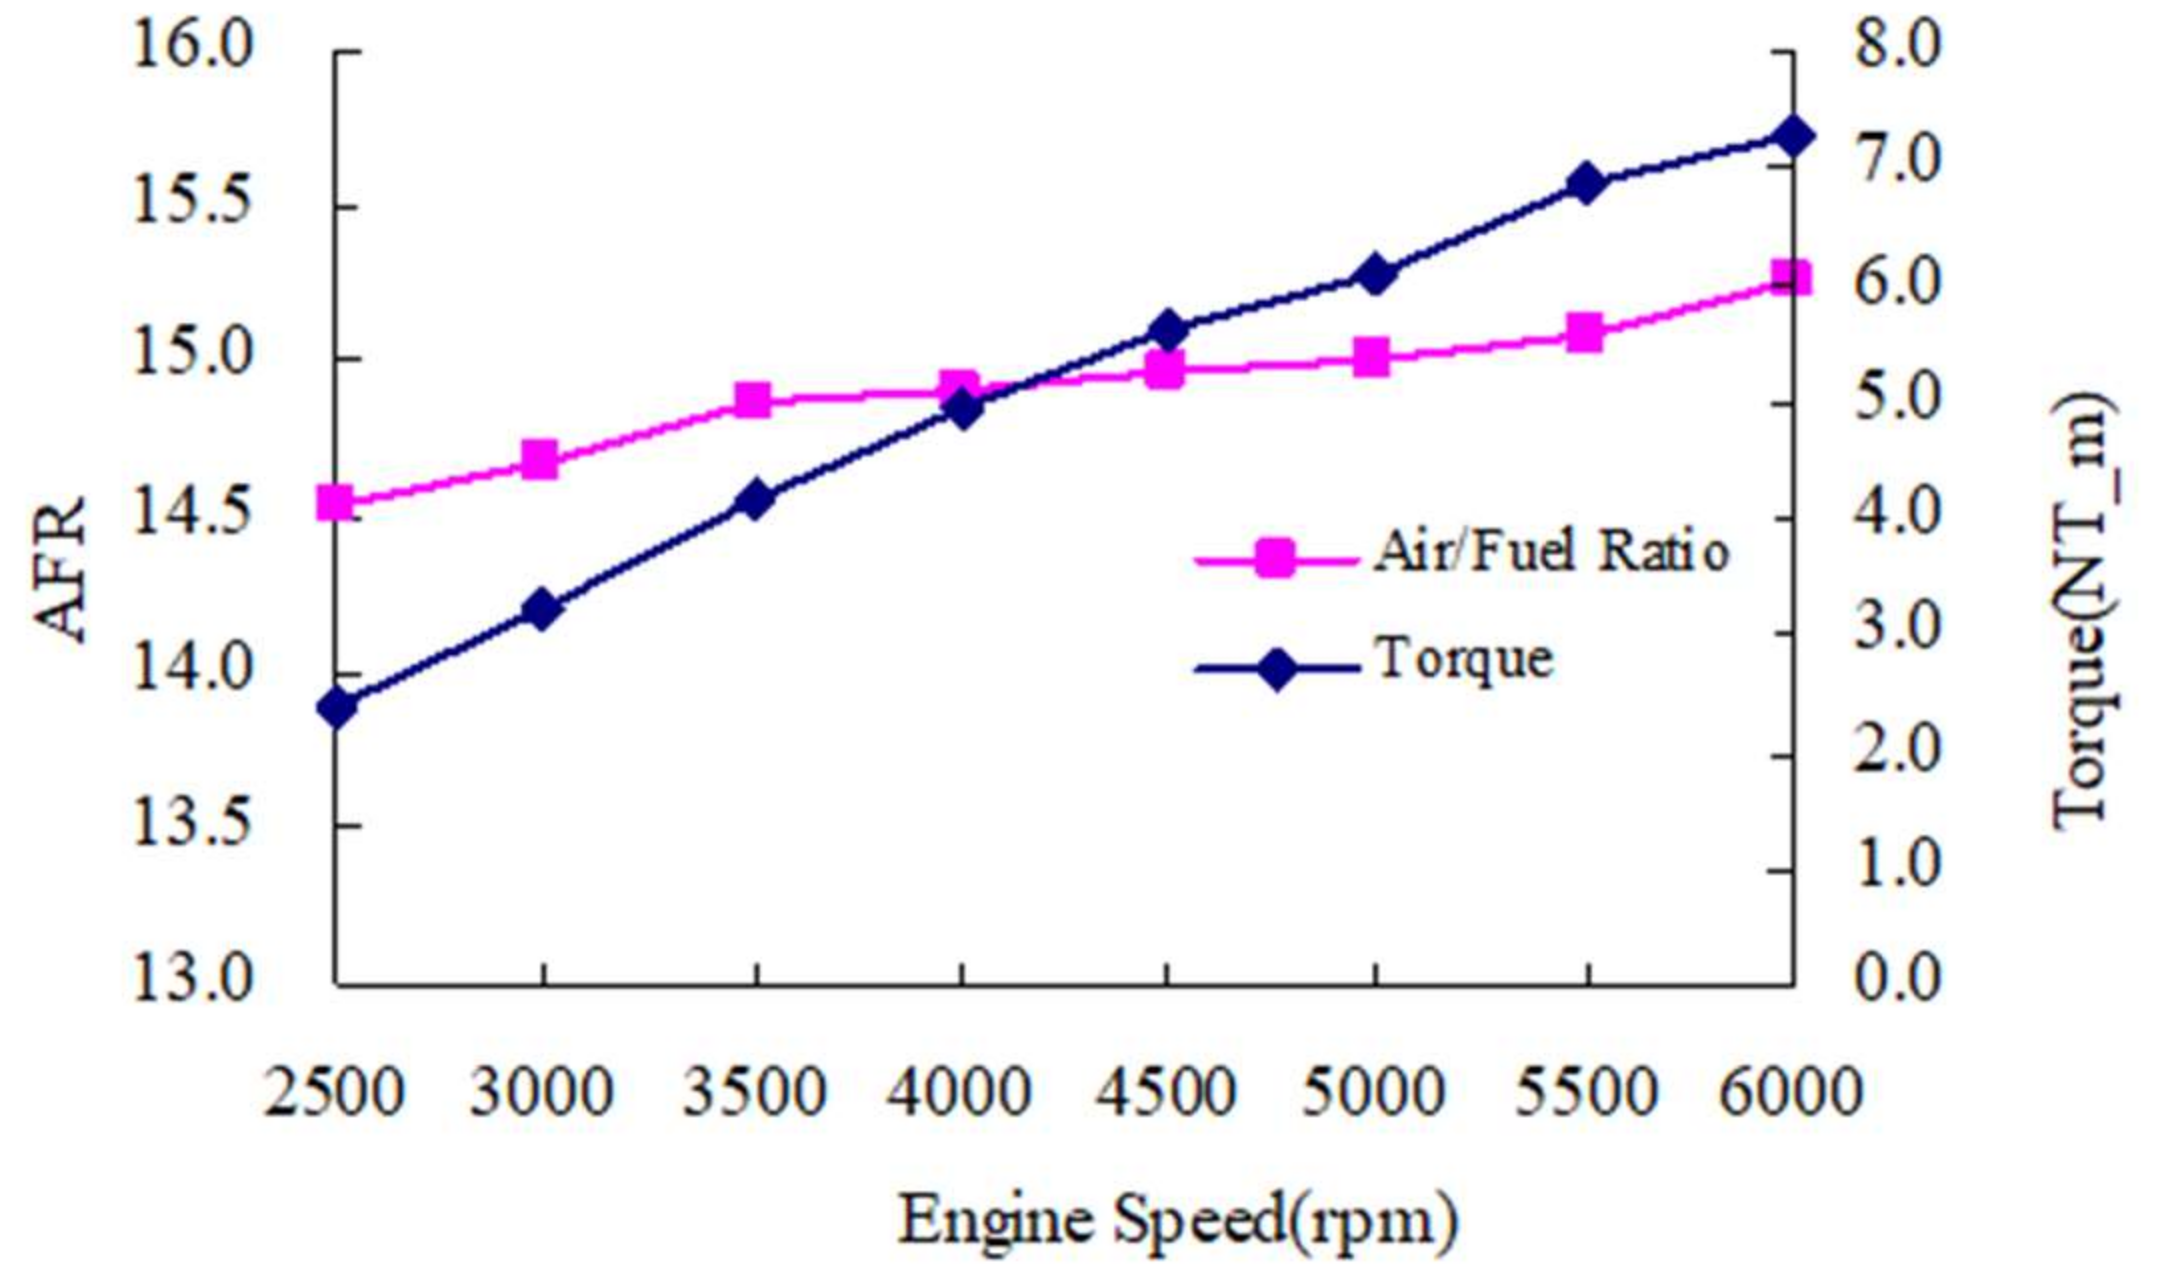
4.5. Experiments on a 500 c.c. GDI Motorcycle Engine

It was essential to select a high-pressure injector that was appropriate for the performance of the tested engine combustion system. Additionally, an experimental investigation on the characterization of the dynamic performance for the selected high-pressure injector was implemented by the design of the three-stage power MOSFETs driving circuit, injector experimental procedures, and the derived fuel injection curves using the polynomial curve fitting method. The designed injection system can be applied in other engines. In the experiments, the fuel was directly injected into the combustion chamber of the 500 c.c. motorcycle GDI engine during the intake stroke, producing a homogeneous mixture to achieve good air-fuel ratio control for GDI engine operations. Superior fuel injection timing was observed at the range between 40° and 70° ATDC in intake stroke, with the engine operating speeds from idle speed to 6000 rpm. The air-fuel ratio (AFR) is controlled and was close to 14.7 (stoichiometric) in the homogeneous combustion operation.
The control signal and driving current waveforms of the 500 c.c. GDI engine operating at 4500 rpm and 6000 rpm are illustrated in Figure 12a,b, respectively. In the figures, green and blue waveforms describe the proximity switch signal on the engine camshaft and the Z signal of the engine encoder. The orange waveform represents the signal of the TDC on intake. The GDI injector driving current is plotted in the pink waveform. The GDI engine has the advantage of faster power response and an increase of its engine torque with the throttle opening position. As seen in Figure 13, the 500 c.c. motorcycle GDI engine produces less torques at speed lower than 4000 rpm, due to slow turbulence and poor vaporization of fuel film on the piston crown.
The specific geometry and shaped cavity of the piston crown can be utilized to obtain the swirl-dominated and tumble-dominated flow to achieve the superior stratified combustion in the GDI engine during the low-speed operation. The combined effects lead to an intensified swirl and augmented turbulence intensity to enhance the fuel-air mixing. Thus, the engine torque is improved at low speed engine operations. Air path control in the engine is the key for AFR control. The air-fuel ratio was significantly affected by the air flow and fuel injection time. In the real engine, the air-fuel ratio (AFR) transient condition of the 500 c.c. motorcycle engine would lead to a ± 10% offset near the stoichiometry condition, using the derived fuel injection curves described in this paper. The injected fuel quantities of the GDI engine varied with different engine speeds to achieve an air–fuel ratio ranging between 14.5 and 15.2, as shown in Figure 13. The figure illustrates the engine’s air-fuel ratio control during a transition from stoichiometric to homogenous combustion. The HP fuel GDI injector provided more stable and accurate fuel injection quantities at an operating speed range between 1500 rpm and 6000 rpm. In a 500 c.c. motorcycle GDI engine test, the fuel injection quantities of the GDI injector in the engine are controlled by using the derived fuel injection curves. The engine speed was limited to 6000 rpm, because of the mechanical resonance occurring at the engine test stand between 6200 rpm and 6300 rpm. It is dangerous to achieve the complete HP fuel injecting experiment for the 500 c.c. motorcycle GDI engine if it exceeds 6000 rpm.

5. Conclusions

As can be seen from the results, an injector drive circuit was developed to improve the fuel injection of an HP fuel injector, reducing the lifetime of solenoid coils of an injector actuator during the fuel injection operation. PWM control was added to the power MOSFET drive circuit to quickly turn off the injection of HP fuel injectors. The injector drive circuit has been successfully achieved in many high-performance and long-lasting GDI fuel injection experiments to verify its performance and feasibility, meeting the operating characteristics of GDI injectors. Experimental studies were conducted to characterize the fuel injection curve of the HP fuel injector. Based on the operating requirements of the GDI fuel injector, an adjustable injector drive circuit was developed using a reference current profile. The GDI injector was calibrated by the injector drive circuit to improve the stability of automotive engines during their operation. Experimental investigations were used to characterize the performance of the injector drive circuit. An experimental investigation on the characterization of the dynamic performance for the selected high-pressure injector was implemented in the paper by the design of an injector drive circuit, injector experimental procedures, and the derived fuel injection curves using polynomial curve fitting method. Some main conclusions can be drawn:
1.
The designed GDI injector drive circuit improved the injector’s performance and provided more stable and accurate fuel injection quantities in the HP fuel injecting system. The power supply voltage of the HP injector needed to be operated and held in excess of DC 60 V, to squirt adequate fuel quantities. Otherwise, the 500 c.c. motorcycle GDI engine would run a transition from homogeneous combustion to lean burn combustion, or even misfire.
2.
The developed injector drive circuit was realized well in both experiments and practical applications. The experimental results show that the fuel injection quantities without the PWM control mode are more than those with the PWM control mode for the injecting tests of the HP GDI injector. The fuel injection quantities increased significantly, due to the PWM control withdrawn from the third-stage holding current (2.5 A). This holding current was adequate to pick up and hold the HP nozzle needle, and hence, the HP injector can sustain the injection of fuel during the last pulse operation. Therefore, the HP GDI injector should be supplied by a three-stage 12/5/2.5 A without PWM control modes added to the last pulse duration. Third-stage holding current amplitudes should be kept higher than 3 A if PWM control modes are added to the last pulse duration to achieve the HP GDI injector close faster and achieve the lowest amount of power consumption.
3.
The HP fuel GDI injector provides a more stable and accurate fuel injection quantities at an operating speed range between 1500 rpm and 6000 rpm. In a 500 c.c. motorcycle GDI engine test, the fuel injection quantities of the GDI injector in the engine were controlled by using the derived fuel injection curves. The engine speed was limited to 6000 rpm, because of the mechanical resonance occurring at the engine test stand between 6200 rpm and 6300 rpm. It is dangerous to achieve the complete HP fuel injecting experiment when the 500 c.c. motorcycle GDI engine exceeds 6000 rpm.

Author Contributions

Wen-Chang Tsai proposed to design a new electrical drive circuit for the HP GDI injector. The designed electric drive circuit was tested to verify its feasibility and performed. Wen-Chang Tsai carried out the drive circuit, which allows the HP fuel supply system its ability to operate stably and assures accurate fuel injection quantities to precisely control the expected AFR in the 500 c.c. motorcycle GDI engine operation. Wen-Chang Tsai and Tung-Sheng Zhan collaboratively do newly experimental results for the tested engine system to satisfy and address the reviewer’s comments. The authors discussed the experimental results and revised the manuscript.

Funding

This research is supported by Ministry of Science and Technology under Project No. MOT-106-2221-E-244-007.

Acknowledgements

The author would like to thank his colleagues, Peng-Cheng Yu (AERC, Taiwan) who helped us set up the experimental engine system.

Conflicts of Interest

The author declares no conflict of interest.

Nomenclature

SymbolsDescriptionUnit
SGDISpray Guided Direct Injection
HPHigh-pressurebar
GDIGasoline-direct-injection
AFRAir-fuel ratio
TTLTransistor-Transistor Logic
ICsIntegrated Circuits
MOSFETMetal oxide semiconductor field effect transistor
PWMPulse width modulation
ECUElectronic control unit
PFIPort fuel injection
PCBPrinted circuit board
KVLKirchhoff's Voltage Law
TDCTop dead left
rpmrevolutions per minute
Ip1First turn-on pulse signal
mfuelFuel injection mass g
tpInjection pulse durationμs

References

  1. Zhao, F.; Lai, M.C.; Harrington, D.L. Automotive spark-ignited direct-injection gasoline engines. Prog. Energy Combust. Sci. 1999, 25, 437–562. [Google Scholar] [CrossRef]
  2. Wang, C.; Xu, H.; Herreros, J.M.; Wang, J.; Cracknell, R. Impact of fuel and injection system on particle emissions from a GDI engine. Appl. Energy 2014, 132, 178–191. [Google Scholar] [CrossRef] [Green Version]
  3. Xu, H.; Ma, X.; Sarangi, A.K.; Weall, A.; Krueger-Venus, J. Fuel injector deposits in direct injection spark-ignition engines. Prog. Energy Combust. Sci. 2015, 50, 63–80. [Google Scholar] [CrossRef]
  4. Leach, F.; Knorsch, T.; Laidig, C.; Wiese, W. A Review of the Requirements for Injection Systems and the Effects of Fuel Quality on Particulate Emissions from GDI Engines; SAE Technical Paper; SAE International: Warrendale, PA, USA, 2018. [Google Scholar]
  5. Raza, M.; Chen, L.; Leach, F.; Ding, S. A review of particulate number (PN) emissions from gasoline direct injection (GDI) engines and their control techniques. Energies 2018, 11, 1417. [Google Scholar] [CrossRef]
  6. Guo, H.; Gao, W.; Liu, X.; Zhang, Z. Study on measurement system of the dynamic performances for an electronic fuel injector. In Proceedings of the 2010 International Conference on Measuring Technology and Mechatronics Automation (ICMTMA 2010), Changsha, China, 13–14 March 2010; pp. 608–611. [Google Scholar]
  7. Zhang, X.; Palazzolo, A.; Kweon, C.B.; Thomas, E.; Tucker, R.; Kascak, A. Direct fuel injector power drive system optimization. SAE Int. J. Engines 2014, 7, 1137–1154. [Google Scholar] [CrossRef]
  8. Zhang, J.Q.; Ouyang, G.Y. Optimization design of the electronically controlled injector. In Proceedings of the IEEE International Conference on Mechatronics and Automation, Changchun, China, 9–12 August 2009; pp. 1996–2001. [Google Scholar]
  9. Tsai, W.C.; Wu, Z.H. Use of Taguchi method to optimize the operating parameters of a high-pressure injector driving circuit. Appl. Mech. Mater. 2011, 130, 2795–2799. [Google Scholar] [CrossRef]
  10. Tsai, W.C.; Yu, P.C. Design of the electrical drive for the high-pressure GDI injector in a 500cc motorbike engine. Int. J. Eng. Ind. 2011, 2, 70–83. [Google Scholar]
  11. Cheng, Q.; Zhang, Z.; Xie, N. Power losses and dynamic response analysis of ultra-high speed solenoid injector within different driven strategies. Appl. Therm. Eng. 2015, 91, 611–621. [Google Scholar] [CrossRef]
  12. Bai, Y.; Fan, L.Y.; Ma, X.Z.; Peng, H.L.; Song, E.Z. Effect of injector parameters on the injection quantity of common rail injection system for diesel engines. Int. J. Automot. Technol. 2016, 17, 567–579. [Google Scholar] [CrossRef]
  13. Chen, C.; Li, Y.Q.; Wang, D.F. The Design of Driving Circuit of GDI Injector and Experimental Verification based on L9707 Chip. Intern. Combust. Engine Powerpl. 2010, 1, 1–6. [Google Scholar]
  14. Hu, Y.Z.; Teng, Q.; Liu, J.S. Development of a driver circuit for GDI high pressure injector. Electron. Des. Eng. 2011, 19, 141–144. [Google Scholar]
  15. LM1949 Injector Drive Controller Datasheet; Texas Instruments: Dallas, TX, USA. 2013. Available online: http://www.ti.com/lit/ds/symlink/lm1949.pdf (accessed on 28 September 2018).
  16. Bosch EV1 high-pressure fuel injector; Professional Fuel Injector Cleaning and Flow Testing Service Glenville NY, USA. 2018. Available online: http://injectorrepair.com/knowledge-base/ (accessed on 28 September 2018).
Figure 1. Cylinder head of a KYMCO Xciting-500 engine before and after modification.
Jlpea 08 00036 g001
Figure 2. Experimental test configuration of a 500 c.c. GDI motorbike engine system.
Jlpea 08 00036 g002
Figure 3. Investigations on fuel injection quantities of the GDI injector.
Jlpea 08 00036 g003aJlpea 08 00036 g003b
Figure 4. The high-pressure GDI injector Control System.
Jlpea 08 00036 g004
Figure 5. The Control System Diagram for a 500 c.c. motorcycle Engine.
Jlpea 08 00036 g005
Figure 6. Development of the H.P. injector driving circuit.
Jlpea 08 00036 g006aJlpea 08 00036 g006b
Figure 7. The driving pulse signals and GDI injector current waveforms without and with PWM control added to the last pulse duration.
Jlpea 08 00036 g007
Figure 8. Effect of various speeds and pulse widths on the fuel injection quantities of the GDI injector fed by the three-pulse driving current (PWM control withdrawn from the last pulse duration).
Jlpea 08 00036 g008
Figure 9. Effect of the injector supply voltages on the fuel injection quantities of the HP injector.
Jlpea 08 00036 g009
Figure 10. Comparison of the fuel injection quantities (a) with and (b) without PWM control at various fuel pressures at an engine speed of 6000 rpm.
Jlpea 08 00036 g010
Figure 11. Comparisons between 10 and 12 A peak driving currents on fuel injection quantities at 6000 rpm.
Jlpea 08 00036 g011
Figure 12. Control signal and driving current waveforms of the 500 c.c GDI engine.
Jlpea 08 00036 g012
Figure 13. Torque and Air/fuel ratio of the 500 c.c. motorcycle GDI engine at various speeds.
Jlpea 08 00036 g013
Table 1. Basic engine specification.
Xciting-500 c.c.
Engine typesingle cylinder, four strokes, water cooling
Displacement498.5 mm3
Bore × StrokeΦ92 × 75 mm
Compression ratio 10.5
Maximum power28.4/7500 (kW/rpm)
Maximum torque4.1/5500 (kg-m/rpm)
Ignition methodCrystal
Spark plugNGK CR7E
Table 2. Experimental configuration.
ConditionDescription
Supply voltagesDC 40–70 V
Current profiles Max12/5/3 A
Fuel pressure60–100 Bars
Fuel temperature30 °C
Number of injection samples1000
Table 3. Comparisons between 10 and 12 A peak driving currents on fuel injection quantities.
Pulse Widthrpm10 A12 AVariation
1200 μs120012.45212.733−0.281
240012.51512.768−0.253
600012.52912.739−0.210
900012.59612.5130.083
1300 μs120013.28813.566−0.278
240013.41113.607−0.196
600013.38413.602−0.218
900013.42713.3430.084
1400 μs120014.40214.866−0.464
240014.48914.883−0.394
600014.54914.925−0.376
900014.59114.6130.122
1500 μs120015.71616.001−0.285
240015.83816.042−0.204
600015.89316.098−0.205
900015.91415.7580.156
1600 μs120016.63916.931−0.292
240016.75317.298−0.545
600016.81817.036−0.218
900016.84416.6910.153
1700 μs120017.67118.023−0.352
240017.80218.237−0.435
600017.88818.188−0.300
900017.92417.7730.151
1800 μs120018.93919.254−0.315
240019.0619.308−0.248
600019.17219.426−0.254
900019.19818.9720.226
1900 μs120019.95220.246−0.294
240020.10220.444−0.342
600020.21920.428−0.209
900020.23819.9560.282
2000 μs120020.99821.325−0.327
240021.15621.342−0.186
600021.27921.509−0.230
900021.30820.9910.317

