Article

Groundwater Resources of the Transboundary Quaternary Aquifer of the Lake Chad Basin: Towards a Better Management via Isotope Hydrology

1
Faculty of Sciences, University of Douala, Douala P.O. Box 24157, Cameroon
2
Département d’Hydrogéologie, Université de Corse Pascal Paoli, Campus Grimaldi, BP52, 20250 Corte, France
3
Centre National de la Recherche Scientifique (CNRS), UMR 6134 SPE, 20250 Corte, France
4
UMR 6249-CNRS Chrono-Environnement, Université de Franche-Comté, F-25000 Besançon, France
*
Author to whom correspondence should be addressed.
Resources 2023, 12(12), 138; https://doi.org/10.3390/resources12120138
Submission received: 20 September 2023 / Revised: 14 November 2023 / Accepted: 14 November 2023 / Published: 22 November 2023

Abstract

:
A multi-tracer approach has been implemented in the southwestern part of the Lake Chad Basin to depict the functioning of aquifers in terms of recharge, relationship with surface water bodies, flow paths and contamination. The results are of interest for sustainable water management in the region. The multi-layered structure of the regional aquifer was highlighted with shallower and intermediate to deep flow paths. The shallower aquifer is recharged with rainwater and interconnected with surface water. The groundwater chemistry indicates geogenic influences in addition to a strong anthropogenic fingerprint. The intermediate to deep aquifer shows a longer residence time of groundwater, less connection with the surface and no to only a little anthropogenic influence. Ambient Background Levels (ABLs) and Threshold Values (TVs) show the qualitative status of the groundwater bodies and provide helpful information for water resources protection and the implementation of new directives for efficient and more sustainable groundwater exploitation.

1. Introduction

The Sahel is a semi-arid region with a surface area of 3 million km2, representing about 10% of the total area of the African continent. It is among the areas most affected worldwide by the issue of water scarcity as it is vulnerable to the effects of climate change, not only because of the aridity of the climate but also because of environmental degradation [1]. This degradation, which results sometimes in water pollution and decrease, is related to multiple causes, such as population growth, socio-economic and industrial activities and the over-consumption of natural resources [2]. Moreover, the combined effects of climate change, population growth, land degradation and reduced and irregular rainfall have contributed to a reduction in the availability of water resources, leading to transboundary ethnic conflicts between riparians related to the use of the available resource throughout the Sahel in general and the Lake Chad Basin in particular. The Lake Chad Basin, located in the eastern part of the Sahel region, corresponds to nearly 8% of the surface area of the African continent, which represents three-fifths of the Sahelian strip. It covers eight countries (Nigeria, Niger, Chad, Cameroon, Central African Republic, Sudan, Libya and Algeria), with an area of about 2,381,000 km2. It is one of the largest sedimentary catchments, with an estimated population of 47 million people whose main activities are agriculture, livestock breeding and fishing [3]. In this arid region of Lake Chad Basin, surface waters are scarce, and groundwater constitutes, therefore, the main source of water for human activities [4,5]. It is the main resource for reliable and permanent water supply in the region [6,7], especially in the northern and central parts of the basin where the lowest rainfall is recorded, averaging 150 mm/year [8]. Nevertheless, the southern part of the basin, which corresponds to the Far North of Cameroon, is poorly documented compared to the rest of the basin, and the few studies carried out in this region only dealt with the decline in water quality [6,7]. Therefore, a better understanding of the functioning of the most widely used groundwater resource, the Quaternary aquifer, will be beneficial in addressing the integrated management of this resource, which has a strategic interest for more than 4.5 million people living in this region. Furthermore, the southern Lake Chad Basin is generally considered one of Cameroon’s main sources of food since two-thirds of the territory is used for agricultural purposes in addition to widespread livestock breeding [9]. By studying the regional shallow Quaternary aquifer, the aim of this paper is to provide information about the recharge modes, infiltration processes, and relationships with surface water and to delineate the different flow paths within the aquifer. For this, a purpose-designed multi-tracer approach has been developed in order to provide the first overview necessary to improve the local situation with regard to groundwater resource management [10,11,12,13]. The results obtained will be useful for groundwater management, especially for this transboundary resource. Recommendations may be applicable to other similar semi-arid regions facing the same challenges.

2. Study Area

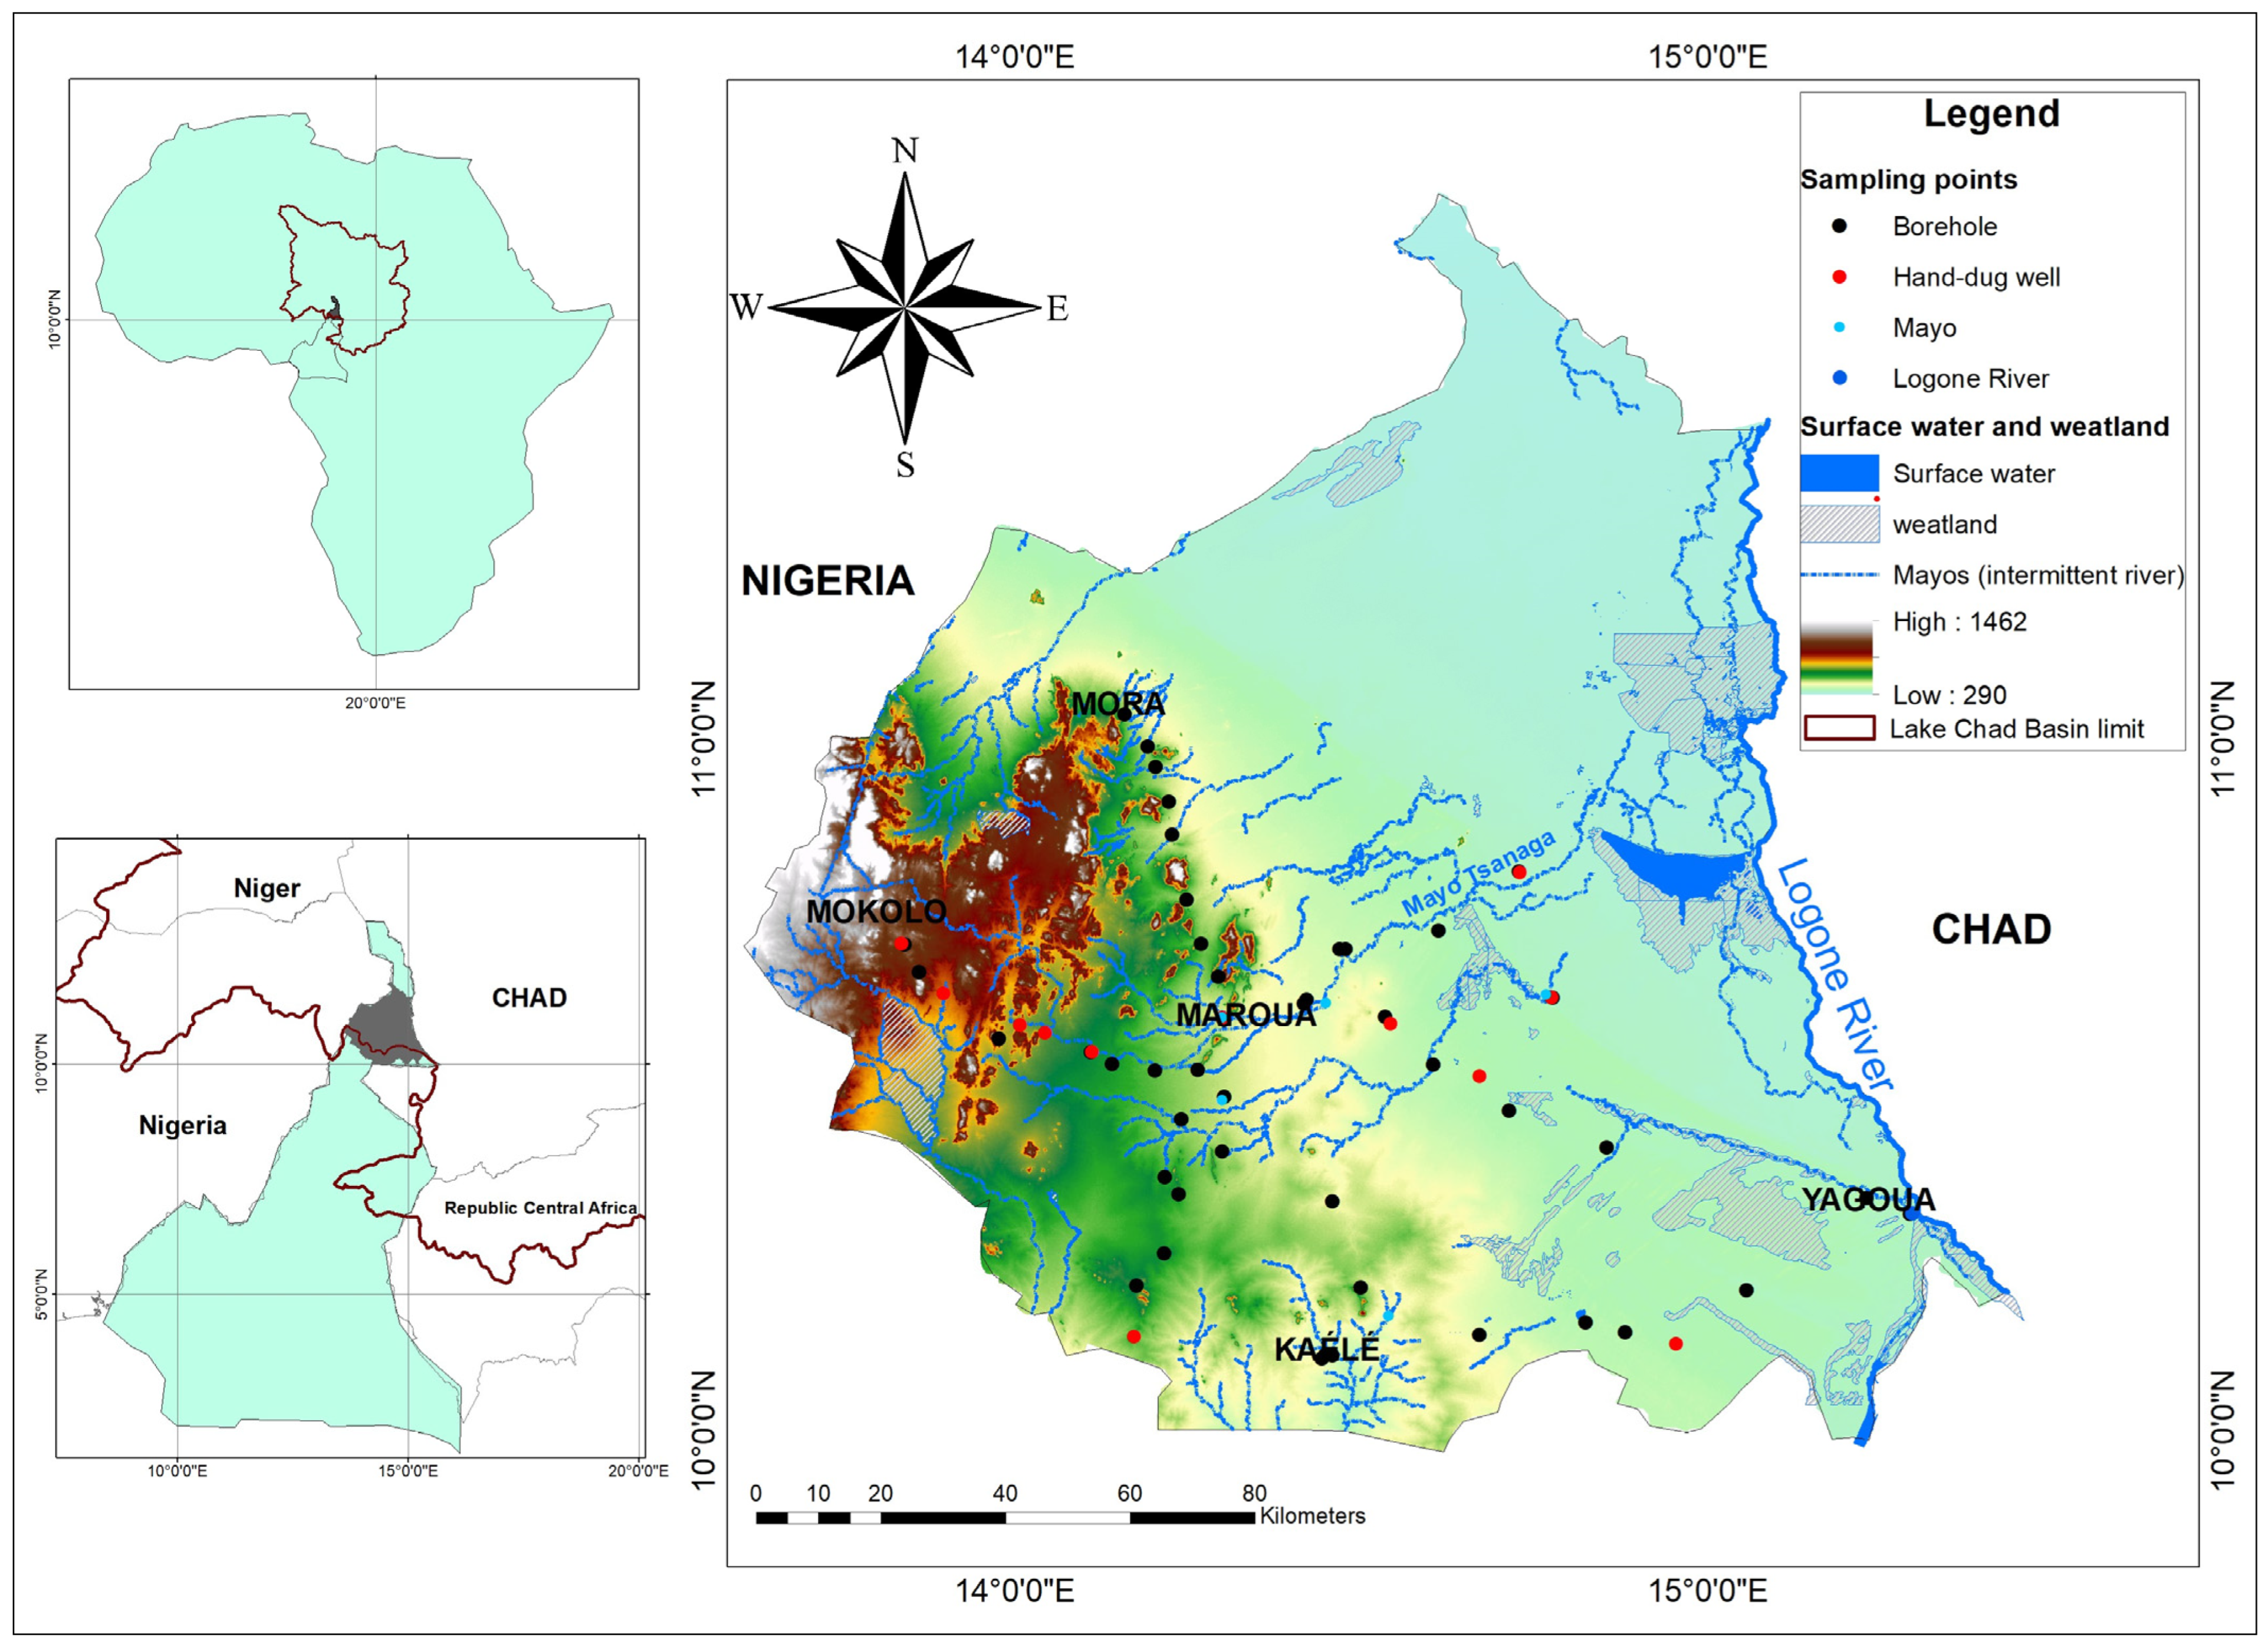
2.1. Location and Geomorphology

The southern part of the Lake Chad Basin is located in Central Africa. It is bordered to the west by Nigeria and to the north and east by Chad (Figure 1). It represents approximately 34,246 km2 and corresponds to the Far North region of Cameroon. The population of this area was estimated at more than 4.5 million inhabitants in 2019 [9], i.e., 18% of the national demographic weight and 6.5% of the Lake Chad Basin population [14]. However, it is currently experiencing considerable demographic growth in some localities (Maroua, Yagoua, Mora, Mokolo; Figure 1), with an increase of approximately 2.8% per year, above the average national population growth rate. This dynamic population increase is not accompanied by any structured urban planning, and neither drinking water supply nor sanitation infrastructure is taken into account. In addition, it is worth noting that the surface area of irrigated lands has significantly increased over the years in this region in order to cover the strong national needs for food as well as for industrial agriculture for exportation. For example, in 2000, the presence of 13,820 ha of irrigated land was reported in the southeastern part of the study region, and between 2014 and 2020, 7500 ha of irrigated land was rehabilitated in the Maga zone [15].
The Far North region of Cameroon is characterised by three types of landforms: the plain, the mountains and the piedmont. The plain, hereafter called the Yaere, covers the eastern and northern parts of the study area, representing ~70% of the surface area [10]. It is considered the maximum extension of Lake Chad in the Quaternary. The mountain region extends over ~10,000 km2, with altitudes ranging from 260 to 508 m.a.s.l and an average of less than 300 m.a.s.l. The highest zones are the Mandara Mountains, oriented NNE-SSW and stretching over a length of 150 km and a width of 70 km, with altitudes ranging from 700 to 1400 m.a.s.l. The transition zone between the Mandara Mountains and the Yaere consists of a piedmont domain where altitudes range from 300 to 761 m.a.s.l., with an average value of 340 m.

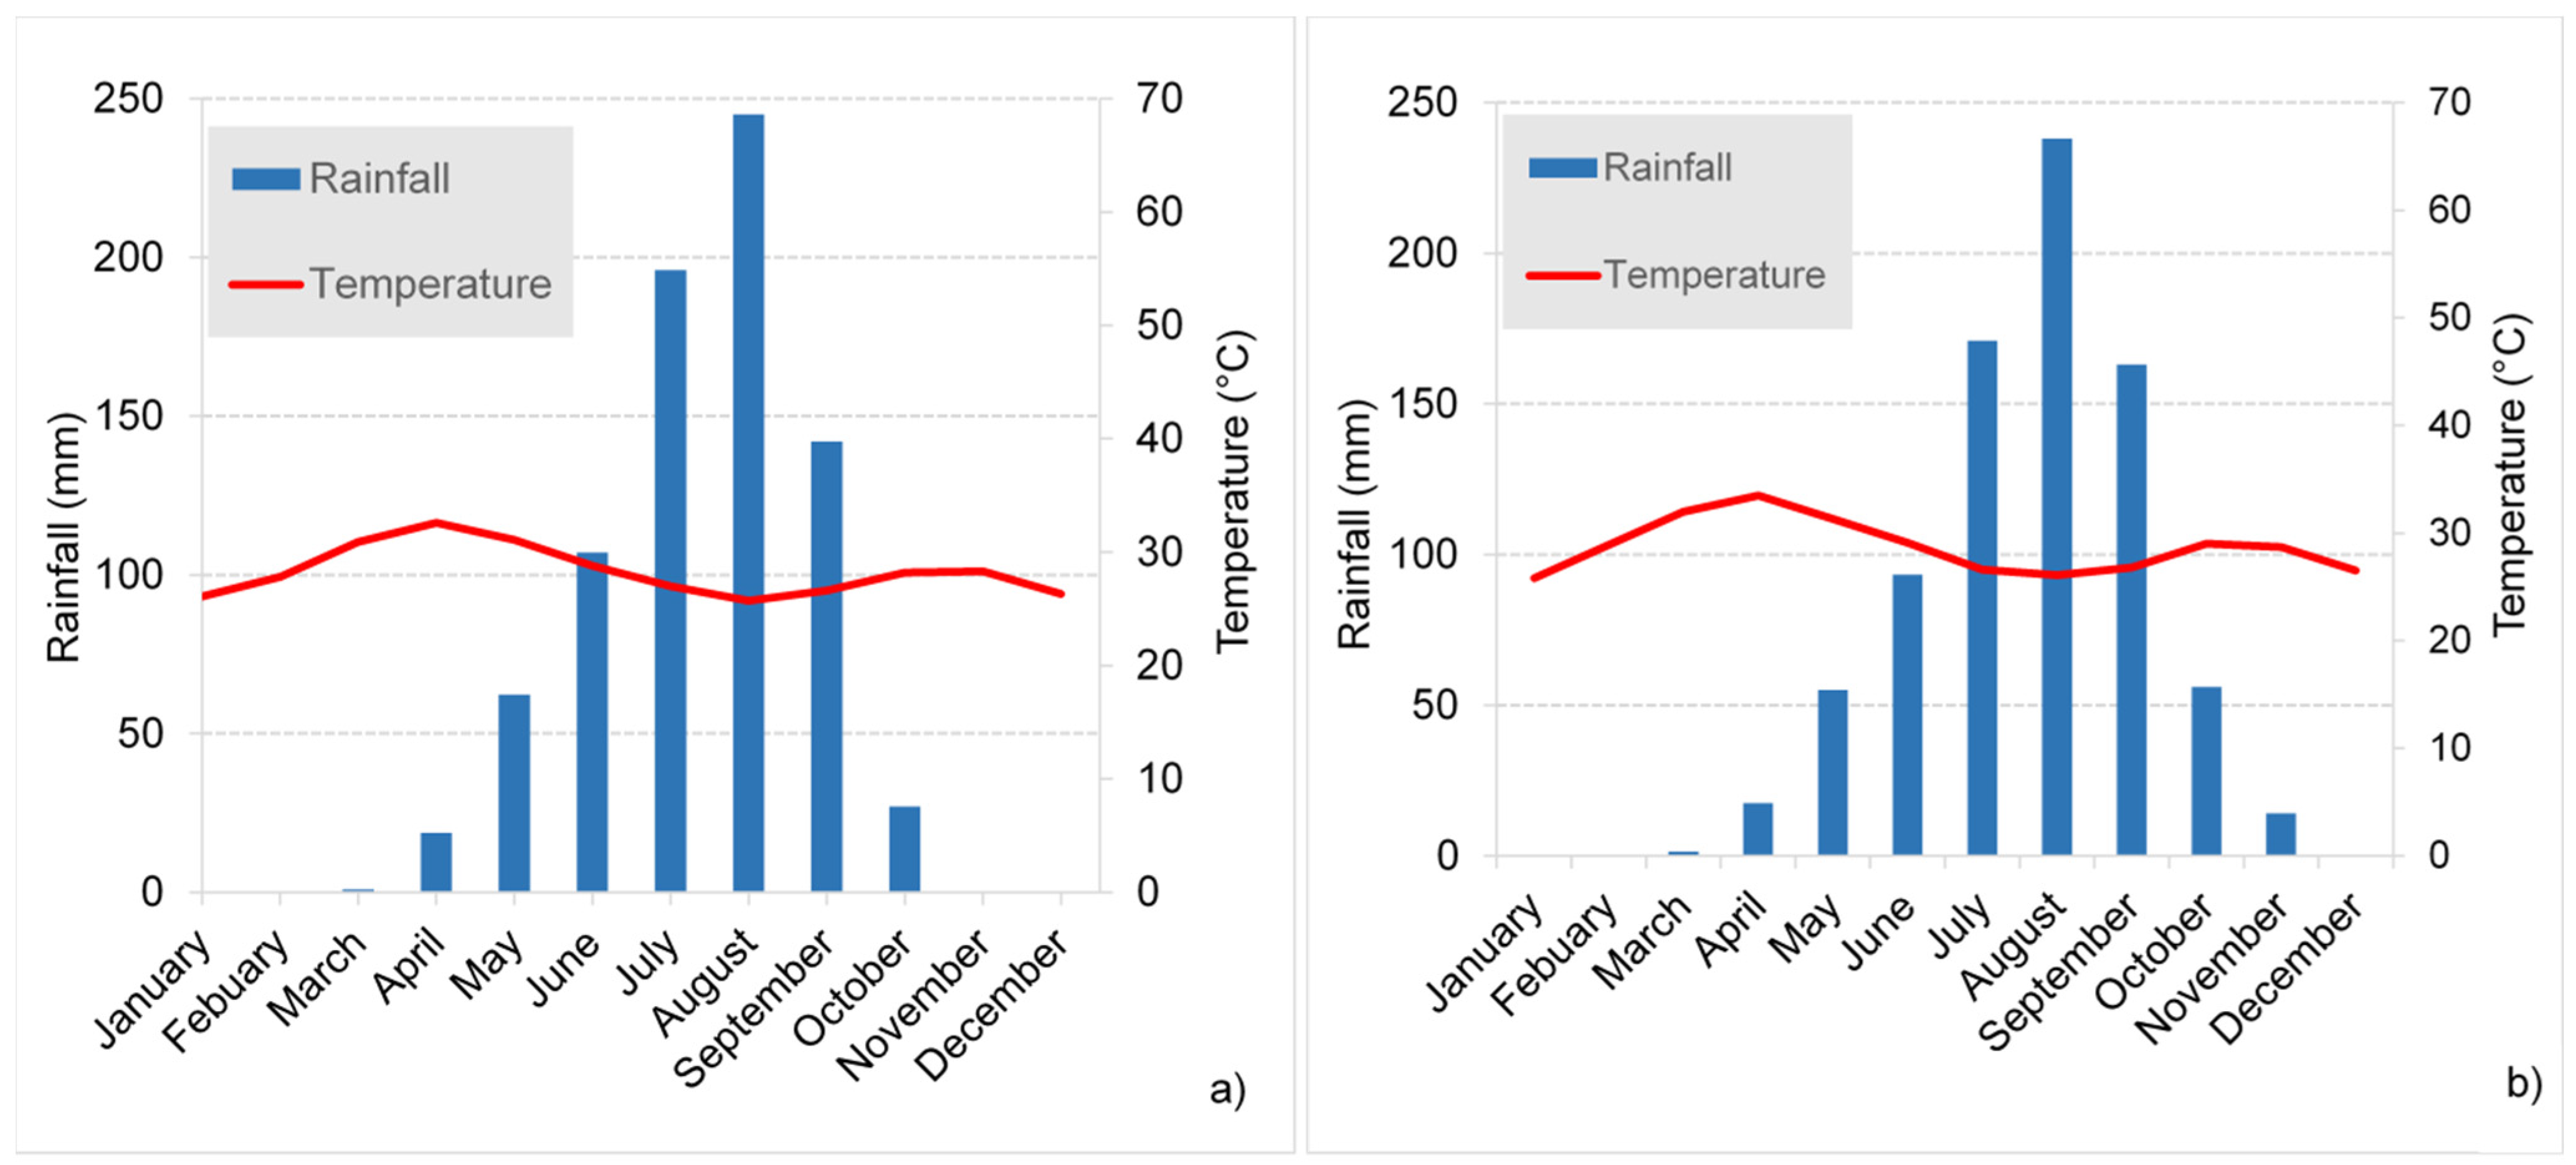
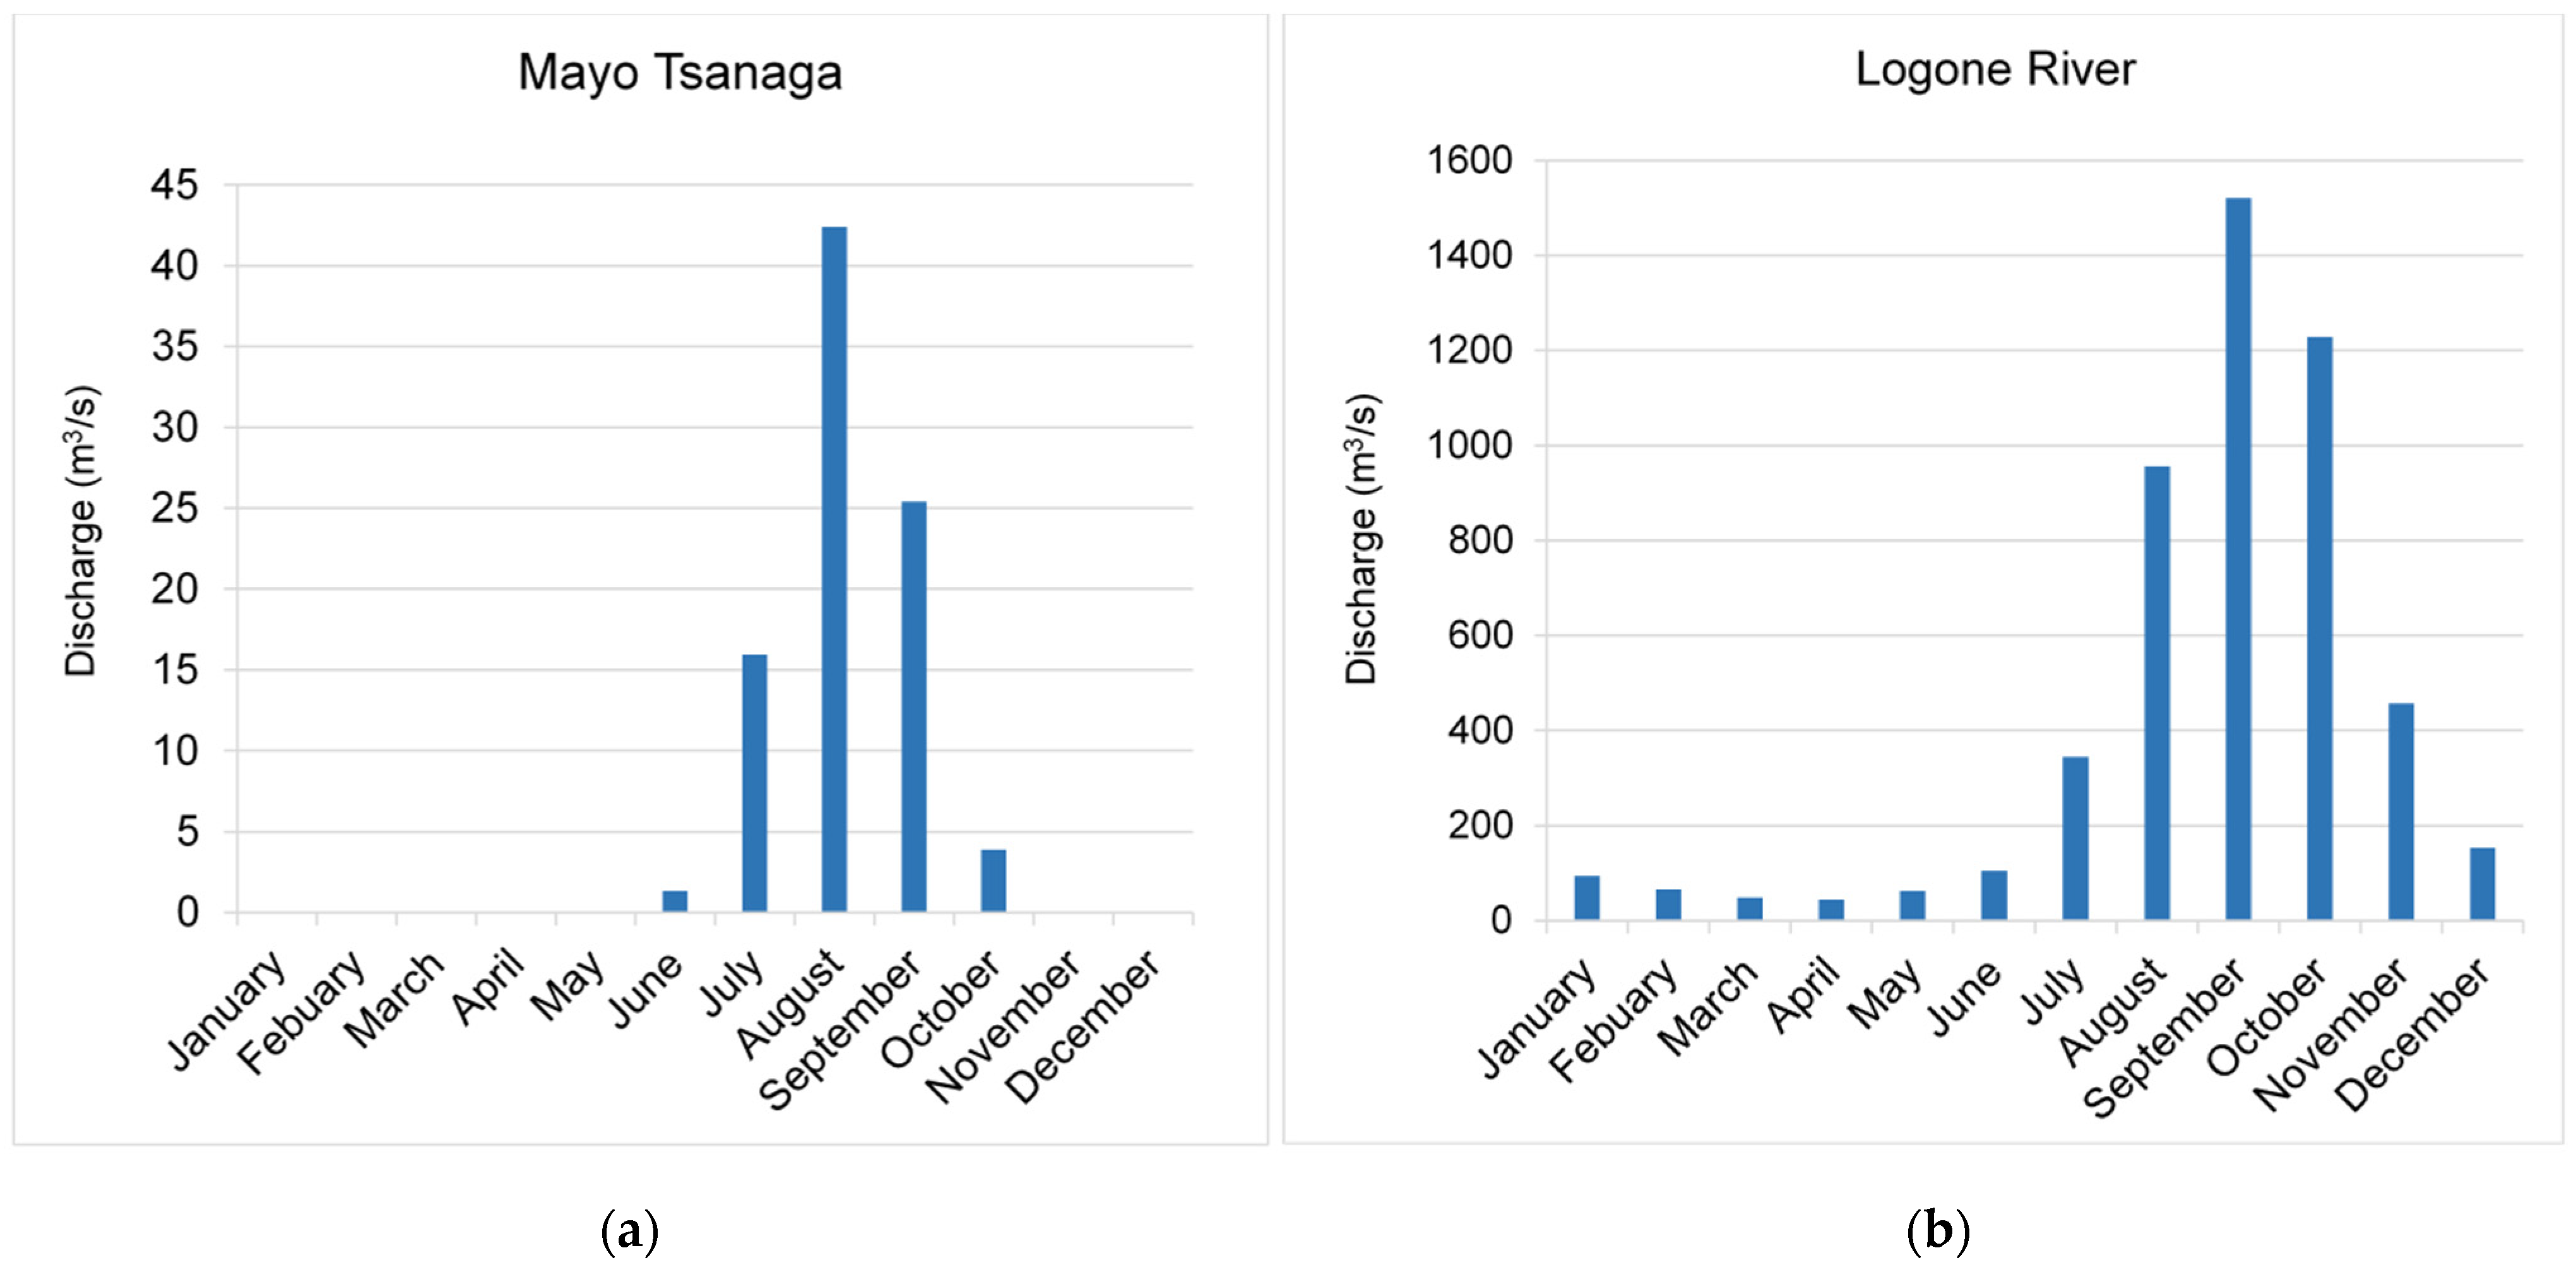
2.2. Hydroclimatology

The climate in the study area displays strong spatial variability and is controlled via the migration of the Intertropical Convergence Zone (ITCZ) [16]. The region is characterised by a semi-arid climate with rainfall between 400 and 600 mm/year, while approximately 1000 mm/year is recorded in mountainous areas [17]. Precipitation is mostly recorded between April and October, while between November and March, the amount of precipitation is very low to non-existent [17] (Figure 2). The average temperature varies between 24 °C and 33 °C; April is the warmest month of the year (33.2 °C and 33 °C, respectively for Maroua and Kaélé), and January is the coldest (24.7 and 24.3 °C, respectively for Maroua and Kaélé). The mean annual evapotranspiration for Maroua (centre of study area) is around 2100 mm/year (estimated using the Penman method [18]), approximately double the maximum annual rainfall recorded in the region. It is worth noting that since 1971, the area has been affected by a sustained decline in rainfall followed by a gradual resumption of rainfall since the beginning of the 2000s [19].
The study area is drained by the Mayos (seasonal temporary rivers connected to the Lake Chad endorheic basin) and the perennial Logone River (Figure 1). The variation in rainfall has a significant impact on the discharge of the Logone River and Mayos over months and years. The highest discharge rate (42 m3/s) is observed in August, which is the rainiest month (Figure 2 and Figure 3). The Mayos are dry between November and May, which corresponds to the dry season (Figure 3).

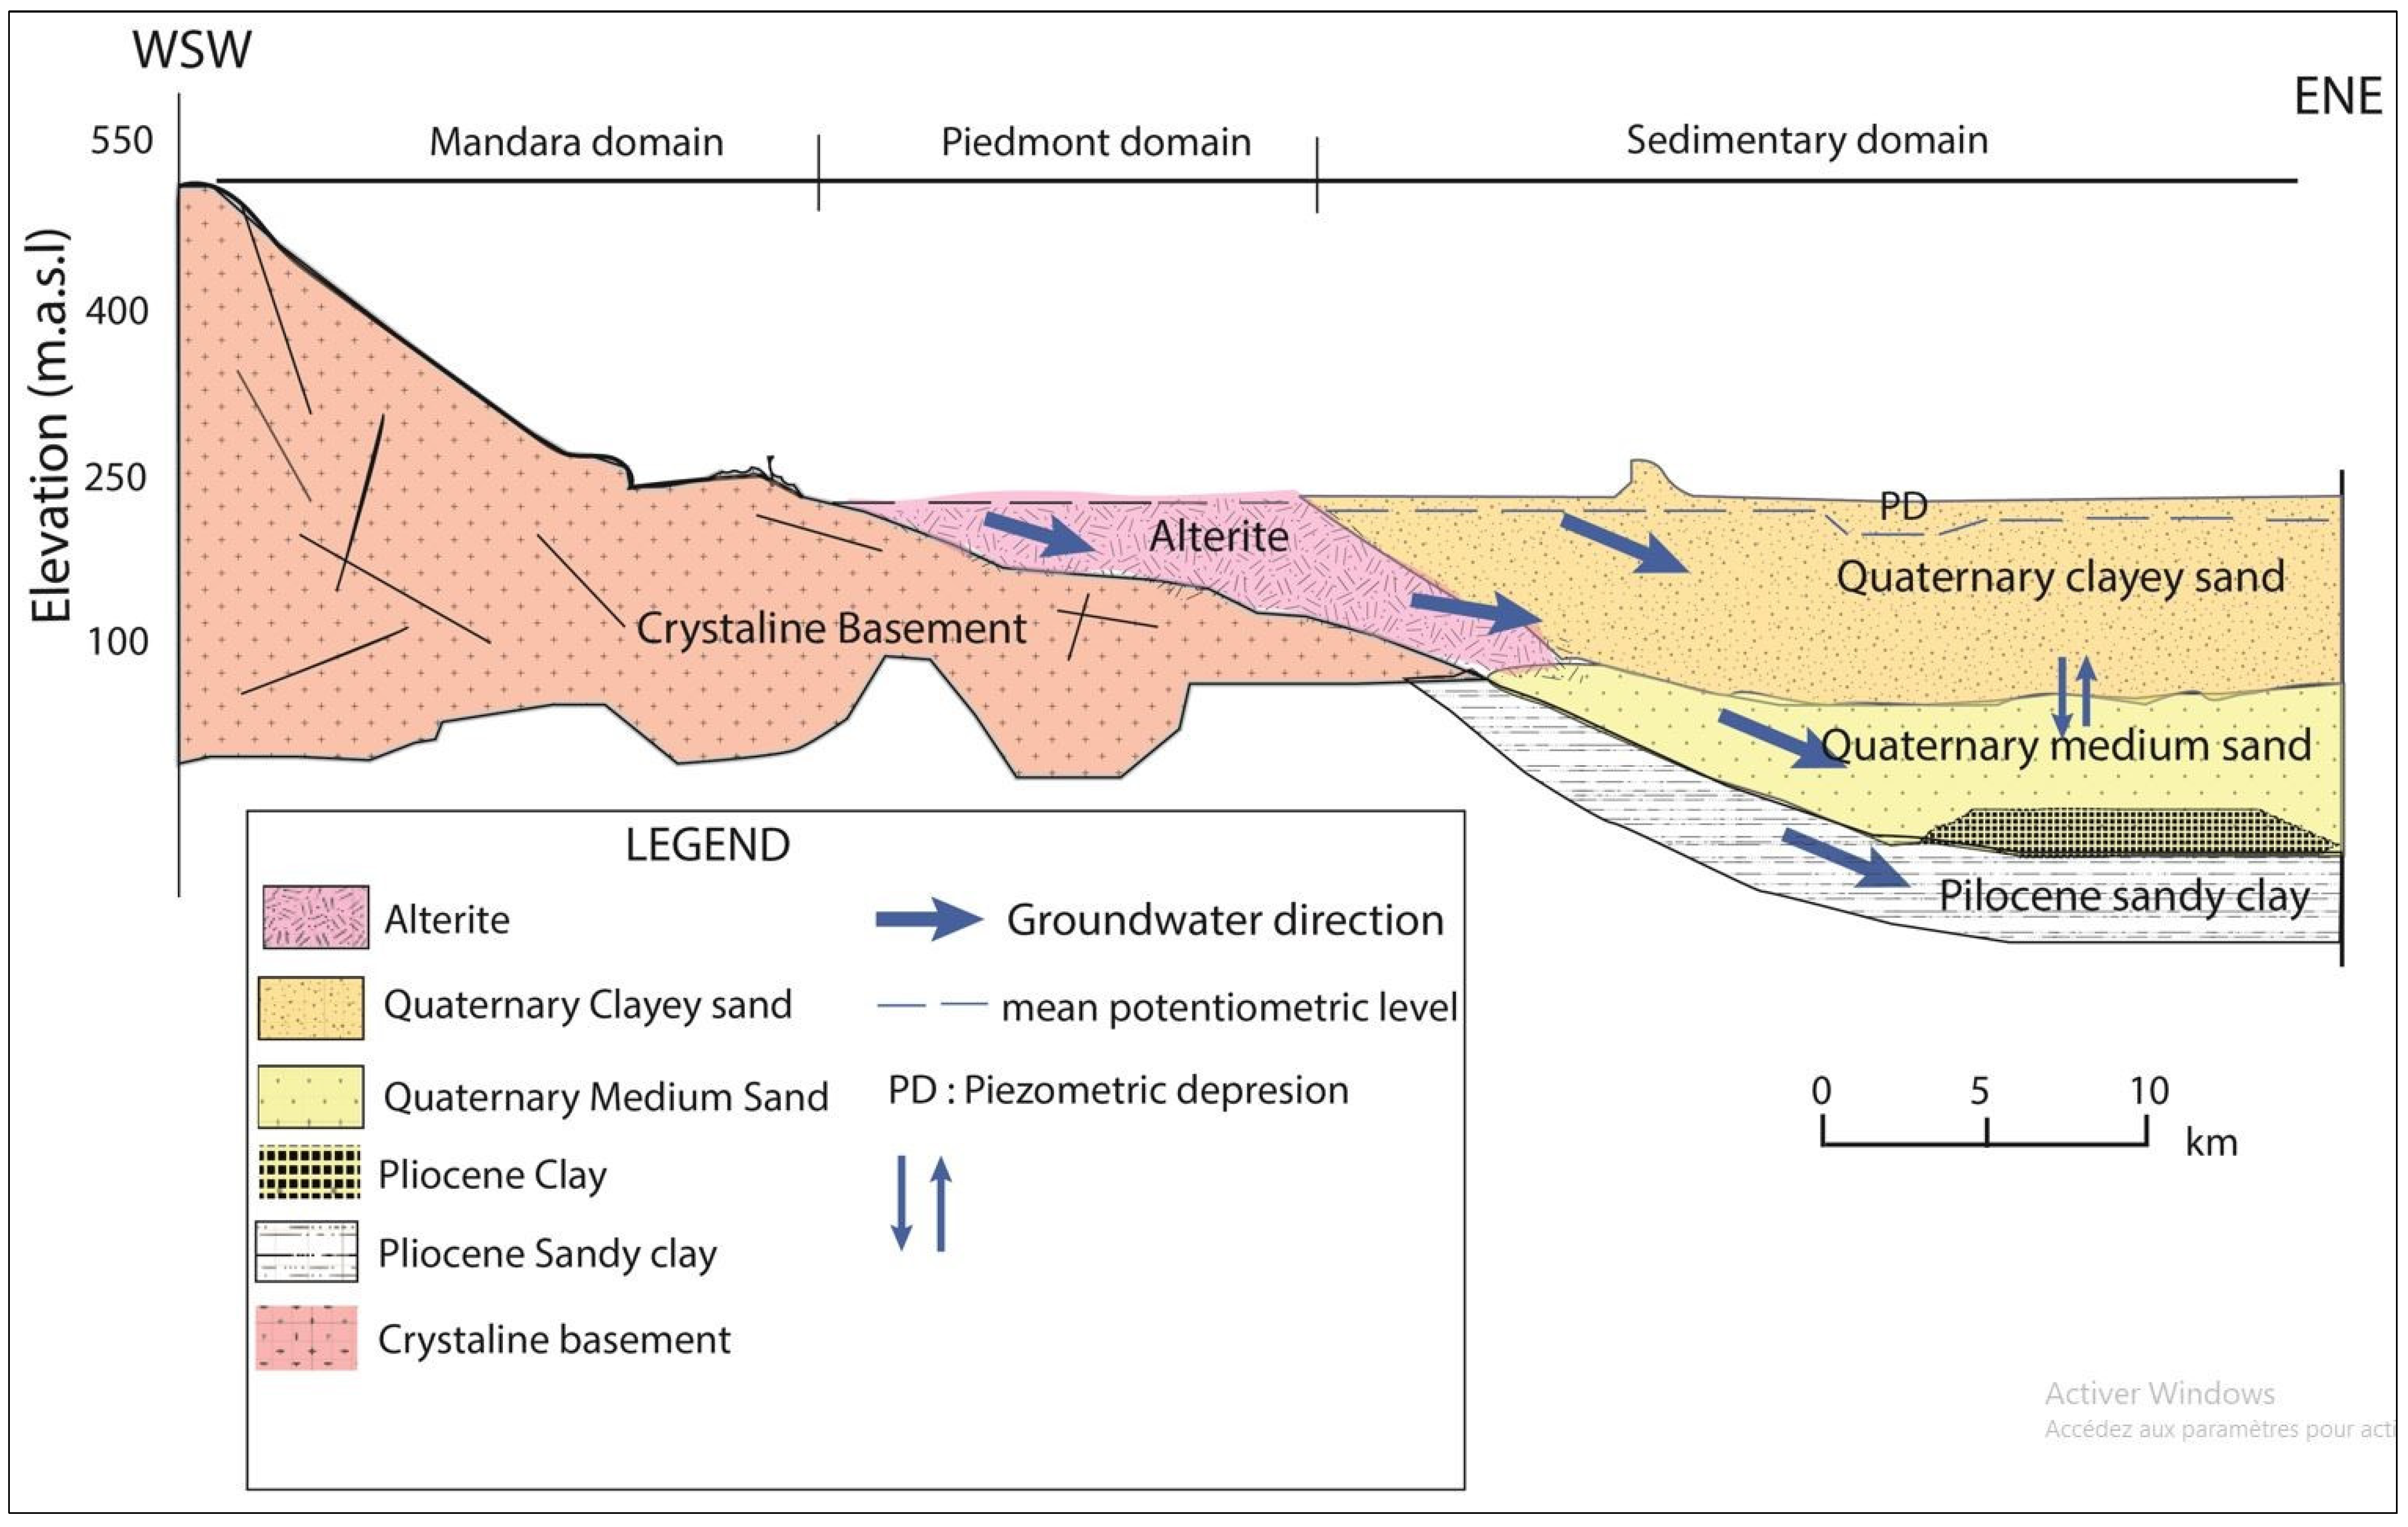
2.3. Geological and Hydrogeological Settings

The Far North of Cameroon lies on a Precambrian basement (Figure 4) covered by a Tertiary–Quaternary sedimentary cover. Precambrian outcrops in the Mandara domain are characterised by calco-alkaline, sub-alkaline to alkaline granites, anatexite gneisses and volcanic rocks composed of andesites, dacites, and rhyodacites [22]. The piedmont plain is dominated by sedimentary deposits consisting mainly of alterites, sands and clays, as well as tertiary metamorphic rocks of the greenschist facies, known as “Maroua greenschist”, which are found north of Maroua. An alterite layer, developed from the granitic substratum, is covered by a clay-rich sediment associated with sand lenses and sometimes a ferruginous crust [9]. The sedimentary deposits, mainly composed of sands and clays, extend over the entire Yaere plain. They are composed of minerals such as quartz and feldspars with a decreasing particle size distribution towards the north. Carbonate nodules are also found in enclaves in sedimentary rocks [23]. These geological entities, depending on their physical characteristics, can constitute aquifers in the study region.
It is known from the literature that the Lake Chad Basin is made up of three aquifers: the Continental Terminal, the Lower Pliocene and the Quaternary [24]. The Continental Terminal aquifer is the deepest, lying on the basement and outcrops in the Central African Republic. This aquifer is essentially made up of feldspathic sandstones with siliceous cement and is characterised by siderolitic facies rich in iron [25]. The Lower Pliocene aquifer is located at a depth of 250 to 300 m. It begins with a sandy series 10 to 30 m thick (Lower Pliocene) and continues with a 200 m thick clay sedimentation that separates the Pliocene from the Quaternary formation layer [24]. According to [20], the Continental Terminal and Lower Pliocene aquifers are hydraulically connected with a gradual transition from sandstones to sands. Whilst the Lower Pliocene is separated from the quaternary by clays, which constitute the Upper Pliocene. On the other hand, basement and sediments are hydraulically connected in the piedmont domain using alterites and diverse sedimentary materials. The Quaternary aquifer is shared by four countries (Chad, Niger, Central African Republic and Cameroon). This aquifer is unconfined around the Logone River and becomes confined towards the piedmont area (Figure 5 and Figure 6). The aquifer is composed of sandy deposits with clay intercalations. Its depth varies between 50 and 180 m [26]. It is the main aquifer tapped by the populations of the region. The Quaternary hydrogeological units are characterised by strong lateral and vertical variations in the lithology inherited from the geological history of the region and present varying hydrogeological characteristics depending on the location. The hydraulic conductivity of the sediments averages 4.10−4 m/s and is very favourable to aquifer development [27]. The groundwater reserve is estimated to be between 0.9 and 1.08 billion m3 [11]. In contrast, crystalline aquifers show poor hydrogeological potential and low average flow rates (Table 1).
A piezometric study of the Quaternary aquifer [28] identified the recharge zones and two major directions of groundwater flow. The recharge takes place in the Mandara mountains, and groundwater flows towards the piezometric depression of Kaele–Diguir (Figure 5). A groundwater flow from the Logone River is also observed (Figure 4), highlighting a strong surface water/groundwater relationship between the surface waters and groundwater, as previously demonstrated by [10]. The piezometric depression observed from Kaele to Diguir is common in the Sahel region due to strong evapotranspiration in this place or to a flexure in the basement, leading to a local depression, according to [10,11]. Nevertheless, there is still a great debate on this topic.

3. Sampling and Analytical Methods

3.1. Sampling Network and Protocol

A 10-day sampling campaign was carried out in November 2019 (end of the rainy season) in the Far North of Cameroon; sampling was performed on different hydrogeological entities. The choice of sampling points was made on a 1:50,000 topographic map several weeks before the field trip, with the main selection criteria being homogenous spatial distribution, accessibility conditioned by the state of the roads and occurrence of flooding. A total of 63 points corresponding to 45 boreholes, 12 hand-dug wells, 5 Mayos and 1 point on the Logone River at Yagoua (SE of the study area) were sampled, corresponding to 35 samples in the Quaternary aquifer and 22 in the basement.
The pH meter was calibrated before and during the field campaign using buffer solutions recommended by the manufacturer. During sampling, the physical parameters, including temperature, electrical conductivity (EC), salinity, total dissolved solids (TDS), pH and redox potential, were measured using two Hanna Instruments Waterproof portable EC/TDS/Resistivity/Sanility metres, model HI98192. The water level was measured for the wells using a SEBA piezometric probe. Alkalinity (as HCO3) was determined after each sampling via volumetric titration with a HACH digital titrator (HACH Company, Loveland, CO, USA).

3.2. Chemical and Isotope Tracer Analyses

The samples used for cations (Na+, K+, Mg2+, Ca2+) and anions analyses (HCO3, F, Cl, NO3, SO42−) were filtered directly into 30 mL bottles using a plastic syringe fitted with a 0.45 μm low-adsorption cellulose acetate membrane filter. The bottles containing water for cations analysis were acidified with ultrapure HNO3 to a pH below 2. The other bottle containing non-acidified water was for anion analysis. The samples used for the analysis of water-stable isotopes (18O, 2H), tritium (3H) and carbon 14 (14C) were packaged, respectively, in 10 mL amber glass, 500 mL and 1000 mL polyethylene bottles. They were properly capped and preserved at 4 °C in a cooler container with ice blocks.
The concentrations in major ions (cations and anions), stable isotopes (18O, 2H) and the tritium (3H) of the water samples were analysed at the Radio-Analyses and Environment laboratory (LRAE) of the National Engineering School of Sfax (ENIS: Tunisia). Determination of major ion contents was performed via ion chromatography; ionic balance calculations were within ± 5, respectively.
Water-stable isotope analyses were performed via laser absorption spectroscopy. Ratios of 18O/16O and 2H/1H are expressed in delta values, δ18O and δ2H (‰), respectively, relative to the Vienna Standard Mean Ocean Water (V-SMOW). The analytical precision was better than 0.5‰ for δ2H and 0.2‰ for δ18O. 3H analyses were conducted via electron enrichment and liquid scintillation counting method on 42 samples that were selected based on the depth and the EC. Generally, samples from high depth and with low EC were considered potential ancient groundwater (reflecting a little influence of surface processes). The tritium content is expressed in tritium units (TU) with the analytical uncertainty of the order of 0.3 TU. Based on the results of the tritium analyses, five samples with the lowest concentrations were selected for carbon 14 analysis by Accelerator Mass Spectrometry (AMS) with a relative standard error of 0.3 UT at the Centre for isotope Research of the University of Groningen (The Netherlands).
The complete dataset is provided in Supplementary Material Table S1.
In addition, rainfall samples collected at the N’Djaména station (about 1000 km from Maroua) in Chad from 1965 to 2018 in the framework of the Global Network for Isotope in Precipitation (GNIP) [29] were collected and used for the interpretations.
Deuterium conditioned (d-excess) and line conditioned (LC-excess) calculated in this study are defined as a function of the slope and intercept of the global meteoric water line (GMWL; Craig, 1961) and local meteoric water line ((LMWL); [30]), respectively. The d-excess is defined as follows: d = δ2 H − 8δ18O; and LC-excess: LC-excess = δ2 H a δ18O − b (where “a” and “b” are the coefficients of the LMWL).
The methodology of the Ambient Background Levels (ABL) calculation is based on selecting samples with little or no influence from human activities, for example, by removing those with high nitrate concentrations. In the residual dataset, a value (e.g., the 90th or 95th percentile) is chosen as the representative of the ambient background concentration, which means that all values above this level should be attributed to anthropogenic sources. The upper limit of the ABL can be expressed as a 70th, 90th or 95th percentile of the remaining data range, indicating the appropriate confidence level, using the following procedure: 90th percentile if 10 < N < 30. Similarly, the determination of TVs (threshold values) for groundwater itself has to be based on the ambient background level of a substance and controlled by the reference standards [31]. Due to the widespread use of groundwater as a drinking water resource in the study area, the drinking water standards indicated by the World Health Organization in 2017 were used as reference standards (REF) in the derivation of TVs with the following rules (suggested in the BRIDGE method):
Case 1: ABL < REF: TV = (ABL + REF)/2;
Case 2: ABL > REF: TV = ABL.

4. Results and Discussions

4.1. Groundwater Recharge

4.1.1. Rainfall Input Signal

Stable isotope values of precipitation in N’Djamena for the study period (1995–2018) range from −9.4 to 3.85‰ for δ18O and −53.4 to 38.7‰ for δ2H with the most enriched rainfall in April and the most depleted in August (Figure 7). The weighted average compositions of δ18O (−3.72‰) and δ2H (−44.2‰) were calculated. These observations are in agreement with previous studies [32,33] in neighbouring Nigeria at Kano station (−3.95‰ for δ18O; −20.48‰ for δ2H). The deuterium excess (d = δ2 H − 8δ18O; ([30])) varies from −6.5 (April) to 11.6 (August), with a weighted mean of 5.1‰. Thus, there is a high heterogeneity in precipitation isotopic signal in the region, and therefore, many factors control this temporal variability. The most enriched rainfalls are observed from April to June, when the atmosphere is still relatively dry. This leads to a d-excess < 10‰, which suggests an evaporation effect of raindrops [33]. The most depleted signal is recorded at the core of the rainy season from July to September. This period also corresponds to a d-excess close to or above 10‰ when there is no evaporation effect. It is already possible to hypothesise a preferential recharge period of the aquifer from July to September [34].
The local meteoric water line for N’Djamena rainfall (NMWL) is defined as δ2H = 6.32 (±0.17) δ18O + 4.27 (±0.78) (R = 0.95). The slope and the intercept are lower compared to those from the Global Meteoric Water Line (GMWL): δ2H = 8.17 (±0.06) δ18O + 10.35 (±0.65), confirming the dominance of evaporation in the regional atmosphere dynamics. It is worth noting that the NMWL is close to that recorded at Kano (651 km from Maroua) in Niger (north-west of the Lake Chad basin) also in a Sahelian context: δ2H = 7.02 (±0.43) δ18O + 4.30 (±1.68) (R = 0.90). The similarity in slopes confirms the same conditions of rainfall re-evaporation in the region, while the same intercepts refer to similar conditions in terms of humidity.

4.1.2. Processes during Infiltration and Groundwater Recharge Modes

The isotopic composition of δ18O in groundwater varies from −5.45 to −1.79‰, with an average of −3.88‰ (Figure 8). δ2H values range from −43.16 to −24.04‰, with an average of −7.45‰ and from 0.92 to 9.87‰ for d-excess, with an average of 6.12‰. It can be seen that δ2H and δ18O present lower ranges of values compared to the input function. The low variation in the isotopic range of groundwater compared with rainwater may be linked to selective infiltration of rainfall. This phenomenon has been well described in semi-arid areas [35]. The average δ18O values in the groundwater are close to those of the precipitation in N’Djamena (−3.72‰) and Kano (3.99‰). Thus, we can say that the isotopic signal of the precipitation is preserved during the infiltration. The d-excess values below 10 (Figure 8) show the presence of evaporative phenomena to be considered in the study area during groundwater infiltration. This phenomenon has already been identified in the study area by [10,11] and in other parts of the Sahel region by several authors [8,35,36,37]. The authors found d-excess values in groundwater close to the weighted mean value for the Sahel (5.1 ± 4.2‰) and below 10 [38]. The LC-excess values describe the deviation of the sample from the local meteoric water line [39]. LC-excess values calculated in this study vary from −11.47 to −0.50‰. Negative LC-excess values (above the NMWL) imply isotopic fractionation via evaporation. These results confirm an evaporative trend in groundwater in the Far North of Cameroon similar to those observed by [40] in the region of Maradi in Niger (Northwestern part of the Lake Chad Basin). Nevertheless, the Mayos have a more enriched isotopic composition than rainwater and groundwater. Their content varies from −12.66 to −1.15‰ with an average of −1.87‰ for δ18O and between −2.74 and −20.87‰ with an average of −15.8‰ for δ2H. The mean values of d-excess (−4.68 to −3.76‰ with an average of −0.79‰) and LC-excess (−10.88 to −4.86‰ with an average of –8.21‰) are very low compared to values recorded in groundwater and precipitation. This reflects the strong intensity of evaporation processes in surface water.
Based on the δ18O vs. δ2H diagram (Figure 8), it is possible to discriminate four groups of samples (A, B, C and D). Group A with δ18O values that oscillate between −2.35 and −1.79‰ and between −12.40 and −7.54‰ for δ2H. The average δ18O and δ2H values of this group (which are, respectively, −2.10‰ and −10.03‰) are lower than those of the rain-weighted composition (3.72 O‰ for δ18and −44.2‰ for δ2H). This group, therefore, appears to be the most enriched group of the groundwater. It is located on the NMWL and has d-excess values below 10 (ranging from 7.43 to 6.40‰ with an average of 6.80‰) and LC-excess below 0 (Figure 8). This shows that locally enriched waters from rain have undergone evaporation during its infiltration [41].
The average δ18O and δ2H values in groundwater of group B are −3.66‰ and −23.25‰, respectively; this is close to that of the rainfall-weighted composition. The δ18O in groundwater isotopic composition here ranges from −5.45 to −1.15‰ and between −36.37 and −10.57‰ for δ2H. Such isotopic content is well in agreement with the rain signature. Thus, the isotopic signatures of group B correlated with those of the precipitation show evidence of rapid infiltration due to the presence of an aquifer with favourable permeability. However, the values of d-excess (9.68‰ to −4.68‰ with an average of 6.2‰) and LC-excess (−10.88‰ to −0.62‰ with an average of −4.9‰) show the evaporative character of infiltrated rainwater [30] due to re-evaporation of raindrops.
Group C represents the intermediate group between group B and the most depleted group D. The isotopic composition of δ18O in this group varies from −4.84 to −3.8‰ and −32.05 to −24.44‰. These intermediate isotopic values between groups B and D reflect interconnectivity within the aquifer or mixing processes between old and evaporate components [42]. Group D (sample F12) has a δ18O value of −5.69‰ and a δ2H value of −43.16‰; it is thus the most depleted group. Such an isotopic signature reflects a different origin from the current recharge by modern rainfall and tends to indicate the existence of old recharge within the aquifer [8,12,41].
The δ18O vs. δ2H diagram also provides information on groundwater recharge modes. In the present study, the recharge of group A is a focus type because their EC and oxygen−18 content are within the same range as surface water. Focus recharge takes place from ephemeral or perennial surface water via the concentration of rainfall and runoff processes and resulting infiltration at specific locations on the landscape [43] (Figure 8). Group B has a diffuse type of recharge as it corresponds to a recharge of precipitation water occurring in the form of direct infiltration, followed by fast percolation to shallow groundwater [43]. The rapid infiltration phenomenon of precipitation is in good agreement with the geomorphology as the samples here are more located in the piedmont domain close to the recharge zone. Finally, groups A and B can, therefore, be identified as recent recharge, while group C corresponds to a mixing between groups B and D fostered using the multi-layered structure of the Quaternary aquifer.

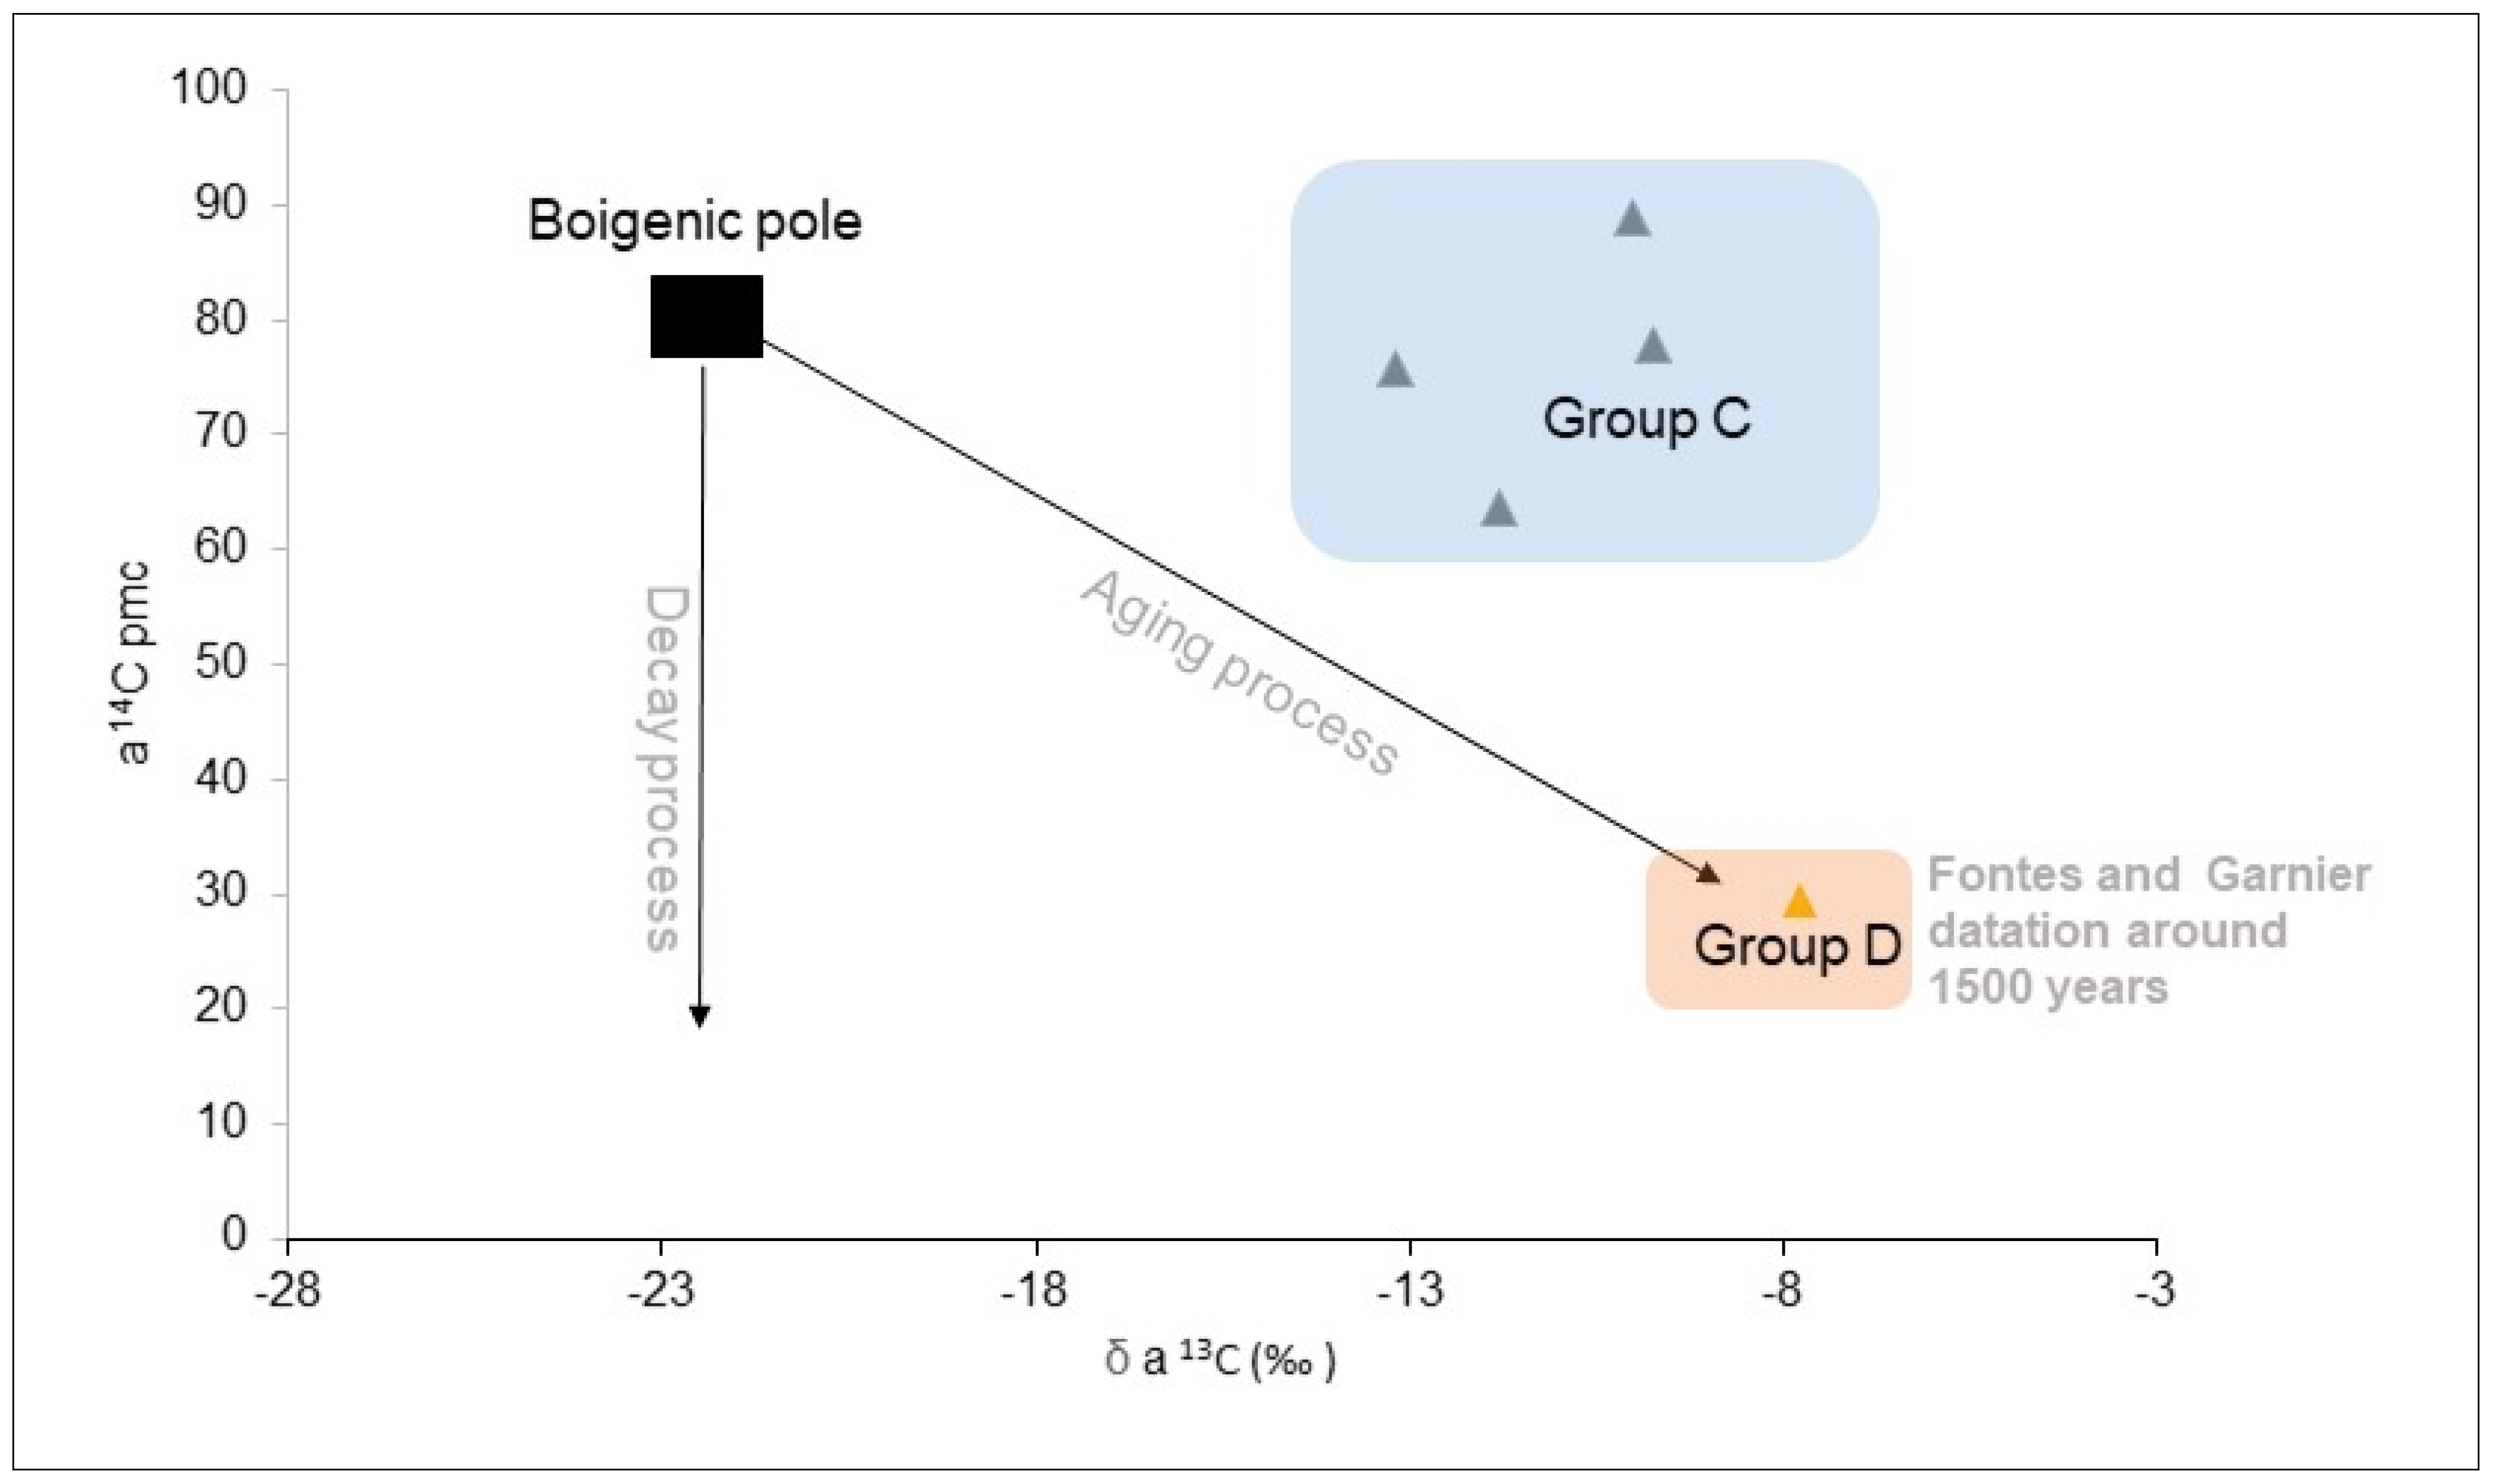
4.2. Delineation of Groundwater Flow Paths

The analysis of Table 2, which shows the variations in the EC of the water in the study area, suggests a wide heterogeneity in the chemical composition between the different aquifers identified. The highest EC are observed in group A; their content varies from 468 to 3726 µS/cm with an average of 1600 µS/cm and a median value of 1119 µS/cm. Group A shows high values of nitrate (mean of 368.9 mg/L and median of 178.5 mg/L), sodium (mean of 94.7 mg/L and median of 63.7 mg/L) and chloride (mean of 119.3 mg/L and median of 51.6 mg/L), which generally reflect the influence of human activities [6]. The shallow depths (less than 19 m) of the sampling and the evaporative character of the water and the high values in nitrates and EC in this group compared to the other groups indicate a superficial character of the groundwater [11,33]. Group A represents the shallower flow path of the aquifer system and is the most vulnerable to climate variability (evaporation) and groundwater chemistry. However, this groundwater has a tritium content between 3.6 and 6.1 TU (Figure 9), close to that of local modern rainfall content (3.8 to 5.4 TU; [37]) showing high connectivity with atmospheric conditions [44]. The δ18O isotopic signature of this group (−2.35‰ and −1.79‰) is close to that of evaporated surface water (from the mayos) (−2.74‰ and −1.15‰), indicating an inter-connectivity between groundwater and surface water. In summary, group A is of recent origin (tritium values close to those of precipitation) and has an evaporated isotopic signature (close to that of surface water) with a strong signature of anthropogenic pollution.
Group B presents EC varying from 149 to 4769 µS/cm, with a wide difference between the value of the mean (602 µs/cm) and the median (248 µs/cm). This high heterogeneity reflects the control of several factors on EC. These mean and median values are considerably lower compared to those recorded in group A. This is the same case when looking at the mean and median values of major ions: 74 mg/L and 0 mg/L for nitrate; 40 mg/L and 14 mg/L for sodium and 16 and 2 mg/L for chloride. Here, it is clear that the signature of human activities on groundwater is less dominant. This may certainly be due to the rapid infiltration of rainwater towards the saturated zone. It is also worth noting that group B waters have tritium contents of the same order as group A, i.e., from 1.2 to 6.1 TU (Figure 9), indicating a recent rainfall recharge of groundwater.
Group C has EC values between 328 and 757 µS/cm with an average of 519 µS/cm and a median of 473 µS/cm. This group shows low nitrate concentrations compared to the others with an average of 22 mg/L and a median of 10 mg/L. This geochemical signature is more related to natural water-rock interaction processes with only a little anthropogenic fingerprint [6,42,45]. The tritium content of this group varies from 0.4 to 4.5 TU with an average of 1.9 TU (Figure 9) and a depleted δ18O signature compared to that of precipitation (Figure 6). Carbon-14 activities for this group (Figure 10), with tritium values below 1 (f17, f40 and f49), are too high for accurate groundwater age estimations but tend to indicate apparent residence time ranging from a few decades to a few centuries [46]. These waters are a mixture of recent and old groundwaters. Group C represents an intermediate groundwater flow path of the aquifer system more protected from surface contamination.
Group D consists of borehole F12, with an EC of 426 µS/cm with low values for nitrate (6.2 mg/L), sodium (33.65 mg/L), chlorine (19 mg/L) and sulphate (14.3 mg/L). This point is the most isotopically depleted sample (δ18O is equal to −5.69‰), with a very low tritium content (less than 1 TU). Carbon-14 dating via the [46] correction model indicates that it appears to be the oldest groundwater (Figure 10) in our system, with a residence time close to 1400 years BP. It represents the most strategic resource in our aquifer system because it is not vulnerable to surface contamination and is less susceptible to evaporation than the other groups due to its depth of about 60 m.
In summary, the results of the current chemical and isotopic analysis indicate that we have three flow paths within the Quaternary aquifer: shallow (group A and B), intermediate (group C) and deep (group D). The aquifer shows many recharge periods.
The Piper diagram is an essential hydrochemical tool not only to identify chemical processes but also to highlight the distribution of major ions. The average composition of the groundwater displayed on the cations diagram (Figure 11) shows an abundance of calcium and magnesium in the different groups identified (A, B, C and D). On the other hand, the ternary diagram of the anions shows a dominance of nitrate for group A, and bicarbonate for groups B, C and D. The projection of these points on the Piper diagram indicates that groups A and B are, respectively, of Ca-Mg-SO4-Cl and Ca-Mg-HCO3 types. Groups C and D are very similar with the same water type of Ca-Mg-HCO3. This is the result of an interaction between the shallow water and the deep layers of the aquifer. A similarity of water types between the oldest group D and group C shows groundwater mixing, and it is in favour of the existence of a deep hydrogeological system where individual groundwater flow paths are difficult to delineate. Figure 11 also highlights a high mineralisation for shallow paths (groups A and B) and a lower one for intermediate to deep flow paths.
In addition, the Gibbs diagram [47] allows us to highlight the different natural hydrochemical processes that affect groundwater. The main processes controlling water chemistry in the world are atmospheric precipitation, water–rock interaction and evaporation. The discrimination of these processes on the basis of their chemical composition is achievable in Figure 12 [13,47]. Figure 12 shows that 91% (n = 58) of the samples (Group A, B; C and D) have a cationic ratio (Na+ + K+)/(Na+ + K+ + Ca2+) that varies from 0.20 to 0.74 with an average of 0.48 and a TDS between 100 and 1000 mg/L). The rest of the samples (group A) present a TDS > 1000 mg/L, which indicates a dominance of the evaporative processes. Thus, the Gibbs diagram confirms that the samples affected by evaporation are mainly those of group A, whereas the groundwater of groups C and D (intermediate and deep water) are exclusively affected by rock dissolution processes and constitute the deep groundwater of the system.

4.3. Ambient Background Levels (ABL) and Threshold Values (TV)

The ABL is defined as a concentration of a substance in a particular environment that indicates the minimal influence of anthropogenic sources [48]. The term ‘Natural Background Level’ is sometimes preferred to ABL. However, given the punctual character (a single sampling campaign) of this study, the term ABL is more appropriate. Many methods are used for the determination of this value such as hydrochemical simulation of solution in aquifers [49], screening component separation, probability diagram and other statistical methods. Among this set of methods, the BRIDGE method was used in this work because it is simple and can easily be used by non-experts in hydrogeochemical modelling or statistical procedures [31]. The results from the selection method, integrated with a robust hydrogeochemical model, appear to provide a rough but robust estimate of ABL. This can be confirmed, for instance, in the analysis of cumulative probability plots [50].
The chemical status of the groundwater was assessed by comparing the dataset with the ABL and the resulting TV. The results presented in Table 3 show that a higher percentage of samples from the shallow groundwater have concentrations of chemical elements above the ABL than those from the deep groundwater. This can be explained by the fact that shallow groundwater is more sensitive to anthropogenic influences. Similarly, the shallow groundwater has higher TV than the deep groundwater.
Furthermore, Table 3 shows that the ABL of nitrate corresponds to 8.2 mg/L, close to the value of 7.2 mg/L observed by [51] in the porous aquifer in a semi-arid environment in India and a little higher than that obtained by [13] in the urban surface aquifer of Douala in Cameroon with 6.6 mg/L in a humid coastal climate. In addition, 44.6% and 35.6% of shallow groundwater (group A et B) samples have nitrate values above the ABL and TV, respectively, while 25.1% and 14.2% of deep groundwater (group C et D) samples have nitrate values above the ABL and TV, respectively. This indicates that the pollution of the aquifer is certainly not limited to the surface groundwater but is gradually spreading to the deep groundwater resource. This observation highlights a potential future threat to the groundwater quality of the deep aquifer.

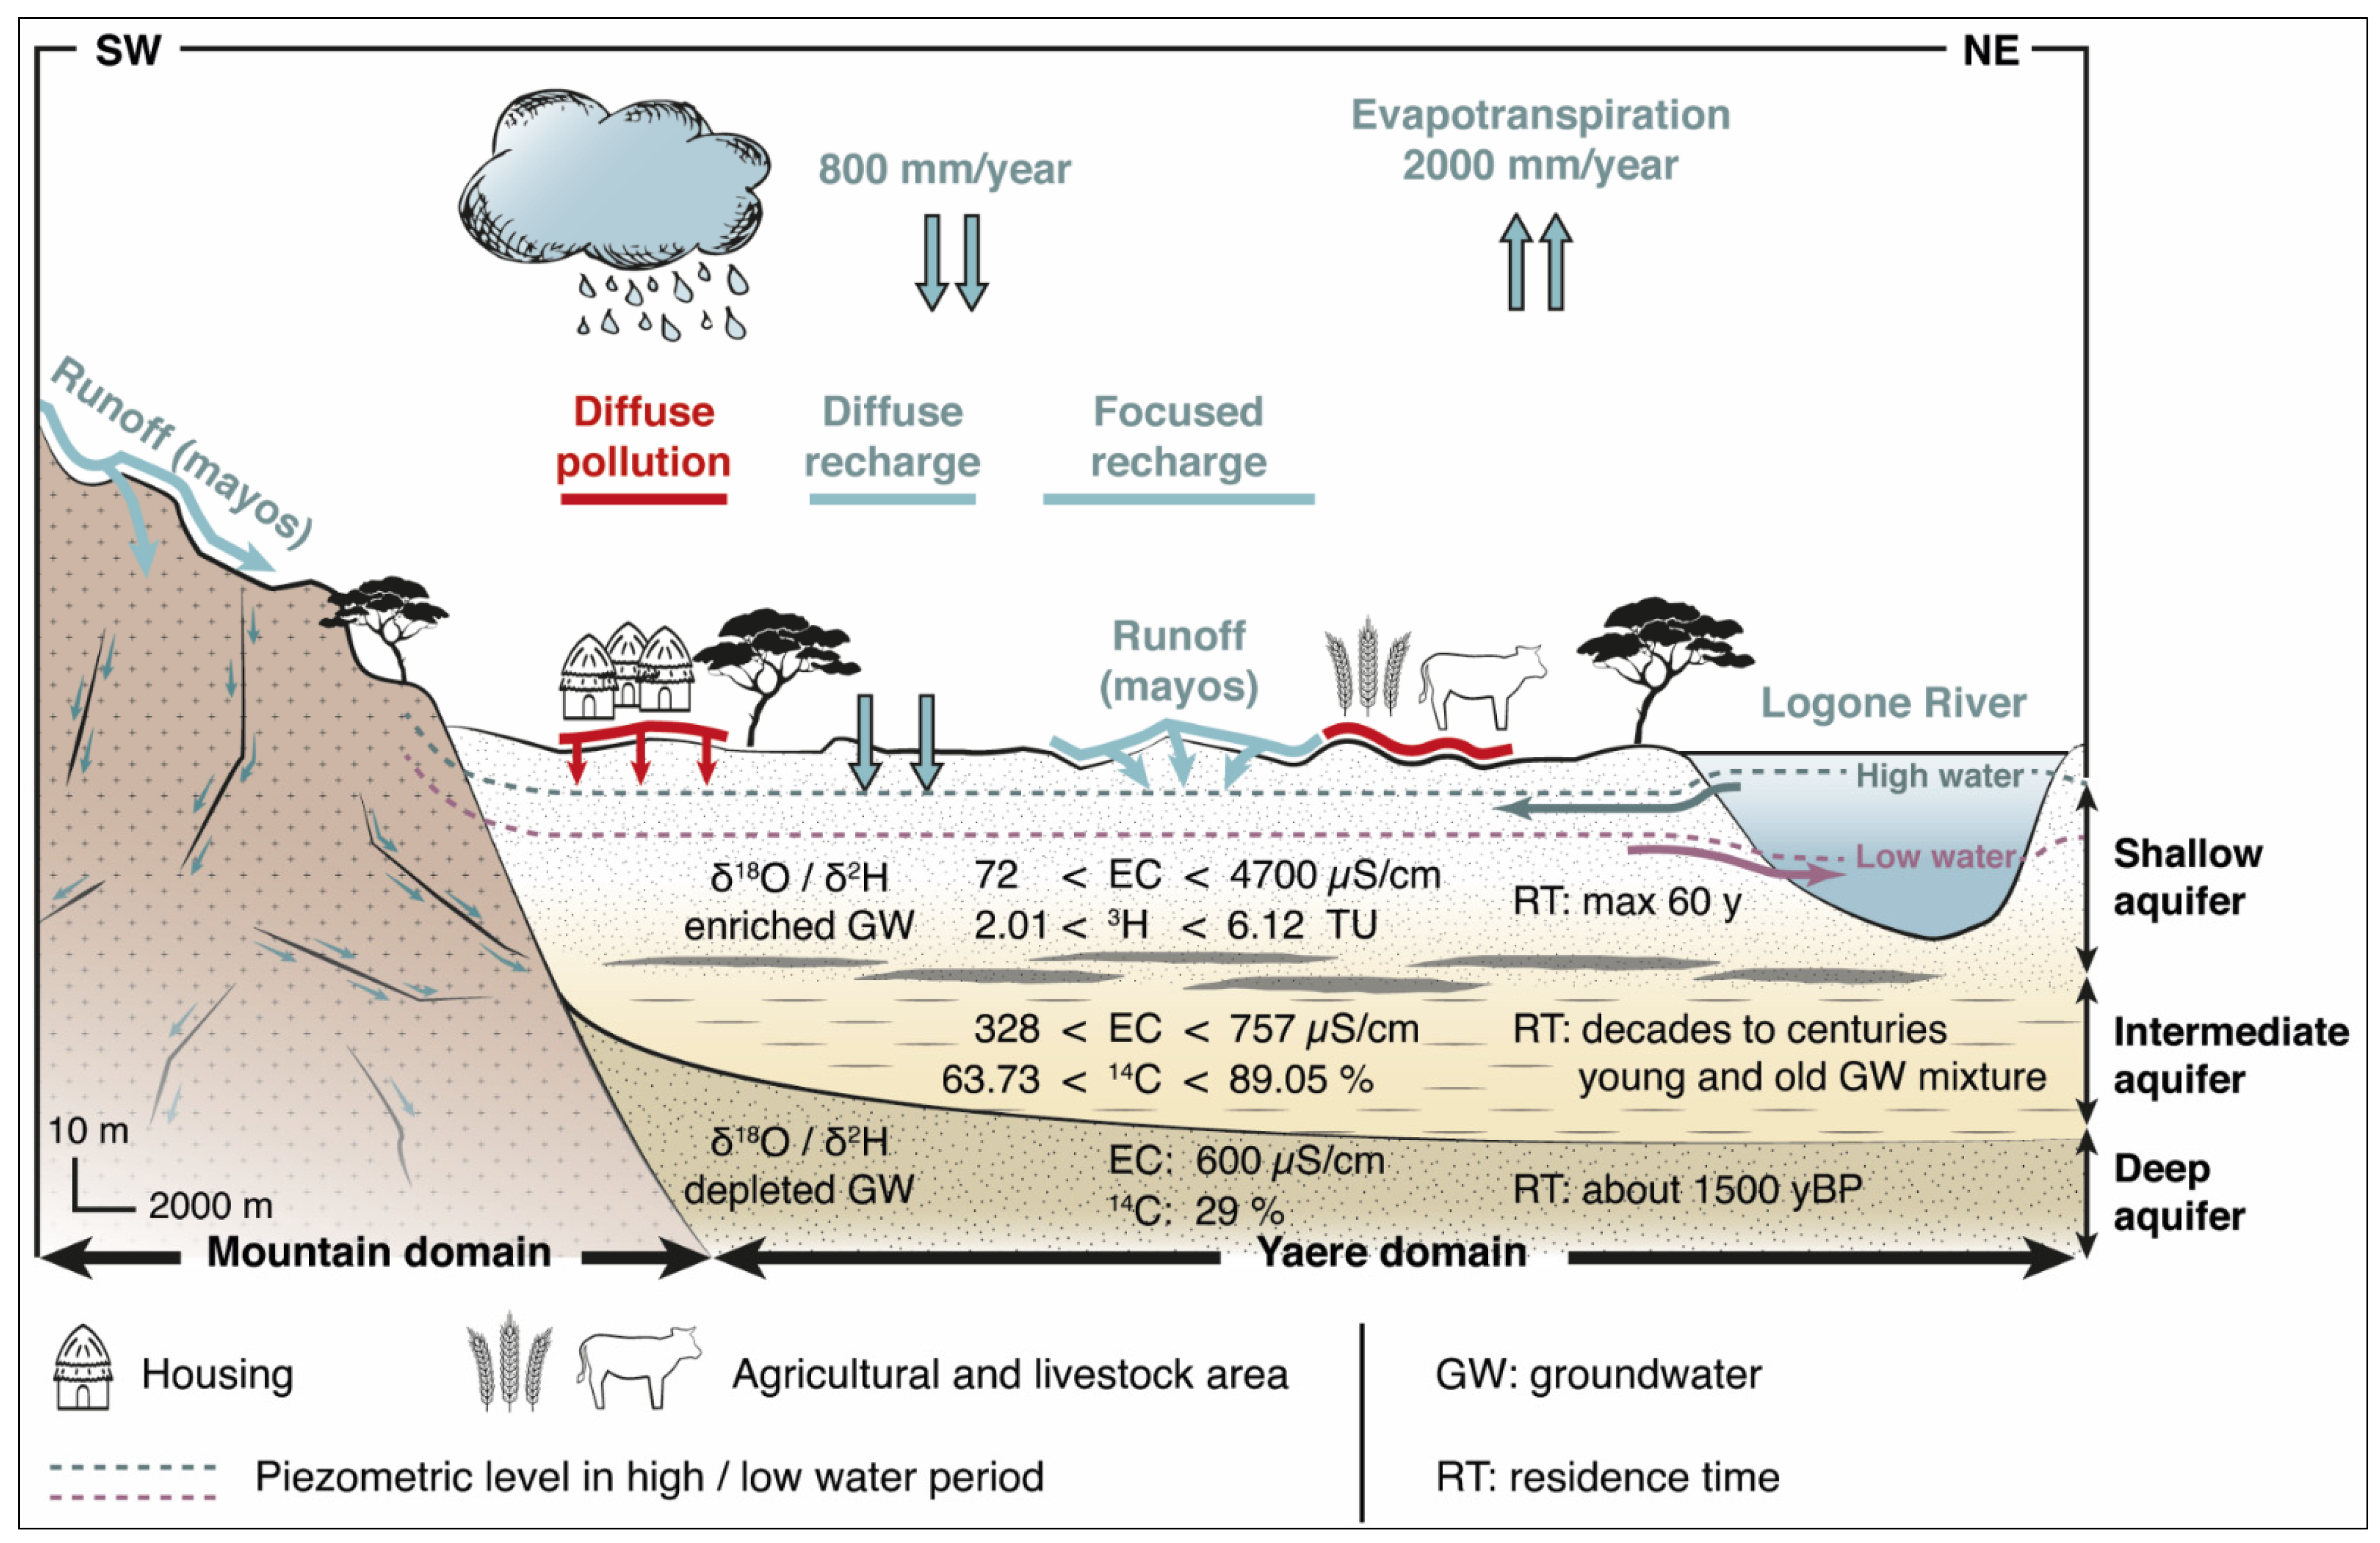
4.4. Conceptual Scheme of the Southern Lake Chad Quaternary Aquifer Functioning and Recommendations for Management Strategies

Knowledge of the general structure and functioning of the Quaternary aquifer in terms of recharge, flow patterns and groundwater chemistry is necessary to address the issue of groundwater resource management [3,37]. The Quaternary aquifer is recharged via both rainfall and Mayos water infiltration (which occurs mostly between July and September), highlighting diffuse and focus recharge mechanisms. Three aquifer levels were identified, including shallow, intermediate and deep systems. The shallow system is strongly influenced by seasonal climate variations. The enriched stable isotopes signature (−2.35‰ < δ18O < −1.79‰) and high tritium contents (2.01 TU < 3H < 6.18 TU) indicate recent recharge by evaporated rainwater and river waters. The very heterogeneous character of the hydrochemistry (71 µS/cm < EC < 4700 µS/cm) of the shallow groundwater is evidence of both geogenic and anthropogenic influences. The intermediate system reflects dynamic mixing processes between modern and older groundwaters. Similarly, the hydrochemical content shows little human influence compared to the shallow aquifer [52]. The deep system shows a more ancient recharge supported by low values in 3H and 14C activities. Therefore, it is clear that the Quaternary aquifer contains, at its deepest levels, old groundwater resources that unfortunately already show premises of active pollution, as highlighted in the calculation of the ABL and TV.
The conceptual scheme of the hydrogeology of the region (Figure 13) sums up all the previous information gathered from the investigations. It also shows that the amount of rain that falls is less important than evapotranspiration, which leads to a low recharge rate of the aquifer and is also strictly limited to the rainy season and mayo flow period [52]. This figure also shows the complex relationships between the Quaternary aquifer and the surface water drainage network (Mayos and the Logone River). During the flooding period, the rivers tend to provide the aquifer with recharge waters, and during the dry period, the Quaternary aquifer supplies groundwater to the river system.
In light of this work and in order to protect the groundwater resource, it is important to implement appropriate water management strategies in this region [53]. One strategy is to limit groundwater contamination. Any activity that could contaminate the groundwater should be prohibited, and water resources managers should promote the establishment of adequate protection areas around water catchment zones [12]. Improved knowledge of the residence time and hydrochemistry of the groundwater water would provide information on recharge timing [54] and could help the design of appropriate safety distances between potential pollution sources and groundwater pumping places. Furthermore, for the safety and sustainability of groundwater use, a better legal framework needs to be established now for groundwater abstraction, particularly for the construction of boreholes, in order to control more effectively the exploitation of the deepest part of the aquifer, as it contains relatively old and good quality water. Paleogroundwater identified must be considered as a strategic resource as it cannot be considered renewable. Therefore, the extraction of this type of water must be planned and reserved for the public drinking water supply only. In addition, multilevel screened wells should be prohibited to avoid mixing between the different flow paths within the Quaternary aquifer. In addition, the local community through a decentralisation of water services, should be responsible for the proper maintenance of the area around the water points (boreholes, wells) [14] and should, in particular, avoid the building of pit latrines in their vicinity as well as the presence of cattle-watering practices.

5. Conclusions

Groundwater is of major importance to ensure both domestic and agricultural water supply in the Sahel region. Yet, there are widespread indications of groundwater degradation caused by insufficient pollution control. This study used a combination of geochemical and isotopic tools to describe the functioning of an intensively exploited aquifer in the Southern Lake Chad region. The major challenge was to propose a conceptual model of the aquifer in order to provide keys for the more sustainable management of the resource. The isotope methods proved to be effective in estimating the groundwater recharge mode and in studying the processes affecting the transfer of rainwater to the surface and deep aquifer. The method also showed that recharge in this Sahelian environment is by modern rainfall and evaporated surface water and that palaeo-groundwater could be present in the deep flow path. The hydrochemical data underlined the extent to which the groundwater resources are threatened by anthropogenic activities in the shallow aquifer, which are progressively extending their negative influence towards the deep aquifer. Thus, the collected information added to the determination of ABL and TV is an asset for proposing groundwater management recommendations for the Sahel and in particular for Far North Cameroon. Furthermore, these results provide useful information for the establishment of a new water supply scheme taking into account the current global changes in the sub-Saharan Africa context.

Supplementary Materials

The following supporting information can be downloaded at: https://www.mdpi.com/article/10.3390/resources12120138/s1, Table S1: Major ions chemistry and water molecule stable isotopes in groundwater and surface waters of the far-north Cameroon.

Author Contributions

Conceptualisation, F.S., B.N., S.N.B.-N. and F.H.; Data curation, F.S. and T.L.; Formal analysis, F.S.; Investigation, F.S., B.N. and S.N.B.-N.; Methodology, F.S., B.N., S.N.B.-N. and F.H.; Resources, F.H.; Software, F.S., B.N. and B.D.; Supervision, S.N.B.-N., F.H., G.N.N., E.G., M.-J.N.-N. and J.E.; Validation, F.S., S.N.B.-N., F.H., E.G. and T.L.; Writing—original draft, F.S.; Writing—review and editing, F.S., B.N., S.N.B.-N., F.H., G.N.N., E.G., T.L., H.C., B.D., M.-J.N.-N. and J.E. All authors have read and agreed to the published version of the manuscript.

Funding

This research is funded by the International Atomic Energy Agency (IAEA).

Data Availability Statement

The authors declare that the data supporting the findings of this study will be made available upon request.

Acknowledgments

The PhD program of Fricelle Song was supported by the International Atomic Energy Agency (IAEA) within the framework of project RAF 7019.

Conflicts of Interest

The authors declare no conflict of interest.

References

  1. United Nations. The Sahel: One Region, Many Crises. Africa Renewal. 2013. Available online: https://www.un.org/africarenewal/magazine/december-2013/sahel-one-region-many-crises (accessed on 15 August 2023).
  2. Gbohoui, Y.P.; Paturel, J.-E.; Tazen, F.; Mounirou, L.A.; Yonaba, R.; Karambiri, H.; Yacouba, H. Impacts of climate and environmental changes on water resources: A multi-scale study based on Nakanbé nested watersheds in West African Sahel. J. Hydrol. Reg. Stud. 2021, 35, 100828. [Google Scholar] [CrossRef]
  3. TC Lake Chad Basin: Groundwater Management. Available online: https://www.bgr.bund.de/EN/Themen/Wasser/Projekte/laufend/TZ/Tschad/tschad-II_fb_en.html (accessed on 23 April 2021).
  4. Jones, P.D.; Hulme, M. Calculating Regional Climatic Time Series for Temperature and Precipitation: Methods and Illustrations. Int. J. Climatol. 1996, 16, 361–377. [Google Scholar] [CrossRef]
  5. Hulme, M.; Doherty, R.; Ngara, T.; New, M.; Lister, D. African climate change: 1900–2100. Clim. Res. 2001, 17, 145–168. [Google Scholar] [CrossRef]
  6. Bello, M.; Ketchemen-Tandia, B.; Nlend, B.; Huneau, F.; Fouepe, A.; Fantong, W.Y.; Ngo Boum-Nkot, S.; Garel, E.; Celle-Jeanton, H. Shallow Groundwater Quality Evolution after 20 Years of Exploitation in the Southern Lake Chad: Hydrochemistry and Stable Isotopes Survey in the Far North of Cameroon. Environ. Earth Sci. 2019, 78, 474. [Google Scholar] [CrossRef]
  7. Bon, A.F.; Abderamane, H.; Ewodo Mboudou, G.; Aoudou Doua, S.; Banakeng, L.A.; Bontsong Boyomo, S.B.; Piih, S.L.; Wangbara Damo, B. Parametrization of Groundwater Quality of the Quaternary Aquifer in N’Djamena (Chad), Lake Chad Basin: Application of Numerical and Multivariate Analyses. Environ. Sci. Pollut. Res. 2021, 28, 12300–12320. [Google Scholar] [CrossRef]
  8. Mahamat Nour, A.; Vallet-Coulomb, C.; Gonçalves, J.; Sylvestre, F.; Deschamps, P. Rainfall-Discharge Relationship and Water Balance over the Past 60 Years within the Chari-Logone Sub-Basins, Lake Chad Basin. J. Hydrol. Reg. Stud. 2021, 35, 100824. [Google Scholar] [CrossRef]
  9. Seignobos, C. Répartition et Densités de La Population. In Atlas de la Province Extrême-Nord Cameroun; Iyébi-Mandjek, O., Ed.; Atlas et Cartes; IRD Éditions: Marseille, France, 2017; pp. 61–63. [Google Scholar]
  10. Ketchmen, B. Etude Hydrogéologie du Grand Yaéré (Extrême Nord du Cameroun). Synthèse Hydrogéologique et Étude de la Recharge par les Isotopes de l’Environnement. Ph.D. Thesis, University de Dakar, Dakar, Sénégal, 1992. [Google Scholar]
  11. Ngounou Ngatcha, B. Hydrogéologie d’Aquifères Complexes en Zone Semi-Aride: Les Aquifères Quaternaires du Grand Yaéré (Nord Cameroun). Ph.D. Thesis, Université de Grenoble, Saint-Martin-d’Hères, France, 1993. [Google Scholar]
  12. Huneau, F.; Dakoure, D.; Celle-Jeanton, H.; Vitvar, T.; Ito, M.; Traore, S.; Compaore, N.F.; Jirakova, H.; Le Coustumer, P. Flow Pattern and Residence Time of Groundwater within the South-Eastern Taoudeni Sedimentary Basin (Burkina Faso, Mali). J. Hydrol. 2011, 409, 423–439. [Google Scholar] [CrossRef]
  13. Nlend, B.; Celle-Jeanton, H.; Huneau, F.; Garel, E.; Ngo Boum-Nkot, S.; Etame, J. Shallow urban aquifers under hyper-recharge equatorial conditions and strong anthropogenic constrains. Implications in terms of groundwater resources potential and integrated water resources management strategies. Sci. Total Environ. 2020, 757, 143887. [Google Scholar] [CrossRef]
  14. IUCN. Le Bassin du Tchad, une Source de vie Pour l’homme, la Nature et la Paix. 2019. Available online: https://www.iucn.org/fr/news/eau/201910/le-bassin-du-tchad-une-source-de-vie-pour-lhomme-la-nature-et-la-paix (accessed on 18 January 2022).
  15. FAO (Food and Agricultural Organisation). Gestion des Inondations Dans la Région de l’Extrême-Nord au Cameroun: Les Riverains N’ont Plus Peur Des Pluies Diluviennes Depuis Que la Digue du Logone et le Barrage de Maga Ont Été Réhabilités, Projet. 2020. Available online: https://www.banquemondiale.org/fr/results/2020/11/10/flood-management-in-the-far-north-of-cameroon (accessed on 18 October 2023).
  16. Sultan, B.; Janicot, S. Abrupt Shift of the ITCZ over West Africa and Intra-Seasonal Variability. Geophys. Res. Lett. 2000, 27, 3353–3356. [Google Scholar] [CrossRef]
  17. DNM (Direction de la Météorologie Nationale). Données Pluviométriques des Stations de 1965–2005; DNM: Yaounde, Cameroon, 2009.
  18. L’Hôte, Y.; Mahé, G. Afrique de l’Ouest et Centrale: Précipitations Moyennes Annuelles (Période 1951–1989); Carte à l’échelle 1/6,000,000, 90 × 60 cm; Orstom: Paris, France, 1996. [Google Scholar]
  19. Nouaceur, Z. La reprise des pluies et la recrudescence des inondations en Afrique de l’Ouest sahélienne. Physio-Géo Géogr. Phys. Environ. 2020, 15, 89–109. [Google Scholar] [CrossRef]
  20. Mahamat Nour, A. Fonctionnement Hydrologique, Chimique et Isotopique du Principal Affluent du Lac Tchad: Le Système Chari-Logone. Ph.D. Thesis, Université Aix-Marseille, Marseille, France, 2019. Available online: http://www.theses.fr/2019AIXM0196 (accessed on 5 July 2021).
  21. DHATchad (Direction de l’Hydraulique et de l’Assainissement). Données Des débits à la Station de Yagoua de 1961–2013; DHATchad: Ndjamena, Chad, 2013.
  22. Bessoles, B.; Lasserre, M. Le complexe de base du Cameroun. Bull. Soc. Géol. Fr. 1977, S7-XIX, 1085–1092. [Google Scholar] [CrossRef]
  23. Dietrich, F.; Diaz, N.; Deschamps, P.; Ngounou Ngatcha, B.; Sebag, D.; Verrecchia, E.P. Origin of Calcium in Pedogenic Carbonate Nodules from Silicate Watersheds in the Far North Region of Cameroon: Respective Contribution of in Situ Weathering Source and Dust Input. Chem. Geol. 2017, 460, 54–69. [Google Scholar] [CrossRef]
  24. Schneider, J.-L.; Wolf, J.P. Carte Géologique et Hydrogéologique de 1/500 000 de la Republique du Tchad, Mémoire Explicatif; BRGM: Paris, France, 1992; p. 531. Available online: https://www.worldcat.org/title/carte-geologique-et-cartes-hydrogeologiques-a-11-500-000-de-la-republique-du-tchad-memoire-explicatif/oclc/26094222/ (accessed on 15 September 2023).
  25. Bouchez, C. Bilan et Dynamique Des Interactions Rivières-Lac(s)-Aquifères Dans le Bassin Hydrologique du Lac Tchad. Ph.D. Thesis, Aix Marseille Université, Marseille, France, 2015. Available online: https://hal.archives-ouvertes.fr/tel-01298153 (accessed on 21 April 2021).
  26. Pias, J. Les Formations Sédimentaires Tertiaires et Quaternaires de la Cuvette Tchadienne et Les Sols Qui en Dérivent; Mémoires ORSTOM; ORSTOM: Paris, France, 1970; p. 411. [Google Scholar]
  27. Ewodo Mboudou, G.; Bon, A.; Bineli, E.; Ntep, F.; Ombolo, A. Caracterisation de la Productivite des Aquiferes du Socle de la Region de l’extreme Nord, Cameroun. J. Cameroon Acad. Sci. 2018, 14, 25. [Google Scholar] [CrossRef]
  28. Tillement, B. Hydrogéologie du Nord-Cameroun. Ph.D. Thesis, Université Claude Bernard, Lyon, France, 1971. [Google Scholar]
  29. IAEA/WMO. Global Network of Isotopes in Precipitation. The GNIP Database. 2018. Available online: https://nucleus.iaea.org/wiser (accessed on 18 October 2018).
  30. Dansgaard, W. Stable isotopes in precipitation. Tellus 1964, 16, 436–468. [Google Scholar] [CrossRef]
  31. Muller, D.; Blum, A.; Hookey, J.; Kunkei, R.; Scheidieder, A.; Tomlin, C.; Wendland, F. Final Proposal of a Methodology to Set Up Groundwater Threshold Values in Europe. Specific Targeted EU Research Project BRIDGE. J. Environ. Manag. 2009, 90, 1523. [Google Scholar]
  32. Gourcy, L.; Aranyossy, J.-F.; Olivry, J.-C.; Zuppi, G.M. Évolution spatio-temporelle des teneurs isotopiques (δ2H–δ18O) des eaux de la cuvette lacustre du fleuve Niger (Mali). Comptes Rendus l’Académie Sci.-Ser. IIA-Earth Planet. Sci. 2000, 331, 701–707. [Google Scholar] [CrossRef]
  33. Goni, I.; Fellman, E.; Edmunds, W. Rainfall Geochemistry in the Sahel Region of Northern Nigeria. Atmos. Environ. 2001, 35, 4331–4339. [Google Scholar] [CrossRef]
  34. Abderamane, H. Étude du Fonctionnement Hydrogéochimique du Système Aquifère du Chari Baguirmi (République du Tchad). Ph.D. Thesis, Université de Poitiers, Paris, France, 2012. [Google Scholar]
  35. Goni, I.B.; Taylor, R.G.; Favreau, G.; Shamsudduha, M.; Nazoumou, Y.; Nhatcha, B.N. Groundwater recharge from heavy rainfall in the southwestern Lake Chad Basin: Evidence from isotopic observations. Hydrol. Sci. J. 2021, 66, 1359–1371. [Google Scholar] [CrossRef]
  36. Allies, A.; Demarty, J.; Olioso, A.; Bouzou Moussa, I.; Issoufou, H.B.-A.; Velluet, C.; Bahir, M.; Maïnassara, I.; Oï, M.; Chazarin, J.-P.; et al. Evapotranspiration Estimation in the Sahel Using a New Ensemble-Contextual Method. Remote Sens. 2020, 12, 380. [Google Scholar] [CrossRef]
  37. Mahamat-Nour, A.; Huneau, F.; Mahamat, A.; Mahamat Saleh, H.; Ngo Boum-Nkot, S.; Nlend, B.; Djebebe-Ndjiguim, C.-L.; Foto, E.; Sanoussi, R.; Araguas-Araguas, L.; et al. Shallow Quaternary groundwater in the Lake Chad basin is resilient to climate change but requires sustainable management strategy: Results of isotopic investigation. Sci. Total Environ. 2022, 851, 158152. [Google Scholar] [CrossRef]
  38. Leduc, C.; Favreau, G.; Schroeter, P. Long-Term Rise in a Sahelian Water-Table: The Continental Terminal in South-West Niger. J. Hydrol. 2001, 243, 43–54. [Google Scholar] [CrossRef]
  39. Landwehr, J.; Coplen, T.B. Line-Conditioned Excess: A New Method for Characterizing Stable Hydrogen and Oxygen Isotope Ratios in Hydrologic Systems. In Proceedings of the International Conference on Isotopes in Environmental Studies, Vienna, Austria, 25–29 October 2006; pp. 132–135. [Google Scholar]
  40. Yahouza, L.; Issoufou, S.; Abdou Babaye, M.S.; Métral, B.; Ousmane, B. Contribution of Stable Isotopes of Water (18O and 2H) to the Characterization of Goulbi N’kaba Valley Aquifer, Region of Maradi in the Republic of Niger. Int. J. Hydrol. 2018, 2, 560–565. [Google Scholar] [CrossRef]
  41. Clark, I.; Fritz, P. Environmental Isotopes in Hydrogeology Lewis; CRC Press: Boca Raton, FL, USA, 1997. [Google Scholar] [CrossRef]
  42. Modibo Sidibé, A.; Lin, X.; Koné, S. Assessing Groundwater Mineralization Process, Quality, and Isotopic Recharge Origin in the Sahel Region in Africa. Water 2019, 11, 789. [Google Scholar] [CrossRef]
  43. Santoni, S.; Garel, E.; Gillon, M.; Marc, V.; Miller, J.; Babic, M.; Simler, R.; Travi, Y.; Leblanc, M.; Huneau, F. Assessing the Hydrogeological Resilience of a Groundwater-Dependent Mediterranean Peatland: Impact of Global Change and Role of Water Management Strategies. Sci. Total Environ. 2021, 768, 144721. [Google Scholar] [CrossRef]
  44. Mahlangu, S.; Lorentz, S.; Diamond, R.; Dippenaar, M. Surface Water-Groundwater Interaction Using Tritium and Stable Water Isotopes: A Case Study of Middelburg, South Africa. J. Afr. Earth Sci. 2020, 171, 103886. [Google Scholar] [CrossRef]
  45. Djebebe-Ndjiguim, C.-L. Définition du Potentiel Aquifère du Sous-Sol de la Région de Bangui (République Centrafricaine) à l’Aide d’Outils Géochimiques et Isotopiques. Aide à La Mise En Oeuvre d’un Plan de Diversification Des Ressources En Eau Potable à Partir Des Eaux Souterraines. Ph.D. Thesis, Corte, France, 12 December 2014. Available online: http://www.theses.fr/2014CORT0013 (accessed on 14 July 2022).
  46. Fontes, J.-C.; Garnier, J.-M. Determination of the Initial 14C Activity of the Total Dissolved Carbon: A Review of the Existing Models and a New Approach. Water Resour. Res. 1979, 15, 399–413. [Google Scholar] [CrossRef]
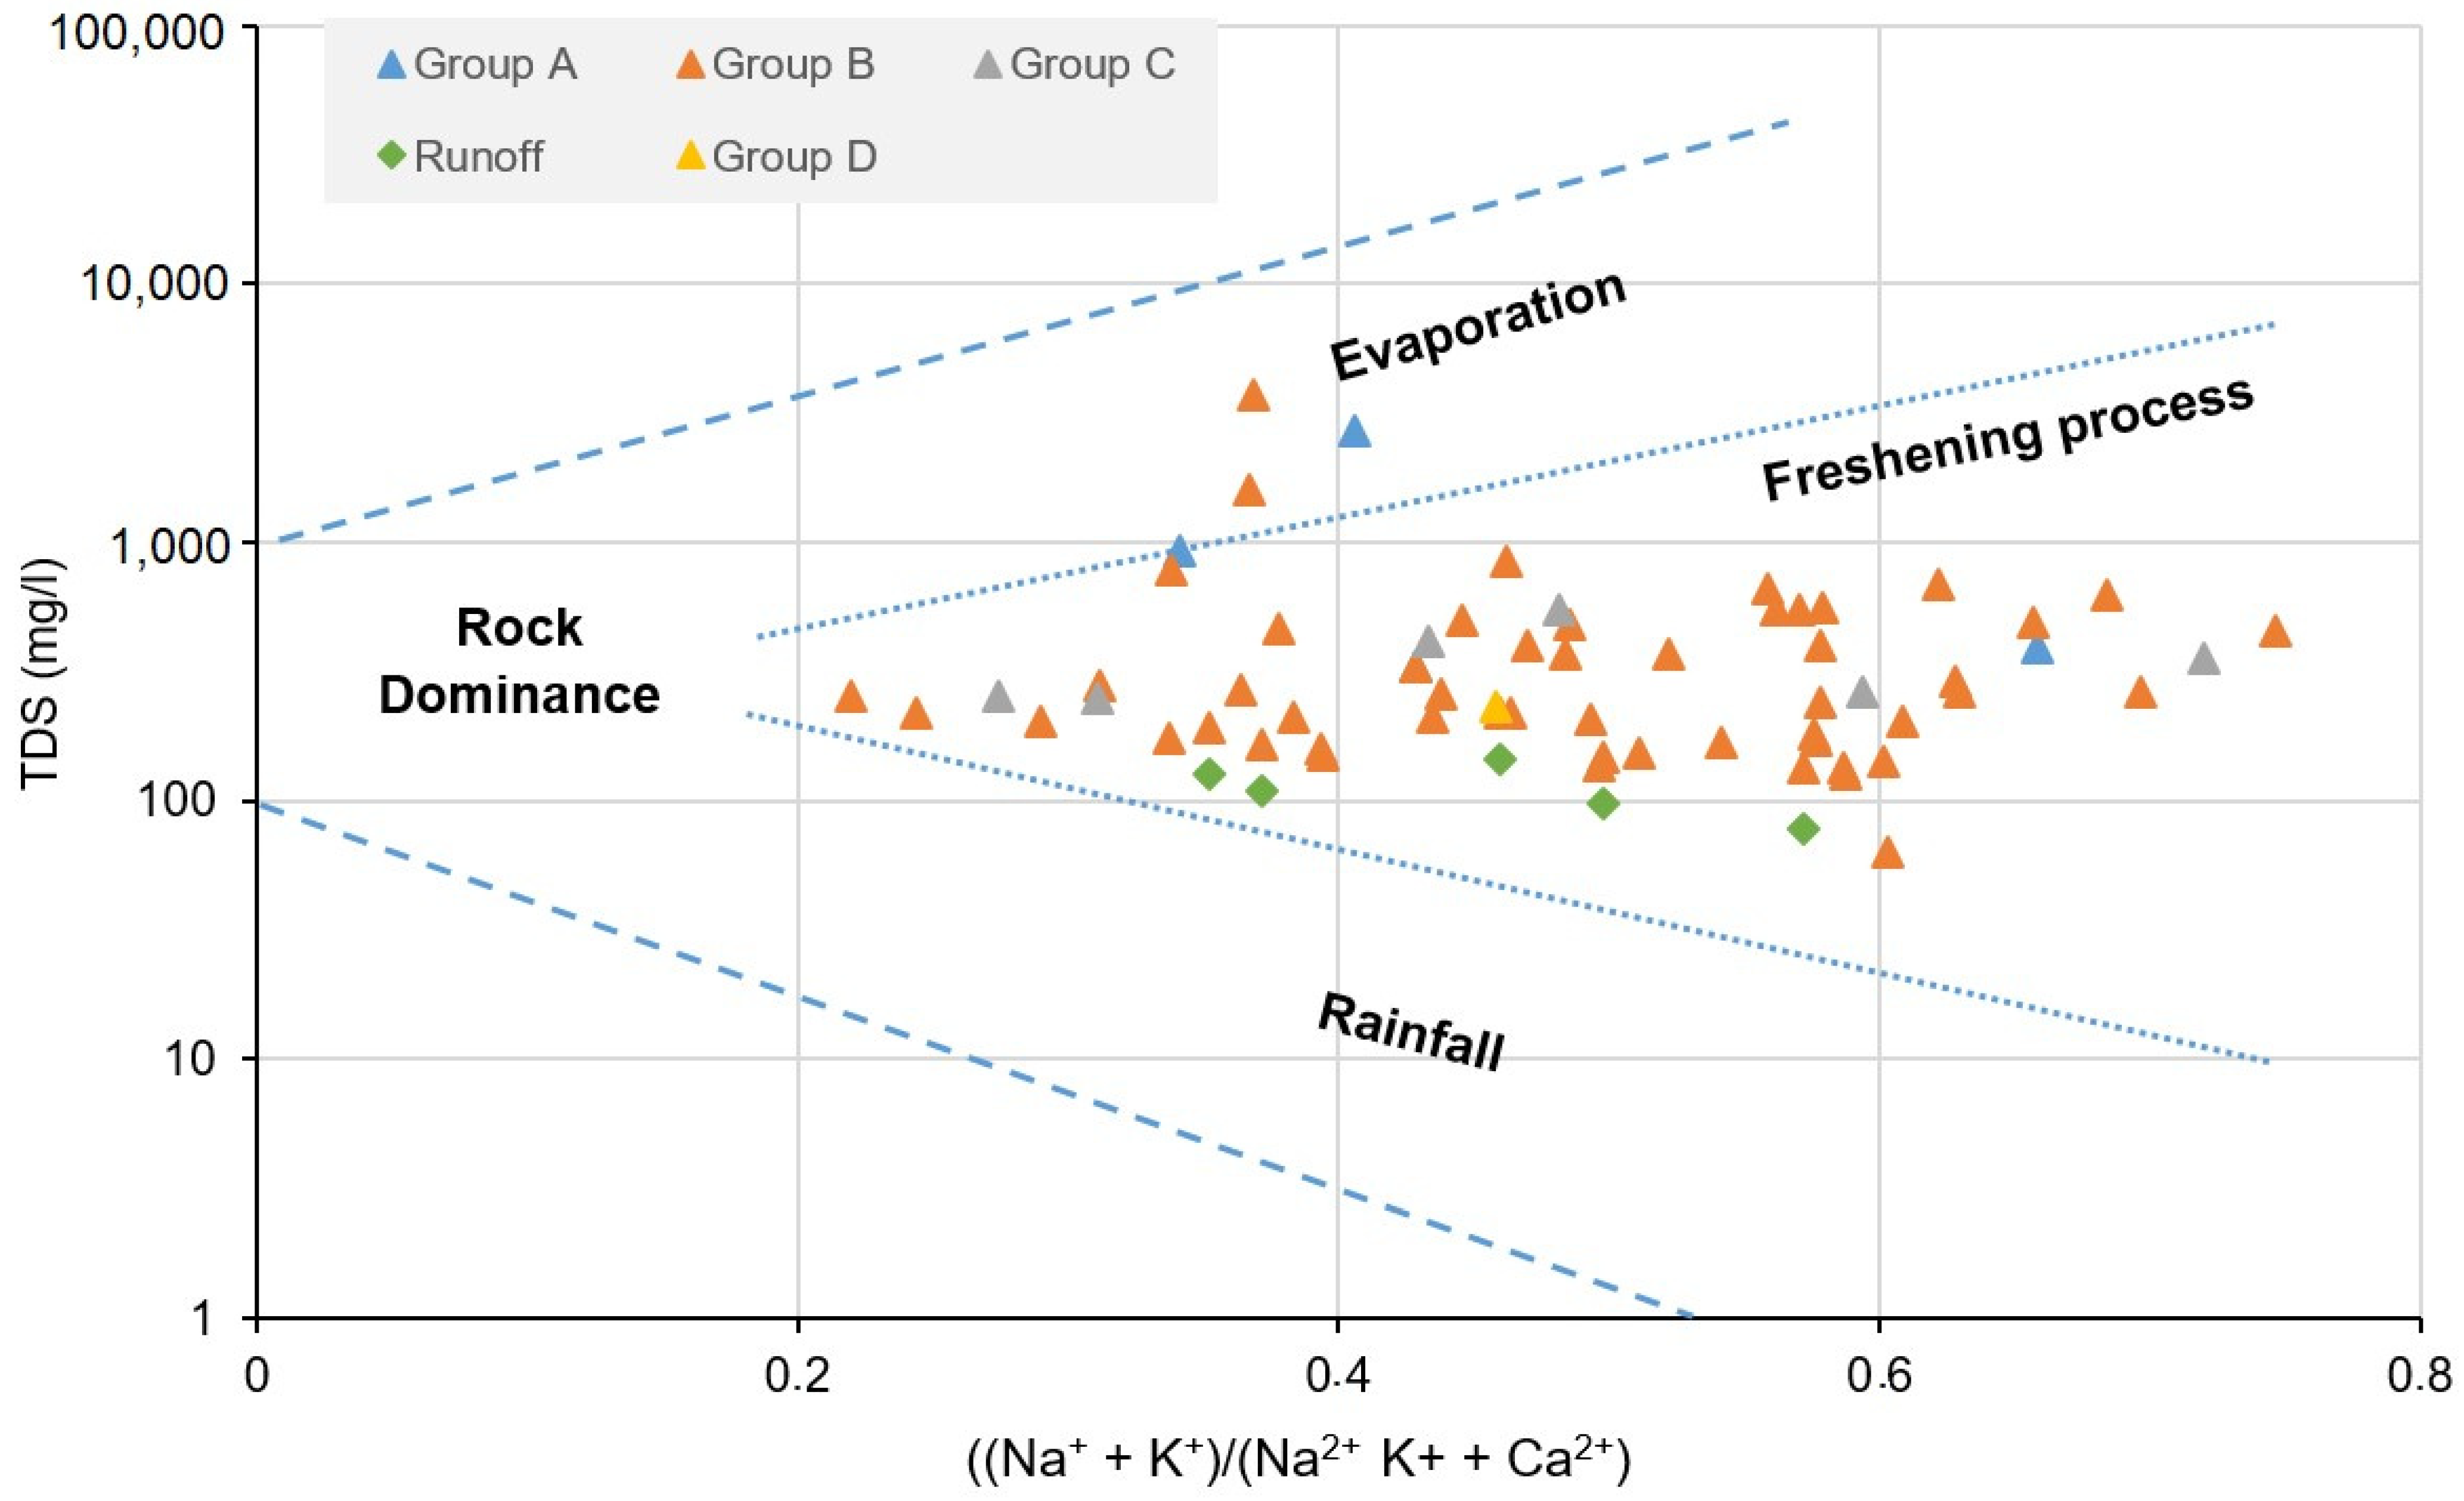
  47. Gibbs, R.J. Mechanisms Controlling World Water Chemistry. Science 1970, 170, 1088–1090. [Google Scholar] [CrossRef]
  48. Edmunds, W.M.; Shand, P. Natural Groundwater Quality; Blackwell Publishing Ltd.: Hoboken, NJ, USA, 2008; ISBN 978-14051-5672-32. [Google Scholar]
  49. Sellerino, M.; Forte, G.; Ducci, D. Identification of the Natural Background Levels in the Phlaegrean Fields Groundwater Body (Southern Italy). J. Geochem. Explor. 2019, 200, 181–192. [Google Scholar] [CrossRef]
  50. Preziosi, E.; Giuliano, G.; Vivona, R. Natural Background Levels and Threshold Values Derivation for Naturally As, V and F Rich Groundwater Bodies: A Methodological Case Study in Central Italy. Environ. Earth Sci. 2010, 61, 885–897. [Google Scholar] [CrossRef]
  51. Rahman, A.; Mondal, N.C.; Tiwari, K.K. Anthropogenic Nitrate in Groundwater and Its Health Risks in the View of Background Concentration in a Semi-Arid Area of Rajasthan, India. Sci. Rep. 2021, 11, 9279. [Google Scholar] [CrossRef]
  52. Wang, P.; Yu, J.; Zhang, Y.; Liu, C. Groundwater recharge and hydrogeochemical evolution in the Ejina Basin, northwest China. J. Hydrol. 2013, 476, 72–86. [Google Scholar] [CrossRef]
  53. Cheo, A.E.; Voigt, H.-J.; Wendland, F. Modeling groundwater recharge through rainfall in the Far-North region of Cameroon. Groundw. Sustain. Dev. 2017, 5, 118–130. [Google Scholar] [CrossRef]
  54. Dogramaci, S.; Skrzypek, G.; Dodson, W.; Grierson, P. Stable isotope and hydrochemical evolution of groundwater in the semi-arid Hamersley Basin of subtropical northwest Australia. J. Hydrol. 2012, 475, 281–293. [Google Scholar] [CrossRef]
Figure 1. Maps of the study area showing the topography and hydrography as well as the location of the sampling points. The Lake Chad Basin boundaries are also highlighted.
Resources 12 00138 g001
Figure 2. Rainfall and temperature diagram for the period 1970–2002: (a) Maroua station and (b) Kaélé station [17] in Cameroon.
Resources 12 00138 g002
Figure 3. Average monthly discharge of the: (a) Mayo Tsanaga at Bogo (1961–1989) (b) and Logone River at Yagoua (1961–2013) [20,21].
Resources 12 00138 g003
Figure 4. Geological map of the study region and geological cross-section of the Quaternary aquifer along the AA’ line (Q: Quaternary; T: Tertiary; Ti: Lower Tertiary; Pcm: Precambrian) (adapted from [11]).
Resources 12 00138 g004
Figure 5. Potentiometric map of the Quaternary aquifer in the southern Lake Chad Basin.
Resources 12 00138 g005
Figure 6. Hydrogeological cross-section of the study area (adapted from [10]).
Resources 12 00138 g006
Figure 7. δ 2H versus δ 18O plots of monthly rainfall at the N’Djamena station (IAEA-GNIP data, 1960–2019). The Ndjamena Meteoric Water Line (NMWL), Kano Meteoric Water Line (KMWL) and Global Meteoric Water Line (GMWL) are also plotted.
Resources 12 00138 g007
Figure 8. δ 2H versus δ18O plots of groundwater, Mayos (runoff), rainwater and Logone River with associated means values, Global Meteoric Water Line and the N’djamena Meteoric Water.
Resources 12 00138 g008
Figure 9. 3H versus δ 18O for groundwater in the Far North Cameroon (Lake Chad Basin). The weighted mean values refer to the N’Djamena rainfall.
Resources 12 00138 g009
Figure 10. 14C versus δ13C for intermediate (group C) and deep (group D) flow paths of the quaternary aquifer in the Far North Cameroon.
Resources 12 00138 g010
Figure 11. Piper diagram showing in the figure (A) the whole dataset and in the figure (B) the average composition of groundwater for the different groups. The circle is in the figure (B) proportional to the water mineralisation.
Resources 12 00138 g011
Figure 12. Gibbs diagrams of groundwater samples in the Far North of Cameroon.
Resources 12 00138 g012
Figure 13. Conceptual scheme of regional groundwater systems deduced from geological, piezometric, hydrochemical and isotopic information.
Resources 12 00138 g013
Table 1. Major hydrogeological characteristics in the Far North region of Cameroon. ABD = average borehole depth.
UnitSpecific Discharge
(m2/h)
Transmissivity
(m2/s)
Hydraulic Conductivity
(m/s)
References
Quaternary1.060.04 × 10−24 × 10−4[11]
Metamorphic0.273.71 × 10−5-[27]
Granitic0.466.06 × 10−5-[27]
Volcanic0.827.48 × 10−6-[27]
Table 2. Statistical analyses of major ions, physico-chemical parameters and water stable isotopes in groundwater, and Mayos.
Group AGroup BGroup CGroup DMayos
MinMeanMedMaxMinMeanMedMaxMinMeanMedMaxF12MinMeanMedMax
pH6.67.07.07.36.27.06.88.46.677.07.26.86.87.57.58.4
Redox−30.8−9.7−11.514.7−89.4−7.1−20.037.2−25.1−6.3−9.223.1−7.7−89.4−26.2−22.913.4
EC (µS/cm)468.11608.31119.73726.0149.7602.0248.24769.0328.1519.1473.1757.5462.3152.9221.5221.6291.9
HCO3 (mg/L)158.4243.9262.3292.873.2180.5118.9378.2176.5211.4195.2280.6207.491.5113.4115.9140.3
Cl (mg/L)2.7119.351.6371.20.028.02.4552.51.412.42.961.419.01.65.45.211.3
NO3 (mg/L)0.0368.9178.51118.70.074.70.01520.50.022.310.593.56.20.05.00.314.8
SO42− (mg/L)2.268.735.0202.50.016.92.0209.50.08.34.032.414.31.24.22.511.6
Na+ (mg/L)30.294.763.7221.29.140.714.4248.514.739.439.565.633.69.112.911.418.8
K+ (mg/L)0.08.14.423.70.06.11.8101.50.01.61.23.84.23.95.35.17.3
Mg2+ (mg/L)10.345.722.0128.52.112.23.8141.54.77.77.312.19.12.13.53.44.9
Ca2+ (mg/L)30.5144.894.9358.712.152.721.7600.524.543.941.573.344.814.122.724.228.8
TDS (mg/L)333.51094.3663.22717.5126.5412.1178.13728.3248.7347.3310.9548.4338.7134.3170.8163.7217.3
δ 2H (‰)−12.40−10.04−10.10−7.54−36.37−23.11−26.22−10.57−32.05−29.01−28.78−24.44−43.16−20.87−15.80−14.63−12.66
δ 18O (‰)−2.35−2.11−2.14−1.79−5.45−3.65−4.17−1.15−4.84−4.45−4.58−3.80−5.69−2.74−1.88−1.56−1.15
3H (TU)3 ± 0.34.8 ± 0.34.8 ± 0.36.1 ± 0.31.2 ± 0.33.2 ± 0.32.5 ± 0.36.1 ± 0.20.4 ± 0.31.9 ± 0.31.8 ± 0.34.5 ± 0.30.2 ± 0.35.1 ± 0.25.6 ± 0.35.6 ± 0.36.1 ± 0.3
d-excess6.406.816.707.43−4.686.125.299.682.366.596.629.872.36−4.68−1.93−1.943.76
LC-excess−1.80−1.00−0.80−0.52−10.86−4.23−5.61−0.61−8.24−5.15−5.43−1.92−11.46−10.88−9.01−8.48−4.87
Table 3. Estimated Ambient Background Levels (ABLs) and Threshold Values (TVs) for major ions and EC in groundwater of the Far North Cameroon.
ParametersRefABLTVNumber of Samples above the ABL (%)Number of Samples above the TV (%)
MaxMinShallow Ground Water (Groups A and B)Deep Groundwater (Groups C and D)Shallow Water (Groups A and B)Deep Water (Groups C and D)
EC (µS/cm)250597.3516.125033.928.573.228.5
HCO3 (mg/L)200280.203.32008.9057.137.5
Cl (mg/L)25011.34.813033.914.25.30
NO3 (mg/L)508.24.42744.625.135.714.2
SO42− (mg/L)25010.84.913032.128.53.50
Na+ (mg/L)20051.038.512530.328.55.30
K+ (mg/L)10020.710.4605.301.70
Mg2+ (mg/L)3012.78.32126.7014.20
Ca2+ (mg/L)7547.340.56130.328.516.014.2
Disclaimer/Publisher’s Note: The statements, opinions and data contained in all publications are solely those of the individual author(s) and contributor(s) and not of MDPI and/or the editor(s). MDPI and/or the editor(s) disclaim responsibility for any injury to people or property resulting from any ideas, methods, instructions or products referred to in the content.

