
A Pilot Project Using Sensors in the Municipal Solid Waste Collection of a Medium-Sized City

1
R&D Department, Sociedad Anónima Agricultores de la Vega de Valencia (SAV), Plaça de Tetuán 1, 46003 València, Spain
2
Department Mechanical Engineering and Construction, Jaume I University, Av. de Vicent Sos Baynat s/n, 12071 Castelló de la Plana, Spain
*
Author to whom correspondence should be addressed.
Resources 2023, 12(9), 108; https://doi.org/10.3390/resources12090108
Submission received: 28 July 2023
/
Revised: 29 August 2023
/
Accepted: 5 September 2023
/
Published: 7 September 2023
(This article belongs to the Collection Management, Environment, Energy and Sustainability under a Circular Economy)
Abstract
:Municipal solid waste collection must reach the recycling rates required by new regulations, like with the introduction of new bins to collect the organic fraction. The filling pattern of those bins is unknown, and the collection frequency and collection routes can change. Sensors can help to identify the filling degree and to reorganize the waste collection routes. Yet, equipping all the bins with new technologies can represent a significant amount of money for enterprises and public authorities. The aim of this work is to analyze the use of sensors in waste collection systems where the collection frequency is high. Bins from two zones of a town (a residential and a commercial zone) were selected, and a volumetric sensor was installed to study the filling pattern. In the first scenario, the organic fraction and the mixed waste bin were monitored. In the second experiment, data from mixed waste bins were recorded during two days of the week. Results show that the filling degree pattern is similar in all the cases and that citizens do not respect the recommended times for taking their waste out. Additionally, the cost of the sensors represents a significant amount for a medium-sized town. Although sensors can provide a great amount of information, it is not necessary to install them in all the bins but only at the points to be analyzed. This work proposes a new way to use sensors to validate and calibrate the containerization network of a town with a high collection frequency.
1. Introduction
Municipal Solid Waste (MSW) management challenges are continuously arising due to the concentration of people in the cities and the increase in the waste generation ratio. The MSW collection and its transportation represent the greatest part of the total cost of modern MSW management systems. In fact, economies of scale and the cost drivers differ across the types of waste [1]. Waste collection and transport can generate up to 70% of the total costs of the system. Additionally, recycling implies additional costs for separated MSW collection as more bins and routes must be considered. For example, the European Union (EU), according to Directive 2018/851/UE [2], requires member States to introduce the selective collection of certain types of waste, including biowaste before 2023 as it is a dominant fraction of the MSW.
Therefore, the separate collection at source and environmentally sound treatment of biowaste are of key importance [3]. The cost factor thus represents a challenge for enterprises. Therefore, public authorities and researchers need to calculate and reduce this cost. In this regard, some authors proposed and implemented a management tool to calculate the full collection costs of different types of waste and different waste collection schemes, respectively [4,5].
Waste collection is also an important source of greenhouse gas and noise emissions in the cities as the separate collection of the MSW increases the number of bins and consequently the number of trucks needed to collect it. For these reasons, public authorities and collection enterprises must intensify their efforts to improve waste collection to make it more efficient and environmentally sustainable. Moreover, Directive (EU) 2019/1161 of the European Parliament and of the Council of 20 June 2019 amending Directive 2009/33/EC on the promotion of clean and energy-efficient road transport vehicles [6] include lower emission limits for the vehicles that will be decisive in choosing the collection mode of transport.
From the emissions point of view, diesel refuse trucks have the worst fuel economy of on-road highway vehicles. Measurements of their fuel use and emissions showed that trash collection contributed 70–80% of total fuel use and emissions [7].
Other studies proposed models to predict future fuel consumption and greenhouse gas emissions in waste collection based on projected population, waste generation, and distance to transfer stations and landfills. They stated that greenhouse gas emissions can be reduced by decreasing the number of trips and trip distances, building more transfer stations around the city, and making sure that the collection trucks are full on each trip [8]. But waste collection emissions do not only represent a problem in populated areas. In low-density areas, the travel distances are often longer than in big cities, and sometimes, the amount of waste collected is small; therefore, the journey becomes inefficient. To reduce air pollutant emissions (CO2, CO, HC, NOx, and PM) formed in low-density areas during the waste collection, a truck that can collect different waste types should be used. Another measure can be to replace the door-to-door collection system with a waste collection point in a village or a waste station in the center of a municipality [9] or to use electric vehicles [10]. Results suggested that using a fleet of electric vehicles in waste collection operations will help reduce the total travel costs and harmful gas emissions.
In waste collection, it is crucial to define efficient collection routes to reduce emissions and save time. In other words, collection routes must be more sustainable to prevent trucks from traveling to collect empty or half-empty bins. This is a waste of resources since MSW bins are emptied even though they are only half-full, and vehicle fuel is used unnecessarily. High costs and poor effectiveness are the two main problems with smart city MSW collection [11]. A practice to improve waste collection management, which has been in full expansion in recent years, is the use of the Internet of Things (IoT), a tool that is widely applied in other fields. A review concluded that its implementation plays a significant role in minimizing the negative impact of waste on the environment [12]. When a bin is full, waste spills out from the bin and becomes a serious health hazard to the surrounding environment [13]. A common practice in this field is to install a sensor to determine the filling degree of the bin, which is connected to a platform that shows and saves all the data every day. In some cases, data like the level of waste in the garbage bin can also be sent in real time via SMS to alert the corresponding local authority [14]. The waste collection authority can therefore view and analyze the unfilled level of each bin using a smart graphical user interface. Al Mamun et al. [15] designed a monitoring system by integrating different sensing and communication technologies. The first segment consisted of bins with a sensor node installed in them, the second segment contained the gateways, and the third segment was the base station. The sensor nodes measured and transmitted the waste conditions such as waste level, weight, temperature, and humidity inside the bin every time it was accessed. Ramson et al. [16] developed a bin-level monitoring system, the life expectancy of which was estimated to be approximately 434 days, and the maximum transmission distance was 119 m.
Melakessou et al. [17] analyzed, together with a company offering a business waste collection service, data collected from ultrasonic sensors deployed in almost 50 different containers to measure fill levels in Luxembourg. They started with company-owned historical data and then investigated GPS information from tracking devices positioned on collection trucks to analyze the potential to change this business operation. Vishnu et al. [18] proposed an IoT-enabled solid waste management system for smart cities to overcome the limitations of traditional MSW management systems. Their architecture consisted of two types of end sensor nodes to measure the level of the trash bin that remained unfilled along with its location data. To validate the architecture, they conducted experiments with 16 trash bins equipped with different technologies.
In this regard, smart waste collection strategies have been developed to replace conventional fixed routes with dynamic systems that respond to the actual fill level of waste bins. In some cases, knowledge-based decision-making algorithms have been developed to select the bins that require collection based on previous data. Abdallah et al. [19] validated a smart system using waste generation data from their study area, and it lowered collection trip times by 18 to 42% compared to the conventional service.
The smart bin can also reduce human effort, time, and intervention. Replacing the traditional waste bin with a smart waste bin helps to achieve efficient management of waste by ensuring that full waste bins are emptied when a preset value is exceeded. This also helps reduce the time spent on checking the status of the waste bin and the number of trips made by the waste collection vehicle, and the total expenditure associated with collection is minimized [20]. The vehicle route optimization combined with waste collection scheduling using previous data on the filling rate of each container individually can help to establish the daily circuits of collection points to be visited, which is more realistic than the usual assumption of a single average fill-up rate common to all the containers in the system [21].
Most of the authors used sensors to measure the level of garbage, but in some cases, additional variables were measured. For example, Sarc et al. [22] developed “smart bins” with sensors for material detection or level measurement, methods for digital image analysis, and new business models. Yogamoorthi et al. [23] monitored the excess of garbage and the moisture in the garbage bin, and Debajyoti et al. [24] checked various smelly gases. Another use of the IoT in the waste management field is to decrease the human labor required by the traditional methods of garbage disposal. Wen-Tsai et al. [25] proposed a smart waste bin that could move itself by using ultrasonic sensors and a web camera, which served as its “eyes”. Finally, it can be useful to make the waste collection process more transparent and to get citizens involved in the waste collection, as the smart systems can allow them to access information about the public waste bins through a website or a mobile application [26].
In this study, sensors were used to control the filling degree of the bins. Controlling this filling degree may be useful to reorganize the waste collection routes. The time to collect a certain bin or the start time of waste collection may change as well as the travel itinerary of the truck. The aim is, in any case, to improve the service and make it more efficient. As outlined before, the use of sensors in the bins has several practical and useful applications to reduce greenhouse emissions by optimizing the amount of waste collected at the collection points and minimizing the collection distances and emissions. It is extremely useful in collection systems with big bins (3 m3 or even larger), located in rural areas, where the bin-filling time is high and, consequently, the collection frequency is low (once a week, 1/7, or once every two weeks, 1/14), as is the case of big bins used to collect glass or used clothes. In these cases, the bin-filling becomes more variable and causes different filling patterns among the bins. The implementation of sensors can allow those bins that have been randomly filled in the first place to be collected before they are too full to avoid spillage.
However, the massive use of volumetric sensors in waste collection raises the issue of the degree of improvement in the collection process. For example, if all the bins have a regular filling pattern, it will be possible to predict the amount of waste deposited in the bin depending on the time between two consecutive collections without the need for a massive deployment of sensors. These predictable patterns can occur in those cases where the filling, and consequently, the emptying of bins has a high frequency, 6/7 or 7/7. In this case, IoT can be very useful to calibrate the new collection systems, to recalculate the routes or to propose new collection frequencies, in other words, to check that the initial planning calculations are correct and, if not, to correct them. The bibliographic review presented in this research work found no evidence of any work using sensors in this regard. Therefore, it was interesting to carry out an experiment to demonstrate the usefulness of sensors in the design of MSW collection systems.
This work has two main objectives: On the one hand, to demonstrate that in the waste collection systems with a high collection frequency (7/7), the volumetric sensors are not needed to control the filling degree of the bins as they have a fixed filling pattern. On the other hand, volumetric sensors can be used to calibrate a new collection system with a high collection frequency. They can be useful to determine a new spatial distribution of the bins without overfilled bins.
In the case study, volumetric sensors were used to analyze the implementation of a new separate biowaste collection system and to test the operation of a collection system in a Spanish town. Sensors can play an important role in analyzing the pattern of the filling degree of bins in both collection systems. Consequently, this work proposes the use of sensors to analyze the pattern of the filling degree of a new collection system to calibrate the system and adjust the collection points that are not well dimensioned.
2. Methodology
The methodology used followed these five steps:
- Description of the waste collection system of the town;
- Selection and implementation of monitoring devices;
- Design of the experiment;
- Practical experiment;
- Analysis of the main results and conclusions.
2.1. Description of the Waste Collection System in Valencia
The practical experiment was carried out in Valencia, a medium-sized city located on the east coast of Spain with 800,180 inhabitants in 2021. The main economic activities in the town are commerce and services (66.7%), professions and arts (30.0%), construction (6.8%), and industrial activities (3.4%) [27]. Before the introduction of the new bin for biowaste, household waste was traditionally separated into 4 fractions: mixed waste (reject and organic fraction, all in one bin), paper/cardboard, light packaging, and glass. The waste, separated at the source, is then deposited in bins located on the streets. Waste from restaurants and shops is deposited in the same bins as household waste. There is no separate collection of commercial waste. In 2021, 259,032 t of mixed waste (323.7 kg/inh-year), 17,960 t of paper/cardboard (22.4 kg/inh-year), 13,946 t of light packaging (1.7 kg/inh-year), and 13,136 t of glass (1.6 kg/inh-year) were collected in this city. According to the València Statistics Office [28], the town has 20,552 bins to deposit the waste separated at the source.
Regarding the collection frequency, the mixed waste is collected 7/7, every day, and the bin size is 3.2 m3.
Recently, a new bin to collect biowaste (organic fraction) separately was introduced in only certain zones of the city to observe the neighbor’s behavior using this new bin. Therefore, these citizens deposited their waste in 5 different bins: reject, biowaste, paper/cardboard, light packaging, and glass. The reject waste was collected 7/7, and the bin size was 3.2 m3. To collect the reject fraction and the mixed waste, automated side-load trucks were used. The truck follows a route to collect as many bins as the total capacity of the truck allows. The truck empties all the containers one by one (regardless of the degree of filling) until it is full. At that moment, it travels to the treatment plant.
2.2. Selection and Installation of the Monitoring Devices
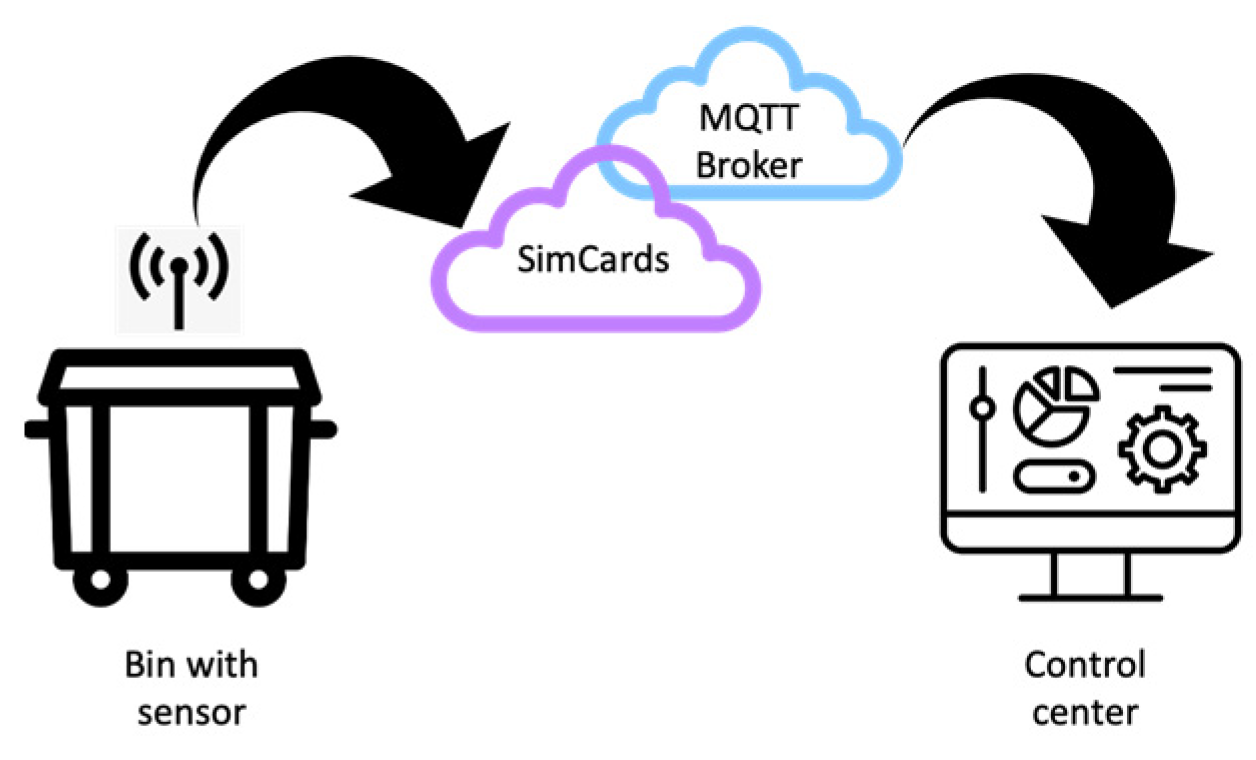
The components of a system to monitor MSW bins must include a sensor network, a connectivity infrastructure, a base station or web platform, and the gateway (Figure 1). To monitor the filling degree of the bins, it is necessary to implement the sensors inside them. These sensors are spatially distributed autonomous devices equipped with a transceiver, a battery, and a communication module to receive and send data.
The type of sensor to be inserted in the bins was a TsWasteTe volumetric sensor, distributed by Sigfox Partner Network. It is an autonomous battery-powered electronic device that makes it possible to know the percentage of filling of the bin by using a software application. It has a long-life battery and must be properly enclosed to ensure its operation in the conditions of the use of the bin.
The battery is an important element of the system since it must “feed” the sensor module and the transmitting part of the communications module. Unfortunately, these devices do not have rechargeable batteries. The battery life of the sensors can range from 5 to 10 years, according to data provided by the manufacturer. Factors such as temperatures, data transmission rates, and the connectivity system employed can affect the service life of the battery. For example, in extreme temperature conditions, the battery may be exhausted faster.
The TsWasteTe sends data to the cloud platform or storage servers. It is a low-cost device that can be installed in the bin. It allows the bin status and its filling degree to be checked. It is made of high-density polyethylene, so it is shock-resistant and optimized to work under adverse weather conditions. The sensors used are qualified to work in harsh and wet environments with an IP67-rated enclosure to protect against powerful jets of water during bin cleaning.
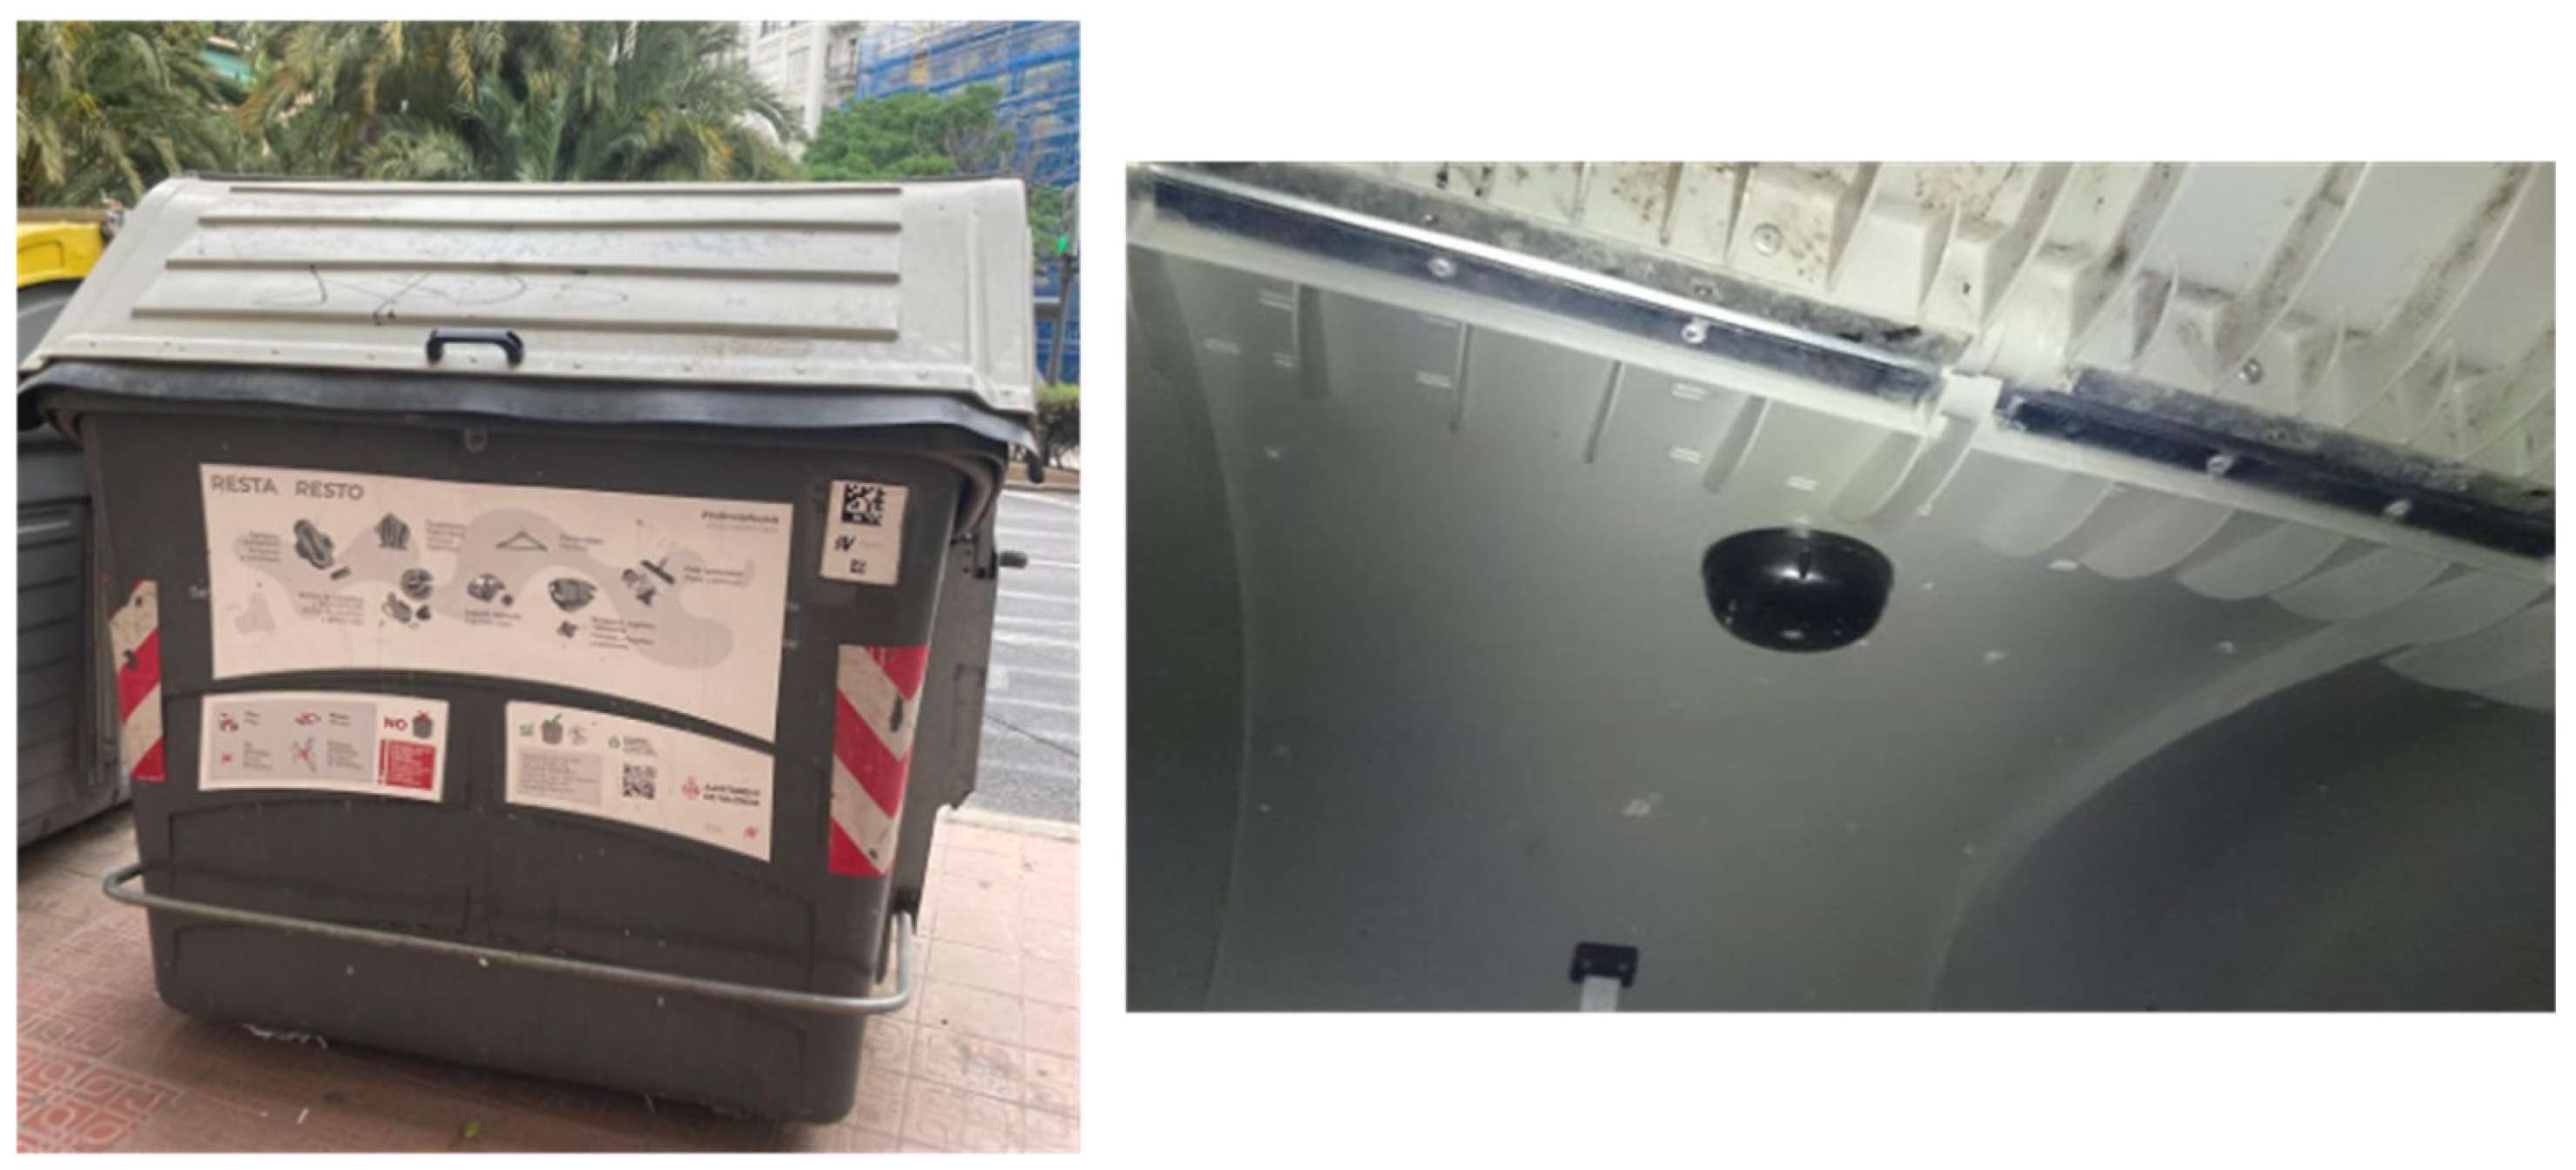
The TsWasTe device measures the filling degree with an ultrasonic high-precision sensor so it can detect an open lid or a bin fall and the temperature inside the bin. It is a bidirectional device, so it can be remotely configured and managed. Figure 2 shows a sensor installed inside a bin, on the lid.
The sensor measured the distance between the lid of the bin and the waste surface. The sensor sent a signal to a data station; therefore, the volume of waste was known in real time. With this data, the waste volume in the bin was calculated. Apart from the percentage of filling, the volumetric sensor can also indicate other variables such as when the bin falls over and the emptying time, the location, and fire and odor alerts. Nowadays, most bins have an accelerometer, so when they detect movement, the emptying time can be known. Additionally, it is also interesting to know whether the bin has fallen over due to the wind or to acts of vandalism to avoid accidents on the road. Some sensors have a GPS that makes it possible to know whether the bin has been moved from its initial position, but the use of the GPS reduces the life of the battery. Most models also include a temperature sensor to alert of a fire inside the bin. Additionally, in summertime, depending on the temperature, the bins of organic matter can be emptied sooner to avoid bad smells due to the decomposition of the waste.
To interconnect the bins, it is important to study the most appropriate technologies to send data and to design a sensor network architecture in line with the distribution of the bins and the environment where they are located. The aim of these systems is to send data with the lowest energy consumption as the devices will be in the rest position most of the time and send small-size messages.
Sensors need broadband or low-bandwidth internet networks, depending on the volume of data to be transmitted. The proposed system sent the fill level of the garbage container to the IoT server via a GSM communication network (SimCards). The web platform is software that connects hardware, access points, and data networks. It allows the collection and storage of data from the devices, such as the filling degree of a bin. The platform will be able to provide the user with predictive models.
The web platform is the support software that receives the information sent by the sensors and allows their management and display. The platform is cloud-based, and therefore it can be managed, maintained, and accessed from any location at any time. The platform used in this work was a free and open platform, Eclipse mosquittoTMEclipse IoT. Once the sensors are implemented, they must be connected. For this purpose, the Message Queue Telemetry Transport (MQTT) protocol was used, which allows the sensors to post data about what is happening in their surroundings on the web platform. The gateway is the hardware to send data from the network to the platform. In this case, the web platform was programmed to receive the filling data, the temperature, and the location of the bins. In order to be able to visualize the data in real time, a subroutine was programmed. It allowed the observation of the evolution of the filling of the containers from Google Maps.
Finally, to carry out the experiment, a laser distance meter LD32 was also used to check that the sensors worked correctly. Hence, this tool was used to calibrate the measurements.
2.3. Design of the Practical Experiment
The aim of the first experiment was to demonstrate the usefulness of the implementation of sensors in the calibration of a new collection system, and the collection of the reject fraction was monitored. Additionally, the collection of mixed waste from the old collection system was also monitored to test the performance of the experiment in a consolidated system. Sensors were installed in a town center that combines residential and commercial activities. Therefore, a great variation in the filling of the bins was expected. Data were recorded daily. The aim of the second experiment was to determine whether data could be reduced to calculate the filling pattern of the bin. For this purpose, the bin selected was located on the outskirts of a town that was an eminently residential area, where there were no restaurants, hotels, or commercial activities. This fact predicts a lower variation of the filling degree of the bin. Data were not recorded daily on this occasion.
The experiments were carried out in spring. During the beginning of this season, the weather was around 18 °C, but high temperatures could reach 23 °C on warmer days.
2.3.1. First Experiment: Town’s Center Bins Experiment
In the first experiment, four bins located in the town center were monitored to analyze the pattern of their fill level. This zone combines residential and commercial activities (shops, restaurants, and hotels). The bins selected were side-loading bins with a volume of 3.2 m3. The practical experiment lasted six months including the implementation of the sensors, the configuration of the system, the programming of the web platform, and the measurements in the bins.
Two sensors were placed in two bins of two routes where the citizens deposited only the waste reject fraction, which are bins where there is no organic matter. The sensor installed in the bin sent data every 4 h, and it started sending them at 9.40 h every day. Therefore, sensors measured data at 9.20 h, 13.40 h, 17.40 h, 21.40 h, 01.40 h, and 05.40 h. The first measurements did not coincide with the time the bin was emptied. The experiment was run for seven weeks, and data were recorded every day of the week. One of the sensors was stolen in the second week of the experiment. Consequently, the data from only one sensor (BR1) could be recorded.
The same test was performed in two bins where citizens deposited their mixed waste. These bins were the first bins that were emptied on the routes. The driver tried to collect the waste in the bins at the same time every day throughout the whole experiment, which was also run for seven weeks. The sensor installed in the bin sent data every 4 h, and it started sending them at 1.20 h every day. Therefore, the sensors measured data at 1.20 h, 5.20 h, 9.20 h, 13.20 h, 17.20 h, and 21.20 h. Data were also recorded every day of the week. Again, one of the sensors was stolen a few days after starting the experiment. Consequently, there were data from only one bin (BMix1).
To validate the results obtained in BMix1 and BR1, two additional bins for mixed waste in this area of the town (BMix2 and BMix3) were analyzed. The bins were in two different collection routes, and they were side-loading bins with a volume of 3.2 m3. The sensors used in these second tests were the same as those employed in the first tests.
The B Mix2 sensor sent data every 4 h, and it started sending them at 09.40 h every day. The BMix3 sensor sent data every 4 h, and it started sending them at 01.20 h every day. Data were recorded every day for one week. In all the cases, the collection routes were randomly selected.
2.3.2. Second Experiment: Outskirt Bins Experiment
The second experiment consisted of monitoring a reject fraction side-loading bin over a period of five weeks, with the same volume as the previous bins (3.2 m3). The bin was located on the outskirts of the town, and this second zone is an eminently residential area, where there are no restaurants, hotels, or commercial activities; this bin was called BR2.
In this case, no variations were supposed to take place throughout the week as it was a residential zone. For this reason, data were recorded only on Tuesday and Saturday. The sensor recorded data five times a day. In this experiment, only one sensor was used as the second one failed. As in the first experiment, the collection route was randomly selected.
3. Results
3.1. Results of the First Experiment: Town’s Center Bins Experiment
Once the experiment was over, data were recorded and analyzed. Regarding the reject bin, Figure 3 shows the data on the filling degree of bin BR1 considering the data sent by the sensor in the bin. The results follow a linear trend that has been represented as a regression line with the correlation coefficient R2 = 0.80. This analysis provides information on the pattern of the filling degree of the bin over the 7 weeks and shows when bins were overfilled.
Figure 3 shows that the first data recorded confirm that there was already waste in the bin (approximately 15%). This is because the collection truck collected the waste a short time before. Figure 2 also shows that in the morning, there was already waste in the bin, even when authorities recommend throwing the waste away after 20.00 h. The data also revealed that from 01.40 h onwards, citizens did not deposit any more waste in the bin. The filling degree decreases in the last time recorded due to the weight of waste, which causes it to be compacted inside the bin. This fact also means that the correlation is not high. It can also be observed that, on average, at 01.40 h the bin was about 50% full, and throughout the experiment, on only one day was the bin about 70% full; therefore, there were no overfilled bins. The bin is overfilled when it is 100% full and there are waste bags on the ground.
The variations obtained for a certain time are due to the fact that the data were recorded for all the days of the week and as it was a commercial zone; with shops and restaurants, the waste was deposited at different times during the day.
It can be concluded that there is only one bin-filling pattern with some variations during the day, as can be observed in Figure 3. It can also be deduced that the containerization is correct, as there are no spillages, although the bin filling can be optimized by increasing the radius of influence until it reaches 70% of the filling degree.
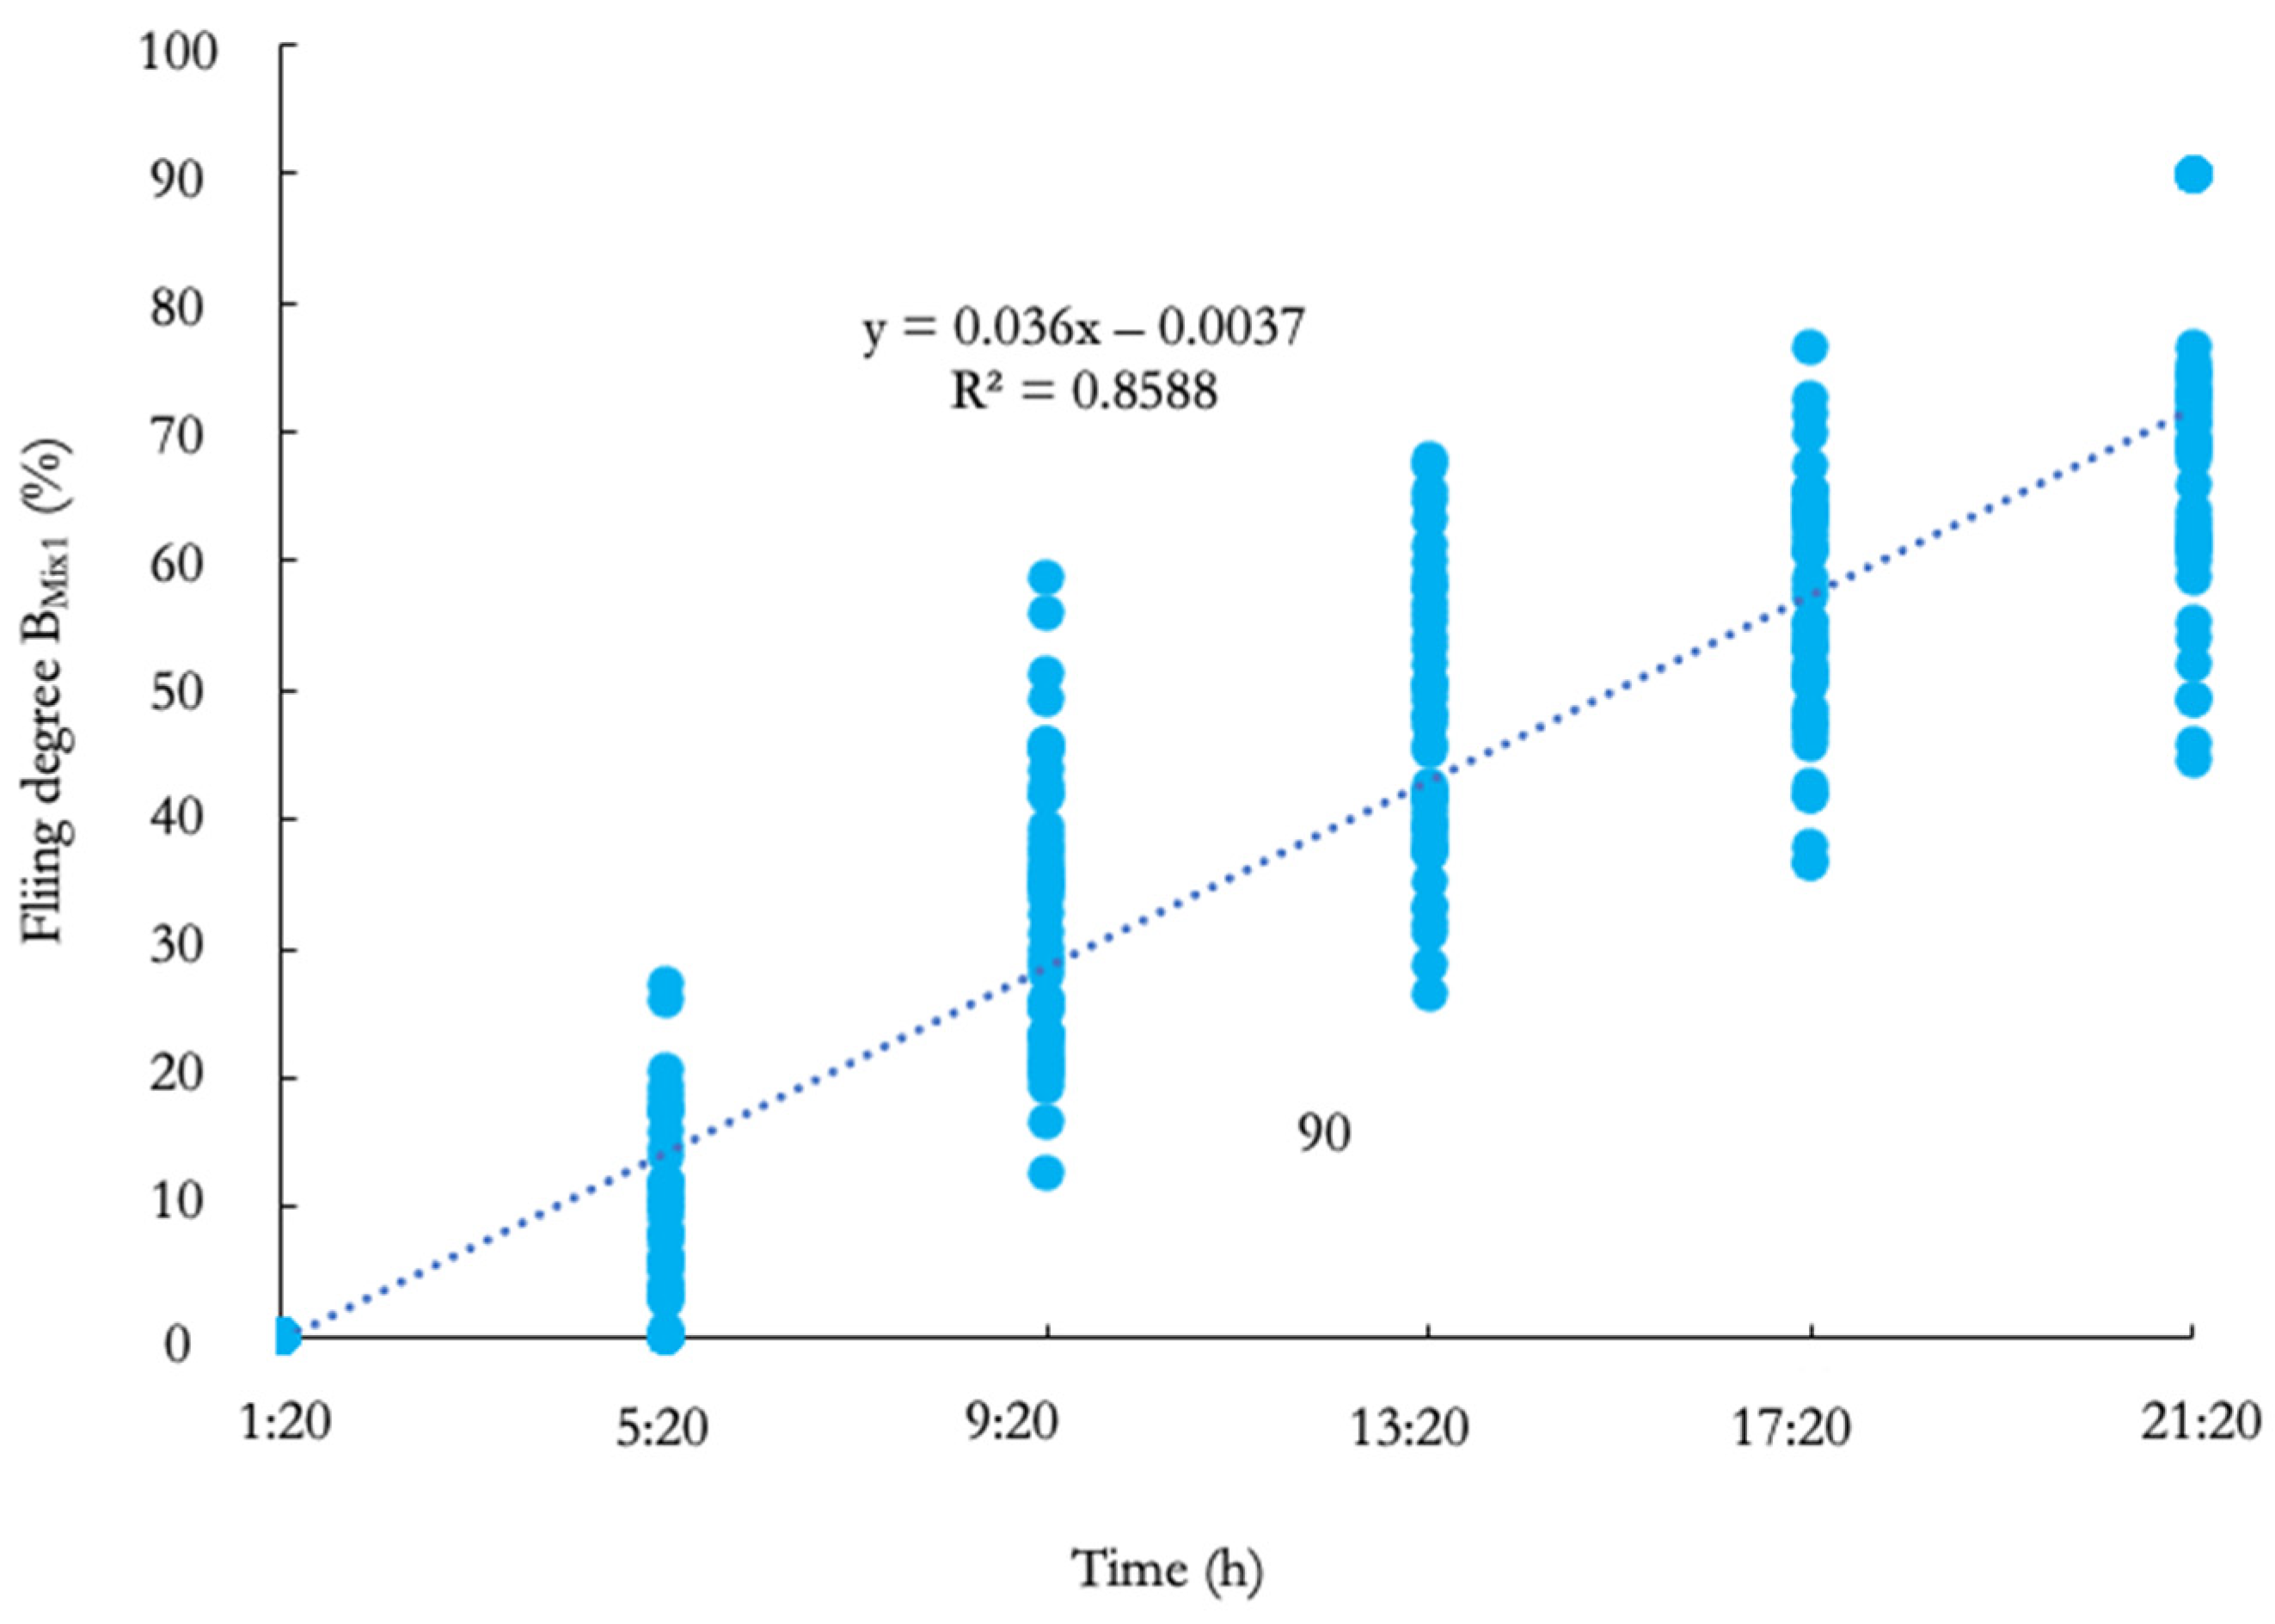
Figure 4 shows the filling degree of bin BMix1. As in the previous bin, results follow a linear trend with a correlation coefficient of R2 = 0.86. This analysis provides information on the pattern of the filling degree of the bin over the 7 weeks and shows when it is overfilled.
Figure 4 shows that the first data point recorded at 01.20 h is zero, as the sensor captured the first data immediately after the container was emptied. Figure 4 also shows that, on average, at 21.20 h the bins were about 60% full, and throughout the experiment, on only one day the bin was about 92% full. The variation at each measurement point can be due to the same causes as in the previous bin, although in this case, the variations are greater due to the number of shops and restaurants being higher. Additionally, it can be observed that the filling trend is linear. This means that the bin is being filled throughout the entire day like before. In this system, citizens do not respect the bin-filling times recommended by local authorities.
Finally, it can be concluded that there is only one filling degree pattern with variations during the day. It can also be deduced that the initial containerization design was correct, although there are no data from 21.20 h. However, although the behavior of the filling degree is like the previous bin, the filling trend from 21.20 h flattens. Therefore, it is expected that the bin is not expected to be overfilled.
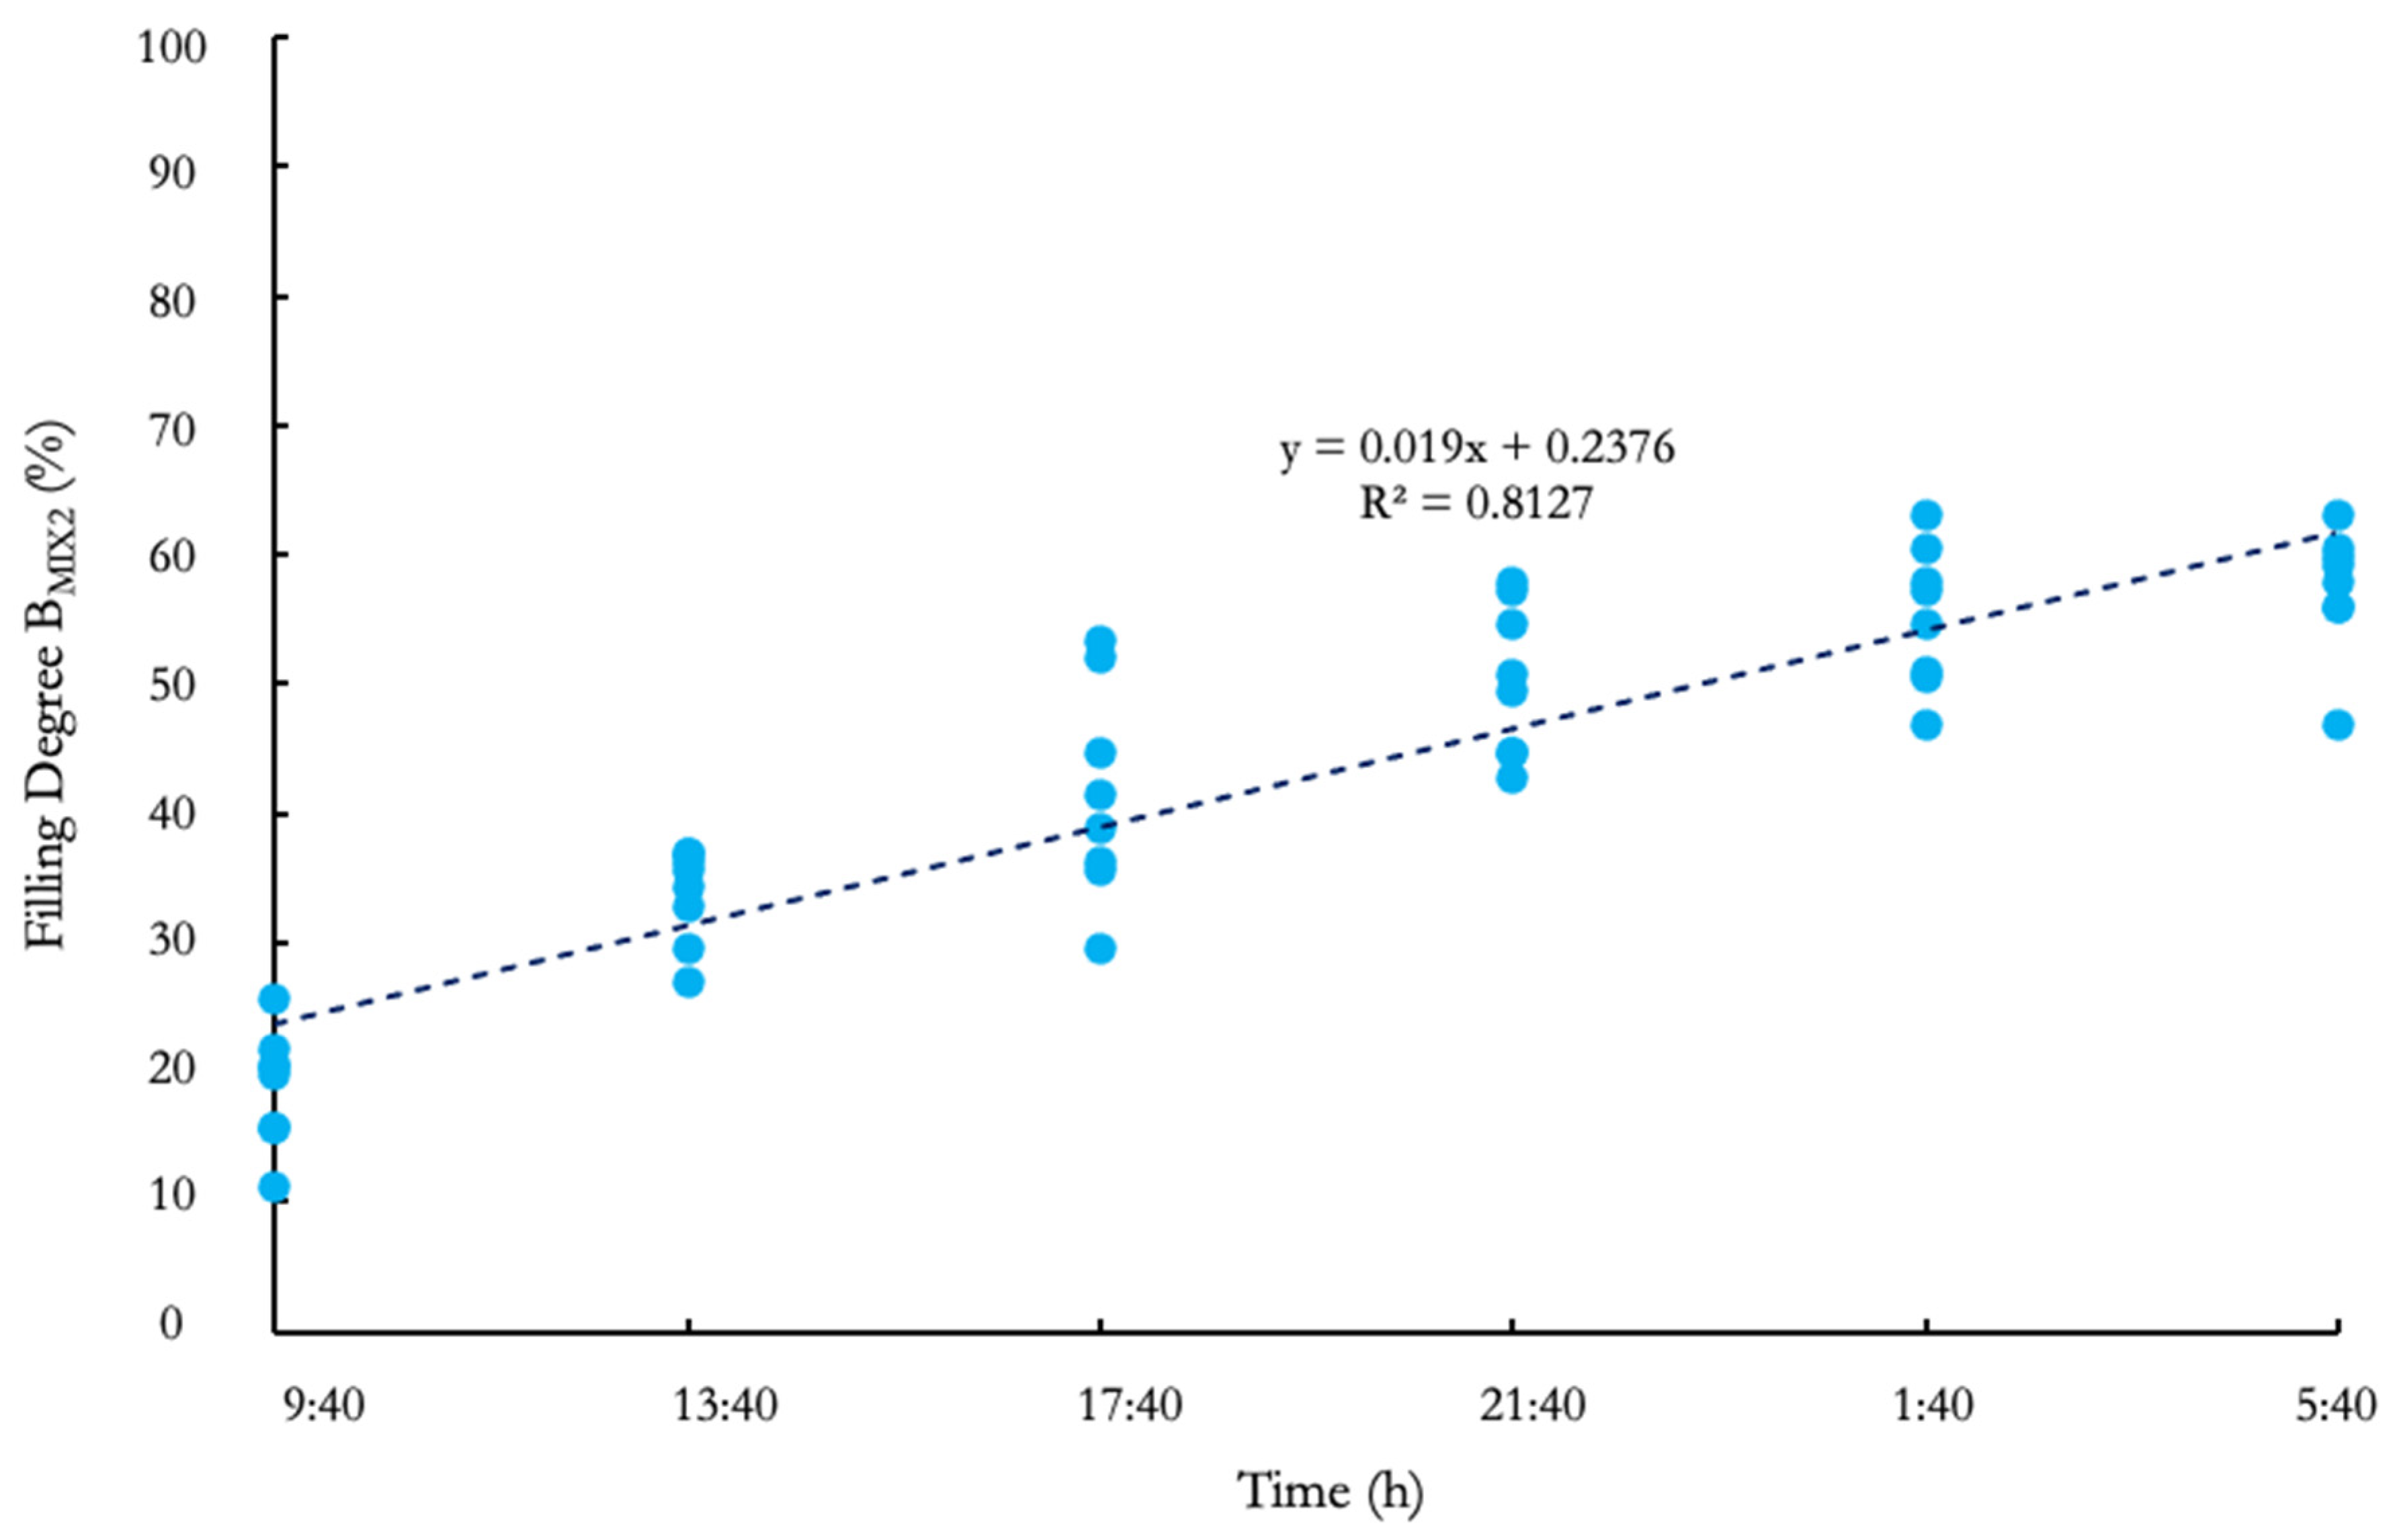
Figure 4 presents the results of the data recorded in BMix2. Results follow a linear trend that has been represented as a regression line with the correlation coefficient R2 = 0.81, like the previous cases. Bin BMix2 reaches lower filling degrees than BMix1 (Figure 5) with maximum values that do not exceed 65%. In this case, it can also be said that it is well dimensioned as there are no overfilled bins, and at 05.40 h, the filling degree is 60%. As there is no overfilling of the waste, the collection point can be optimized with the same measures as those commented earlier for BR1. Finally, it can be concluded that there is only one filling degree pattern with variations during the day.
BMix3 (Figure 6) also presents a regression line with the correlation coefficient R2 = 0.82. BMix3 reaches the maximum filling degree at 21.20 h, which is around 60%. In this case, there is more variation in the filling degrees at a certain time depending on the collection day, as it occurred in BMix1 due to the same reasons. Additionally, the maximum filling degree of BMix3 is greater than in BMix2 as it reaches 90% in one day at 17.20 h and 21.20 h. It can be concluded again that there is only one filling degree pattern with variations during the day.
3.2. Results of the Second Experiment: Outskirt Bins Experiment
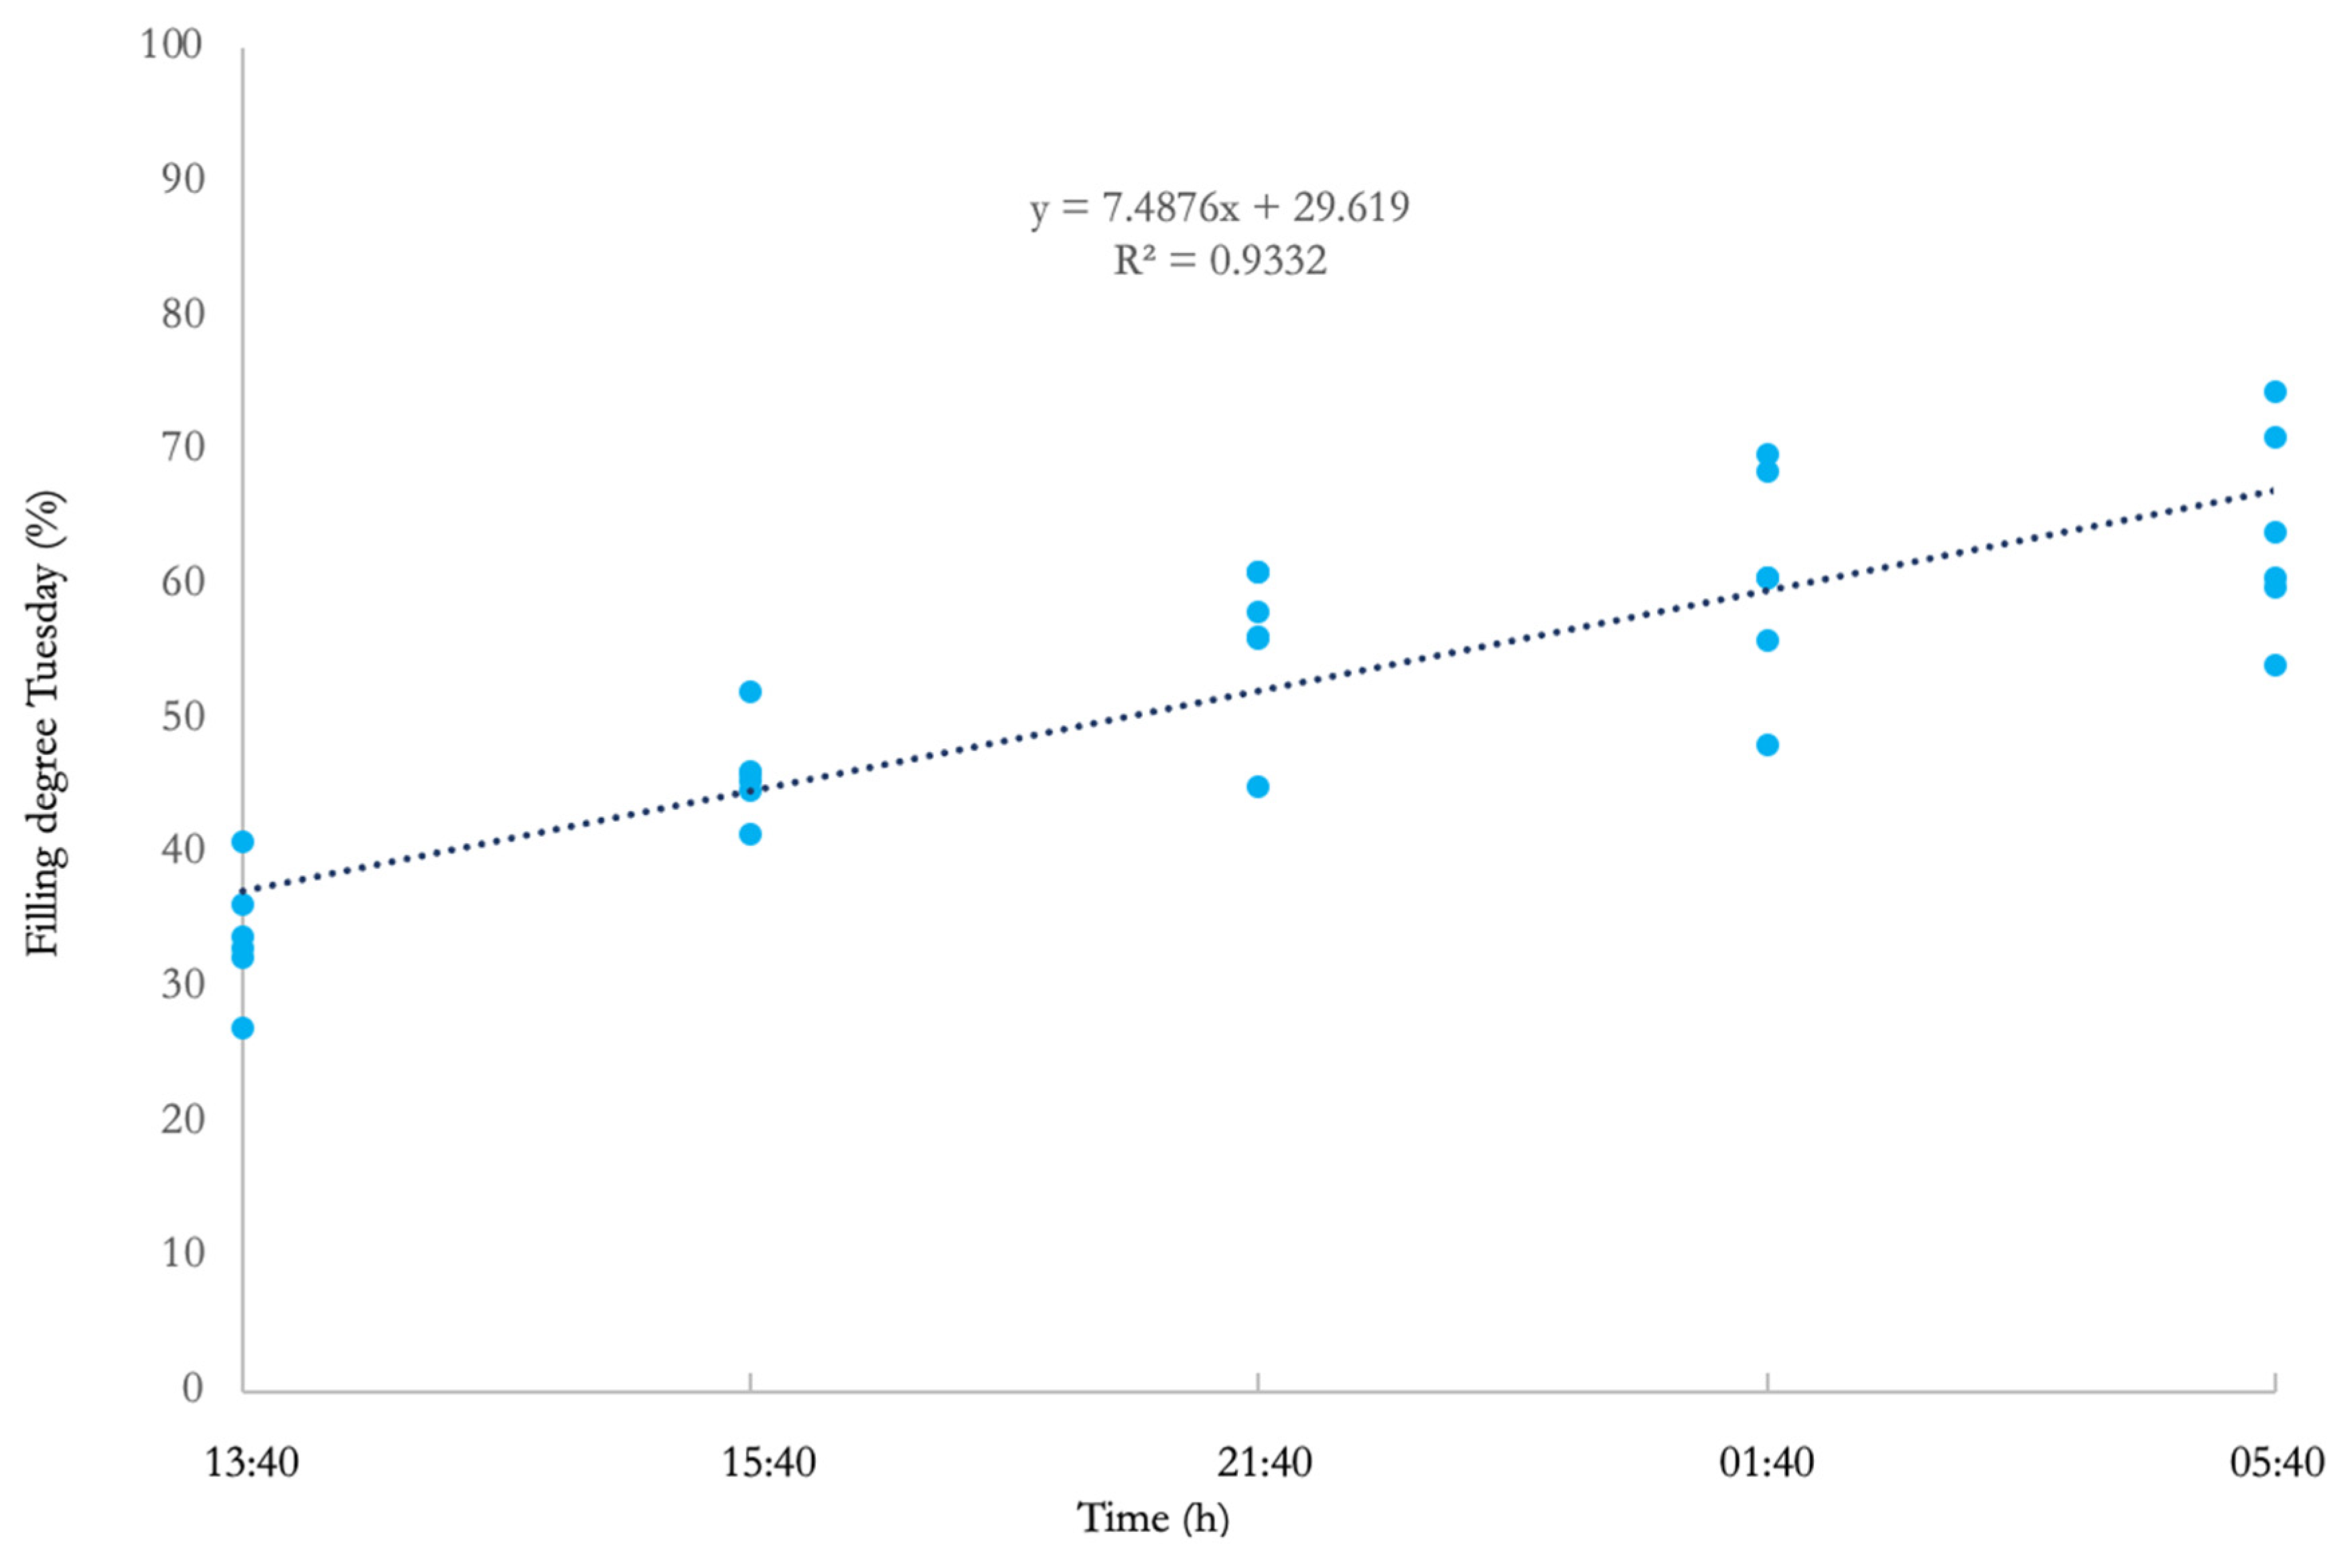
In this experiment, a reject fraction bin was monitored two days a week (BR2), one during the week (on Tuesdays), and the other one on the weekend (on Saturdays). Data recorded by the sensor on Tuesday are presented in Figure 7, and data recorded on Saturday appear in Figure 8.
Figure 7 and Figure 8 show that the dispersion of data at each point is low (R2 is 0.93 and 0.83, respectively), which may be because they refer to the same day of collection and to being in a residential area, where the behavior of citizens is more homogeneous than in a commercial–residential area with shops and restaurants. Figure 7 and Figure 8 also show that the filling degree over time is lower than in the first experiment (Figure 3). This can be due to the same fact, that is, that the bins are placed in a residential area. The results on both days (Tuesday and Saturday) are similar.
As in the previous cases, it can also be concluded that the collection point is correctly designed since the maximum filling degree is not higher than 75% at night when the waste collection takes place. The maximum filling degree is 75%, and it was fixed by the management company in Valencia to prevent bins from overfilling on holidays or when there are special events in the city. The final conclusions from this second experiment are like those drawn in the first experiment. Monitoring bins with sensors is useful to demonstrate that the collection system is well designed. Additionally, the implementation of the sensors makes it possible to know the filling degree pattern of the collection system.
4. Discussion
In the first experiment, four bins were monitored (a reject fraction bin and three mixed waste fraction bins) from four different routes. A reject fraction bin and a mixed waste bin were monitored for seven weeks, and the other bins were monitored for one week, all of them in a zone of the town that combines residential and commercial activities.
In the second experiment, only one bin was monitored. It was placed in a residential zone of the town. In this case, data were only recorded on Thursday and on Saturday. As there were no commercial activity, variations in the bin filling were not expected along the week.
The same sensors were used in both experiments. Therefore, the experiments were executed consecutively. The number of days was agreed upon with the company depending on the human and technical resources available at that moment.
Although at first the aim was to monitor a greater number of bins, due to economic reasons it could not be possible. For the same reasons, the sensors lost in the first part of the experiment could not be replaced. From the representativity of the recorded data point of view, it would be desirable to monitor more bins. Nevertheless, the results obtained show a good approximation to the expected results, and they will be used in future research works.
Considering the duration of the data collection, bins BR1 and BMix1 were recorded for 7 weeks (49 days), BR2 for 5 weeks (10 days), and BIix1 and BMix2 for only 1 week (7 days). In all the cases, the filling degree pattern and the final filling degree were obtained.
When data were recorded for 1 week (7 days), the dispersion of the data at a certain time was lower than if they were recorded during 7 weeks. From the results obtained, it can be proposed that for new experiments, data must be recorded at least for a week, and depending on the economic budget, data should be recorded for seven weeks but are not needed for a longer data collection.
Considering data collection throughout the day, in all the cases, data were recorded every four hours. Data on the graphics show that it is a good interval of data collection because the filling degree pattern can be appreciated. If shorter time intervals are programmed, the number of data would increase, but they would not provide much more information on the filling degree pattern.
In the second experiment, data were recorded on Thursday and Saturday in a residential zone. The filling degree pattern for those days was very similar, and data dispersion was low. Consequently, it can be deduced that in the homogeneous zones, it is not needed to record data every day of the week to obtain the filling degree pattern, with only two days it is enough. More bins must be monitored to obtain statistically representative results.
It has been possible to verify that in the five bins there is a lineal correlation between the filling degree and the time elapsed until the bin was emptied, which shows a filling degree pattern well defined in this type of waste collection (7/7 frequency). If this pattern is known, the bin can be controlled without sensors.
The dispersion in the second experiment was less than in the first experiment due to the characteristics of this zone (residential and commercial). Shops make the filling of the bin more random, and consequently, the filling pattern has a greater dispersion.
Regarding the comparison between the reject bins (BR1 and BR2) and the mixed waste bins (BMix1, BMix2 and BMix3), the filling degree pattern is very similar. This is due to two aspects: in the first place, although the waste collected is not the same, the composition of both bins—according to the company sources—was very similar, and in the second place, they have the same collection frequency (7/7).
In the two first cases, a waste settlement in the bin can be observed (Figure 2 and Figure 3). In both cases, the experiment was longer (49 days), appreciating both types of bins (reject and mixed waste), which have 40% of biowaste (according to the company data) and that can be the reason for this settlement. The waste settlement means that the bin can accumulate more waste, therefore it is important to consider this fact.
In the five bins, the filling degree is not higher than 70%, which indicates that the containerization degree in the influence area of these bins is adequate. To extend it to the rest of the city, more sensors are needed; however, this experiment demonstrates that the proposed methodology is useful. The number of sensors must be calculated to obtain representative data.
In the five cases, it can be observed that citizens and shops deposit the waste at any time of the day. If local authorities want to vary the filling pattern and do not allow this practice, they must establish forceful measures like keeping the bins closed and implementing automatic opening devices at certain times of the day.
The main conclusion of this experiment is that it is not necessary to implement a sensor in every bin in the network to control their fill level. This is an important result because it has been demonstrated that in the collection systems with a high-frequency collection (7/7), it is not necessary to implement sensors in all the bins of a town to control their fill level as they follow a clear filling pattern that allows to predict the filling degree of the bins at any time of the day.
While authors like [14,15,17,19,20] studied waste collection systems with a lower bin emptying frequency and showed that sensors were useful to control the bin fill level, no one has considered to the use of sensors in higher waste collection frequencies.
It would be interesting to keep on working with other types of waste, collection frequencies, and typologies of towns to get more filling patterns and to determine the limit that makes it useful to install sensors.
In the case studied it can be said that the monitoring of bins is useful to demonstrate that the collection system is well designed as there are no overfilled bins, although it could be improved on some days and at specific times. This fact made the collection company decide to not install sensors to control the fill level in Valencia. Therefore, the temporal implementation of sensors in bins is a good tool to know how the collection system is operating.
After analyzing the conclusions of the test, it was detected that one of the critical points of the experiment was the batteries and their maintenance, and as a solution, the use of sensors powered using rechargeable batteries with a solar panel could be considered as a more optimal solution, since the sensors will be self-sufficient from the energy point of view and more environmentally sustainable.
Notwithstanding the foregoing, the solution that has been presented in the paper aims to improve the waste collection service through sensory technology, with an adjusted cost, which is why a solution was chosen that will allow the current containers to be used with reliable commercial sensors together with an open online platform for reading data.
The system designed did not fail during the experiment where the temperature was between 18–23 °C. Sensors did not have technical failures. The humidity and the cleaning agents of the bins did not affect the functioning and the data transmission. Batteries lasted the whole experimental stage. Another critical aspect of the project was to keep the sensors in the bins, preventing thefts. However, two of the four sensors only lasted two weeks after starting the experiment. This aspect must be considered to implement the system. Citizens need awareness about the use of sensors in bins as they are good for the proper functioning of the system. More safety measures are also needed; for example, the containers can be adequately tracked and monitored since they have GPS, an excellent and simple solution. Sensor positions could be controlled, and in case they move 20 m from the original location, a sound signal can be sent to the municipal staff.
Finally, the economic aspect is also important as the amount of money needed to implement sensors in all the bins in a town can be too high for the local authorities.
5. Conclusions
The introduction of sensors in the bins makes it possible to know the filling degree in real time. It allows the obtainment of information quickly to help to redefine the collection routes, the collection time, or the frequency of collection to improve the MSW management. Previous works consulted used sensors to detect the fill level of a container and the temperature conditions. No work using a partial implementation of sensors as a tool to calibrate the implementation of a new collection system was found.
This work proposes a methodology to use IoT to calibrate a network of bins where the collection frequency is high (6/7 or 7/7). Volumetric sensors were used to analyze the fill pattern of the bins and to decide whether the collection system needed a redesign.
It is important to install the sensor in a place inside the bin where it cannot be damaged by the waste while it is being deposited or collected. Additionally, it is also essential to choose a place to prevent thefts.
The case presented in this research included a city with 20,552 bins, in which a new selective collection model is being implemented; therefore, installing sensors in all the bins involves high additional costs. The role of the sensors can be, in this case, simply organizational. Sensors could be useful to reorganize the waste collection by zones in the same town. They make it possible to study the pattern of the filling degree of the bins, which provides information that can be used to predefine or redefine waste collection. Once the filling degree pattern is known, the sensors can be uninstalled and installed in another zone of the town to analyze the bin’s filling degree pattern.
From the results obtained in the experimental part of the study, some conclusions can be drawn. As the behavior of the bins, while they are being monitored, corresponds to a predictable medium–high filling degree, the deployment of a network of sensors that are continuously operating can only be justified as a tool that allows correction of a badly designed street containerization. Once the current situation has been tested, the container filling patterns are known, and the bin volume and the collection frequency can be fixed; it is not necessary to undertake a high investment in sensors and communications to cover all the bins in the network of a town.
In residential areas without any commercial activity, it was shown that the filling behavior of the bins on different days of the week is similar, and therefore, daily data collection would not be necessary. However, to replicate the experiment, the environment in which the bins are placed needs to be assessed, as commercial or restaurant areas need daily data collection.
In this study, it was also detected that citizens do not respect the bin’s usage schedule (from 20.00 h to 22.00 h) in all the cases analyzed. This is an important tool for the local authorities to establish measures to ensure citizens respect the schedule, for example, through an informational campaign.
For all these reasons, in collection systems with a high frequency (6/7 or 7/7) where a clear fill pattern appears, the use of sensors is recommended only as a tool to calibrate the collection services, but their daily and continuous use is ruled out.
This work is a first experimental assessment for further research that will include more measurements in several collection points at the same time and in different zones of the city.
After analyzing the conclusions of the test, some critical aspects to consider in future works were detected such as the life of the sensor’s battery and its resistance to humidity and chemical agents, as well as the safety of the sensors to prevent possible thefts.
Finally, the results of this work made the company take a decision, and they did not install sensors in all the bins. Therefore, they only used sensors to calibrate new collection routes. As a conclusion to these experiments, it can be said that six bins were monitored from six different collection routes.
Author Contributions
Conceptualization, A.G. and J.F.-G.; Data curation, J.F.-G.; Formal análisis, A.G., J.F.-G. and N.E.-A.; Funding acquisition, J.F.-G.; Investigation, A.G., J.F.-G. and M.C.: Methodology, A.G., J.F.-G. and M.C.; Project administration, A.G.; Resources, J.F.-G.; Software, A.G., M.C. and N.E.-A.; Supervision, A.G. and M.C.; Validation, A.G. and M.C.; Visualization, A.G. and M.C.; Roles/Writing—original draft; Writing—review & editing; M.C. and A.G.; formal analysis, A.G., J.F.-G. and M.C. All authors have read and agreed to the published version of the manuscript.
Funding
This research received no external funding.
Data Availability Statement
Data supporting reported results are available in the text.
Conflicts of Interest
The authors declare no conflict of interest.
References
- Greco, G.; Allegrini, M.; Del Lungo, C.; Savellini, P.G.; Gabellini, L. Drivers of solid waste collection costs. Empirical evidence from Italy. J. Clean. Prod. 2015, 106, 364–371. [Google Scholar] [CrossRef]
- Directive (EU) 2018/851 of the European Parliament and of the Council of 30 May 2018 amending Directive 2008/98/EC on waste. Off. J. Eur. Union 2018, L150, 109–140.
- Slavik, J.; Dolejs, M.; Rybova, K. Mixed-method approach incorporating Geographic information system (GIS) tools for optimizing collection costs and convenience of the biowaste separate collection. Waste Manag. 2021, 134, 177–186. [Google Scholar] [CrossRef]
- D’Onza, G.; Greco, G.; Allegrini, M. Full cost accounting in the analysis of separated waste collection efficiency: A methodological proposal. J. Environ. Manag. 2016, 167, 59–65. [Google Scholar] [CrossRef]
- Boskovic, G.; Jovicic, N.; Jovanovic, S.; Simovic, V. Calculating the costs of waste collection: A methodological proposal. Waste Manag. Res. 2016, 34, 775–783. [Google Scholar] [CrossRef]
- Directive (EU) 2019/1161 of the European Parliament and of the Council of 20 June 2019 amending Directive 2009/33/EC on the promotion of clean and energy-efficient road transport vehicles. Off. J. Eur. Union 2019, L188, 116–130.
- Sandhu, G.S.; Frey, H.C.; Bartelt-Hunt, S.; Jones, E. Real-world activity, fuel use, and emissions of diesel side-loader refuse trucks. Atmos. Environ. 2016, 129, 98–104. [Google Scholar] [CrossRef]
- Korkut, N.E.; Yaman, C.; Küçükağa, Y.; Jaunich, M.K.; Demir, İ. Greenhouse gas contribution of municipal solid waste collection: A case study in the city of Istanbul, Turkey. Waste Manag. Res. 2018, 36, 131–139. [Google Scholar] [CrossRef]
- Vilms, M.; Voronova, V. Waste collection in low-density areas and air pollutants formed in the process. In Proceedings of the 10th International Conference on Environmental Engineering, ICEE, Vilnius, Lithuania, 27–28 April 2017. [Google Scholar]
- Erdem, M. Optimisation of sustainable urban recycling waste collection and routing with heterogeneous electric vehicles. Sust. Cities Soc. 2022, 80, 103785. [Google Scholar] [CrossRef]
- Chen, X. Machine learning approach for a circular economy with waste recycling in smart cities. Energy Rep. 2022, 8, 3127–3140. [Google Scholar] [CrossRef]
- Akram, S.V.; Singh, R.; Gehlot, A.; Alshamrani, S.S.; Prashar, D. Role of wireless aided technologies in the solid waste management: A comprehensive review. Sustainability 2021, 13, 13104. [Google Scholar] [CrossRef]
- Kumar, S.; Kaur, M.; Rakesh, N. IoT-Based Smart Waste Management System. In Innovations in Information and Communication Technologies (IICT-2020); Springer: Wiesbaden, Germany, 2021; pp. 133–139. [Google Scholar]
- Yusof, N.M.; Jidin, A.Z.; Rahim, M.I. Smart Garbage Monitoring System for Waste Management. In Proceedings of the MATEC Web of Conferences Volume 97, Engineering Technology International Conference 2016 (ETIC 2016), Ho Chi Minh City, Vietnam, 5–6 August 2016. [Google Scholar] [CrossRef]
- Al Mamun, M.A.; Hannan, M.A.; Islam, M.S.; Hussain, A.; Basri, H. Integrated Sensing and Communication Technologies for Automated Solid Waste Bin Monitoring System. In Proceedings of the IEEE Student Conference on Research and Development, Putrajaya, Malaysia, 16–17 December 2013; pp. 480–484. [Google Scholar]
- Ramson, S.R.J.; Moni, D.J.; Vishnu, S.; Anagnostopoulos, T.; Kirubaraj, A.; Fan, X. An IoT-based bin level monitoring system for solid waste management. J. Mater Cycles Waste Manag. 2021, 23, 516–525. [Google Scholar] [CrossRef]
- Melakessou, F.; Kugener, P.; Alnaffakh, N.; Faye, S.; Khadraoui, D. Heterogeneous Sensing Data Analysis for Commercial Waste Collection. Sensors 2020, 20, 978. [Google Scholar] [CrossRef]
- Vishnu, S.; Ramson, S.R.J.; Senith, S.; Srinivasan, S.; Kirubaraj, A.A. IoT-enabled solid waste management in smart cities. Smart Cities 2021, 4, 1004–1017. [Google Scholar] [CrossRef]
- Abdallah, M.; Adghim, M.; Maraqa, M.; Aldahab, E. Simulation and optimization of dynamic waste collection routes. Waste Manag. Res. 2019, 37, 793–802. [Google Scholar] [CrossRef]
- Afolalu, S.A.; Noiki, A.A.; Ikumapayi, O.M.; Ogundipe, A.T.; Oloyede, O.R. Development of Smart Waste Bin for Solid Waste Management. Int. J. Sustain. Dev. Plan. 2021, 16, 1449–1454. [Google Scholar] [CrossRef]
- Zsigraiova, Z.; Semiao, V.; Beijoco, F. Operation costs and pollutant emissions reduction by definition of new collection scheduling and optimization of MSW collection routes using GIS. The case study of Barreiro, Portugal. Waste Manag. 2013, 33, 793–806. [Google Scholar] [CrossRef]
- Sarc, R.; Curtis, A.; Kandlbauer, L.; Khodier, K.; Lorbe, K.E.; Pomberger, R. Digitalisation and intelligent robotics in value chain of circular economy-oriented waste management—A review. Waste Manag. 2019, 295, 476–492. [Google Scholar] [CrossRef]
- Yogamoorthi, T.; Estrela, V.V.; Edoh, T.O.; Gomes de Oliveira, G.; Iano, Y.; Razmjooy, N.; Monteiro daHora, H.R.; Vaz, G.C. Digital Garbage Bin Monitoring System (DGBMS): A Smart Garbage Monitoring and Management Cyber-Physical System. Smart Innov. Systems Technol. 2021, 233, 488–497. [Google Scholar]
- Debajyoti, M.; Gautam, D.; Triankur, C.; Debaprasad, D. An IoT-based waste management system monitored by cloud. J. Mater. Cycles Waste Manag. 2018, 20, 1574–1582. [Google Scholar]
- Wen-Tsai, S.; Ihzany Vilia, D.; Sung-Jung, H.; Fathria Nurul, F. Smart Garbage Bin Based on AioT. Intell. Autom. Soft Comput. 2022, 32, 1387–1401. [Google Scholar]
- Pardini, K.; Rodrigues, J.P.C.; Diallo, O.; Kumar Das, A.; de Albuquerque, V.H.C.; Kozlov, S.A. A Smart Waste Management Solution Geared towards Citizens. Sensors 2020, 20, 2380. [Google Scholar] [CrossRef] [PubMed]
- València Statistic Office. València City Council. Recull Estadístic València 2021. Àrea d’Innovació I Gestió del Coneixement. Available online: https://www.valencia.es/cas/estadistica/anuario-estadistica?p_p_id=EstadisticaPorTemas_INSTANCE_Eri9LivkoTZ2&p_p_lifecycle=0&p_p_state=normal&p_p_mode=view&_EstadisticaPorTemas_INSTANCE_Eri9LivkoTZ2_IDCatalogo=9511435&_EstadisticaPorTemas_INSTANCE_Eri9LivkoTZ2_jspPage=%2Fcatalogo_publicaciones.jsp&_EstadisticaPorTemas_INSTANCE_Eri9LivkoTZ2_serie=15 (accessed on 28 June 2023).
- València Statistic Office. València City Council (2021a). Servici de Gestió Sostenible de Residus Sólids Urbans i Neteja de l’Espai Públic. Available online: https://www.valencia.es/cas/estadistica/anuario-estadistica?p_p_id=EstadisticaPorTemas_INSTANCE_Eri9LivkoTZ2&p_p_lifecycle=0&p_p_state=normal&p_p_mode=view&_EstadisticaPorTemas_INSTANCE_Eri9LivkoTZ2_IDCatalogo=9511435&_EstadisticaPorTemas_INSTANCE_Eri9LivkoTZ2_jspPage=%2Fcatalogo_publicaciones.jsp&_EstadisticaPorTemas_INSTANCE_Eri9LivkoTZ2_serie=15 (accessed on 28 June 2023).
Figure 1.
Architecture used in the experimental section.

Figure 2.
Mixed waste bin and sensor installed on the lid, inside the bin.

Figure 3.
Filling degree of BR1.

Figure 4.
Filling degree of BMix1.

Figure 5.
Filling degree of BMix2.

Figure 6.
Filling degree of BMix3.

Figure 7.
Filling time on Tuesday BR2.

Figure 8.
Filling time on Saturday of BR2.

Disclaimer/Publisher’s Note: The statements, opinions and data contained in all publications are solely those of the individual author(s) and contributor(s) and not of MDPI and/or the editor(s). MDPI and/or the editor(s) disclaim responsibility for any injury to people or property resulting from any ideas, methods, instructions or products referred to in the content. |
© 2023 by the authors. Licensee MDPI, Basel, Switzerland. This article is an open access article distributed under the terms and conditions of the Creative Commons Attribution (CC BY) license (https://creativecommons.org/licenses/by/4.0/).
Share and Cite
MDPI and ACS Style
Franco-González, J.; Gallardo, A.; Carlos, M.; Edo-Alcón, N. A Pilot Project Using Sensors in the Municipal Solid Waste Collection of a Medium-Sized City. Resources 2023, 12, 108. https://doi.org/10.3390/resources12090108
AMA Style
Franco-González J, Gallardo A, Carlos M, Edo-Alcón N. A Pilot Project Using Sensors in the Municipal Solid Waste Collection of a Medium-Sized City. Resources. 2023; 12(9):108. https://doi.org/10.3390/resources12090108
Chicago/Turabian StyleFranco-González, Jerónimo, Antonio Gallardo, Mar Carlos, and Natalia Edo-Alcón. 2023. "A Pilot Project Using Sensors in the Municipal Solid Waste Collection of a Medium-Sized City" Resources 12, no. 9: 108. https://doi.org/10.3390/resources12090108
Note that from the first issue of 2016, this journal uses article numbers instead of page numbers. See further details here.