
Assessing the Impact of Climate Change on Snowfall Conditions in Poland Based on the Snow Fraction Sensitivity Index


Department of Hydrology, Faculty of Geography and Regional Studies, University of Warsaw, Krakowskie Przedmieście 30, 00-927 Warsaw, Poland
Resources 2024, 13(5), 60; https://doi.org/10.3390/resources13050060
Submission received: 2 December 2023
/
Revised: 16 April 2024
/
Accepted: 22 April 2024
/
Published: 24 April 2024
(This article belongs to the Special Issue Risk Assessment of Water Resources)
Abstract
:This study focuses on temperature and snowfall conditions in Poland, both of which were analyzed from 1981 to 2020. A 40-year record of daily snow fraction time series values was reconstructed using a unique and global multi-source weighted-ensemble precipitation (MSWEP) product, which provided a spatially and temporally consistent reference for the assessment of meteorological conditions. The average states and trends in snow fraction and temperature were analyzed across several years, focusing on the 6-month cold season (November–April). The impact of temperature on the snow fraction pattern was assessed by introducing a snow fraction sensitivity index. To predict short-term changes in snow conditions, a proxy model was established; it incorporated historical trends in the snow fraction as well as its mean state. This study provides clear evidence that the snow fraction is principally controlled by increases in temperature. A warming climate will thus cause a decline in the snow fraction, as we observed in vast lowland areas. Given the ongoing global warming, by the 2050s, snow-dominated areas may go from covering 86% to only 30% of the country’s surface; they will be converted into transient rain–snow areas. Our results demonstrate that a decline in snow water resources has already occurred, and these resources are expected to diminish further in the near future. New insights into the sensitivity of the snow fraction to climate warming will expand our collective knowledge of the magnitude and spatial extent of snow degradation. Such widespread changes have implications for the timing and availability of soil and groundwater resources as well as the timing and likelihood of floods and droughts. Thus, these findings will provide valuable information that can inform environmental managers of the importance of changing snowfall conditions, guiding them to include this aspect in future climate adaptation strategies.
1. Introduction
Snowfall is considered one of the most sensitive climatic indicators, reflecting the effects of climate change on global water cycles, freshwater ecosystems, and human activities [1,2,3]. Due to our warming climate, in some regions, more precipitation occurs as rain instead of snow, and snow melts earlier [4]. These changes in precipitation phases have important implications for the timing and magnitude of the soil moisture replenishment [5] and, as a consequence, the timing and magnitude of streamflow components [6,7]. Specifically, persistent snowfall keeps the hydrological system dormant, while rainfall recharges aquifers and feeds rivers. Furthermore, limited snowfall can result in spring water deficiency [8,9] and exacerbate summer low flows [10,11]. However, there is still considerable uncertainty regarding the effects of the warming climate (and its corresponding hydrometeorological impacts) on precipitation phases across the rain–snow transition zones [12]. Although several studies have focused on changes in snow phenology, many have examined mountainous or cold regions [13,14,15]. Much less attention has been paid to lower altitudes (i.e., non-alpine settings), although these are areas in which the disappearance of snow in winter may have more significant reverberations; similarly, in said regions, there will likely be greater effects on urban and rural residential areas, as these settlements are far more common at lower altitudes [16]. Thus, identifying patterns in snowfall across different regions may improve our understanding of both the climate and the water cycle. As a consequence, insights into the dynamics of snowfall may contribute to the implementation of climate adaptation policies in the water resources management sector.
A large-scale, global warming-induced reduction in the snow fraction and an increase in snowmelt in the cold season have been already reported in the middle latitudes of the Northern Hemisphere [17]. Across Europe, significant decreases in snow depth have been observed since the 1980s [18]. Across the rain–snow transition zones of Europe, fluctuations in snow cover are largely controlled by temperature [19,20]. In regions in which temperatures in the cold season are close to zero, the impact of temperature change is highly influential. In mid-latitude mountainous areas, precipitation is a more significant factor than in low-altitude areas. As temperatures increase, the initiation of snow cover is further postponed and its ending time is advanced [21]. Since global warming modifies snowfall patterns in large parts of the world, developing an increased understanding of the snow component of the water cycle is a high priority within ongoing research [22,23]. Still, there remain significant uncertainties concerning regional trends in snowfall patterns due to differences in the datasets used, the empirical functions applied to estimate the snow fraction and the spatial and temporal data resolutions selected for such investigations. Thus, regionally focused investigations may provide detailed insights into changes in snowfall patterns, thereby complementing research on a global scale.
In Poland, signs of climate change are increasing in frequency and coverage [24,25,26]. Mean annual and seasonal air temperatures have shown an increasing trend throughout the country [27]. From 1951 to 2018, increases in winter temperatures exceeded 0.3 °C per decade. The warmest winter on record was that at the turn of 2019/2020, with an average temperature of 3.1 °C; this was 1.3 °C higher than the previous warmest winter, that of 2015/2016. Twenty-first century climate projections for Poland anticipate further temperature increases and a decrease in frosty periods [28]. With reference to the period of 1971–2000, the mean annual temperature is projected to increase for the whole territory of Poland. Looking to the near future (2021–2050), increases are projected to range from 1–1.25 °C for RCP4.5 to almost 2–2.5 °C for RCP8.5. Frost is also projected to disappear gradually from the territory of Poland [28]. The number of days with temperatures below 0 °C is projected to decrease by 10–30 days a year for RCP4.5, and 20–50 days a year for RCP8.5. Annual and seasonal precipitation trends, in contrast with temperature trends, have thus far shown less conspicuous patterns [29]. In the context of snow-related indicators, research in Poland has most often focused on both the duration and depth of snow cover, metrics that have been monitored at weather stations [30]. In the years 1951–2018, the number of days with snow cover significantly decreased at most of the 58 analyzed sites [31]. Over the period 1967–2020, the depth of snow cover also decreased at most of the 40 analyzed sites [32]. During the same multi-year period, equivalent measures of snow water decreased at 42 of the analyzed locations [33]. However, the consistency and stability of snow cover have not yet undergone significant disturbance at most of the monitoring stations [34].
While the above-mentioned studies have investigated the characteristics of snow across Poland based on observations at synoptic weather stations, none of these studies considered the countrywide, warming-induced snowfall indicators using spatially continuous estimates of snowfall and air temperature. Thus, the spatial–temporal assessment of snow metrics is an ongoing challenge for regional-scale investigations. Undertaking such an assessment may help to bridge this gap in the literature and improve our understanding of current climate-induced changes throughout Poland. There are still some key unknowns, which include (1) the extent of the snow fraction in the cold season, as evaluated in a spatially contiguous domain; (2) the magnitude of trends in the snow fraction in recent decades; and (3) the sensitivity of the snow fraction to rates of climate warming.
Various metrics have been introduced to quantify snowfall conditions. Commonly studied snow indicators include the depth and extent of snow and the length of the snow season. The snow fraction (the percentage of precipitation that falls in the form of snow) is frequently utilized as an indicator of climate change. Similarly, the snow water equivalent at the end of winter and into spring is a commonly applied metric that describes the depth of water stored for the spring and summer runoff season [2,35]. The sensitivity of the seasonal snowfall to varying temperatures can be assessed by examining the relationship between seasonal variations in the snow water equivalent and temperature [36,37]. The slope of the best-fit snowfall–temperature regression therefore provides the sensitivity of snow water to the air temperature and further information on how temperature causes variability in snowfall. Another approach to calculating thermal snow sensitivity uses the ratio of the domain-averaged difference between the mean snow fraction in cold and warm winters to the corresponding difference in mean temperature [38]. As such, it is considered to represent retrospective snow fraction sensitivity. Another technique enables the analysis of snow’s sensitivity to temperature and precipitation using a delta change methodology that can be applied to mountainous locations [39]. The coupling of snow–temperature within a sensitivity indicator may also be achieved by regressing the temperature trends on snow metric trends for a given ensemble; this has been undertaken on both hemispheric and regional scales using the extent of snow cover [40].
In this work, unlike the methods mentioned above, the concept of elasticity [41] was employed to define the sensitivity of the snow fraction to air temperature over the middle-latitude, lowland-dominated territory of Poland. New insights into the deficiency of snow in the cold season were acquired by introducing a seasonal snow metric on a 6-month time scale. Generally, the index applied here follows the approach proposed by Mudryk et al. [40], although instead of the extent of snow cover, we used the snow fraction. Thus far, such an approach has not been given sufficient attention in Poland. Apart from the above-mentioned investigations based on monitoring stations, quantitative long-term studies linking multi-year trends in temperature and snow in a sensitivity index have not been reported. The scientific novelty of this study additionally lies in our attempt to apply and interpret the sensitivity index in the spatial domain using gridded climatic datasets.
The key scientific questions that need to be answered in this study are as follows:
- (1)
- Over the last four decades, has Poland undergone widespread changes in the contribution of snow to overall precipitation due to our warming climate?
- (2)
- How might we describe the spatial differentiation of the snow fraction sensitivity index across the country?
- (3)
- If warming trends continue at their current pace, what degree of change in the snow fraction during the cold season will we witness by the middle of the twenty-first century?
In order to address the above research questions, this study proceeded through four main steps taken after validation and adjustment of the snow fraction data (Figure 1). Firstly, multi-year averages and trends in the snow fraction (Sf) were quantified to detect spatial–temporal changes over the cold seasons each year from 1981 to 2020. A complementary stage of the study involved identifying trends in air temperature from the same time period. Secondly, we conducted a correlation analysis of the air temperature and the snow fraction to identify the nature of their relationship. Thirdly, using snow fraction and temperature metrics, a sensitivity index was introduced. In the fourth and final step, we established a proxy model for the reduction in the snow fraction. We hypothesized that cold-season temperatures have decreased the snow fraction of overall precipitation remarkably over the past four decades. We also hypothesized that the interactions between the snow fraction and air temperature can be represented by the sensitivity index, thereby providing a proxy measure of changing snowfall conditions. The results of this study will expand our understanding of the relationships between changes in climate and the response of snow in the middle-latitude lowland-dominated regions of Poland. The resulting knowledge may support various environmental studies by identifying the zones of the country most heavily affected by decreases in snow.
2. Materials and Methods
2.1. Study Area
This study concerns the territory of Poland, which stretches from 54.83° N to 49.00° N and from 14.18° E to 24.15° E; it covers an area of 311,888 km2 (Figure 2a). The average height of the country is 173 m a.s.l. (Figure 2b). The lowest point (−1.8 m a.s.l.) is located on the Baltic Sea coast in northern Poland, and the highest peak is in the Tatras Mountains (2499 m a.s.l.). Some 91% of Poland’s area is covered by lowlands (0–300 m a.s.l.), 6% is covered by uplands (300–500 m a.s.l), and only 3% is covered by mountains (above 500 m a.s.l.). Most of the territory, around 97%, is within the Middle European Plain, and only the southern parts reach the elevations of the peaks of the Carpathian and Sudetes Mountains [42]. Poland’s types of land use are majority agricultural (60%) and forest-based (33%), while the rest of the territory is covered by artificial surfaces (6%) and other categories of land use (1%). A humid, temperate climate (Cfb) prevails in the country and occurs from the 14th to approximately the 19th and 20th meridians [43]. Continuing eastwards and southwards toward the mountains, these areas feature a snowy humid climate (Dfb) with a warm summer. The four climatic seasons—spring (March–May), summer (June–August), fall (September–November), and winter (December–February) follow one another regularly. However, ongoing climate warming has led to the prolongation of thermal summers and the shortening of thermal winters [44]. The duration of the thermal spring has lengthened, while autumn and winter have been delayed. The highest level of annual precipitation (over 1000 mm/y) occurs in the mountains in the south, while the lowest level (~500 mm/y) occurs in the lowland part of the country. The spatial average of the annual precipitation is 627 mm, while for the 6-month season (November–April), it amounts to 236 mm.
2.2. Air Temperature and Precipitation Datasets
This study is based on daily meteorological data collected from quality-controlled, gridded climate datasets. This research concerned the cold seasons of 1981–2020. All snow metrics were calculated for a 6-month time scale. The 6-month cold season starts in November and lasts until April in the next calendar year (NDJFMA). This approach followed the convention of the water year, which was designated in Poland as a 12-month period (November–October) that consists of a 6-month cold season followed by a 6-month warm season. Thus, our analysis focused on the full snow season, as defined by Choi et al. [45].
This study employed an air temperature dataset from version 25.0 e of the station-based E-OBS gridded dataset (https://www.ecad.eu; accessed on 19 June 2022), available from the European Climate Assessment and Dataset Project [46]. It comprised daily air temperature values acquired from a regular latitude/longitude grid of 0.1° × 0.1°. For the territory of Poland, the data subset was extracted as a 3D-gridded dataset with dimensions of 60 × 110 × 14,610, which correspond to 60 latitude grid cells, 110 longitude grid cells, and 14,610 daily solutions. Using the daily gridded values, the average values for the months over November–April were prepared to represent typical conditions in the cold season. Furthermore, the 3D time series of the temperature and snow fraction were examined for the presence of correlation, as described in Section 2.4.
This study employed the precipitation dataset from version 2.8 of the Multi-Source Weighted-Ensemble Precipitation (MSWEP) dataset (https://www.gloh2o.org/mswep/; accessed on 23 March 2023), which is a fully global dataset with a 0.1° × 0.1° resolution derived by optimally merging a range of gauge, satellite, and reanalysis estimates [47]. This database contains daily precipitation values (mm/d) stored in NetCDF files, which were downloaded from shared Google Drive folders. Data covering the area of Poland were selected from the global domain to create a 3D-gridded dataset with dimensions of 60 × 110 × 14,610. For the analysis of spatial–temporal snowfall patterns, the air-temperature threshold approach was applied to partition the precipitation into rain and snow fractions [48]. Since the MSWEP data did not differentiate between rain and snow, it was assumed that all precipitation falls as snow if the air temperature is equal to or below the rain–snow temperature threshold and as rain if the air temperature is above said threshold. Observationally based estimates of the rain–snow threshold were acquired from Jennings et al. [48] within a 2D-gridded spatial domain. The original threshold data were prepared at a resolution of 0.5° × 0.625° (latitude × longitude) based on snowfall data from meteorological stations across the globe. This threshold is near the upper bound of the transition temperature, and for the Northern Hemisphere, it varies from −0.4 to 2.4 °C, averaging 1.0 °C for 95% of the stations. Across the country, the air-temperature threshold varies from 1.1 to 1.4 °C.
The spatial resolution of the air temperature threshold data was coarser than that of the MSWEP and E-OBS datasets; thus, resampling to a common resolution of 0.1° × 0.1° was necessary to keep the information from the finest layers. Using the 3D-gridded air-temperature dataset with dimensions of 60 × 110 × 14,610, a binary mask was prepared; grids with a temperature above the threshold were set to zero, while the remaining grids received a value of 1. This binary representation of the occurrence of snowfall was used as a mask to differentiate between snow and rain in daily precipitation data stored in the 3D matrix with dimensions of 60 × 110 × 14,610. Moreover, the daily snowfall values were accumulated into seasonal values for the NDJFMA season; thereby, the snow fraction of the total precipitation was found.
In this study, the snow fraction derived from threshold values (themselves adopted from Jennings et al. [48]) was validated against the snow fraction acquired from synoptic weather stations (Figure 2b, Table 1). The data from 42 synoptic weather stations were collected from a database of the Institute of Meteorology and Water Management in Poland (https://danepubliczne.imgw.pl/data/; accessed on 25 March 2024). Daily precipitation data contain information about the type of precipitation occurring during a given day, distinguishing between rain and snow (which were coded “W” and “S”, respectively). Snow-type precipitation as a term encompasses snow and mixed snow–rain precipitation; both are coded “S”. Their values were the result of daily data accumulated into 6-month sums for NDJFMA, and a multi-year mean snow fraction (Sf-station) for the period from 1981 to 2020 was calculated for each station. From gridded data, multi-year mean values (Sf-threshold) were extracted at pixels at which synoptic stations were located. Then, given two data series with 42 values each, a linear regression model was developed showing the relationship between observed data (O) and gridded data (G). Using the established linear equation, the gridded data were corrected to approximate the observed values. The accuracy of the corrected gridded data compared with the observed data was assessed via the coefficient of determination ():
where O—observed values, G —gridded values, and —mean values, and —number of comparisons (herein equal to number of synoptic stations used in the analysis). The value of represents an estimation of combined dispersion versus the single dispersion of the observed data and gridded data series. The strength of the Pearson’s correlation is qualified herein on the basis that the magnitude of is either very weak ( < 0.20), weak (0.20 ≤ ≤ 0.39), moderate (0.40 ≤ ≤ 0.59), strong (0.60 ≤ ≤ 0.79), or very strong (0.80 ≤ ≤ 1) [49]. Additionally, the accuracy of the gridded data in relation to the observed data was tested using the normalized root mean square error () and relative mean bias error ():
These accuracy measures were formerly used for comparisons of simulated and observed variables [50,51]. The is a measure of absolute error. The accuracy is assumed to be perfect if the is below 10%, good if the ranges from 10 to 20%, fair if the varies between 20 and 30%, and unreliable if it is over 30% [51]. The was used to estimate the underestimation (or overestimation).
Finally, forty-element time series of the air temperature (T) and corrected snow fraction were prepared to test our hypothesis on the presence of trends, as described in Section 2.3. The results were then used in the sensitivity analysis, as described in Section 2.5.
2.3. Detecting Cold-Season Trends in Air Temperature and Snow Fraction
A pixel-based trend analysis was applied to the time series of the temperature and snow fraction in the analyzed 3D spatial–temporal domain. The non-parametric, rank-based Mann–Kendall (MK) test was employed to detect trends in the 6-month cold seasons (NDJFMAs) of multiple years from 1981 to 2020. The MK test is commonly used for detecting monotonic trends in a hydrometeorological series of data [52]. The Climate Data Toolbox (CDT) for MATLAB [53] was used to calculate the significance of trends using the MK test statistic. Trends were tested against a significance threshold of 0.05. Subsequently, computation of the magnitude of said trends (i.e., the trend rate) was carried out separately and derived via ordinary least squares calculations; we used the “trend” function in the CDT, which was designed for analyses of 3D datasets. The trend rate was assumed to be equal to the slope of the trend line. As a result, trend rates for the temperature (, °C/decade) and snow fraction (, %/decade) were determined in order to reveal multi-year changes. When the p-value fell above the significance threshold, the magnitude of the change was referred to as the tendency rate.
2.4. Identifying Snow Fraction–Temperature Correlation
Variations in the snowfall characteristics depend on the climate, atmospheric circulation, and meteorological and terrestrial conditions. However, over the transiently snowy regions of Europe, snow cover fluctuations are largely determined by temperature [19], which is also the case in the lowland-dominated environment of Poland. To reveal the dependence of snow fraction on air temperature over several years from 1981 to 2020, the non-parametric Spearman’s rank-order correlation coefficient () was calculated and evaluated at a significance level of alpha = 0.05. This metric serves to elucidate the relationship between two variables (rank values) without making any assumptions about the frequency distribution of the variables. The strength of the Spearman’s correlation is qualified herein on the basis that the magnitude of is either very weak (), weak (), moderate (), strong (), or very strong () [54]. A Spearman’s correlation analysis was performed on a grid-cell scale for a given snow fraction and temperature. The calculations were performed in the MATLAB R2023 environment.
2.5. Defining the Snow Fraction Sensitivity Index
A common approach to investigating the response of water resources to climate change is the application of the elasticity concept [55]. Here, it was used to reveal the sensitivity of the interaction between changes in the air temperature and the snow fraction. Following the approach proposed by Andréassian et al. [56], the snow-fraction sensitivity index, , is defined here as
where Sf is the snow fraction of total precipitation, is the trend rate of the snow fraction expressed as percentage per decade (%/decade), is the trend rate of the air temperature expressed in degrees Celsius per decade (°C/decade), and is expressed as a percentage per degrees Celsius (%/°C). The trend rate of snow fraction and the trend rate of temperature are calculated as a slope of a line fitted to the time series described in Section 2.3. Said metrics allowed us to quantify the responsiveness of the snow fraction to changes in air temperature. In the case of a decreasing trend in snow fraction and an increasing trend in temperature, values of snow fraction sensitivity will be negative. When an increase in the snow fraction is associated with an increase in temperature, values of snow fraction sensitivity will be positive.
2.6. Predicting Patterns in the Snow Fraction in the Middle of the Twenty-First Century
As this study sets out to detect the spatial–temporal response of the snow fraction to changing temperature on a national scale, we propose a proxy for the detection of future snow patterns. Assuming that the snow fraction will continue to change in accordance with warming at the current pace, the reduction in the snow fraction is estimated in the short term as the snow fraction trend rate multiplied by the number of decades into the future for which the prediction is made. Two scenarios are assumed: the first scenario is based on the 1981–2020 Sf average, and the second scenario uses the Sf average of the last 10 years (2011–2020) as its starting condition. Hence, the predicted snow fraction for the first scenario can be calculated as follows:
where is the average snow fraction in a particular cold season within the 1981–2020 period expressed as a percentage (%); is the trend rate of the snow fraction over the years 1981–2020, which is expressed as a percentage per decade (%/decade); and is the number of decades into the future for which the prediction is made (in this case, . Similarly, the snow fraction in the second scenario can be estimated using the following equation:
The projections were prepared for a 6-month period (i.e., for the NDJFMA season). Then, the predicted spatial patterns were compared with historical records from 1981–2020 and 2011–2020. The areas within the country were defined either as rain-dominated, transitional, or snow-dominated based on classification criteria applied by Elsner et al. [57]. Rain-dominated areas were assumed to have a snow fraction of less than 0.1, transient rain–snow areas to have a snow fraction of 0.1–0.4, and snow-dominated areas to have a snow fraction greater than 0.4. Alterations in snow fraction patterns were revealed after accounting for changes in areas divided into these three categories.
3. Results
3.1. Validation of Gridded Snow Fraction Data
To initiate the analysis (Figure 1), we compared the snow fraction calculated via the threshold approach (Sf-threshold) with the snow fraction data acquired at synoptic stations (Sf-station). From gridded data, Sf-threshold-derived values were extracted at station’s pixels and compared with Sf-station data. Multi-year mean values of the Sf from 1981 to 2020 were compared (Figure 3a), and the coefficient of determination () was found to be high (0.87). The Pearson’s correlation coefficient () was 0.93, indicating a very strong correlation. However, the and values indicated a mismatch between gridded data and station data; the calculated values were 34% and −32%, respectively. Thus, the threshold-derived data fell shy of the station-derived data; therefore, a corrective procedure was applied to the threshold-derived data. The corrected, gridded values were calculated from the following equation: Sf-corrected = 0.918 × Sf-gridded + 18.5 (Figure 3a). Subsequently, the accuracy of the corrected data was reassessed (Figure 3b). The coefficient of determination remained high, while error metrics improved; the and decreased significantly to 10% and −2.2%, respectively. After excluding mountainous stations at high elevations (Table 1: Kasprowy Wierch, Śnieżka and Zakopane), the accuracy measures slightly improved; the and equaled 8% and −1.6%, respectively. Thus, our correction significantly reduced discrepancies between the multi-year mean Sf values of gridded- and station-derived data. The next four steps of the analysis, as detailed in Figure 1, were performed with gridded data also corrected in this manner. Notably, multi-year mean values of snow fraction trend rates (ΔSf) for the 1981–2020 period were also compared (Figure 3c). The coefficient of determination shows that most of the variance in the observed trend rates can be attributed to the regression model. However, the scattering of points is broad, and no clear relationship is indicated. For this reason, no further adjustment was applied.
3.2. The Snow Fraction within the Multi-Year Period from 1981 to 2020
Figure 4a shows the climatic pattern (mean state) of the snow fraction () for the 6-month cold season (NDJFMA) within the multi-year period of 1981–2020. The magnitude of the snow fraction varies across the country. The snow fraction increases from values of no more than 40% in the west and northwest to values of 41–50% in central Poland, reaching 51–60% in the eastern part. The highest values of over 90% occur in the mountainous region of the south. Generally, the western area of the country has lower snow fraction values than the eastern region. Most of the country features decreasing snow fraction trends or tendencies that are marked by negative values (Figure 4b). Relatively high rates of decline are of around 5–6.5% per decade and occur fragmentarily in the north, east, and southwest. In central Poland, decrements of 2–3.9% per decade predominate. In the majority of the country (59%), we observed statistically significant and decreasing trends in the snow fraction, which are marked with black points in Figure 4b. It should be noted that only in the high parts of the mountains in the south is there a positive tendency in the snow fraction, which reached up to 1.1%/decade. However, this applies to a very limited area (Figure 4b).
3.3. Air Temperature in the Multi-Year Period of 1981–2020
Figure 5a shows the climatic pattern (mean state) of the temperature within the 6-month cold season (NDJFMA) in the multi-year period from 1981 to 2020. There are clear differences between the eastern and western parts of Poland. The temperature decreases from the west, through central Poland, to the east and northeast. The prevailing temperatures are in the range of 1.6–3.5 °C. The lowest values, those below –2.5 °C, occur within a very limited area in the mountains. The whole country has experienced climate warming from 0.3 to 0.7 °C/decade (Figure 5b). The dominant trend rate is within the range of 0.51–0.6 °C/decade, and the spatial average of this increase is 0.5 °C/decade. Statistically significant changes at α = 0.05 have occurred for almost all of the country.
3.4. Diminishing Snow as Marked by the Snow Fraction Sensitivity Index
Figure 6a shows the Spearman’s correlation coefficient () calculated for a 40-element time series of air temperature and snow fraction during the cold seasons (NDJFMA) of the multi-year period from 1981 to 2020. The correlation coefficient, , is negative for the whole country, revealing that higher temperatures are accompanied by a lower snow fraction. The correlation is significant at α = 0.05 across the whole territory of Poland, as indicated by the black hatches in Figure 6a. Very strong and strong correlations are present in 99% of the country’s territory, while only 1% of the total area indicates a moderate correlation. Generally, there is a strong relationship between snow fraction and temperature. Thus, these two metrics can be linked in the snow fraction sensitivity index shown in Figure 6b.
The snow fraction sensitivity index varies significantly among regions (Figure 6b). In most of the country, this index has negative values, indicating how the snow fraction decreases when the temperature increases. When utilizing a relatively minimally spatially differentiated temperature trend rate (Figure 5b), the index follows the pattern revealed by the snow fraction trend rate (Figure 4b). The highest decreases were within the range of 7 to more than 13%/°C and extended along a strip in the north, northeast, and east (Figure 6b). Values toward the top end of this range appeared fragmentarily in the southwest. Most of the country experienced a decrease of 3 to 6.9%/°C. Only locally in the high mountains did the index have positive values, showing a tendency of the snow fraction to increase alongside temperature; this applied to a very limited mountainous area.
3.5. Predicted Changes in Snow Fraction
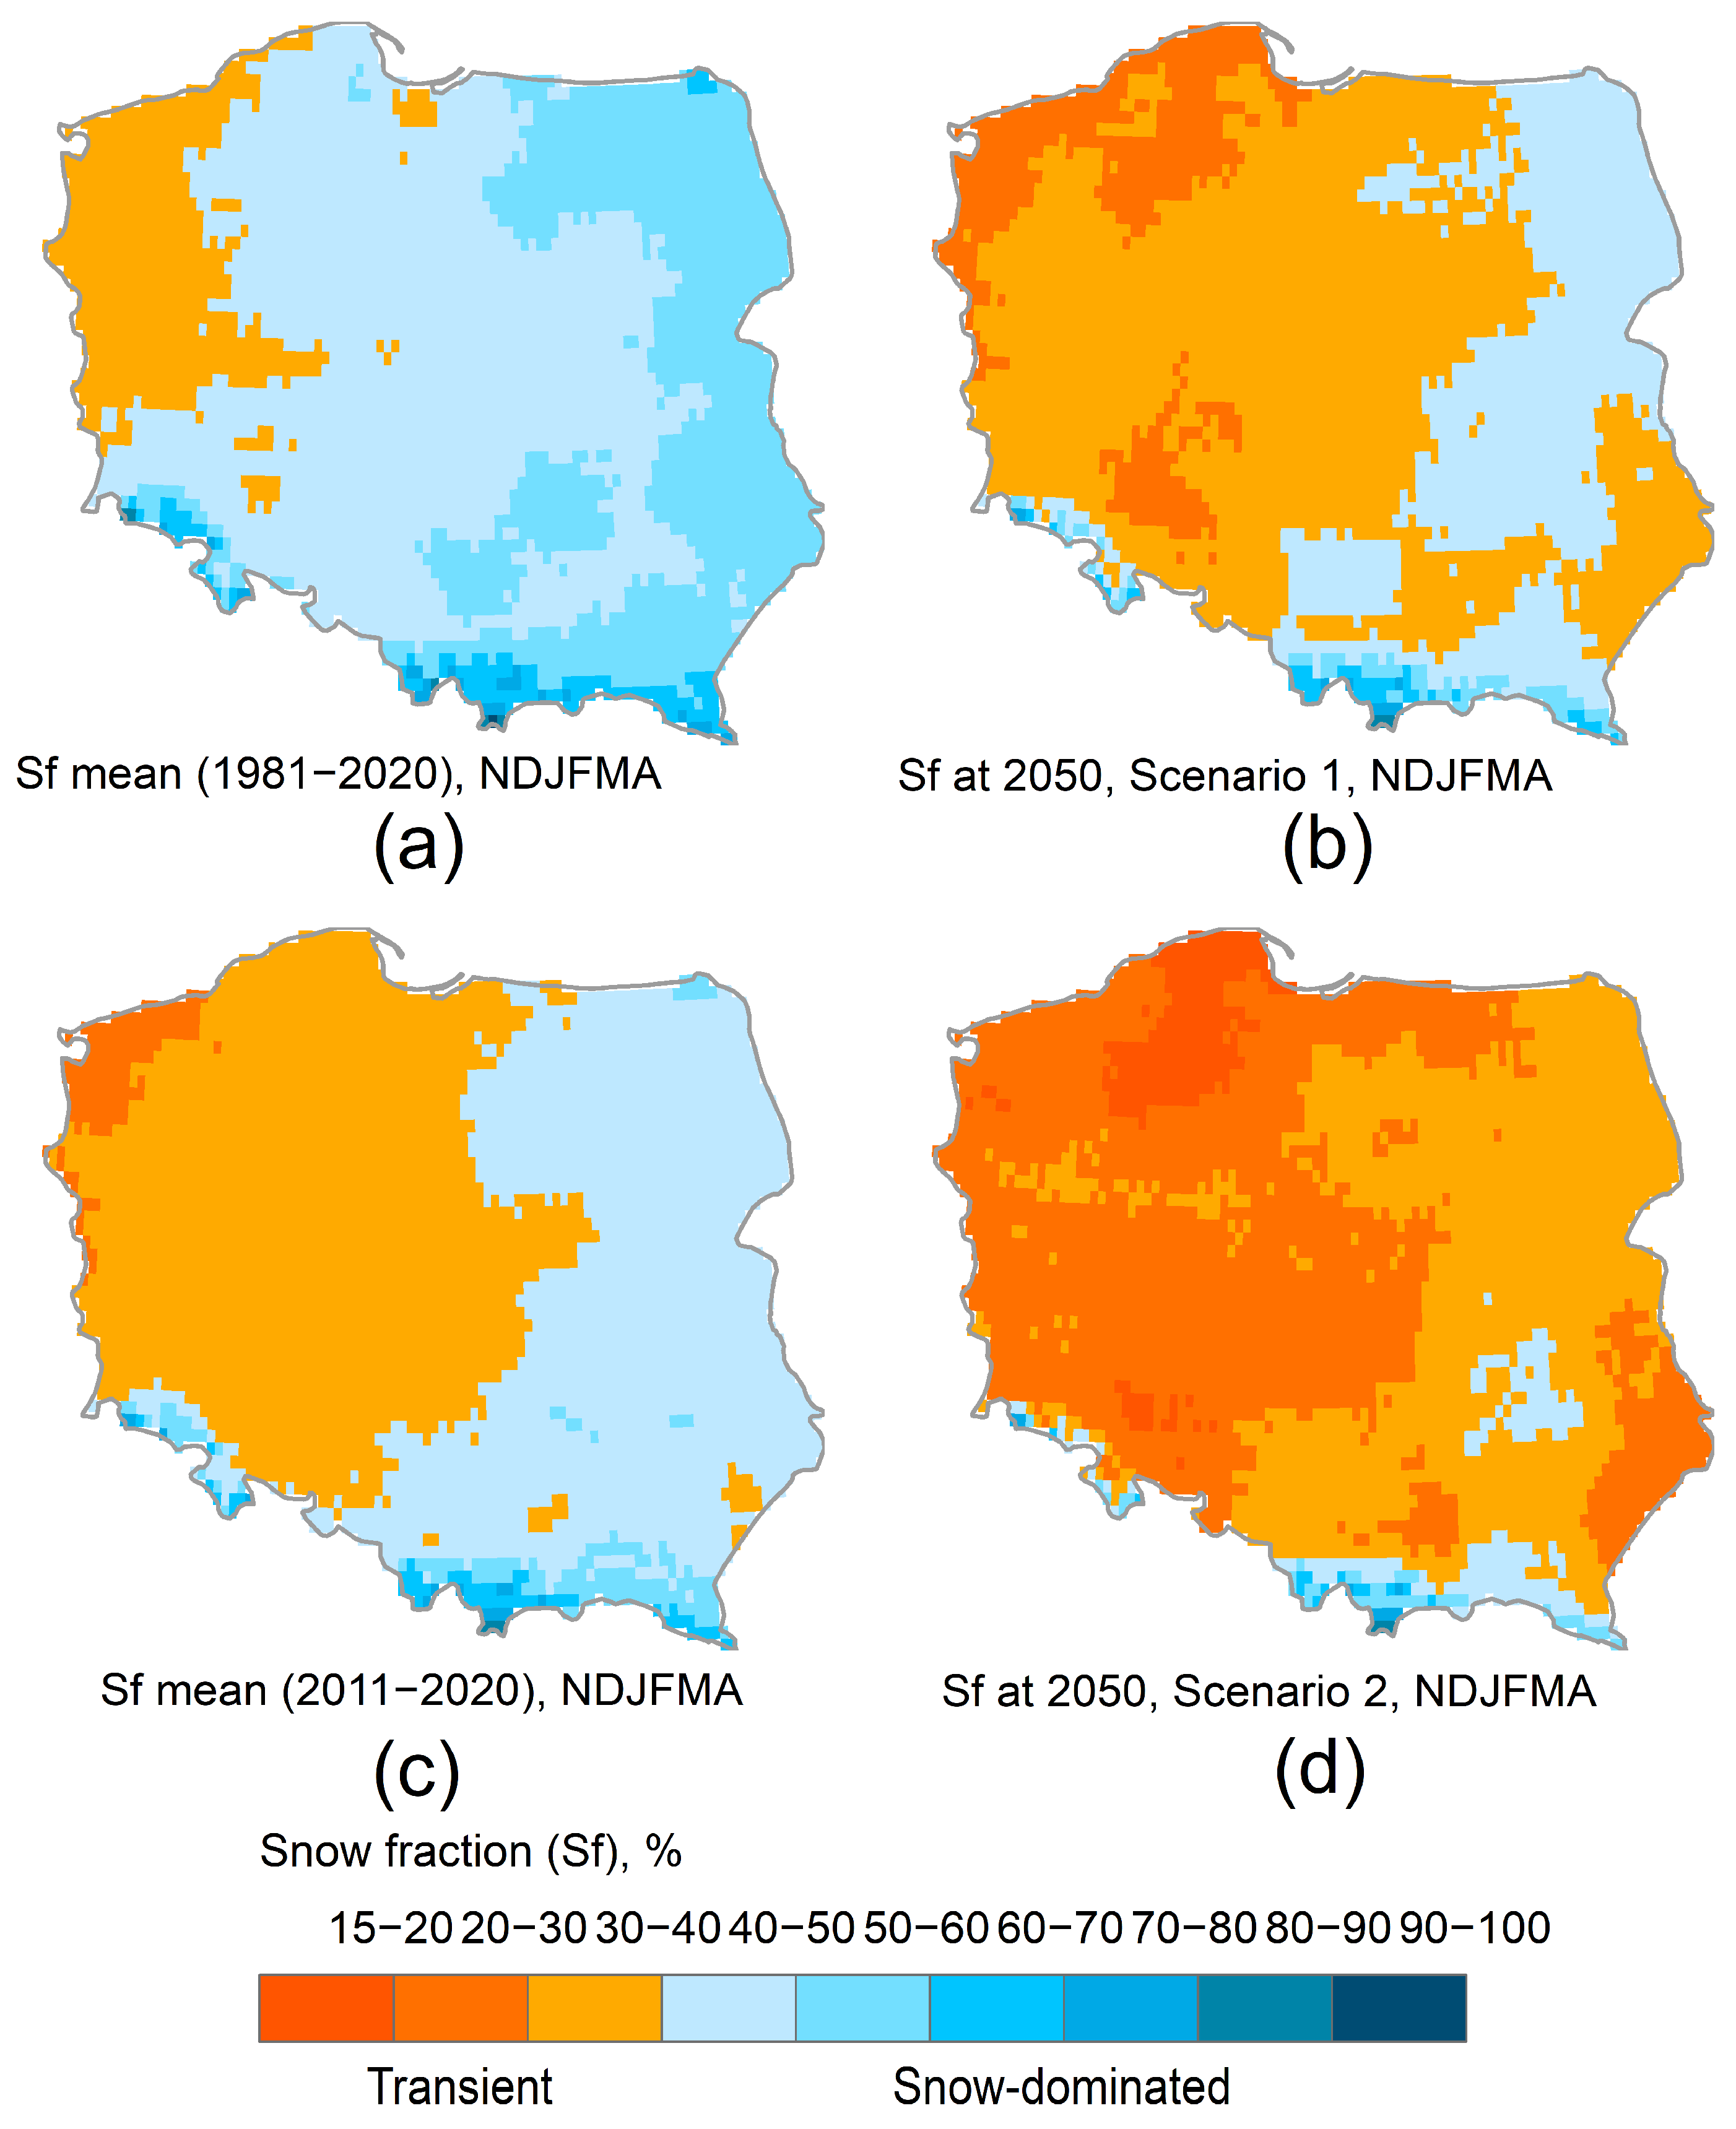
The potential impacts of climate warming on the snow fraction were predicted in the short term using the snow fraction trend rate calculated for 1981–2020 (Figure 7). With an average countrywide temperature increase of ~0.5 °C/decade over the past 40 years, Sf decreased at a rate of ~3%/decade in the cold season (NDJFMA). Projected changes in Sf for the middle of the twenty-first century are summarized in Table 2. The projections indicate that, by the 2050s, in the assumed scenarios 1 and 2, we will witness significant changes in the spatial patterns of Sf. From 1981 to 2020, 86% of the country’s area could be described as having snow-dominated conditions (Figure 7a), while over the last 10 years (2011–2020), these snow-dominated areas have decreased to cover only 48% of the country (Figure 7c). Using the 40-year Sf averages as a starting point, we can estimate a reduction in snow-dominated areas from 86% to 30% (scenario 1, Figure 7b).
Using the average conditions of the last 10 years (2011–2020) as a starting point indicates that the proportion of snow-dominated areas in Poland may be even lower than projected, at just 6% (Figure 7d). In addition to the disappearance of snow-dominated areas, there may be a significant increase in the proportion of land occupied by transitional regions (up to 70% (scenario 1, Figure 7b) and up to 94% (scenario 2, Figure 7d)). The emergence of rain-dominated regions with an Sf of up to 10% has not yet been predicted.
4. Discussion
Our 40-year historical record of daily snow accumulation, aggregated for the cold season (NDJFMA), shows that snow makes up ~32–91% of the total precipitation. Under the influence of the observed ongoing warming, the 10-year sub-period from 2011 to 2020 was an average of ~0.9 °C warmer than the period from 1981 to 2020, and the snow fraction was within the much lower range of ~28–89%. The spatial averages for these two time periods are 47% and 39%, respectively. Typically, higher fractions are associated with higher altitudes. However, across Poland, which is dominated by lowlands, there is a clear longitudinal division; the warmer western part is characterized by a relatively low share of snow, unlike the eastern and northeastern parts. This finding is consistent with previous climatic works in which the meridian of 19°E is conventionally accepted as the boundary between the warm western zone and the cooler eastern zone [44]. This is attributed to the dominant influence of maritime and continental air masses above Poland, which shape thermal seasons and the transient character of the climate. Maritime air masses flowing from the Atlantic Ocean most frequently bring warming in winter, while dry polar continental air masses coming from the east bring frost. The average cold-season temperatures in the northwest are above 2.5 °C, while they drop to almost 0 °C in the northeast (Figure 5a). In summary, this thermal pattern shows a typical east–west gradient, which is similarly expressed in the zonal distribution of the snow fraction values contained in this work.
This study demonstrated that warming temperatures have caused the seasonal snow fraction to dwindle from 1981 to 2020. This finding supports the hypothesis that higher cold-season (NDJFMA) temperatures have decreased the snow fraction remarkably over the past four decades. Only in the mountain sub-region was there an increasing tendency in the snow fraction, which followed an increase in the temperature; that said, both tendencies were not statistically significant (Figure 4b and Figure 5b). This exception concerned approximately 0.3% of the country’s territory, over which the warming rate was relatively low. Such a finding is consistent with other studies that have reported a positive correlation between snowfall and temperature in colder regions (for high latitudes or at high altitudes), which for the most part is due to their increased atmospheric water content. Higher temperatures increase atmospheric water vapor, which allows for potentially more snowfall if temperatures remain sufficiently low for snowfall to occur [13]. Across the whole territory of Poland, the snow fraction is strongly correlated with temperature, and the Sf-T correlation is negative. For this reason, the snow fraction was employed to define the snow fraction sensitivity index.
This study provides evidence that the snow fraction is principally controlled by temperature, as hypothesized. Based on this finding, we analyzed the spatial patterns of the sensitivity of snow to warming, identifying significant differences between various locations that have also been reported in other studies [58]. The regions of the highest Sf changes over the last 40 years were localized in a spatially explicit way using gridded climatic datasets. The snow fraction sensitivity index provides an estimate of the regions in which reductions in the Sf are the most pronounced after a 1 °C increase in temperature. Such an approach expresses sensitivity as the change in snow fraction per unit of temperature change and has previously been utilized by Mudryk et al. [40]; however, these authors used the fractional change in snow cover. Here, the use of the snow fraction sensitivity index revealed the locations at which the strongest negative Sf changes occurred and showed that the eastern part of the country has greater sensitivity than the western part. The applied sensitivity approach is essential to recognizing the rate of warming-induced snow water losses and detecting places with vulnerable snow water resources.
Considering ongoing climate warming, a reduction in the seasonal snow fraction was predicted by our linear trend analysis. Assuming that the current rate of Sf change continues in the near future, the snow fraction is projected to decrease in most regions of the country, excluding the high mountains in the south. This robust linear trend approach may constitute a limitation, but in the short to medium term, assuming no meaningful changes in trend rate, it may be useful for identifying locations undergoing the transition from being snow-dominated to more transient. The results of this analysis correspond well with those of large-scale studies that have reported reductions in snowfall in midlatitudes in both past and future scenarios [18,23,59].
It is worth noting that rain–snow phase partitioning based on a given temperature threshold is commonly applied for large-scale investigations, although different thresholds are applied [60]. For example, Quante et al. [13] assumed that snow occurred if the surface temperature was below 0 °C. Newton et al. [61] used a 1 °C threshold, whereas Ford et al. [62] used a 1.5 °C threshold and Liu et al. [63] used a 2 °C threshold. In this study, the initially adopted threshold temperature of ~1.2 °C turned out to be too low to approximate the snow fraction estimated at synoptic stations. In such cases, different bias corrections may be applied to obtain an improved estimate of snow fraction based on specific statistical properties [50,64]. Here, when considering the entire domain of the country, mean bias correction was introduced to adjust our multi-year mean values of snow fraction without adjusting the temperature threshold. This procedure affected our estimations of the snow fraction, increasing the initially assumed values to more closely resemble those estimated on the ground. While ground-surface measurements are treated as the primary reference, it is important to remark that a large disparity may exist between point-scale data and grid-averaged data. Topographic diversity and local geographic conditions, especially in regions with a large hypsometric gradients, may cause large differences [51]. Such a situation was observed in this study. Snow fraction values at highly elevated stations differed significantly from gridded estimates, while lowland locations produced more similar results. As the snow fraction trend rates from reconstructed gridded data were, on average, lower than those observed at synoptic stations, the rate of snow’s disappearance under future warming conditions may locally proceed even faster than indicated here. It is worth noting that our coding of precipitation phases may also have added to the uncertainty, as daily codes in synoptic messages are intended for both solid and mixed phases (without taking into account the percentage of each proportion), although they constitute the core reference for multi-year investigations.
5. Conclusions
This study presents an analysis of reconstructed snowfall conditions across the territory of Poland for the period of 1981–2020. The snow fraction sensitivity index reproduces spatially and temporally consistent patterns of decreasing snowfall in response to the gradually warming climate in the cold season of the year (NDJFMA). The elasticity approach linked highly correlated temperature and snow fraction variables. The snow fraction index introduced herein captures long-term trends in diminishing snowfall, indicating the areas that are most prone to snow degradation. Our results suggest that there are significant spatial differences in the responsiveness of the snow fraction to thermal conditions. Projected snowfall conditions for the middle of the twenty-first century suggest that further changes will occur. Thanks to the ongoing cold-season warming, snow-dominated areas may be reduced from covering 86% to covering 30% of the country’s surface; these areas will be converted into rain–snow transient areas.
Overall, the methodology applied here allows for the reconstruction of gridded snow fraction data, providing a solid basis for projections and studies of the impact of climate change. This methodology may be applied to other lowland-dominated regions in which snowfall conditions are largely controlled by temperature. Our single-threshold method, supported by a validation procedure, is capable of providing a reliable reconstruction of snowfall conditions in regionally focused studies in a fast and computationally efficient way. Here, a single-adjustment method was applied, enabling us to relay the average values of in situ data; in the future, we may incorporate an additional procedure to adjust the other statistical properties of measured data.
These regionally focused investigations provide more detailed insights into changes in snowfall patterns, serving to complement studies on a global scale. To optimize water management and global warming mitigation policies, improved insight into the redistribution of snow and water is vital. More studies are needed to uncover the complex feedback system in the hydrosphere to further the necessary transition to climate-resilient systems.
Funding
This research was founded by the Faculty of Geography and Regional Studies at the University of Warsaw in Poland (grant numbers SWIB47/2023, SWIB59/2023, and SWIB23/2024).
Data Availability Statement
All of the data used during this study are available at the locations cited in the Acknowledgements Section.
Acknowledgments
The author thanks the editors and reviewers for their insightful comments and helpful suggestions. The author acknowledges the MSWEP dataset (version 3.5z), which is available via https://www.gloh2o.org/mswep/ (accessed on 23 March 2023). The author also acknowledges the E-OBS dataset (version 25.0e) from the EU-FP6 project ENSEMBLES (http://ensembles-eu.metoffice.com; accessed on 19 June 2022) and the data providers of the ECA&D project (http://www.ecad.eu; accessed on 19 June 2022); version 25.0e of the dataset was downloaded from the Copernicus Climate Change Service at https://surfobs.climate.copernicus.eu/dataaccess/access_eobs.php (accessed on 19 June 2022). The author also acknowledges the gridded Northern Hemisphere 50% rain–snow Ts threshold product (a formatted version of the observational dataset), which was downloaded from the DRYAD: spatial variations in the rain–snow temperature threshold across the Northern Hemisphere (https://doi.org/10.5061/dryad.c9h35) (accessed on 31 January 2022). Additionally, the author acknowledges the meteorological data, which are available via https://danepubliczne.imgw.pl/data/ (accessed on 25 March 2024) and were prepared by the Institute of Meteorology and Water Management in Poland.
Conflicts of Interest
The author declares no conflict of interest. The funders had no role in the design of the study; in the collection, analyses, or interpretation of data; in the writing of the manuscript; or in the decision to publish the results.
References
- Sturm, M.; Goldstein, M.A.; Parr, C. Water and Life from Snow: A Trillion Dollar Science Question. Water Resour. Res. 2017, 53, 3534–3544. [Google Scholar] [CrossRef]
- Peters-Lidard, C.D.; Rose, K.C.; Kiang, J.E.; Strobel, M.L.; Anderson, M.L.; Byrd, A.R.; Kolian, M.J.; Brekke, L.D.; Arndt, D.S. Indicators of Climate Change Impacts on the Water Cycle and Water Management. Clim. Change 2021, 165, 36. [Google Scholar] [CrossRef]
- Wieder, W.R.; Kennedy, D.; Lehner, F.; Musselman, K.N.; Rodgers, K.B.; Rosenbloom, N.; Simpson, I.R.; Yamaguchi, R. Pervasive Alterations to Snow-Dominated Ecosystem Functions under Climate Change. Proc. Natl. Acad. Sci. USA 2022, 119, e2202393119. [Google Scholar] [CrossRef]
- Trenberth, K.E. Changes in Precipitation with Climate Change. Clim. Res. 2011, 47, 123–138. [Google Scholar] [CrossRef]
- Harpold, A.A.; Molotch, N.P. Sensitivity of Soil Water Availability to Changing Snowmelt Timing in the Western U.S. Geophys. Res. Lett. 2015, 42, 8011–8020. [Google Scholar] [CrossRef]
- Kang, D.H.; Gao, H.; Shi, X.; Islam, S.U.; Déry, S.J. Impacts of a Rapidly Declining Mountain Snowpack on Streamflow Timing in Canada’s Fraser River Basin. Sci. Rep. 2016, 6, 19299. [Google Scholar] [CrossRef]
- Dierauer, J.R.; Allen, D.M.; Whitfield, P.H. Climate Change Impacts on Snow and Streamflow Drought Regimes in Four Ecoregions of British Columbia. Can. Water Resour. J. Rev. Can. Ressour. Hydr. 2021, 46, 168–193. [Google Scholar] [CrossRef]
- Crausbay, S.D.; Ramirez, A.R.; Carter, S.L.; Cross, M.S.; Hall, K.R.; Bathke, D.J.; Betancourt, J.L.; Colt, S.; Cravens, A.E.; Dalton, M.S.; et al. Defining Ecological Drought for the Twenty-First Century. Bull. Am. Meteorol. Soc. 2017, 98, 2543–2550. [Google Scholar] [CrossRef]
- Qi, Y.; Wang, H.; Ma, X.; Zhang, J.; Yang, R. Relationship between Vegetation Phenology and Snow Cover Changes during 2001–2018 in the Qilian Mountains. Ecol. Indic. 2021, 133, 108351. [Google Scholar] [CrossRef]
- Jenicek, M.; Ledvinka, O. Importance of Snowmelt Contribution to Seasonal Runoff and Summer Low Flows in Czechia. Hydrol. Earth Syst. Sci. 2020, 24, 3475–3491. [Google Scholar] [CrossRef]
- Vlach, V.; Ledvinka, O.; Matouskova, M. Changing Low Flow and Streamflow Drought Seasonality in Central European Headwaters. Water 2020, 12, 3575. [Google Scholar] [CrossRef]
- Hotovy, O.; Nedelcev, O.; Jenicek, M. Changes in Rain-on-Snow Events in Mountain Catchments in the Rain–Snow Transition Zone. Hydrol. Sci. J. 2023, 68, 572–584. [Google Scholar] [CrossRef]
- Quante, L.; Willner, S.N.; Middelanis, R.; Levermann, A. Regions of Intensification of Extreme Snowfall under Future Warming. Sci. Rep. 2021, 11, 16621. [Google Scholar] [CrossRef]
- Moraga, J.S.; Peleg, N.; Fatichi, S.; Molnar, P.; Burlando, P. Revealing the Impacts of Climate Change on Mountainous Catchments through High-Resolution Modelling. J. Hydrol. 2021, 603, 126806. [Google Scholar] [CrossRef]
- Dong, W.; Ming, Y. Seasonality and Variability of Snowfall to Total Precipitation Ratio over High Mountain Asia Simulated by the GFDL High-Resolution AM4. J. Clim. 2022, 35, 5573–5589. [Google Scholar] [CrossRef]
- Ford, C.M.; Kendall, A.D.; Hyndman, D.W. Snowpacks Decrease and Streamflows Shift across the Eastern US as Winters Warm. Sci. Total Environ. 2021, 793, 148483. [Google Scholar] [CrossRef] [PubMed]
- Aygün, O.; Kinnard, C.; Campeau, S. Impacts of Climate Change on the Hydrology of Northern Midlatitude Cold Regions. Prog. Phys. Geogr. 2020, 44, 338–375. [Google Scholar] [CrossRef]
- Fontrodona Bach, A.; van der Schrier, G.; Melsen, L.A.; Klein Tank, A.M.G.; Teuling, A.J. Widespread and Accelerated Decrease of Observed Mean and Extreme Snow Depth Over Europe. Geophys. Res. Lett. 2018, 45, 12312–12319. [Google Scholar] [CrossRef]
- Clark, M.P.; Serreze, M.C.; Robinson, D.A. Atmospheric Controls on Eurasian Snow Extent. Int. J. Climatol. 1999, 19, 27–40. [Google Scholar] [CrossRef]
- Räisänen, J. Warmer Climate: Less or More Snow? Clim. Dyn. 2008, 30, 307–319. [Google Scholar] [CrossRef]
- Lin, W.; Chen, H. Changes in the Spatial–Temporal Characteristics of Daily Snowfall Events over the Eurasian Continent from 1980 to 2019. Int. J. Climatol. 2022, 42, 1841–1853. [Google Scholar] [CrossRef]
- Krasting, J.P.; Broccoli, A.J.; Dixon, K.W.; Lanzante, J.R. Future Changes in Northern Hemisphere Snowfall. J. Clim. 2013, 26, 7813–7828. [Google Scholar] [CrossRef]
- Ombadi, M.; Risser, M.D.; Rhoades, A.M.; Varadharajan, C. A Warming-Induced Reduction in Snow Fraction Amplifies Rainfall Extremes. Nature 2023, 619, 305–310. [Google Scholar] [CrossRef]
- Graczyk, D.; Pińskwar, I.; Kundzewicz, Z.W.; Hov, Ø.; Førland, E.J.; Szwed, M.; Choryński, A. The Heat Goes on—Changes in Indices of Hot Extremes in Poland. Theor. Appl. Climatol. 2017, 129, 459–471. [Google Scholar] [CrossRef]
- Kundzewicz, Z.W.; Piniewski, M.; Mezghani, A.; Okruszko, T.; Pińskwar, I.; Kardel, I.; Hov, Ø.; Szcześniak, M.; Szwed, M.; Benestad, R.E.; et al. Assessment of Climate Change and Associated Impact on Selected Sectors in Poland. Acta Geophys. 2018, 66, 1509–1523. [Google Scholar] [CrossRef]
- Ghazi, B.; Przybylak, R.; Pospieszyńska, A. Projection of Climate Change Impacts on Extreme Temperature and Precipitation in Central Poland. Sci. Rep. 2023, 13, 18772. [Google Scholar] [CrossRef]
- Ustrnul, Z.; Wypych, A.; Czekierda, D. Air Temperature Change. In Climate Change in Poland. Springer Climate; Springer: Cham, Switzerland, 2021; pp. 275–330. [Google Scholar] [CrossRef]
- Szwed, M. Projections of Temperature Changes in Poland. In Climate Change in Poland. Springer Climate; Springer: Cham, Switzerland, 2021; pp. 513–528. [Google Scholar] [CrossRef]
- Łupikasza, E.; Małarzewski, Ł. Precipitation Change. In Climate Change in Poland. Springer Climate; Springer: Cham, Switzerland, 2021; pp. 349–373. [Google Scholar] [CrossRef]
- Falarz, M.; Nowosad, M.; Bednorz, E.; Rasmus, S. Review of Polish Contribution to Snow Cover Research (1880–2017). Quaest. Geogr. 2018, 37, 7–22. [Google Scholar] [CrossRef]
- Falarz, M.; Bednorz, E. Snow Cover Change. In Climate Change in Poland. Springer Climate; Springer: Cham, Switzerland, 2021; pp. 375–390. [Google Scholar] [CrossRef]
- Tomczyk, A.M.; Bednorz, E.; Szyga-Pluta, K. Changes in Air Temperature and Snow Cover in Winter in Poland. Atmosphere 2021, 12, 68. [Google Scholar] [CrossRef]
- Łupikasza, E.B.; Małarzewski, Ł. Trends in the Indices of Precipitation Phases under Current Warming in Poland, 1966–2020. Adv. Clim. Chang. Res. 2023, 14, 97–115. [Google Scholar] [CrossRef]
- Wibig, J.; Jędruszkiewicz, J. Recent Changes in the Snow Cover Characteristics in Poland. Int. J. Climatol. 2023, 43, 6925–6938. [Google Scholar] [CrossRef]
- Luce, C.H.; Lopez-Burgos, V.; Holden, Z. Sensitivity of Snowpack Storage to Precipitation and Temperature Using Spatial and Temporal Analog Models. Water Resour. Res. 2014, 50, 9447–9462. [Google Scholar] [CrossRef]
- Howat, I.M.; Tulaczyk, S. Climate Sensitivity of Spring Snowpack in the Sierra Nevada. J. Geophys. Res. Earth Surf. 2005, 110, F04021. [Google Scholar] [CrossRef]
- Ye, H.; Cohen, J. A Shorter Snowfall Season Associated with Higher Air Temperatures over Northern Eurasia. Environ. Res. Lett. 2013, 8, 014052. [Google Scholar] [CrossRef]
- Safeeq, M.; Shukla, S.; Arismendi, I.; Grant, G.E.; Lewis, S.L.; Nolin, A. Influence of Winter Season Climate Variability on Snow–Precipitation Ratio in the Western United States. Int. J. Climatol. 2016, 36, 3175–3190. [Google Scholar] [CrossRef]
- Bonsoms, J.; López-Moreno, J.I.; Alonso-González, E. Snow Sensitivity to Temperature and Precipitation Change during Compound Cold-Hot and Wet-Dry Seasons in the Pyrenees. Cryosphere 2023, 17, 1307–1326. [Google Scholar] [CrossRef]
- Mudryk, L.R.; Kushner, P.J.; Derksen, C.; Thackeray, C. Snow Cover Response to Temperature in Observational and Climate Model Ensembles. Geophys. Res. Lett. 2017, 44, 919–926. [Google Scholar] [CrossRef]
- Sankarasubramanian, A.; Vogel, R.M.; Limbrunner, J.F. Climate Elasticity of Streamflow in the United States. Water Resour. Res. 2001, 37, 1771–1781. [Google Scholar] [CrossRef]
- Solon, J.; Borzyszkowski, J.; Bidłasik, M.; Richling, A.; Badora, K.; Balon, J.; Brzezińska-Wójcik, T.; Chabudziński, Ł.; Dobrowolski, R.; Grzegorczyk, I.; et al. Physico-Geographical Mesoregions of Poland: Verification and Adjustment of Boundaries on the Basis of Contemporary Spatial Data. Geogr. Pol. 2018, 91, 143–170. [Google Scholar] [CrossRef]
- Kottek, M.; Grieser, J.; Beck, C.; Rudolf, B.; Rubel, F. World Map of the Köppen-Geiger Climate Classification Updated. Meteorol. Z. 2006, 15, 259–263. [Google Scholar] [CrossRef]
- Czernecki, B.; Miętus, M. The Thermal Seasons Variability in Poland, 1951–2010. Theor. Appl. Climatol. 2017, 127, 481–493. [Google Scholar] [CrossRef]
- Choi, G.; Robinson, D.A.; Kang, S. Changing Northern Hemisphere Snow Seasons. J. Clim. 2010, 23, 5305–5310. [Google Scholar] [CrossRef]
- Cornes, R.C.; van der Schrier, G.; van den Besselaar, E.J.M.; Jones, P.D. An Ensemble Version of the E-OBS Temperature and Precipitation Data Sets. J. Geophys. Res. Atmos. 2018, 123, 9391–9409. [Google Scholar] [CrossRef]
- Beck, H.E.; Wood, E.F.; Pan, M.; Fisher, C.K.; Miralles, D.G.; Van Dijk, A.I.J.M.; McVicar, T.R.; Adler, R.F. MSWep v2 Global 3-Hourly 0.1° Precipitation: Methodology and Quantitative Assessment. Bull. Am. Meteorol. Soc. 2019, 100, 473–500. [Google Scholar] [CrossRef]
- Jennings, K.S.; Winchell, T.S.; Livneh, B.; Molotch, N.P. Spatial Variation of the Rain-Snow Temperature Threshold across the Northern Hemisphere. Nat. Commun. 2018, 9, 1148. [Google Scholar] [CrossRef] [PubMed]
- Pearson’s Correlation. Available online: https://www.statstutor.ac.uk/resources/uploaded/pearsons.pdf (accessed on 2 April 2024).
- Danielescu, S. Snowfall and Rainfall Estimation Tool (SNOWFALL BUDDY)—A Web-Based Tool. Reference Manual. 2022. Available online: https://sbuddy.hydrotools.tech (accessed on 25 March 2024).
- Nouri, M.; Homaee, M. Spatiotemporal Changes of Snow Metrics in Mountainous Data-Scarce Areas Using Reanalyses. J. Hydrol. 2021, 603, 126858. [Google Scholar] [CrossRef]
- Radziejewski, M.; Kundzewicz, Z.W. Detectability of Changes in Hydrological Records. Hydrol. Sci. J. 2004, 49, 39–51. [Google Scholar] [CrossRef]
- Greene, C.A.; Thirumalai, K.; Kearney, K.A.; Delgado, J.M.; Schwanghart, W.; Wolfenbarger, N.S.; Thyng, K.M.; Gwyther, D.E.; Gardner, A.S.; Blankenship, D.D. The Climate Data Toolbox for MATLAB. Geochem. Geophys. Geosystems 2019, 20, 3774–3781. [Google Scholar] [CrossRef]
- Spearman’s Correlation. Available online: http://www.statstutor.ac.uk/resources/uploaded/spearmans.pdf (accessed on 2 April 2024).
- Domínguez-Tuda, M.; Gutiérrez-Jurado, H.A. Global Analysis of the Hydrologic Sensitivity to Climate Variability. J. Hydrol. 2021, 603, 126720. [Google Scholar] [CrossRef]
- Andréassian, V.; Coron, L.; Lerat, J.; Le Moine, N. Climate Elasticity of Streamflow Revisited—An Elasticity Index Based on Long-Term Hydrometeorological Records. Hydrol. Earth Syst. Sci. 2016, 20, 4503–4524. [Google Scholar] [CrossRef]
- Elsner, M.M.; Cuo, L.; Voisin, N.; Deems, J.S.; Hamlet, A.F.; Vano, J.A.; Mickelson, K.E.B.; Lee, S.Y.; Lettenmaier, D.P. Implications of 21st Century Climate Change for the Hydrology of Washington State. Clim. Change 2010, 102, 225–260. [Google Scholar] [CrossRef]
- López-Moreno, J.I.; Gascoin, S.; Herrero, J.; Sproles, E.A.; Pons, M.; Alonso-González, E.; Hanich, L.; Boudhar, A.; Musselman, K.N.; Molotch, N.P.; et al. Different Sensitivities of Snowpacks to Warming in Mediterranean Climate Mountain Areas. Environ. Res. Lett. 2017, 12, 074006. [Google Scholar] [CrossRef]
- Eythorsson, D.; Gardarsson, S.M.; Nijssen, B. Projected Changes to Northern Hemisphere Snow Conditions over the Period 1950–2100, given Two Emission Scenarios. Remote Sens. Appl. Soc. Environ. 2023, 30, 100954. [Google Scholar] [CrossRef]
- Harpold, A.A.; Kaplan, M.L.; Zion Klos, P.; Link, T.; McNamara, J.P.; Rajagopal, S.; Schumer, R.; Steele, C.M. Rain or Snow: Hydrologic Processes, Observations, Prediction, and Research Needs. Hydrol. Earth Syst. Sci. 2017, 21, 1–22. [Google Scholar] [CrossRef]
- Newton, B.W.; Farjad, B.; Orwin, J.F. Spatial and Temporal Shifts in Historic and Future Temperature and Precipitation Patterns Related to Snow Accumulation and Melt Regimes in Alberta, Canada. Water 2021, 13, 1013. [Google Scholar] [CrossRef]
- Ford, C.M.; Kendall, A.D.; Hyndman, D.W. Effects of shifting snowmelt regimes on the hydrology of non-alpine temperate landscapes. J. Hydrol. 2020, 590, 125517. [Google Scholar] [CrossRef]
- Liu, G. Deriving Snow Cloud Characteristics from CloudSat Observations. J. Geophys. Res. Atmos. 2009, 114, 1–13. [Google Scholar] [CrossRef]
- Pons, F.M.E.; Faranda, D. Statistical Reconstruction of European Winter Snowfall in Reanalysis and Climate Models Based on Air Temperature and Total Precipitation. Adv. Stat. Climatol. Meteorol. Oceanogr. 2022, 8, 155–186. [Google Scholar] [CrossRef]
Figure 1.
Flowchart of the research procedure.

Figure 2.
(a) Geographic location of the study area and (b) location of the synoptic weather stations.
Figure 2.
(a) Geographic location of the study area and (b) location of the synoptic weather stations.

Figure 3.
(a) Relationship between multi-year mean snow fraction values at stations (Sf-station) and those produced via the threshold approach (Sf-threshold); (b) corrected relationship between Sf-station data and Sf-corrected data; and (c) relationship between snow fraction trend rates at stations (ΔSf-station) and those derived from corrected data (ΔSf-from corrected).

Figure 4.
(a) Climatic pattern of the snow fraction and (b) the trend rate for the 6-month cold season (NDJFMA) in the multi-year period of 1981 to 2020. Black hatches indicate locations at which the trend rate is statistically significant at α = 0.05 according to the MK test.
Figure 4.
(a) Climatic pattern of the snow fraction and (b) the trend rate for the 6-month cold season (NDJFMA) in the multi-year period of 1981 to 2020. Black hatches indicate locations at which the trend rate is statistically significant at α = 0.05 according to the MK test.

Figure 5.
(a) Climatic pattern of air temperature and (b) the trend rate within the 6-month cold season (NDJFMA) in the multiyear period of 1981 to 2020. Black hatches indicate locations where the temperature trend is statistically significant at α = 0.05, according to the MK test.
Figure 5.
(a) Climatic pattern of air temperature and (b) the trend rate within the 6-month cold season (NDJFMA) in the multiyear period of 1981 to 2020. Black hatches indicate locations where the temperature trend is statistically significant at α = 0.05, according to the MK test.

Figure 6.
(a) Spearman’s correlation coefficient () calculated between time series of air temperature and snow fraction values in the cold seasons (NDJFMA) of the multi-year period from 1981 to 2020; (b) snow fraction sensitivity index.
Figure 6.
(a) Spearman’s correlation coefficient () calculated between time series of air temperature and snow fraction values in the cold seasons (NDJFMA) of the multi-year period from 1981 to 2020; (b) snow fraction sensitivity index.

Figure 7.
(a) Mean snow fractions in 1981–2020; (b) predicted changes from 2020 to the middle of the 21st century according to scenario 1; (c) mean snow fraction for 2011–2020; and (d) predicted changes from 2020 to the middle of the 21st century, according to scenario 2. The Sf values can be divided into those indicating transient and snow-dominated conditions.


Table 1.
Location and elevation of synoptic weather stations used for the validation of snow fraction data.
Table 1.
Location and elevation of synoptic weather stations used for the validation of snow fraction data.
| No | Station | Longitude (°E) | Latitude (°N) | Elevation m a.s.l. | No | Station | Longitude (°E) | Latitude (°N) | Elevation m a.s.l. |
|---|---|---|---|---|---|---|---|---|---|
| 1 | Białystok | 23°10′ | 53°06′ | 148 | 22 | Łódź | 19°23′ | 51°43′ | 174 |
| 2 | Bielsko-Biała | 19°00′ | 49°48 | 396 | 23 | Mława | 20°22′ | 53°06′ | 147 |
| 3 | Chojnice | 17°32′ | 53°43′ | 164 | 24 | Nowy Sącz | 20°41′ | 49°38′ | 292 |
| 4 | Częstochowa | 19°05′ | 50°49′ | 293 | 25 | Opole | 17°58′ | 50°38′ | 163 |
| 5 | Elbląg | 19°33′ | 54°13′ | 189 | 26 | Piła | 16°45′ | 53°08′ | 72 |
| 6 | Gorzów Wlk. | 15°17′ | 52°44′ | 71 | 27 | Poznań | 16°50′ | 52°25′ | 88 |
| 7 | Hel | 18°49′ | 54°36′ | 1 | 28 | Rzeszów | 22°03′ | 50°07′ | 206 |
| 8 | Jelenia Góra | 15°47′ | 50°54′ | 342 | 29 | Sandomierz | 21°42′ | 50°41′ | 217 |
| 9 | Kalisz | 18°05′ | 51°47′ | 137 | 30 | Siedlce | 22°15′ | 52°11′ | 152 |
| 10 | Kasprowy W. | 19°59′ | 49°14′ | 1990 | 31 | Słubice | 14°37′ | 52°21′ | 53 |
| 11 | Katowice | 19°02′ | 50°14′ | 278 | 32 | Suwałki | 22°57′ | 54°08′ | 184 |
| 12 | Kętrzyn | 21°22’ | 54°04′ | 107 | 33 | Szczecin | 14°37′ | 53°24′ | 1 |
| 13 | Kielce | 20°42′ | 50°49′ | 260 | 34 | Śnieżka | 15°44′ | 50°44′ | 1603 |
| 14 | Kłodzko | 16°37′ | 50°26′ | 356 | 35 | Świnoujście | 14°15′ | 53°55′ | 4 |
| 15 | Kołobrzeg | 15°23′ | 54°10′ | 4 | 36 | Terespol | 23°37′ | 52°05′ | 133 |
| 16 | Koszalin | 16°09′ | 54°12′ | 33 | 37 | Toruń | 18°36′ | 53°03′ | 69 |
| 17 | Kozienice | 21°33′ | 51°34′ | 123 | 38 | Ustka | 16°51′ | 54°35′ | 3 |
| 18 | Kraków | 19°48′ | 50°05′ | 236 | 39 | Warszawa | 20°58′ | 52°10′ | 106 |
| 19 | Lesko | 22°21′ | 49°28′ | 420 | 40 | Wrocław | 16°54′ | 51°06′ | 120 |
| 20 | Lublin | 22°24′ | 51°13′ | 238 | 41 | Zakopane | 19°58′ | 49°18′ | 852 |
| 21 | Łeba | 17°32′ | 54°45′ | 1 | 42 | Zielona G. | 15°31′ | 51°56′ | 192 |
Table 2.
Percentage of the country’s area covered by rain-dominated, transient, and snow-dominated areas in the past and in the future (i.e., by the 2050s) in scenarios 1 and 2.
Table 2.
Percentage of the country’s area covered by rain-dominated, transient, and snow-dominated areas in the past and in the future (i.e., by the 2050s) in scenarios 1 and 2.
| Snow Fraction, Sf (%) | 1981–2020 Area (%) | Scenario 1 2050 Area (%) | 2011–2020 Area (%) | Scenario 2 2050 Area (%) |
|---|---|---|---|---|
| 0–10 (rain-dominated) | 0 | 0 | 0 | 0 |
| 11–40 (transient) | 14 | 70 | 52 | 94 |
| 41–100 (snow-dominated) | 86 | 30 | 48 | 6 |
Disclaimer/Publisher’s Note: The statements, opinions and data contained in all publications are solely those of the individual author(s) and contributor(s) and not of MDPI and/or the editor(s). MDPI and/or the editor(s) disclaim responsibility for any injury to people or property resulting from any ideas, methods, instructions or products referred to in the content. |
© 2024 by the author. Licensee MDPI, Basel, Switzerland. This article is an open access article distributed under the terms and conditions of the Creative Commons Attribution (CC BY) license (https://creativecommons.org/licenses/by/4.0/).
Share and Cite
MDPI and ACS Style
Somorowska, U. Assessing the Impact of Climate Change on Snowfall Conditions in Poland Based on the Snow Fraction Sensitivity Index. Resources 2024, 13, 60. https://doi.org/10.3390/resources13050060
AMA Style
Somorowska U. Assessing the Impact of Climate Change on Snowfall Conditions in Poland Based on the Snow Fraction Sensitivity Index. Resources. 2024; 13(5):60. https://doi.org/10.3390/resources13050060
Chicago/Turabian StyleSomorowska, Urszula. 2024. "Assessing the Impact of Climate Change on Snowfall Conditions in Poland Based on the Snow Fraction Sensitivity Index" Resources 13, no. 5: 60. https://doi.org/10.3390/resources13050060
Note that from the first issue of 2016, this journal uses article numbers instead of page numbers. See further details here.